Embed Size (px)
Citation preview

Gonzalo Arredondo Shane Underwood, PhD
Graduate Research Assistant Kamil Kaloush, PhDArizona State University
Arizona Pavements and Materials ConferenceNovember 2017

CoP Sustainability Program
• Phase I: Preliminary Study
• Phase II: Field Study
2This Photo by Unknown Author is licensed under CC BY-SA
RAP

Sustainability Benefits:
According to NAPA:
50 million cubic yards of landfill saved per year
More than 74.2 million tons of RAP used
Reduced 21 million barrels of asphalt binder and 70.5 million tons
of aggregate (2015)
$2.6 billion saved compared to raw materials cost
Average RAP% used in mixes increased from 15.6% (2009) to
20.4% (2014)
According to ADOT:
12% of HMA produced with 15 % RAP in Phoenix area (2010-2016)
Binder savings $3 to $5 per ton on HMA
Aggregate savings $1 to $3 per ton
$3.9 million dollars savings during first year, over $55 million since
2009
“Recycle” by Unknown Author is licensed under CC BY-SA
“Save money” by Unknown Author is licensed under CC BY-SA 3

1. SurveyAgency
Asphalt Concrete Unbound
BaseOther
Surface Non-Surface
City of Phoenix X1 X
City of Tucson X X X
Arizona Department of Transportation (ADOT) X X X X
Maricopa Association of Governments (MAG) X X X X
Pima Association of Governments (PAG) X X X
Maricopa County Dept. of Transportation (MCDOT) X X2 X
Pima County Dept. of Transportation (PCDOT) X X X X
East Valley Asphalt Committee (EVAC) X X
Apache Junction X X
Mesa X X X
Gilbert
Queen Creek X X
Las Vegas (Nevada) X X X X
Nevada Department of Transportation (NDOT) X X X X
Texas Department of Transportation (TxDOT) X X X X
New Mexico Department of Transportation
(NMDOT) X X X X
California Department of Transportation (Caltrans) X X X X
1 Only with the City of Phoenix Lab approval.2 Only for minor collectors or local roads. Arterial streets not exceed 20% and 30% for collectors. 4
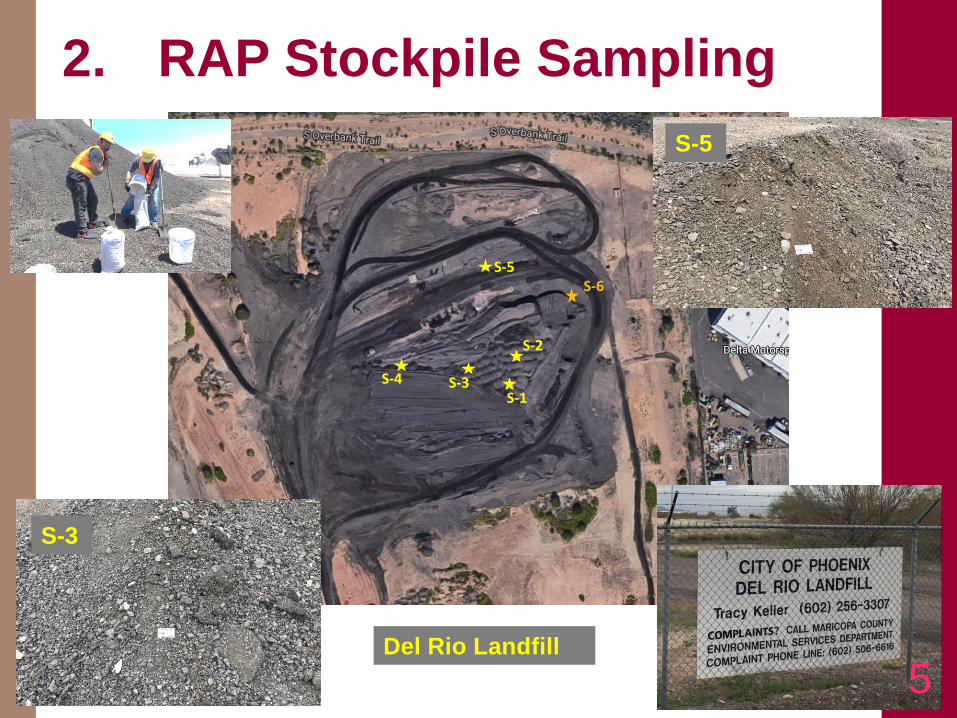
2. RAP Stockpile Sampling
S-5
S-1
S-2
S-3S-4
S-6
S-3
S-5
Del Rio Landfill
5

RAP from Southwest Asphalt Plant – El Mirage
• On the approved City of
Phoenix list
• Processed RAP material
• Possible use on future paving
projects for the City 6

Asphalt Content
Extraction: AASHTO T164/ASTM D2172 Quantitative Extraction of Asphalt Binder from Hot Mix
Asphalt (HMA)(trichloroethylene, n-propyl bromide or methylene chloride)
Recovery: ASTM D5404 Recovery of Asphalt from Solution Using the Rotary Evaporator
0
1
2
3
4
5
6
7
S-1 S-3 S-4 S-5 SW-1
Asphalt c
onte
nt
(%)
Sample
7Photo by Unknown Author is licensed under CC BY-SA
Sample
Asphalt
content
(%)
S-1 4.88
S-3 5.25
S-4 6.26
S-5 4.83
SW-1 3.82
Maximum (%) 6.26
Average (%) 5.01
Minimum (%) 3.82
Stand. Dev.(%) 0.79
NCHRP: Asphalt content maximum Std. Dev. = 0.5%
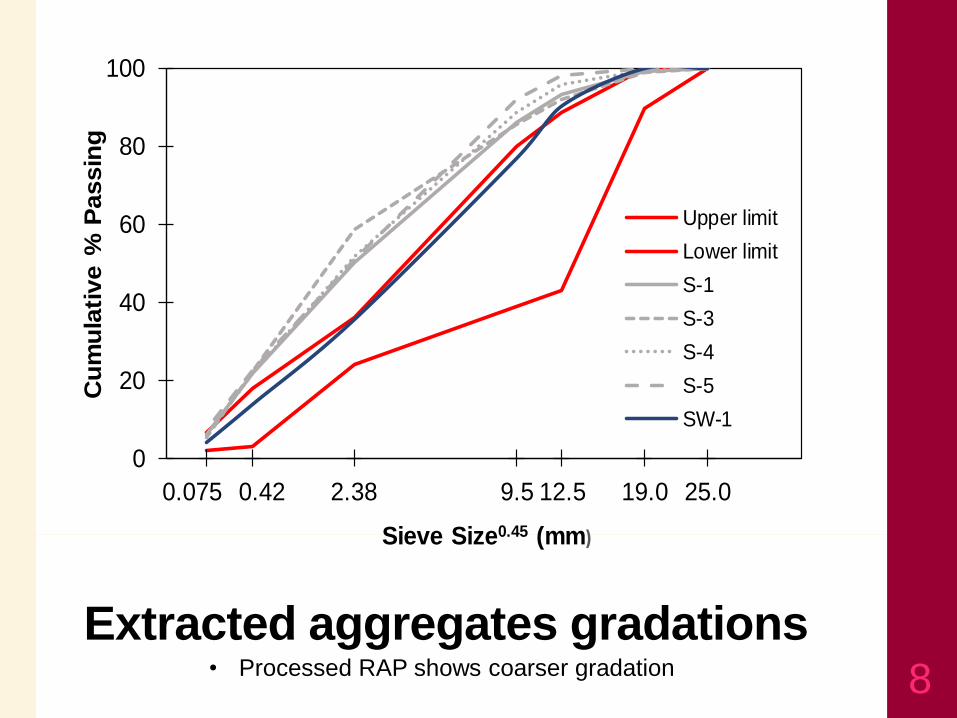
Extracted aggregates gradations• Processed RAP shows coarser gradation 8
25.019.012.59.52.380.420.075
0
20
40
60
80
100C
um
ula
tive %
Passin
g
Sieve Size0.45 (mm)
Upper limit
Lower limit
S-1
S-3
S-4
S-5
SW-1

Statistical MeasuresExtracted aggregates gradation
(Del Rio Landfill and Southwest Asphalt)
• Landfill unprocessed RAP shows less variability compared with including
processed RAP
• Reasonable variability between samples
Landfill only
Sieve
size
Average
cumulative
% passing
Maximum
%
Passing
Minimum
%
Passing
Standard
Deviation
(%)
CV (%)
Standard
Deviation
(%)
CV (%)
1 in 100 100 100 0.0 0.0 0.0 0.0
3/4 in. 100 100 99 0.4 0.4 0.4 0.4
1/2 in. 94 98 91 3.1 3.3 2.7 2.9
3/8 in. 86 92 77 5.6 6.5 3.0 3.4
#4 66 72 51 8.3 12.7 2.4 3.4
#8 49 58 36 8.4 16.9 3.8 7.3
#30 26 29 18 4.6 17.9 1.0 3.5
#40 20 22 14 3.8 18.5 0.3 1.3
#50 16 18 11 3.1 19.3 0.8 4.8
#100 10 12 7 2.0 21.0 1.2 11.9
#200 6 7 4 1.3 23.2 1.0 16.0
9
NCHRP: Passing #8 maximum Std. Dev. = 5.0%
Passing #200 maximum Std. Dev. = 1.5%

Extracted Binder Characterization
• Very stiff recovered binders
Binder tests:
• RTFO
• PAV
• DSR
• BBR
10

Performance Grade of Extracted Binders
SampleExtracted PG
Grade
Standard
Stockpile 1 124 + 26
Stockpile 3 112 + 14
Stockpile 4 118 + 14
Stockpile 5 130 + 26
Stockpile SW1 112 + 14
11
In Phoenix, a PG 70-10 is a typical virgin binder.

Standard Specification for Superpave Volumetric Mix Design, AASHTO M 323-13
• Table 2—Binder Selection Guidelines for Reclaimed Asphalt Pavement (RAP) Mixtures
Recommended Virgin Asphalt Binder Grade RAP %
No change in binder selection <15
Select virgin binder one grade softer than normal (e.g.,
select a PG 58-28 if a PG 64-22 would normally be
used
15 to 25
Follow recommendations from blending charts >25
In consensus with COP it was decided to use 10% and 15% RAP
contents considering PG 70-10 typical virgin binder.
12

PredictedPerformance Grade change of virgin PG 70 - 10 binder by blending with the extracted binders
(based on NCHRP approach)
Stockpile Extracted
binder
RAP % Blended
binder
S-1 128.6 + 20.4
10 PG 70 – 4
15 PG 76 – 4
20 PG 76 + 2
S-3115.7 + 10.2
10 PG 70 – 4
15 PG 76 – 4
20 PG 76 – 4
S-4119.0 + 8.20
10 PG 70 – 4
15 PG 76 – 4
20 PG 76 – 4
S-5130.8 + 22.3
10 PG 76 – 4
15 PG 76 – 4
20 PG 82 + 2
SW1 112.5 + 11.3
10 PG 70 – 4
15 PG 76 – 4
20 PG 76 – 4
13

3. Mix Design Procedure
Guidelines for Mix Design:
Gyratory mix design criteria of CoP
Superpave mix design method
3/4” Base course mix
Low traffic (0.3 to less than 3 million of 20-year ESALs)
Three mixes: Control (0% RAP), 10% RAP and 15% RAP
Virgin binder PG 70-10
RAP incorporation based on national and local practices.
Sample fabrication (at least 3 replicates for each test)
15

Mix Design Volumetric Information
Mix Property COP Criteria 0% 10% 15% Specifications3/4" Mix
Asphalt Binder (%) 5.02 5.17 5.37
Air Voids (%) 4.0+/-0.2 4.00 4.00 4.00
VMA (%) 13 min. 14.76 14.05 13.45 Pass
VFA (%) 65 - 78 72.59 71.63 70.33 Pass
Absorbed Asphalt (%) 0 - 1.0 0.40 0.32 0.30 Pass
Dust Proportion 0.6 - 1.4 1.03 0.99 0.94 Pass
%Gmm @ Nini = 7 less than 90.5 89.42 89.33 89.34 Pass
%Gmm @ Nmax = 115 less than 98 97.01 96.94 96.94 Pass
Eff. Asphalt content (%) 4.64 4.87 5.08
P0.075 4.80 4.80 4.80
Total Binder (%) 5.02 5.17 5.37 (by weight of total mix)
Added Virgin Binder (%) 5.02 4.80 4.82 (by weight of total mix)
Contributed RAP Binder (%) 0.00 0.37 0.55 (by weight of total mix)
Gmm 2.458 2.452 2.445
Gsb 2.629 2.634 2.635
16

4. Laboratory Testing and Evaluation
Performance evaluation:
Dynamic Modulus (E*): Stiffness of the material. Fundamental property for pavement design (temperature and frequency).
Flow Number (FN): to evaluate the resistance to rutting of the asphalt mix.
Tensile Strength Ratio (TSR): to measure the degree of susceptibility to moisture damage.
[+ cracking potential]
17

Dynamic modulus (E*)
• AASHTO TP 62
• Primary material parameter for MEPDG
• Stiffness
• Sinusoidal repetitive load
• Reduced temperature set:
-10, 4.4, 21.1, 37.8 and 54.4 °C.
• For 6 frequencies: 25, 10, 5, 1, 0.5 and 0.1 Hz.
• 3 replicates for each RAP content
18

Dynamic modulus (E*) 19

Dynamic modulus (E*) for different temperatures and 10 Hz frequency
20

ANOVA and t-Test Analysison Dynamic Modulus
Frequency
(Hz)
Temperatures (°C)
14 40 70 100 130
25 NS NS NS NS NS
10 NS NS NS NS NS
5 NS NS NS NS NS
1 NS NS NS NS NS
0.5 NS NS NS NS NS
0.1 NS NS NS NS NS
NS= Not Statistically Significant S= Statistically Significant
Comparing three mixes:Frequency
(Hz)Mix
Temperatures (°C)
14 40 70 100 130
25
0% to 10% CNR CNR CNR CNR CNR
0% to 15% CNR CNR CNR CNR CNR
10% to 15% CNR CNR CNR CNR CNR
10
0% to 10% CNR CNR CNR CNR CNR
0% to 15% CNR CNR CNR CNR CNR
10% to 15% CNR CNR CNR CNR CNR
5
0% to 10% CNR CNR CNR CNR CNR
0% to 15% CNR CNR CNR CNR CNR
10% to 15% CNR CNR CNR CNR CNR
1
0% to 10% CNR CNR CNR CNR CNR
0% to 15% CNR CNR CNR R CNR
10% to 15% CNR CNR R CNR CNR
0.5
0% to 10% CNR CNR CNR CNR CNR
0% to 15% CNR CNR CNR R CNR
10% to 15% CNR CNR CNR CNR CNR
0.1
0% to 10% CNR CNR CNR CNR CNR
0% to 15% CNR CNR CNR R CNR
10% to 15% CNR CNR CNR CNR CNR
R= Reject H0 CNR= Cannot reject H0
Comparing two mixes at a time:
• 0%, 10% and 15% RAP mixes
are not statistically different.
• Dynamic modulus of 15% RAP
is slightly higher for 100°F
(37.8°C).
21

Flow Number (FN)
• AASHTO TP 79
• A measure of permanent deformation in HMA mixes, correlates with rutting potential
• Haversine pulse load
• Describes the cycle number at which tertiary flow begins
• Testing temperature: 122°F (50°C)
• 3 replicates for each RAP content
22

Flow Number (FN)
0
500
1000
1500
2000
2500
0% 10% 15%
Flo
w N
um
ber
(Cycle
s)
RAP (%)
Mixture
Flow Number
(Cycles)α = 0.05
t-Test
comparing:Average CV(%) ANOVA
t-Test
one-tail
t-Test
two-tail
0% 1452 39.7
NS
CNR CNR 0% to 10%
10% 1732 21.3 CNR CNR 0% to 15%
15% 2106 37.8 CNR CNR 10% to 15%
ANOVA: NS= Not Statistically Significant S= Statistically Significantt-TEST: R= Reject H0 CNR= Cannot reject H0
23
Rodezno’s rutting prediction model:
R = 0.0038*FN-0.242 *ESALs0.485 *h-1.021
Mixture FN ESALs
Pavement
Thickness
(in)
Rutting
(in) (mm)
0% 1452 3,000,000 3 0.29 7.5
10% 1732 3,000,000 3 0.28 7.2
15% 2106 3,000,000 3 0.27 6.8
• Slight increase in performance as RAP percent increases.
• No statistical difference between the three mixes.

Tensile Strength Ratio (TSR)
• ASTM D4867
• Ratio of tensile strengths of conditioned to dry specimens
• COP specifies a minimum of 75% TSR
• Conditioned (wet and freeze-thaw cycle)
• Testing temperature: 77°F (25°C)
• Tensile splitting test
• 6 replicates for each RAP content
24

Tensile Strength Ratio (TSR)
Condition Mixture
Tensile Strength (kPa α = 0.05t-Test
comparing:Average CV(%) ANOVAt-Test
one-tail
t-Test
two-tail
Dry
0% 1504 4.2
NS
CNR CNR 0% to 10%
10% 1439 5.2 CNR CNR 0% to 15%
15% 1613 6.4 CNR CNR 10% to 15%
Wet
Freeze-Thaw
0% 1260 2.8
NS
CNR CNR 0% to 10%
10% 1339 6.2 CNR CNR 0% to 15%
15% 1427 9.0 CNR CNR 10% to 15%
ANOVA: NS= Not Statistically Significant S= Statistically Significantt-TEST: R= Reject H0 CNR= Cannot reject H0
25• Slight improvement in TSR for RAP mixes compared to control mix.
• No statistical difference between the three mixes.
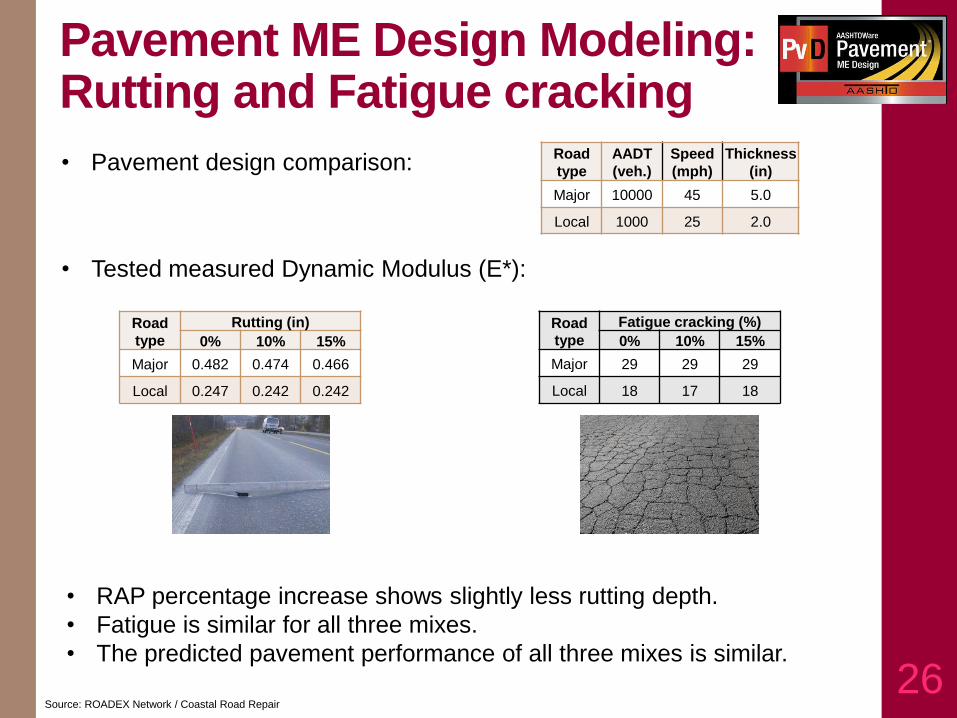
Pavement ME Design Modeling: Rutting and Fatigue cracking
• Pavement design comparison:
26
Road
type
Rutting (in)
0% 10% 15%
Major 0.482 0.474 0.466
Local 0.247 0.242 0.242
Road
type
AADT
(veh.)
Speed
(mph)
Thickness
(in)
Major 10000 45 5.0
Local 1000 25 2.0
• Tested measured Dynamic Modulus (E*):
Road
type
Fatigue cracking (%)
0% 10% 15%
Major 29 29 29
Local 18 17 18
• RAP percentage increase shows slightly less rutting depth.
• Fatigue is similar for all three mixes.
• The predicted pavement performance of all three mixes is similar.
Source: ROADEX Network / Coastal Road Repair

Concluding Remarks• Mixes with RAP show higher stiffness than the control mix
with higher dynamic moduli.
• The increase in RAP percentage show improvement on the pavement resistance to rutting.
• Fatigue cracking (predicted) not affected by low RAP contents.
• RAP mixtures show higher TSR values meaning less susceptible to moisture damage.
• No statistical significant difference in properties measured between the control, 10% and 15% RAP mixtures
• The use of low RAP contents (10% and 15%) has no negative effect on the material properties or pavement performance.
27

Phase II
Construct 3 to 4 pavement sections of conventional and RAP mixtures with different contents.
Sample mixtures to conduct testing program and compare results to conventional mixes.
Conduct field performance evaluation..
28
Control 10% RAP 15% RAP 25% RAP
Test sections


![Boston, MA 02]09 (0t7) 74.2-1580 · Boston, MA 02]09 (0t7) 74.2-1580 PB8 ~o 1 ? 63~. ALTERNATIVE ENVIRONMENTAL MEDIATION STRUCTURES WITHIN THE FEDERAL GOVERNMENT FINAL ... Appendix](https://img.pdfslide.us/doc/110x75/5b7834b97f8b9ade6f8e94c1/boston-ma-0209-0t7-742-1580-boston-ma-0209-0t7-742-1580-pb8-o-1-.jpg)