Embed Size (px)
Citation preview
Page 1 of 10
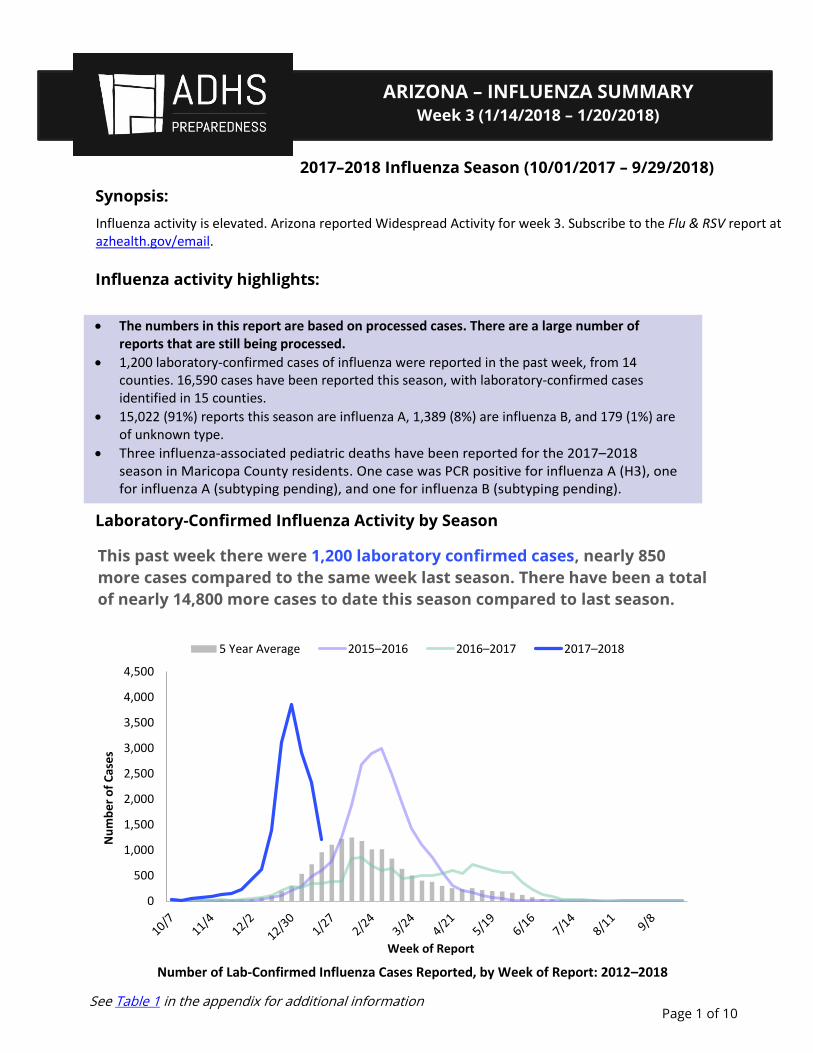
Synopsis:
Influenza activity is elevated. Arizona reported Widespread Activity for week 3. Subscribe to the Flu & RSV report at azhealth.gov/email.
Influenza activity highlights:
Laboratory-Confirmed Influenza Activity by Season
2017–2018 Influenza Season (10/01/2017 – 9/29/2018)
The numbers in this report are based on processed cases. There are a large number of reports that are still being processed.
1,200 laboratory-confirmed cases of influenza were reported in the past week, from 14 counties. 16,590 cases have been reported this season, with laboratory-confirmed cases identified in 15 counties.
15,022 (91%) reports this season are influenza A, 1,389 (8%) are influenza B, and 179 (1%) are of unknown type.
Three influenza-associated pediatric deaths have been reported for the 2017–2018 season in Maricopa County residents. One case was PCR positive for influenza A (H3), one for influenza A (subtyping pending), and one for influenza B (subtyping pending).
ARIZONA – INFLUENZA SUMMARY Week 3 (1/14/2018 – 1/20/2018)
This past week there were 1,200 laboratory confirmed cases, nearly 850
more cases compared to the same week last season. There have been a total
of nearly 14,800 more cases to date this season compared to last season.
Number of Lab-Confirmed Influenza Cases Reported, by Week of Report: 2012–2018
See Table 1 in the appendix for additional information
0
500
1,000
1,500
2,000
2,500
3,000
3,500
4,000
4,500
Nu
mb
er
of
Cas
es
Week of Report
5 Year Average 2015–2016 2016–2017 2017–2018
Number of Lab-Confirmed Influenza Cases Reported, by Week of Report: 2012–2018
Page 2 of 10
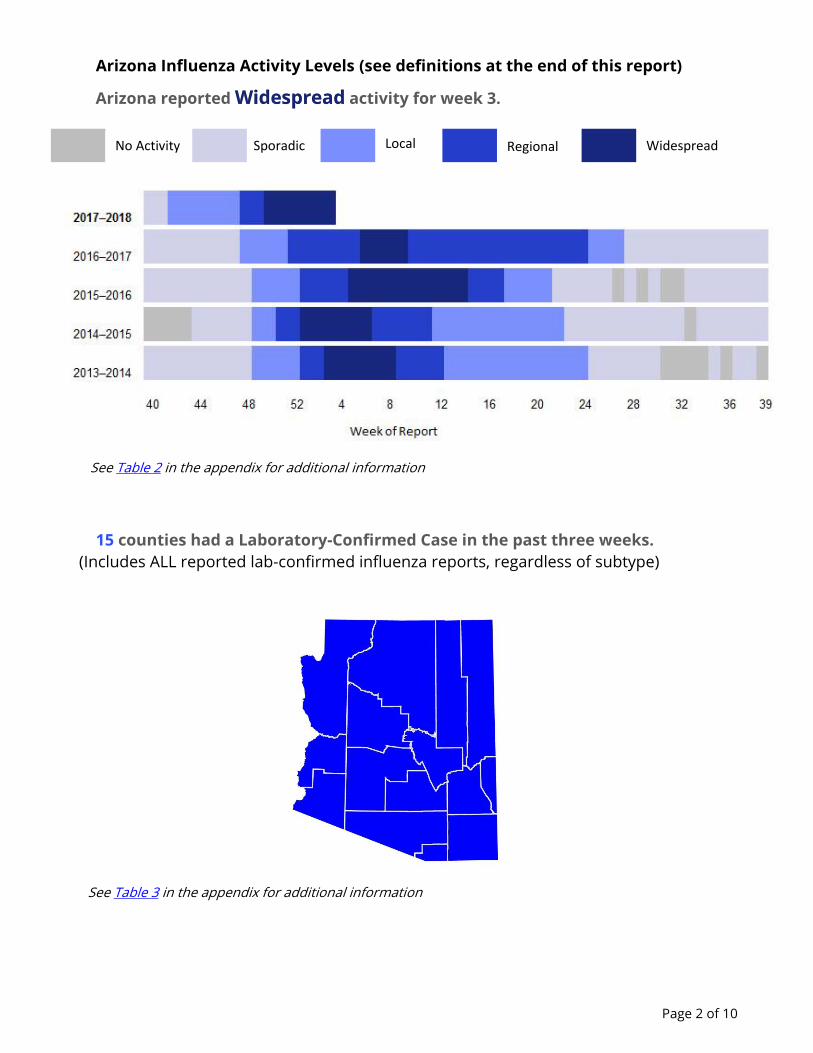
Arizona Influenza Activity Levels (see definitions at the end of this report)
Arizona reported activity for week 3. Widespread
15 counties had a Laboratory-Confirmed Case in the past three weeks. (Includes ALL reported lab-confirmed influenza reports, regardless of subtype)
No Activity Sporadic Local Regional Widespread
See Table 3 in the appendix for additional information
See Table 2 in the appendix for additional information
Arizona Department of Health Services Page 3 of 12
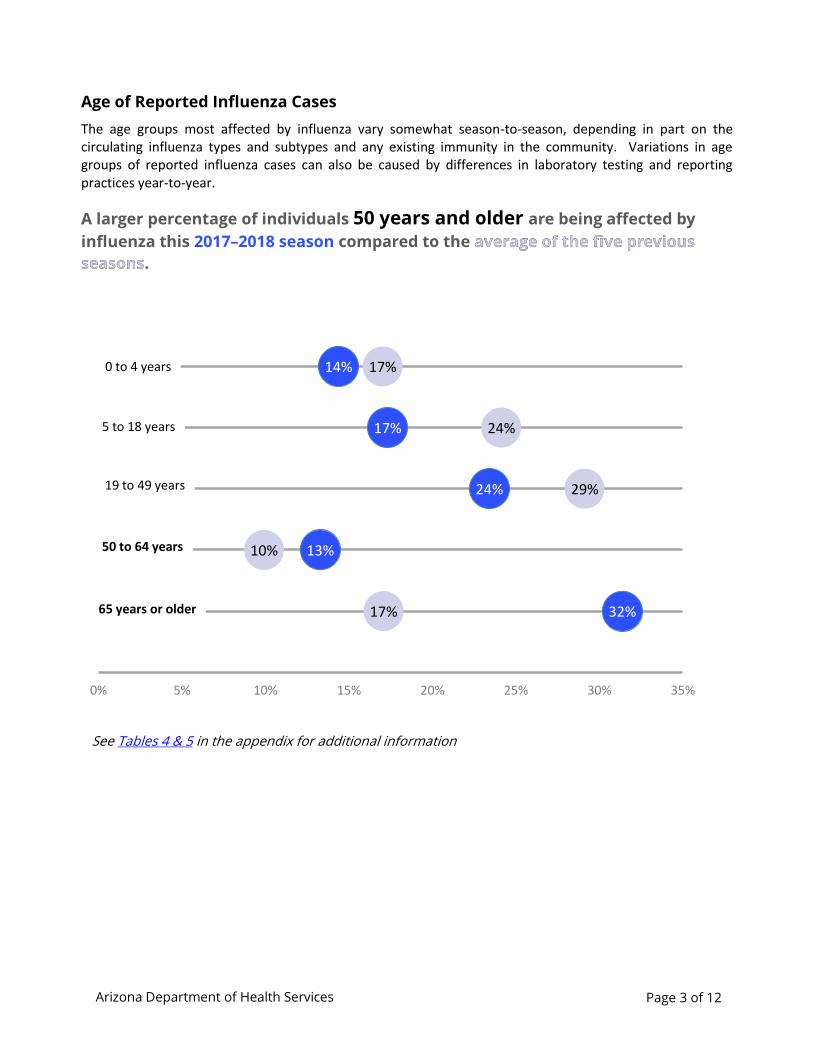
Age of Reported Influenza Cases
The age groups most affected by influenza vary somewhat season-to-season, depending in part on the circulating influenza types and subtypes and any existing immunity in the community. Variations in age groups of reported influenza cases can also be caused by differences in laboratory testing and reporting practices year-to-year.
A larger percentage of individuals 50 years and older are being affected by
influenza this 2017–2018 season compared to the average of the five previous
. seasons
See Tables 4 & 5 in the appendix for additional information
14%
17%
24%
13%
32%
17%
24%
29%
10%
17%
0% 5% 10% 15% 20% 25% 30% 35%
0 to 4 years
5 to 18 years
19 to 49 years
50 to 64 years
65 years or older
Arizona Department of Health Services Page 4 of 12
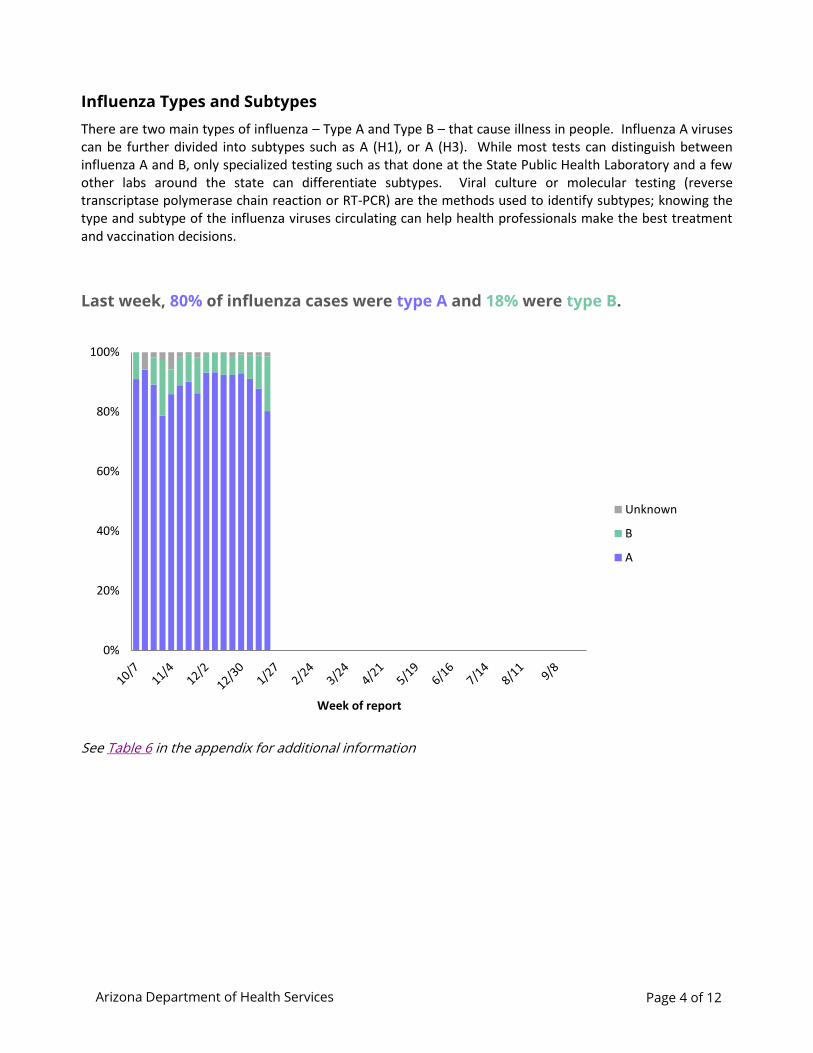
Influenza Types and Subtypes
There are two main types of influenza – Type A and Type B – that cause illness in people. Influenza A viruses can be further divided into subtypes such as A (H1), or A (H3). While most tests can distinguish between influenza A and B, only specialized testing such as that done at the State Public Health Laboratory and a few other labs around the state can differentiate subtypes. Viral culture or molecular testing (reverse transcriptase polymerase chain reaction or RT-PCR) are the methods used to identify subtypes; knowing the type and subtype of the influenza viruses circulating can help health professionals make the best treatment and vaccination decisions.
Last week, 80% of influenza cases were type A and 18% were type B.
See Table 6 in the appendix for additional information
0%
20%
40%
60%
80%
100%
Week of report
Unknown
B
A
Arizona Department of Health Services Page 5 of 12
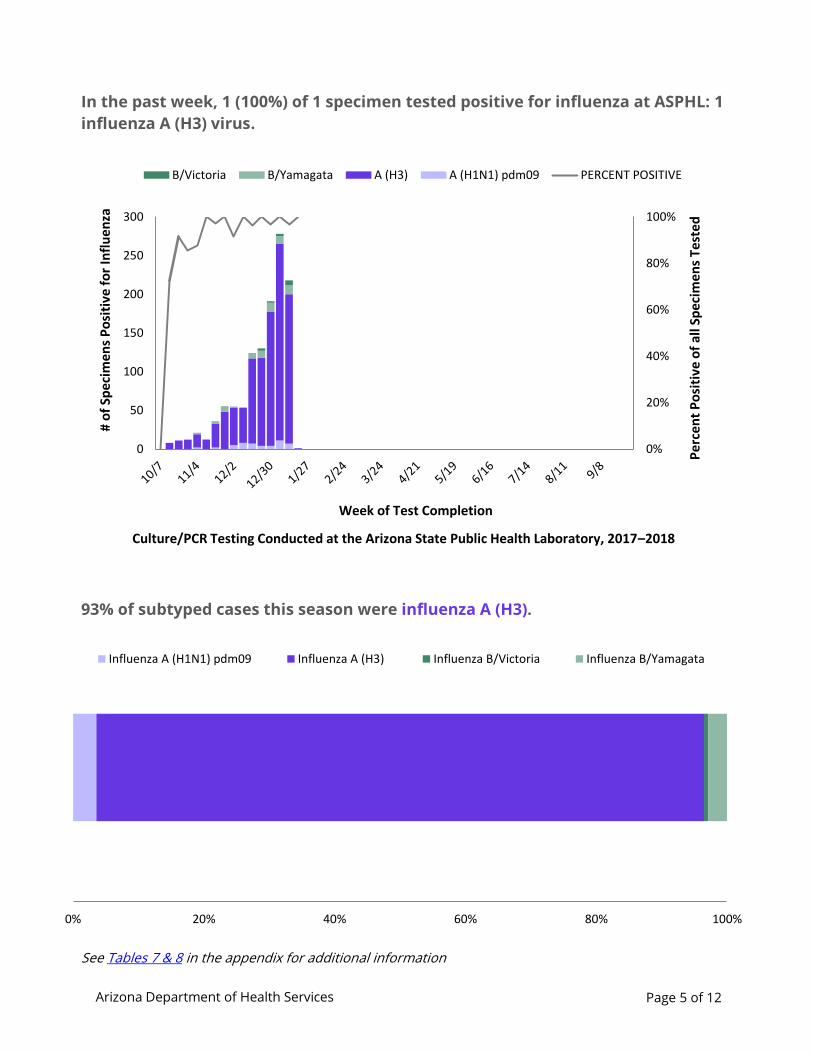
In the past week, 1 (100%) of 1 specimen tested positive for influenza at ASPHL: 1
influenza A (H3) virus.
93% of subtyped cases this season were influenza A (H3).
See Tables 7 & 8 in the appendix for additional information
0% 20% 40% 60% 80% 100%
Influenza A (H1N1) pdm09 Influenza A (H3) Influenza B/Victoria Influenza B/Yamagata
0%
20%
40%
60%
80%
100%
0
50
100
150
200
250
300
Pe
rce
nt
Po
siti
ve o
f al
l Sp
ecim
en
s Te
ste
d
# o
f Sp
eci
me
ns
Po
siti
ve f
or
Infl
uen
za
Week of Test Completion
B/Victoria B/Yamagata A (H3) A (H1N1) pdm09 PERCENT POSITIVE
Culture/PCR Testing Conducted at the Arizona State Public Health Laboratory, 2017–2018
Arizona Department of Health Services Page 6 of 12
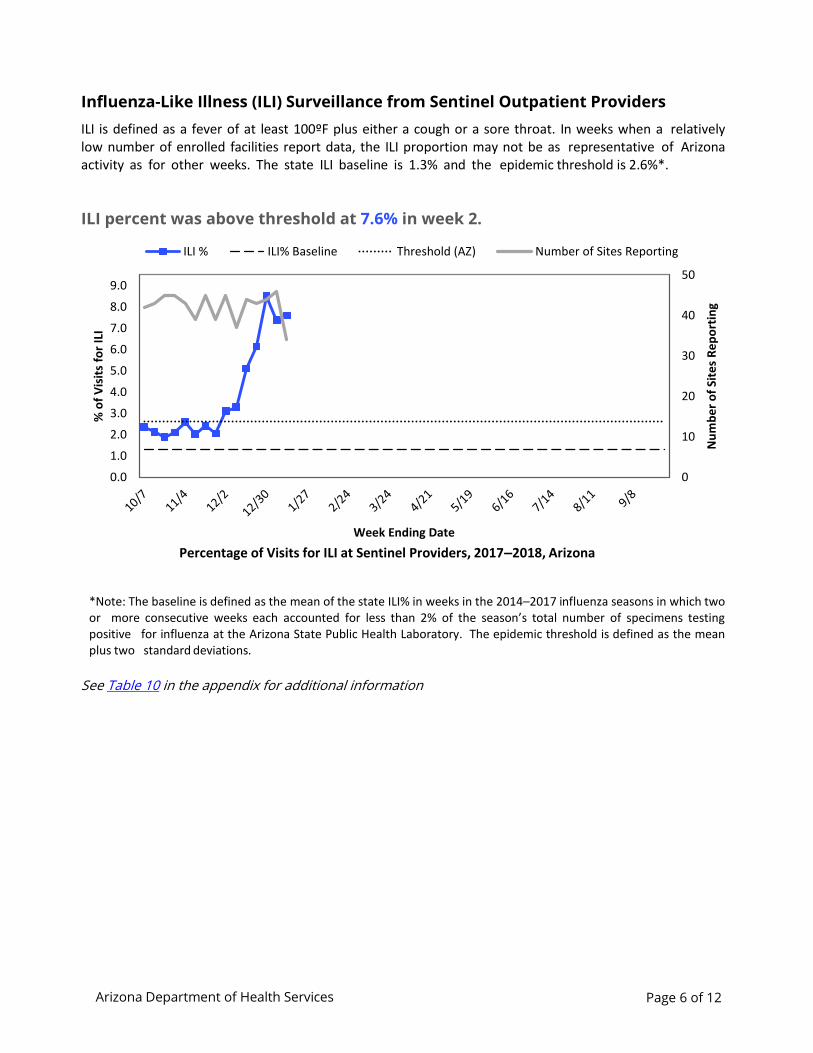
Influenza-Like Illness (ILI) Surveillance from Sentinel Outpatient Providers
ILI is defined as a fever of at least 100ºF plus either a cough or a sore throat. In weeks when a relatively low number of enrolled facilities report data, the ILI proportion may not be as representative of Arizona activity as for other weeks. The state ILI baseline is 1.3% and the epidemic threshold is 2.6%*.
ILI percent was above threshold at 7.6% in week 2.
*Note: The baseline is defined as the mean of the state ILI% in weeks in the 2014–2017 influenza seasons in which two or more consecutive weeks each accounted for less than 2% of the season’s total number of specimens testing positive for influenza at the Arizona State Public Health Laboratory. The epidemic threshold is defined as the mean plus two standard deviations.
See Table 10 in the appendix for additional information
0
10
20
30
40
50
0.0
1.0
2.0
3.0
4.0
5.0
6.0
7.0
8.0
9.0
Nu
mb
er
of
Site
s R
ep
ort
ing
% o
f V
isit
s fo
r IL
I
Week Ending Date
Percentage of Visits for ILI at Sentinel Providers, 2017–2018, Arizona
ILI % ILI% Baseline Threshold (AZ) Number of Sites Reporting
Arizona Department of Health Services Page 7 of 12
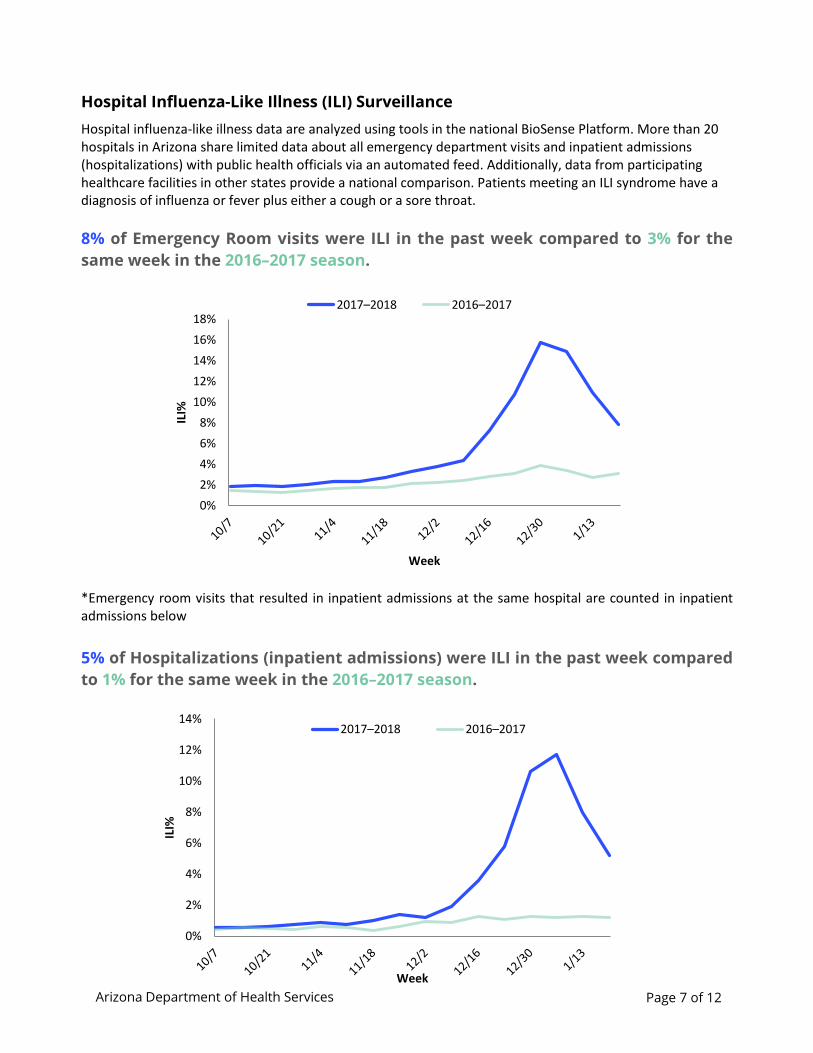
Hospital Influenza-Like Illness (ILI) Surveillance
Hospital influenza-like illness data are analyzed using tools in the national BioSense Platform. More than 20 hospitals in Arizona share limited data about all emergency department visits and inpatient admissions (hospitalizations) with public health officials via an automated feed. Additionally, data from participating healthcare facilities in other states provide a national comparison. Patients meeting an ILI syndrome have a diagnosis of influenza or fever plus either a cough or a sore throat.
8% of Emergency Room visits were ILI in the past week compared to 3% for the
same week in the 2016–2017 season.
*Emergency room visits that resulted in inpatient admissions at the same hospital are counted in inpatient admissions below
5% of Hospitalizations (inpatient admissions) were ILI in the past week compared
to 1% for the same week in the 2016–2017 season.
0%
2%
4%
6%
8%
10%
12%
14%
16%
18%
ILI%
Week
2017–2018 2016–2017
0%
2%
4%
6%
8%
10%
12%
14%
ILI%
Week
2017–2018 2016–2017
Arizona Department of Health Services Page 8 of 12
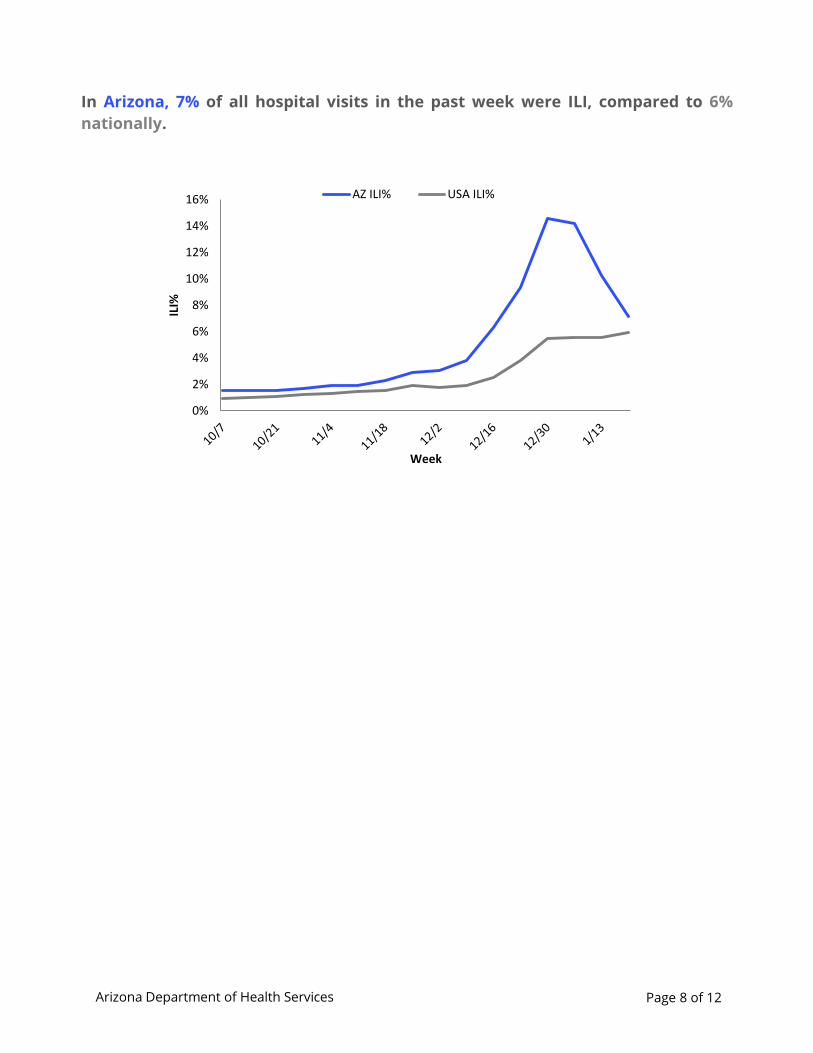
In Arizona, 7% of all hospital visits in the past week were ILI, compared to 6%
nationally.
0%
2%
4%
6%
8%
10%
12%
14%
16%
ILI%
Week
AZ ILI% USA ILI%
Arizona Department of Health Services Page 9 of 12
Appendix
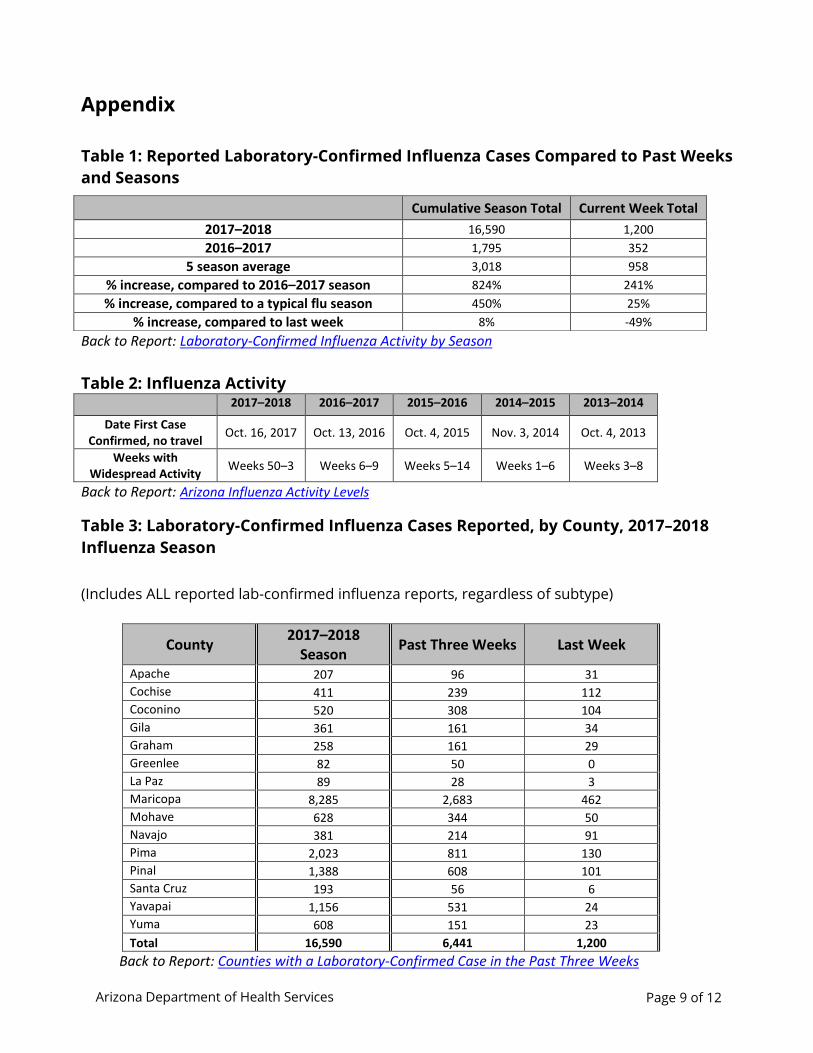
Table 1: Reported Laboratory-Confirmed Influenza Cases Compared to Past Weeks
and Seasons
Back to Report: Laboratory-Confirmed Influenza Activity by Season
Table 2: Influenza Activity
2017–2018 2016–2017 2015–2016 2014–2015 2013–2014
Date First Case Confirmed, no travel
Oct. 16, 2017 Oct. 13, 2016 Oct. 4, 2015 Nov. 3, 2014 Oct. 4, 2013
Weeks with Widespread Activity
Weeks 50–3 Weeks 6–9 Weeks 5–14 Weeks 1–6 Weeks 3–8
Back to Report: Arizona Influenza Activity Levels
Table 3: Laboratory-Confirmed Influenza Cases Reported, by County, 2017–2018
Influenza Season
(Includes ALL reported lab-confirmed influenza reports, regardless of subtype)
County 2017–2018
Season Past Three Weeks Last Week
Apache 207 96 31
Cochise 411 239 112
Coconino 520 308 104
Gila 361 161 34
Graham 258 161 29
Greenlee 82 50 0
La Paz 89 28 3
Maricopa 8,285 2,683 462
Mohave 628 344 50
Navajo 381 214 91
Pima 2,023 811 130
Pinal 1,388 608 101
Santa Cruz 193 56 6
Yavapai 1,156 531 24
Yuma 608 151 23
Total 16,590 6,441 1,200
Back to Report: Counties with a Laboratory-Confirmed Case in the Past Three Weeks
Cumulative Season Total Current Week Total
2017–2018 16,590 1,200
2016–2017 1,795 352
5 season average 3,018 958
% increase, compared to 2016–2017 season 824% 241%
% increase, compared to a typical flu season 450% 25%
% increase, compared to last week 8% -49%
Arizona Department of Health Services Page 10 of 12
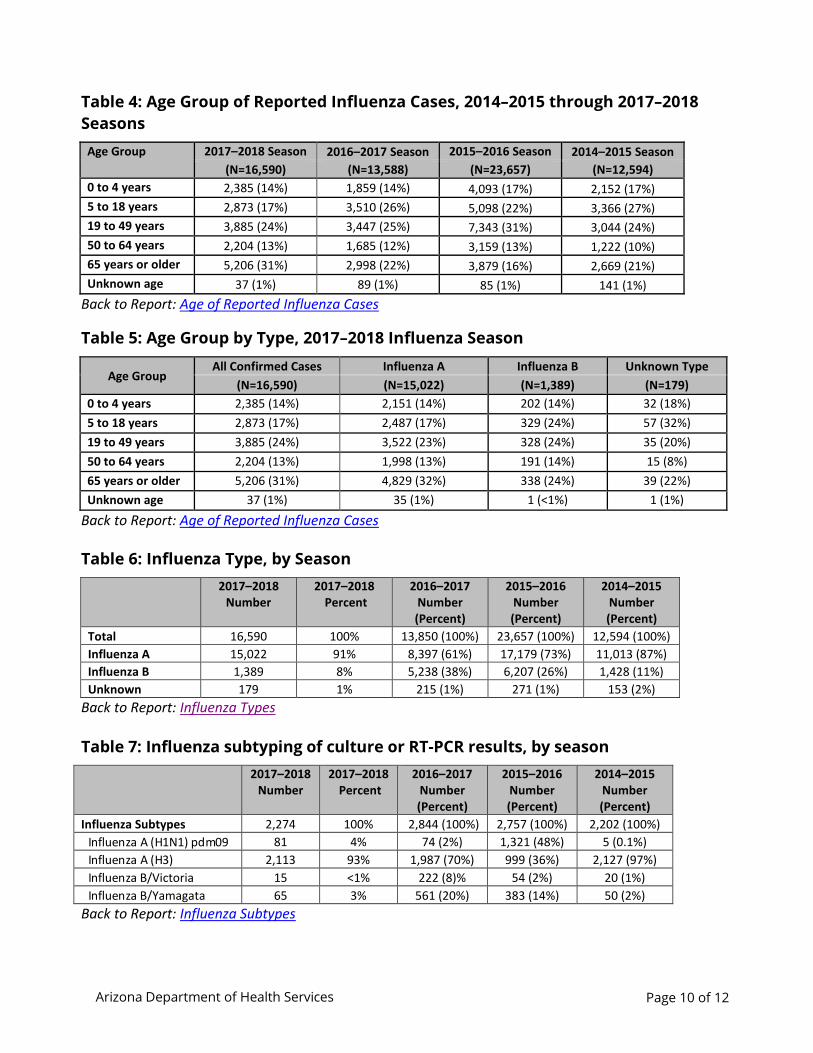
Table 4: Age Group of Reported Influenza Cases, 2014–2015 through 2017–2018
Seasons
Age Group 2017–2018 Season 2016–2017 Season 2015–2016 Season 2014–2015 Season
(N=16,590) (N=13,588) (N=23,657) (N=12,594)
0 to 4 years 2,385 (14%) 1,859 (14%) 4,093 (17%) 2,152 (17%)
5 to 18 years 2,873 (17%) 3,510 (26%) 5,098 (22%) 3,366 (27%)
19 to 49 years 3,885 (24%) 3,447 (25%) 7,343 (31%) 3,044 (24%)
50 to 64 years 2,204 (13%) 1,685 (12%) 3,159 (13%) 1,222 (10%)
65 years or older 5,206 (31%) 2,998 (22%) 3,879 (16%) 2,669 (21%)
Unknown age 37 (1%) 89 (1%) 85 (1%) 141 (1%)
Back to Report: Age of Reported Influenza Cases
Table 5: Age Group by Type, 2017–2018 Influenza Season
Age Group All Confirmed Cases Influenza A Influenza B Unknown Type
(N=16,590) (N=15,022) (N=1,389) (N=179)
0 to 4 years 2,385 (14%) 2,151 (14%) 202 (14%) 32 (18%)
5 to 18 years 2,873 (17%) 2,487 (17%) 329 (24%) 57 (32%)
19 to 49 years 3,885 (24%) 3,522 (23%) 328 (24%) 35 (20%)
50 to 64 years 2,204 (13%) 1,998 (13%) 191 (14%) 15 (8%)
65 years or older 5,206 (31%) 4,829 (32%) 338 (24%) 39 (22%)
Unknown age 37 (1%) 35 (1%) 1 (<1%) 1 (1%)
Back to Report: Age of Reported Influenza Cases
Table 6: Influenza Type, by Season
2017–2018 Number
2017–2018 Percent
2016–2017 Number (Percent)
2015–2016 Number (Percent)
2014–2015 Number (Percent)
Total 16,590 100% 13,850 (100%) 23,657 (100%) 12,594 (100%)
Influenza A 15,022 91% 8,397 (61%) 17,179 (73%) 11,013 (87%)
Influenza B 1,389 8% 5,238 (38%) 6,207 (26%) 1,428 (11%)
Unknown 179 1% 215 (1%) 271 (1%) 153 (2%)
Back to Report: Influenza Types
Table 7: Influenza subtyping of culture or RT-PCR results, by season
2017–2018 Number
2017–2018 Percent
2016–2017 Number (Percent)
2015–2016 Number (Percent)
2014–2015 Number (Percent)
Influenza Subtypes 2,274 100% 2,844 (100%) 2,757 (100%) 2,202 (100%)
Influenza A (H1N1) pdm09 81 4% 74 (2%) 1,321 (48%) 5 (0.1%)
Influenza A (H3) 2,113 93% 1,987 (70%) 999 (36%) 2,127 (97%)
Influenza B/Victoria 15 <1% 222 (8)% 54 (2%) 20 (1%)
Influenza B/Yamagata 65 3% 561 (20%) 383 (14%) 50 (2%)
Back to Report: Influenza Subtypes
Arizona Department of Health Services Page 11 of 12
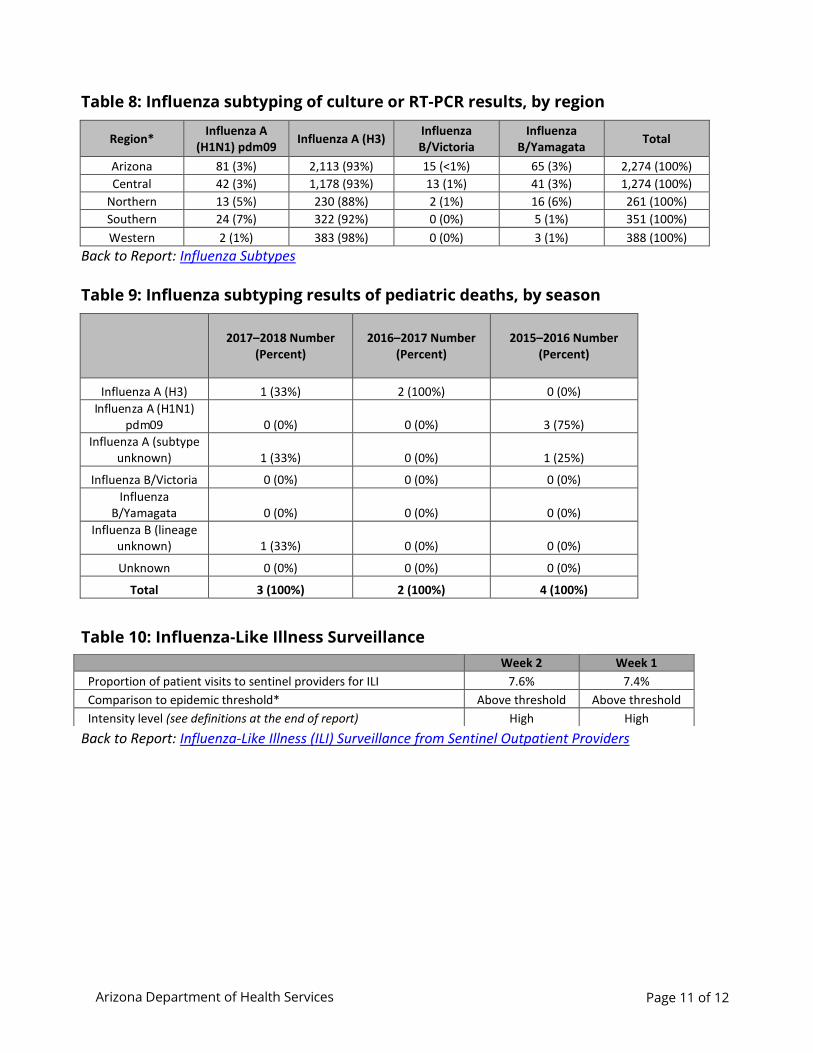
Table 8: Influenza subtyping of culture or RT-PCR results, by region
Region* Influenza A
(H1N1) pdm09 Influenza A (H3)
Influenza B/Victoria
Influenza B/Yamagata
Total
Arizona 81 (3%) 2,113 (93%) 15 (<1%) 65 (3%) 2,274 (100%)
Central 42 (3%) 1,178 (93%) 13 (1%) 41 (3%) 1,274 (100%)
Northern 13 (5%) 230 (88%) 2 (1%) 16 (6%) 261 (100%)
Southern 24 (7%) 322 (92%) 0 (0%) 5 (1%) 351 (100%)
Western 2 (1%) 383 (98%) 0 (0%) 3 (1%) 388 (100%)
Back to Report: Influenza Subtypes
Table 9: Influenza subtyping results of pediatric deaths, by season
2017–2018 Number
(Percent) 2016–2017 Number
(Percent) 2015–2016 Number
(Percent)
Influenza A (H3) 1 (33%) 2 (100%) 0 (0%)
Influenza A (H1N1) pdm09 0 (0%) 0 (0%) 3 (75%)
Influenza A (subtype unknown) 1 (33%) 0 (0%) 1 (25%)
Influenza B/Victoria 0 (0%) 0 (0%) 0 (0%)
Influenza B/Yamagata 0 (0%) 0 (0%) 0 (0%)
Influenza B (lineage unknown) 1 (33%) 0 (0%) 0 (0%)
Unknown 0 (0%) 0 (0%) 0 (0%)
Total 3 (100%) 2 (100%) 4 (100%)
Table 10: Influenza-Like Illness Surveillance
Back to Report: Influenza-Like Illness (ILI) Surveillance from Sentinel Outpatient Providers
Week 2 Week 1
Proportion of patient visits to sentinel providers for ILI 7.6% 7.4%
Comparison to epidemic threshold* Above threshold Above threshold
Intensity level (see definitions at the end of report) High High
Arizona Department of Health Services Page 12 of 12
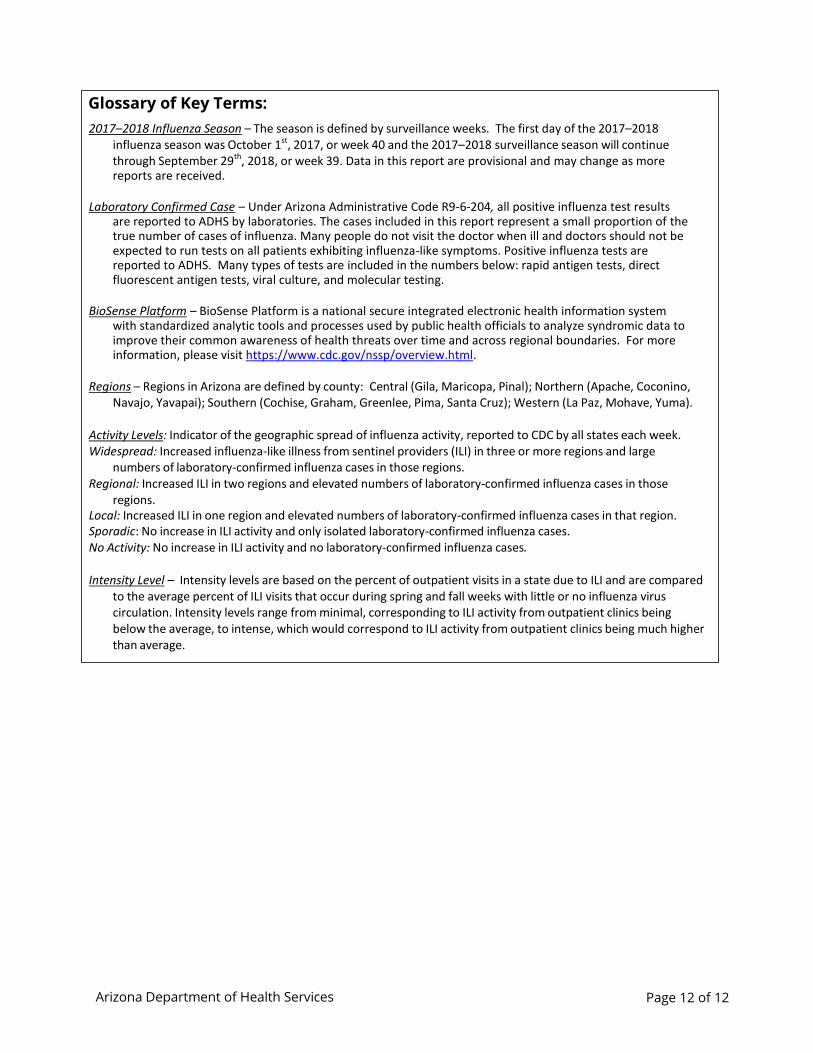
Glossary of Key Terms:
2017–2018 Influenza Season – The season is defined by surveillance weeks. The first day of the 2017–2018 influenza season was October 1st, 2017, or week 40 and the 2017–2018 surveillance season will continue through September 29th, 2018, or week 39. Data in this report are provisional and may change as more reports are received.
Laboratory Confirmed Case – Under Arizona Administrative Code R9-6-204, all positive influenza test results
are reported to ADHS by laboratories. The cases included in this report represent a small proportion of the true number of cases of influenza. Many people do not visit the doctor when ill and doctors should not be expected to run tests on all patients exhibiting influenza-like symptoms. Positive influenza tests are reported to ADHS. Many types of tests are included in the numbers below: rapid antigen tests, direct fluorescent antigen tests, viral culture, and molecular testing.
BioSense Platform – BioSense Platform is a national secure integrated electronic health information system
with standardized analytic tools and processes used by public health officials to analyze syndromic data to improve their common awareness of health threats over time and across regional boundaries. For more information, please visit https://www.cdc.gov/nssp/overview.html.
Regions – Regions in Arizona are defined by county: Central (Gila, Maricopa, Pinal); Northern (Apache, Coconino,
Navajo, Yavapai); Southern (Cochise, Graham, Greenlee, Pima, Santa Cruz); Western (La Paz, Mohave, Yuma).
Activity Levels: Indicator of the geographic spread of influenza activity, reported to CDC by all states each week. Widespread: Increased influenza-like illness from sentinel providers (ILI) in three or more regions and large
numbers of laboratory-confirmed influenza cases in those regions. Regional: Increased ILI in two regions and elevated numbers of laboratory-confirmed influenza cases in those
regions. Local: Increased ILI in one region and elevated numbers of laboratory-confirmed influenza cases in that region. Sporadic: No increase in ILI activity and only isolated laboratory-confirmed influenza cases. No Activity: No increase in ILI activity and no laboratory-confirmed influenza cases.
Intensity Level – Intensity levels are based on the percent of outpatient visits in a state due to ILI and are compared
to the average percent of ILI visits that occur during spring and fall weeks with little or no influenza virus circulation. Intensity levels range from minimal, corresponding to ILI activity from outpatient clinics being below the average, to intense, which would correspond to ILI activity from outpatient clinics being much higher than average.