Embed Size (px)
Citation preview

· "
ARIZONA DEPARTMENT OF MINERAL RESOURCES
Comparison of Taxes of the Six Mining Counties with Taxes of the Eight Agricultural Counties.
Recently the Arizona Department of Mineral Resources published a table comparing the direct State taxes paid by Primary Producing Industries. Now it has been suggested that th~ comparison of State taxes paid by the primary producing industries doesnot give a "sufficiently complete and accurate picture because it does not take into account the City, County and School levies". Therefore another compilation has been made to include these levies.
The suggestion was that the property tax levied by the State is small when compared with the City, County abd School District levy. It was pointed out that in those districts and counties where the principal mines are located, this levy is generally very small. In areas where many farms and ranches ar e located these levies are substantial.
The new table, covering State, County, School and City taxes paid during the last ten years by three primary producing industries, shows that the Mining Industry has paid $412.91 per $10,000 product value, as compared with$249.90 for the Agricultural Industry, and $96.16 for the Livestock Industry. Disregarding the Sales (production) tax, the Mining Industry has paid $329.87 per $10,000 product value. This in spite of the fact that the total tax rate in the mining counties averaged approximately ~~3.00 per $100 valuation, as compared with almost $$.00 per $100 valuation in the other counties.
The chief purpose in showing the first comparison was to find a way to avoid the inequitable methods of evaluating state property which are inherent in the particular property assessed.
Mine evaluation by the Hoskold formula involves the uncertainty of the future price of metals, the future grade of ore to be mined, and the concentrating characteristics of the ore to be mined. These factors cannot be foretold with any degree of accuracy.
Evaluation of crop lands involves similar uncertainties of prices and yield.
Likewise, evaluation of livestock and animal products is beset with indeterminate factors, and in addition the accurate determination of the number of livestock on the ranges is practically impossible to ascertain.
Hence the thought that a production tax on these primary products would be based on the actual record of production, and it was believed such a tax would raise the required revenue for operating the State Government.
If it is still desired to keep the property tax on the State level in order to include much property that would not come under the proposed production tax, t hen, in addition to the proposed production tax on the primary producing industries, a property valuation on the buildings, equipment and materials used in these industries could be assessed on the state level. Such a
- I -

..
valuation could be made on a fair and equitable basis, whereas it is a difficult thing to accomplish when attempting to evaluate the future production capacities of mining claims, cattle ranches, and crop lands. For example, in the mining industry the County Assessors evaluate mining property other than claims or ore bodies, and in the last. five years this proportion has been approximately 20 per cent of the total assessed valuation of all mining property. (See table tlFinal Valuation of all Property Assessed to Producing Nining Propertiestl ). This property would be subject to the normal state property tax.
It seems reasonable to levy a production tax on the revenue of other industries besides mining, such as Agriculture, Livestock, Manufacturing, Railroads and Utilities. Such a tax would lower the property tax levied against all industries and would have the virtue of being equitable and not discriminatory. The mining industry now bears the brunt of the production tax, and in addition pays a property tax like all the rest.
- 2 -

Year
1941 1942 1943 1944 1945
1946 1947 1948 1949 1950
TOTAL
Average
1941 1942 1943 1944 1945
1946 1947 1948 1949 1950
TOTAL
TOTAL STATE, COUNTY, CITY AND SCHOOL TAXES FOR THE
SIX MINING COUNTIES
(Greenlee, Gila, Pima, Pinal, Cochise & Yavapai)
Compiled by: Arizona Department of Mineral Resources from: State 'fax Commission." s Reports
Total State, Net County County, City, Rate per Valuation & School Taxes $100
$ 209,304,586 $ 6,873,204 $ 3.28 223,463,779 5,266,378 2.36 287,071,716 5,734,481 2.00 289,586,963 4,725,650 1.63 280,300,124 6,249,782 2.23
284,336,898 6,051,199 2.13 316,774,769 9,541,899 3.01 354,102,072 12,064,976 3.41 388,142,810 15,849,817 4.08
4.99 39928442084 $ 3,032,927,801 $
192549z749 91,907,135 $ 3.03
$ 303, 292, 7Bo ~ 9,190,714 $ 3.03
TAXES PAID BY MINING INDUSTRY USING ABOVE RATES
Valuation Taxes Paid All Mining Tax Value of Per rp10, 000 ProEertl Rate Taxes .Paid Product Value
95,271,849 3.28 3,124,917 97,638,000 320.05 104,494,743 2.36 2,466,076 114,526,000 215.33 155,758,225 2.00 3,115,165 121,213,000 257.00 159,791,334 1.63 2,604,599 11),095,000 230.30 147,641,656 2.23 3,292,409 95,963,000 343.09
146,397,024 2.13 ),118,257 114,986,000 271.19 168,093,603 3.01 5,059,617 182,753,000 276.86 182,732,534 3.41 6,231,179 196,208,000 317.58 195,070,613 4.08 7,958,881 177,894,000 447,39 1942680z500 4.99 9z7142557 201,034z000 483.23
1,549,932,081 3.01 46, ()85, ()S7 1, 41S,310,000 329.87
Average 154 993,208 3.01 4, ()68,5()6 Production (Sales) Tax Paid on Mining Products
141,531,000 329.87 83.10
Total Tax Paid by Mining Industry per $10,000 value of Product 412.97
... 3 -

~
1941 1942 1943 1944 1945
1946 1947 1948 1949 1950 TOTAL i
'j
Average$
1941 1942 1943 1944 1945
1946 1947 1948 1949 1950 TOTAL
Average
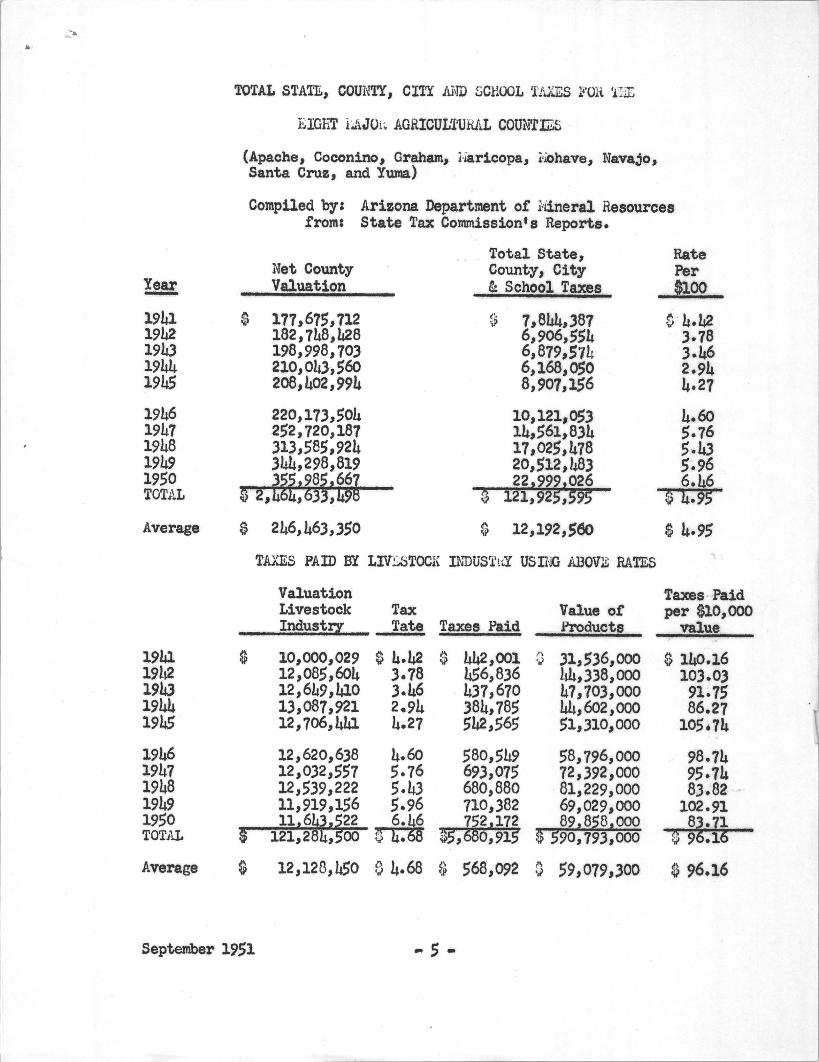
TOTAL STATE, COUNTY, CITY AND S.CHOOL TAXES FOR THE
EIGHT MAJOR AGRICULTURAL COUNTIES
(Apache, Coconino, Graham, Maricopa, Mohave, Navajo, Santa Cruz, and Yuma)
Compiled by: Arizona Department of Mineral Resources from: State Tax Commission's Reports.
Total State, Rate Net County County, City per Valuation & School Taxes $100
$ 177,675,712 $ 7,844,387 $ 4.42 182,748,428 6,906,554 3.78 198,998,703 6,879,574 3.46 210,043,560 6,168,050 2.94 208,402,994 8,907,156 4.27
220,173,504 10,121,053 4.60 252,720,187 14,561,834 5.76 313,585,924 17,025,478 5.43 344,298,819 20,512,483 5.96 355z985 z661 22z999z026 6.46
2, 4b4,b33, 49S $ 121,925,595 $ 4.95
246,463,350 $ 12,192,560 $ 4.95
TAXES PAID BY AGRICULTURE USING ABOVE RATES
Valuation Taxes paid Lands & Tax Value of per $10,000 I~rovements Rate Taxes Paid Products Value
$ 50,500,243 $ 4.42 $ 2,232,111 $ 43,839,000 $ 509.16 52,693,421 3.78 1,991,812 52,849,000 376.89 54,097,737 3.46 1,871,782 83,163,000 225.07 59,037,928 2.94 1,735,715 80,388,000 215.92 59,968,525 4.21 2,560,656 89,648,000 285.63
63,130,150 4.60 2,904,015 102,955,000 282.07 68,140,501 5.76 3,924,893 112,192,000 349.84 72,770,147 5.43 3,951,419 143,Oc5,000 276.20 82,420,716 5.96 4,912,275 177,276,000 277 .10 85,311,859 ~ 5,511,146 186,037,000
$ 648,071,839 • $31,595,824 1,071,412,000 296.24
~ 294.90
$ 64,807,184 $ 4.88 $ 3;159,582 $ 107,141,200 $ 294.90
- 4 -
-. ..
Year -1941 1942 1943 1944 1945
1946 1947 1948 1949 1950 TOTAL
Average
1941 19h2 19L3 1944 1945
1946 1947 1948 1949 1950 TOTAL
Average
TOTAL STATE, COUNTY, eI'I'Y itND ~CHOOL 'BXES l"OH. 1l].:;
BIGhl' LAJOi~ AGRICUU!'URAL CotmTIES
(Apache, Coconino, Graham, l'!ar1copa" i'~have" Navajo, Santa Cruz, end Yuma)
Compiled by: Arizona Department of Hineral Resources ,from: State Tax Commission's Reports.
Net County Valuation
$ 177,675,712 182,748,428 198,998,70) 210,043,560 208,402,994
220,17),,504 252,,720,187 )13,585,924 )44,298,819 ~t,98i,66~ $ 2,,63,&9
$ 246,463,,350
Total State, County, City & School Taxes
~ 7,8L4,)87 6,906,,554 6, 879,S71+ 6,168,050 8,907,156
10,121,0$3 14,,61,834 17,025,478 20,512,483 22,999,026
$ 121,925,595
$ 12,192,Seo
TAXES PAID BY LIV:sBTOCI( INDUS1'ltY USING ,ABOVE RATES
Tax Valuation Livestock Industry Tate Taxes Paid
$ 10,000,029 $ 4.42 $ 442,001 456,8)6 437,670 384,785 542,565
12,085,604 3.78 12,649,410 3.46 1),087,921 2.94 12,706,441 4.27
12,620,6)8 4.60 12,032,557 5.76 12,539,222 5.43 11,919,156 5.96
r--~1:?,-l,~643f""'S~22~ ~ $ 121,284,~OO ~
580,549 69),075 680,880 710,)82 ~2,172
$5,0,915
Value ot Products
G 31,5)6,000 44,))8,000 47,703,000 44,602,000 51,310,000
58,796,000 12,392,000
·81,229,000 69,,029,000 89,858,000
$ 590,,793,000
Rate Per $100
~ 4.42 ).78 ).46 2.94 4.27
4.60 ,.76 5.4.3 5.96 6.~6
$ 4.5
$ 4.95
Taxes Paid per $10,000
value
$ 12,128,450 e 4.68 $ 568,092 0 59,079,,300 $ 96.16
September 1951 .. 5 -

County and Name of Mine
COCHISE Coronado Cop~r Co. !helps Dodge corp(Co~oQueen Br) Shattuck Denn MDg.Corp.(DennGrp) GIIA Castle , Dome COPJ:er Co. Christmas Copper Co. Inspiration Copper Co. Miami. Copper Co. Arizona Chrysoti1e Asbestos Co. 79 Lead Copper Co. GREENlEE
$
Fhe1ps Dodge Corp.(Morenci Br.) l40HAVE Tennessee Schuylkill Corp. P.D4A Eagle Picher(Emp1re Zinc Co.) Ble1ps Dodge Corp{N.Cornelia Br.) Control Mines PINAL Kennecott Copper Ray Mines Magma. Copper 6'0. . St. Anthony Mng.& Dev.Co. SANTA CRUZ Amer. SIOO1t' g & Ref .Co( Trench} YAVAPAI Bagdad Copper Co. Fhe1JS Bodge Corp(U.Verde Br.) Shattuck Denn (Iron King tine
FINAL VAIDATION OF ALL ffiOIlERTY ASSESSED TO ffiODUCING MINING PROlER'l'IES
Claims
194 6 ~1 Other Property
Compiled by: Arisona Depu'tIOOnt of Mineral Resources
1 9 4 7 1 9 4 8 All Other All Other
Claims Property Claims Property
1949 All Other
Claims Property
'.5,000 $ 94,080 $ 5,000 $ 103,905 $ 5,000 $ 105,106 $ 25,000 ~ 105,106 $ 15,960,000 3,690,502 15,960,·000 3,719,304 15,960,000 3,802,389 9,960,000 4,219,133
100,000 150,770 100,000 85,989
1.,375,000 25,000
14,550,000 4,500,000
3,500 1,000
621,544 57,000
2,789,571 1,11.4,988
30,400 11,200
2,875,000 25,000
11,600,000 7,500,000
3,500 1l,200
39·,900;000 1.1.,036,639 49,000,000
35,000
300,000 26,550,000
2,200
8,800,000 3,500,000
290,000
100,000
31,000 35,000
193,500 300,000 4,583,080 29,550,000
5,760
1.,078,313 1.1,800,000 1,208,538 4,100,000
192,975 290,000
106,555 100,000
616,744 44,165
2,826,956 1,181,943
24,700 10,700
10,583,819
31,500
193,500 5,307,545
663,780 1,421,237
192,975
106,555
2,875,000 25,000
13,600,000 7)500,000
3,500
681,344 39,575
3,128;456 1,269,482
24,700
56,000,000 10,471,735
35,000
500,000 32,550,000
12,300,000 4,100,000
290,000
100,000
61,500
1.34,570 5,921.,900
679,780 2,557,463
167,721
121,165
5,000,000 55,000
13,600;000 7,500,000
61,000,000
35,000
1,000,000 34,443,010
1.4,000,000 4,1.00,000
500,000
100,000
681,344 10,000
3,304,496 1,269,422
14,341,581
56,500
146,405 7,012,020
r 913,780
3,043,998 116,435
122,165
1 9 5 ° All other
Claims FToperty
25,000 $ 127,332 4,500,000 2,947,478
5,000,000 55,000
13,600,000 7,500,000
68,500,000
35,000
1,000,000 35,000,000
14,000,000 4,100,000
500,000
100,000
656,474 10,000
3,323,071 1,231,364
13,678,756
47,500
1.26,158 8,579,358
1,000,505 2,283,394
156,442
122,165
700,000 349,706 700;000 598,750 1,000,000 534,750 1,000,000 649,425 1,000,000 760;050 1,360,007
202:,895 721,422 2.418,170 1,300,000 2,213,771 1.700,000 2,039,087 1,700,000 1,971,107 850,000
TOTAIS 300,000 109;950 1,500,000 141,Ql.P_~ __ lA~OO,OOO~n ___ 17~Ja2_~ _____ 1_,?00.L900 __ m_~~5_,J.~~OO,000
~ li6, 823.J 122 29 ,877, 641136-;654 --;rrOO~ 30,068,853 150.343,500 31,915,544 1551 818; 010 -- ~38 ,~58, 036 ~157 ,565 , 000 36,486,791
The Ore-body (claims) valuation amounts to 81.16% of the avera.ge total va.lue for the last five years, Source: Annual Reports of state Tax Commission September, 1951
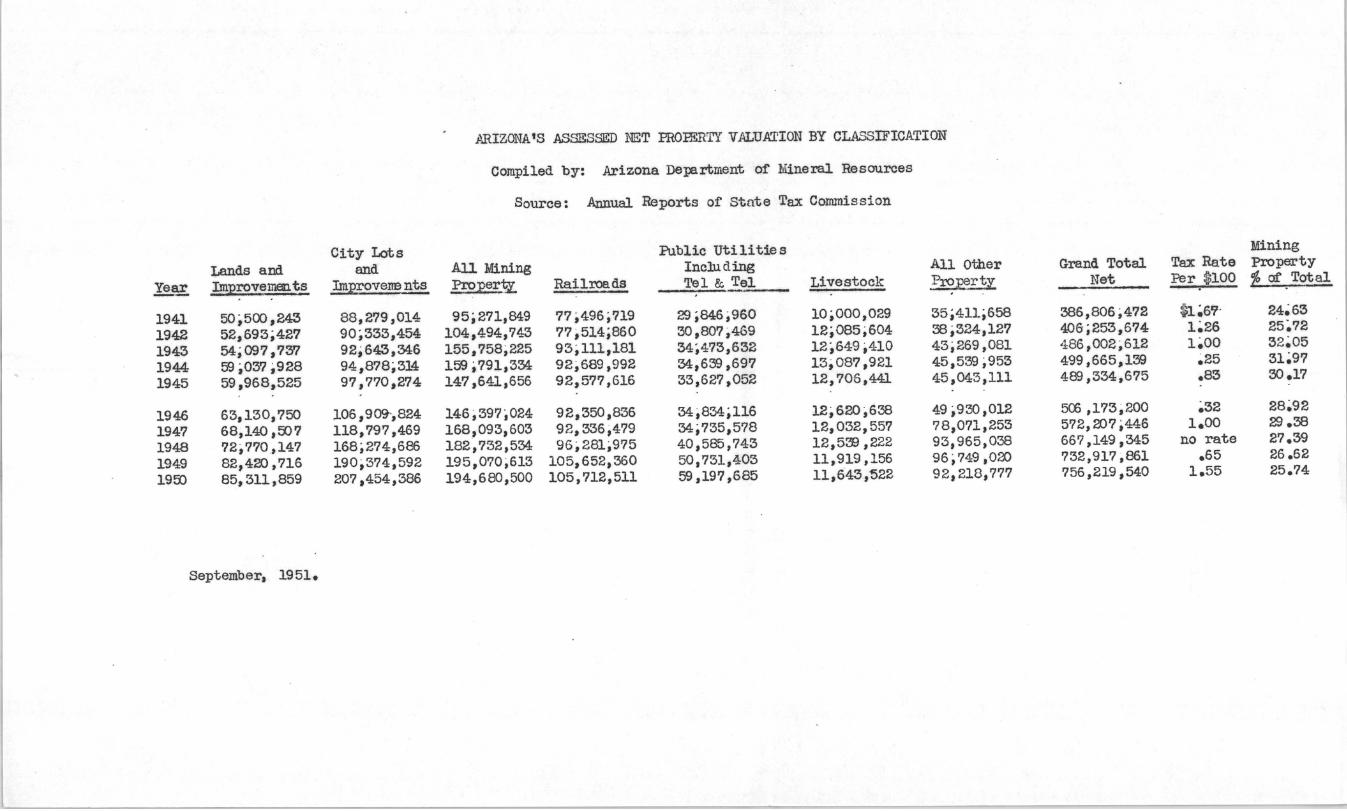
ARIZONA'S ASSESSIID NET PROmRTY VALUATION BY CLASSIFICATION
Compiled by: Arizona Department of Mineral Resources
Source: Annual Reports of State Tax Coml'lussion
City Lots Public Uti 1i tie s Mining Lands and and All Mining Including All Other Grand Total Tax Rate Property
Ye¥:. Improvements Improvene nts Pro;per~ Railroads Tel &. Tel Livestock Pro:pert.l Net Per $100 ~ at'. Total
1941 50,500,243 88,279,014 95i271,849 77,496;719 29 ;846;960 10;000,029 35;411;658 386,806;472 $1~61? ' 24~63
1942 52,693;427 90~333,454 104 ,494, 743 77,514;860 30,807,469 12;085;604 38;324,127 406;253,674 1~26 25~72 1943 54;097,7m 92;643,346 155,758;225 93;111,181 34,473,632 12,649,410 43,269,081 486,002;612 1~00 32~05
1944 59 ;037 ,928 94,878;314 159 ;791,334 92;689,992 34,639 ,697 13;087,921 45,539 ;953 499,665,139 ~25 31~97 1945 59,968,525 97,770,274 147,641,656 92,577,616 33,627,052 12,706,441 45,043,111 489 ,334,675 .83 30.17
1946 63,130,750 106,9o<:r,824 146;397,024 92,350,836 34,834;116 12;620,638 49 ;930 ,012 500 ,173;200 ~32 28~92 1947 68,140 ,007 118,797,469 168,093,603 92,336;479 34;735,578 12,032,557 78,071,253 572,007,446 1.00 29.38 1948 72,770,147 168;274,686 182,732,534 96,281;975 40,585,743 12,533 ,222 93,965,038 667,149,345 no rate 27.39 1949 82,420 ,716 190,374,592 195,0'70;613 105,652,360 50,731,403 11,919,156 96 ;749,000 732,917,861 .65 26.62 1900 85,311,859 207,454,386 194,680,500 105,712,511 59 ,197,685 11,643,522 92,218,777 756,219,540 1.55 25.74
September, 1951.