Embed Size (px)
Citation preview

Arizona Department of Health Services Antibiogram Toolkit Arizona Healthcare-Associated Infections (HAI) Program

ii Arizona Healthcare-Associated Infections (HAI) program — Antibiogram Toolkit
(This page is left intentional blank)

iiiArizona Healthcare-Associated Infections (HAI) program — Antibiogram Toolkit
A Note to Our Readers:
The objectives of the Antimicrobial Stewardship Programs (ASP) Subcommittee are directed at education, presentation, and identification of resources for clinicians to create toolkits of strategies that will assist clinicians with understanding, implementing, measuring, and maintaining antimicrobial stewardship programs.
ASP Subcommittee is a multidisciplinary committee representing various healthcare disciplines working to define and provide guidance for establishing and maintaining antimicrobial stewardship programs within acute care and long-term care institutions and in the community.
Their work was guided by the best available evidence at the time although the subject matter encompassed over one hundred references. Accordingly, the Subcommittee selectively used examples from the published literature to provide guidance and evidenced-based criteria regarding optimizing use of the annual cumulative antibiogram and applications for antimicrobial stewardship programs. The Antibiogram Toolkit reflects consensus on criteria which the Healthcare-Associated Infections (HAI) Advisory Committee deems to represent best practices in the interpretation and utilization of antibiogram data.
The Antibiogram Toolkit was developed by the ASP Subcommittee of the HAI Advisory Committee in 2012-2013. This toolkit should be used in conjunction with the guidance provided by the Clinical and Laboratory Standards Institute (CLSI) M39-A3 consensus document entitled “Analysis and Presentation of Cumulative Antimicrobial Susceptibility Test Data.”

iv Arizona Healthcare-Associated Infections (HAI) program — Antibiogram Toolkit
Introduction
The Clinical and Laboratory Standards Institute (CLSI), formerly the National Committee for Clinical Laboratory Standards (NCCLS), has published a series of guidelines beginning in 2002 to assist in the preparation of cumulative antibiograms. CLSI’s M39-A3 consensus document (third approved version, 2/5/2009), entitled “Analysis and Presentation of Cumulative Antimicrobial Susceptibility Test Data”, provides guidance to clinical laboratories in the collection of data for preparation of a cumulative antibiogram. The guidelines emphasize presenting susceptibility data in an accurate, reliable, consistent, transparent, and timely manner, distributing the antibiogram to clinicians and others who need access to the information, and presenting the results in a manner that facilitates comparisons between health care institutions. The most frequent use of a cumulative antibiogram report is to guide initial empirical antimicrobial therapy decisions for the management of infections in patients for whom definitive microbiological susceptibilities are unavailable for the infecting pathogen(s).
Most antimicrobial choices are empiric and made before the identification and susceptibility pattern of the infecting pathogen is known. Empiric antimicrobial choice is guided by many considerations, but local antimicrobial susceptibility patterns of commonly isolated bacteria are paramount among them. Since antimicrobial resistance has increased steadily in many institutions, and since resistance rates vary by geographic location and patient demographics, the ready availability of up-to-date cumulative antimicrobial susceptibility data is crucial. These data are also essential to monitor emerging trends in resistance at the local level to support clinical decision-making, evaluate infection-control interventions and antimicrobial-resistance containment strategies, optimize microbiology susceptibility testing and reporting methods, and guide Pharmacy and Therapeutics Committee formulary decisions. Other applications for the analysis of susceptibility test data may include methods not included in the CLSI M39-A3 manual, such as identifying isolates with specific antimicrobial resistance phenotypes.
However, cumulative antibiogram reports have significant limitations. These should be noted as part of any educational program concerning antibiogram use. At the same time, these limitations provide opportunities for innovation and discussion with clinicians and infectious diseases physicians on how to incorporate this data into future antibiogram editions. For example, a hospital antibiogram may be less valuable when selecting subsequent therapy for a patient with an early re-emerging infection or persistent infection because the antibiogram uses the mean susceptibilities of a population to predict clinical response without regard to previous antibiotic exposures in a specific patient. Antibiograms provide susceptibility data but do not reveal additional information concerning microbial isolates, such as the timing of the isolate in relation to the patient’s hospital admission (i.e., to determine whether an infection was
ANTIBIOGRAMSDeveloping Cumulative Susceptibility Reports for Your Clinicians and Ensuring Their Appropriate Interpretation and Effective Use

vArizona Healthcare-Associated Infections (HAI) program — Antibiogram Toolkit
community or health care acquired) or patient demographics and previous antibiotic exposure. Also, antibiograms reveal qualitative measures of susceptibility (i.e., whether a pathogen is resistant or susceptible) but do not provide quantitative data, such as minimum inhibitory concentrations (MICs), and thereby cannot detect significant elevations in MICs within a susceptible range which might signal acquired mechanisms of resistance (e.g., “MIC creep”). A further limitation of antibiograms is that they only capture the aggregate proportion of susceptible isolates for a given organism-antibiotic combination and do not provide data on the proportion of other antibiotics that are also active (i.e., cross-resistance to multiple antibiotics). Therefore, the cumulative antibiogram report should be viewed as a compilation of data which provides both opportunities and challenges. By its inherent nature, antibiograms provide valuable information which is vast but at the same time limited and is easy to misinterpret. Therefore, an active and continuous educational program is necessary.
The “Antibiogram Toolkit” is supported by the Healthcare-Associated Infections (HAI) Advisory Committee to provide additional direction for clinicians involved in constructing the cumulative antibiogram report and educating clinicians on it. This toolkit should be used in conjunction with approved CLSI documents and additional literature regarding microbial resistance. The toolkit hopefully enriches discussions on the challenges and opportunities with susceptibility data reporting. While the specific scenarios are detailed a multidisciplinary antibiotic stewardship team should find ways to implement some of these projects and further analyze their own antibiogram data to produce more accurate and fruitful educational activities.
The Antibiogram Toolkit contains two major components: antibiogram templates (Part I) and a set of suggestions for constructing antibiograms, such as CLSI-defined rules, including antibiogram concepts, opportunities for education, and antibiogram projects (Part II). Part II includes several topics which should enhance the accuracy and utility of the cumulative susceptibility report. These were selected by the authors from professional experience while involved with antibiotic stewardship programs during their careers. However, many more examples can be identified from the literature. A short list of references is supplied at the end but falls short of the dozens of examples published in the peer-reviewed literature. It is hoped that additional examples can be added in the future.

Toolkit Contents
The major recommendations for preparation, education, and solutions for common problems are provided in the first 3 topics, as follows:
• Recommendations for preparation of a cumulative antibiogram ...................................................................2
• Ideas on educating prescribers on reading and interpreting the cumulative antibiogram .............................3
• Antibiogram pitfalls and how to correct them ...............................................................................................4
The first three topics are followed by a series of scenarios and examples which build on solutions and further enhance the utility of antibiograms, education of prescribers, and identification of projects.
• Contributions to antibiotic resistance may be out of your control: the importance of patient location on susceptibilities .............................................................................................................................5
• The problem with antibiograms: numbers represent single-drug resistance .................................................7
• Detecting excessive influence of repeat (duplicate) isolates .........................................................................9
• Cascade (selective) testing and reporting: a pitfall .....................................................................................11
• When antibiogram data fails to provide direction to narrowing the antibiotic spectrum in select patient circumstances .........................................................................................................................12
• Presenting multi-institutional cumulative antibiogram data: local, regional, and national results ..............14
• Presenting trends in resistance as an educational section of the antibiogram .............................................16
• Institutional antibiograms do not provide information on how antibiotic use is epidemiologically linked to resistance rates ..............................................................................................................................17
• Assessing resistance trends: utilizing statistical analysis to evaluate changes in susceptibility rates .........18
• Using the antibiogram as part of antimicrobial stewardship initiatives .......................................................19
A short but essential reading list is provided specifically aimed at antibiograms and their use as part of an antibiotic stewardship program ........................................................................................................................21
Appendix The cumulative antibiogram report: Templates and suggestions .............................................................22
2Arizona Healthcare-Associated Infections (HAI) program — Antibiogram Toolkit
Recommendations for Preparation, Education, and Solutions
Recommendations for Preparation of a Cumulative Antibiogram
• Analyze/present cumulative antibiogram report at least annually.
• Include only final, verified test results.
• Include only species with testing data for ≥ 30 isolates.
• Include only diagnostic (not surveillance) isolates.
• Eliminate duplicates by including only the first isolate of a species/patient/analysis period, irrespective of body site or antimicrobial profile.
• Include only antimicrobial agents routinely tested; do not report supplemental agents selectively tested on resistant isolates only.
• Report percent susceptible (%S) and do not include percent intermediate (%I) in the statistic.
• Streptococcus pneumoniae and cefotaxime/ceftriaxone/penicillin: list %S using both meningitis and nonmeningitis breakpoints; for penicillin, also indicate %S using oral breakpoint.
• Viridans group streptococci and penicillin: list both %I and %S.
• Staphylococcus aureus: list %S for all and methicillin-resistant Staphylococcus aureus (MRSA) subset.

3 Arizona Healthcare-Associated Infections (HAI) program — Antibiogram Toolkit
Recommendations for Preparation, Education, and Solutions
Ideas on Educating Prescribers on Reading and Interpreting the Cumulative Antibiogram
Do’s:• Insert the antibiogram into the physician order entry computer program with links from the antibiotic
ordering screens
• Provide antibiograms on rounds with prescribers, fellows, residents, and students
• Implement antibiotic recommendations based on the antibiogram
• Facilitate development of antibiogram-related projects
• Develop a survey or quiz to assess antibiogram-related knowledge amongst clinicians
• Co-present the antibiogram at Medical Grand Rounds, P&T Committees, and other institutional meetings
Don’ts:• Mail copies of antibiograms to prescribers as the only mechanism of dissemination and education
• Educate clinicians on the antibiogram only once each year when a new edition is ready
• Forget the opportunity to use additional tools to educate clinicians throughout the year on appropriate empiric antibiotic therapy, such as newsletters, surveys, physician newsletters, and P&T agenda items
• Hide from clinicians the contact information of the ID Pharmacist, Microbiology, or Infection Prevention when there are questions regarding the antibiogram

4Arizona Healthcare-Associated Infections (HAI) program — Antibiogram Toolkit
Recommendations for Preparation, Education, and Solutions
Antibiogram Pitfalls and How to Fix Them
There are many pitfalls to antibiograms. These will result in confusion and potentially misinterpretation. A well-defined antibiogram, while providing much more information, can also be cumbersome for clinicians. Therefore, it is recommended that the following situations should be selected for improvement projects during the course of antibiogram-related development, and not all will apply to your institution. However, each example below can provide valuable information.
• Avoid testing antimicrobials using a cascade algorithm, such as testing restricted antimicrobial agents only when resistant to first-line agents. Cascade testing (and subsequent reporting) is not the same as selective reporting which is commonly employed in antimicrobial stewardship programs. See page 12.
• Use first isolate per patient in reporting period and include the method for eliminating duplicate isolates (manually, or by altering an automated default exclusivity date, such as 7-day or 1-month or 1-year).
• Try to separate isolates of a bacterial species by differentiating patient location, source, and age. For example:
o Adult vs. pediatrics
o Inpatient vs. outpatient/ED vs. long-term care
o Bacteremic isolates as a subset of overall results
o Adult ICU vs non-ICU vs. Hem-Onc service
o Urinary vs. non-urinary
o Isolates from patients with cystic fibrosis
• Develop a subset analysis for combination drugs against select species, such as Pseudomonas aeruginosa and Acinetobacter baumanii
• Exclude from the cumulative antibiogram results obtained during surveillance studies (e.g., nasopharyngeal colonization studies for MRSA, VRE obtained from rectal swabbing, etc).
• Since antibiograms provide data for a single reporting period, it may be helpful to provide trending of resistance (e.g., % of S,aureus isolates which are MRSA), %S results for medically important pathogens in the institution (e.g., trends of ceftazidime resistance in P.aeruginosa), and the appearance of new pathogens (e.g., KPCs as %K.pneumoniae or number of isolates overall). Pathogens not normally included in the antibiogram but are medically important, such as Clostridium difficile, should be communicated as part of an antibiogram in a separate section for educational value (see Template examples).
• Regional or national cumulative antibiogram reports should carefully consider the demographics of hospitals within the study, representation of data in quartiles of the mean, pooled median, ranges, and/or the ability to compare institutions through risk stratification. Automated susceptibility testing methods should be noted if differences exist.
• Institutional antibiograms do not provide information on how antibiotic use is epidemiologically linked to resistance rates.

5 Arizona Healthcare-Associated Infections (HAI) program — Antibiogram Toolkit
Scenarios and Examples
Contributions to Antibiotic Resistance May Be Out of Your Control: The Importance of Patient Location on Antibiotic Susceptibilities
In the antibiogram pictured below, an institution (Hospital A) shows a % susceptible value of 79% for E.coli (n=800 isolates) to Drug B. However, various sources contribute to this overall value and the number of first isolates tested. The number of isolates contributed by inpatients at Hospital A consists of pediatric patients, adult inpatients (non-ICU), and adult inpatients (ICU). When the sources of inpatient isolates (n=575) are considered, the overall %S to Drug B is 92%, which contrasts sharply from the overall antibiogram results of 79% S. So where is the additional resistance coming from?
During a pilot project, it is noted that E. coli isolates in patients from 3 local long-term care facilities exhibited high resistance rates to Drug B. This came up during ICU rounds where 3 patients from LTCF B had been admitted for urosepsis and each grew out E. coli from the blood and urine resistant to Drub B. All three patients had been started by the ICU fellow on Drug B plus a single dose aminoglycoside (not Drug B).
The Antibiotic Stewardship Team (AST) approached the Microbiology laboratory to retrieve all test results from the current antibiogram year for patients admitted from these LTC facilities and who showed positive cultures for E. coli. The laboratory confirmed that all 225 isolates had contributed to the antibiogram. As a matter of expediency, the Pharmacist selected 50 patient isolates at random. The antibiotic susceptibilities were calculated and extrapolated according to the left-hand boxes above for LTCF B, C, and D.
It became immediately apparent that the high resistance rate of E. coli to Drug B was largely determined by patient isolates from long-term care facilities but not from other inpatients within the hospital except for the adult ICU (62% S). LTCF B appeared to be the “worst offender”.

6Arizona Healthcare-Associated Infections (HAI) program — Antibiogram Toolkit
Scenarios and Examples
As a quality improvement project, the AST approached the Medical Directors of all 3 LTCFs and asked if they could assist the hospital in determining why resistance to Drug B was high. The Medical Directors and the hospital AST assisted in developing appropriate recommendations for use of Drug B for the attending physicians, infection prevention, and nursing at all 3 LTC facilities. The AST tracked E.coli susceptibillties to Drug B and 3 other agents over the following year.
A word of caution: since many patients in long-term care transition back-and-forth between hospital and nursing home it may be difficult to determine the precise moment or location of acquisition of resistant pathogens. Not all resistance is “imported”, but can be “exported” as well. A study such as that above should note this caveat.

7 Arizona Healthcare-Associated Infections (HAI) program — Antibiogram Toolkit
Scenarios and Examples
The Problem with Antibiograms: Numbers Represent Single-Drug Resistance
Numbers used in antibiograms represent susceptibilities, defined according to CLSI, for “bug-drug” combinations. However, there may be clinical situations which in which drug combinations are necessary. These usually involve the spectrum of drugs for which none are single drugs of choice (defined as any bug-drug combination with %S > 90%).
A common pathogen in which this frequently occurs is hospital-acquired infection with Pseudomonas aeruginosa, especially bloodstream infection, pneumonia, and skin and soft tissue infection. In the antibiogram below, only the susceptibility of amikacin exceeds 90%. While aminoglycosides are not thought of as monotherapeutic agents for serious infections, the beta-lactams and ciprofloxacin would generally not be thought of as reliably active as single agents. In such cases, the literature suggests that combination therapy may provide the best chances that one of the two agents might be susceptible if the patient’s isolate in question is typical of the pseudomonads at this institution.
One calculation and valuable piece of information for clinicians would be the construction of a cross-susceptibility table. It is generally agreed that beta-lactams in combination with tobramycin or amikacin or ciprofloxacin may satisfy the condition that one agent would demonstrate susceptibility. Arguments regarding penetration of drugs into the pulmonary tissue is beyond the scope of this report.
Pathogen # Isolates
% Susceptible(2012 Antibiogram, respiratory tract, ICU adults)
Piperacillin-tazobactam Ciprofloxacin Amikacin Ceftazidime
Pseudomonas aeruginosa 100 84 70 92 78
In the table above, the susceptibilities of 100 isolates of P.aeruginosa are provided to four commonly used agents. This data is also reflected in the cross-susceptibility table below. Cross-susceptibility tables are not included in antibiograms, but the data can be valuable. To construct such a table isolates which are susceptible to both agents must be determined (manually or with a program). The piperacillin-tazobactam/amikacin combination provides a higher chance that the P.aeruginosa isolate is susceptible to both agents (S-S, 76%) compared to the piperacillin-tazobactam/ciprofloxacin combination (S-S, 60%). Another view of this table is to determine the chance that AT LEAST one agent of the 2-drug combination will demonstrate susceptibility. This is calculated by adding the values for S-S, R-S, and S-R. For example, 100% of the isolates would be predicted to be susceptible to either piperacillin-tazobactam or amikacin if these agents are combined. This is obvious because R-R for the combination is zero (R-R = 0%). The chances that at least one of the agents of the beta-lactam plus ciprofloxacin combination is susceptible to a group of 100 isolates is 94%.

8Arizona Healthcare-Associated Infections (HAI) program — Antibiogram Toolkit
Scenarios and Examples
Piperacillin-tazobactam S/R(in combination with either Drug #1 or Drug #2)
Drug #1 S R Drug #2 S R
Amik
acin S 76 16
Cipr
oflox
acin S 60 10
R 8 0 R 24 6

9 Arizona Healthcare-Associated Infections (HAI) program — Antibiogram Toolkit
Scenarios and Examples
Detecting Excessive Influence of Repeat (Duplicate) Isolates
The cumulative antibiogram should reflect a single isolate from one patient over the period of the report. Generally, this isolate represents the first isolate collected from that patient in the data reporting period (e.g., one year), as long as it is the same bacterial species irrespective of body site or susceptibility profile (phenotype). This allows the antibiogram to be applied as a guide for selecting empiric antibiotic therapy. However, previous susceptibilities from past admissions should be considered.
Susceptibilities may be biased if more than one isolate is collected from a patient. Culturing practices become important in this case. Some clinicians may empirically select an antimicrobial agent against a likely pathogen without culturing the patient, such as with UTIs in healthy young females. Unfortunately, in the institutionalized patient, repeated culturing of the same site is common practice. Also, patients are more likely to have a therapeutic failure related to either the patient’s inability to clear the infection (despite having selected an active antimicrobial agent) or bacterial resistance. Therefore, a cumulative antibiogram report with many repeat isolates will generally bias the results towards greater % resistance.
Note that there may be instances in which the resistance phenotype may differ; for example, E.coli #1 from blood has a different phenotypic resistance pattern than E.coli #2 from urine. These may be counted as a single E.coli isolate as long as the more resistant strain is counted (the antibiotic chosen should be directed at the bacteremic isolate, and even if the urinary isolate is more resistant the drug concentrations achieved may overcome the MICs of this strain).
One mechanism to calculate the potential influence of repeat isolates is to divide the # isolates of a particular species by the number of unique patients during the antibiogram reporting period. Obviously, the ratio should be 1.00. However, it is not uncommon to find ratios of 2 to 3.
As the ratio increases there is a more likely chance that the cumulative antibiogram report will have greater % resistance than first isolates only would. If the ratio is high work with the microbiology laboratory to eliminate repeat isolates from the calculation prior to publishing the antibiogram. Also, the software program (Vitek, Microscan, etc) can be reset to a longer period for eliminating duplicate isolates, such as 3 months or longer. It might be interesting to compare susceptibilities and #isolates-to-patient ratio.
10Arizona Healthcare-Associated Infections (HAI) program — Antibiogram Toolkit
Scenarios and Examples
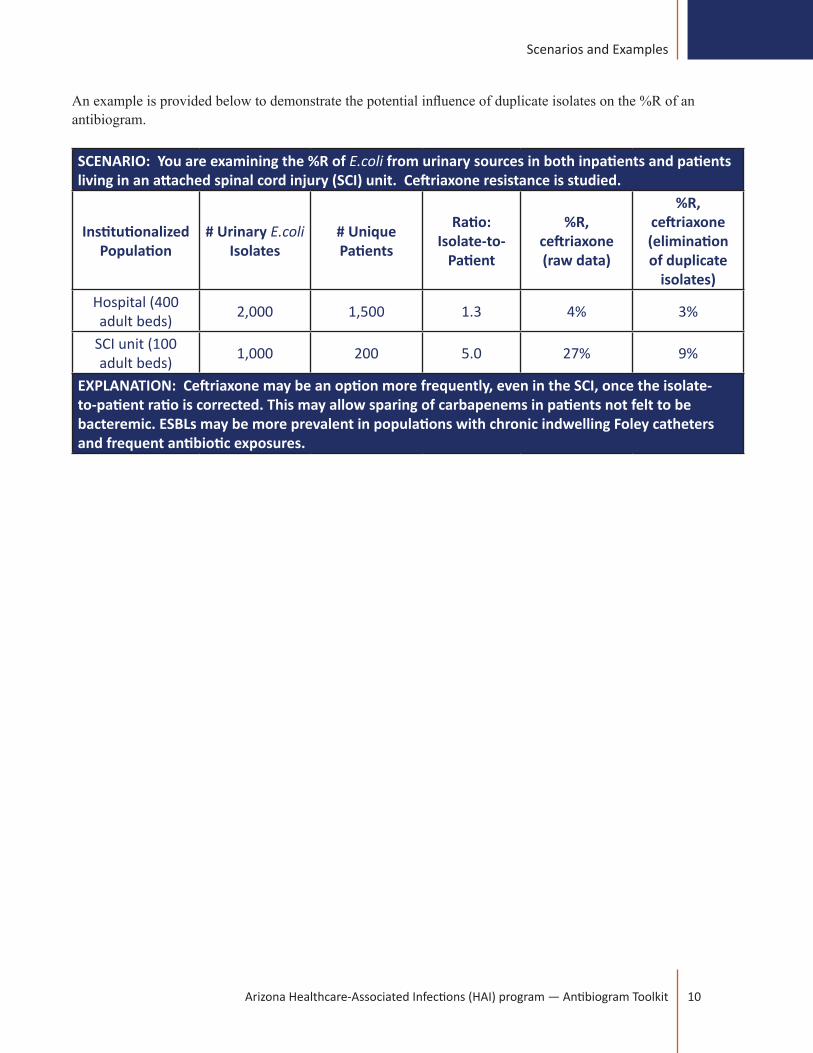
An example is provided below to demonstrate the potential influence of duplicate isolates on the %R of an antibiogram.
SCENARIO: You are examining the %R of E.coli from urinary sources in both inpatients and patients living in an attached spinal cord injury (SCI) unit. Ceftriaxone resistance is studied.
Institutionalized Population
# Urinary E.coli Isolates
# Unique Patients
Ratio: Isolate-to-
Patient
%R, ceftriaxone (raw data)
%R, ceftriaxone (elimination of duplicate
isolates)Hospital (400 adult beds) 2,000 1,500 1.3 4% 3%
SCI unit (100 adult beds) 1,000 200 5.0 27% 9%
EXPLANATION: Ceftriaxone may be an option more frequently, even in the SCI, once the isolate-to-patient ratio is corrected. This may allow sparing of carbapenems in patients not felt to be bacteremic. ESBLs may be more prevalent in populations with chronic indwelling Foley catheters and frequent antibiotic exposures.
11 Arizona Healthcare-Associated Infections (HAI) program — Antibiogram Toolkit
Scenarios and Examples
Antimicrobial Susceptibility Testing Using Cascade Algorithms: A Pitfall
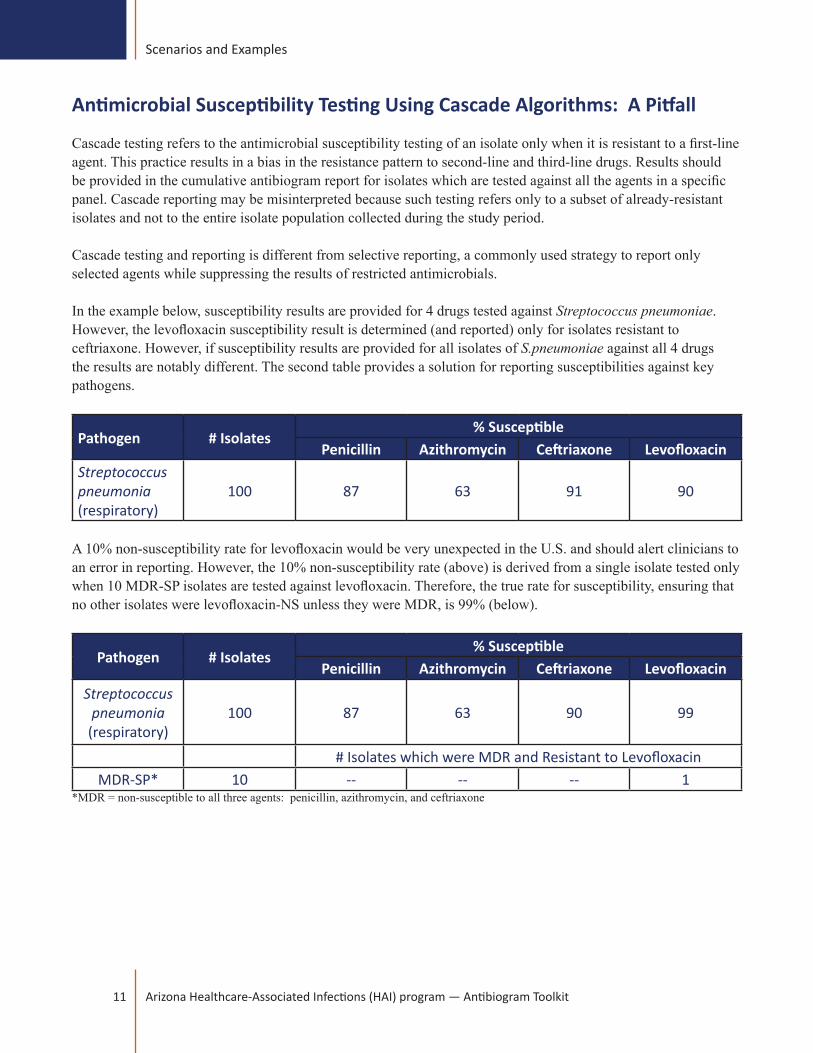
Cascade testing refers to the antimicrobial susceptibility testing of an isolate only when it is resistant to a first-line agent. This practice results in a bias in the resistance pattern to second-line and third-line drugs. Results should be provided in the cumulative antibiogram report for isolates which are tested against all the agents in a specific panel. Cascade reporting may be misinterpreted because such testing refers only to a subset of already-resistant isolates and not to the entire isolate population collected during the study period.
Cascade testing and reporting is different from selective reporting, a commonly used strategy to report only selected agents while suppressing the results of restricted antimicrobials.
In the example below, susceptibility results are provided for 4 drugs tested against Streptococcus pneumoniae. However, the levofloxacin susceptibility result is determined (and reported) only for isolates resistant to ceftriaxone. However, if susceptibility results are provided for all isolates of S.pneumoniae against all 4 drugs the results are notably different. The second table provides a solution for reporting susceptibilities against key pathogens.
Pathogen # Isolates% Susceptible
Penicillin Azithromycin Ceftriaxone LevofloxacinStreptococcus pneumonia(respiratory)
100 87 63 91 90
A 10% non-susceptibility rate for levofloxacin would be very unexpected in the U.S. and should alert clinicians to an error in reporting. However, the 10% non-susceptibility rate (above) is derived from a single isolate tested only when 10 MDR-SP isolates are tested against levofloxacin. Therefore, the true rate for susceptibility, ensuring that no other isolates were levofloxacin-NS unless they were MDR, is 99% (below).
Pathogen # Isolates% Susceptible
Penicillin Azithromycin Ceftriaxone LevofloxacinStreptococcus
pneumonia(respiratory)
100 87 63 90 99
# Isolates which were MDR and Resistant to LevofloxacinMDR-SP* 10 -- -- -- 1
*MDR = non-susceptible to all three agents: penicillin, azithromycin, and ceftriaxone

12Arizona Healthcare-Associated Infections (HAI) program — Antibiogram Toolkit
Scenarios and Examples
When Antibiogram Data Fails to Provide Direction to Narrowing the Antibiotic Spectrum in Select Patient Circumstances
While empiric antibiotic selection relies on the capability to predict the optimal antimicrobial regimen in a specific individual patient, use of broad-spectrum agents will be common based on susceptibilities which provide at least 90% susceptibility for suspected pathogens. It may appear that the antibiogram actually promotes the selection of certain broad-spectrum agents such as piperacillin-tazobactam and carbapenems solely due to the fact that their susceptibilities for many pathogens may exceed 90%.
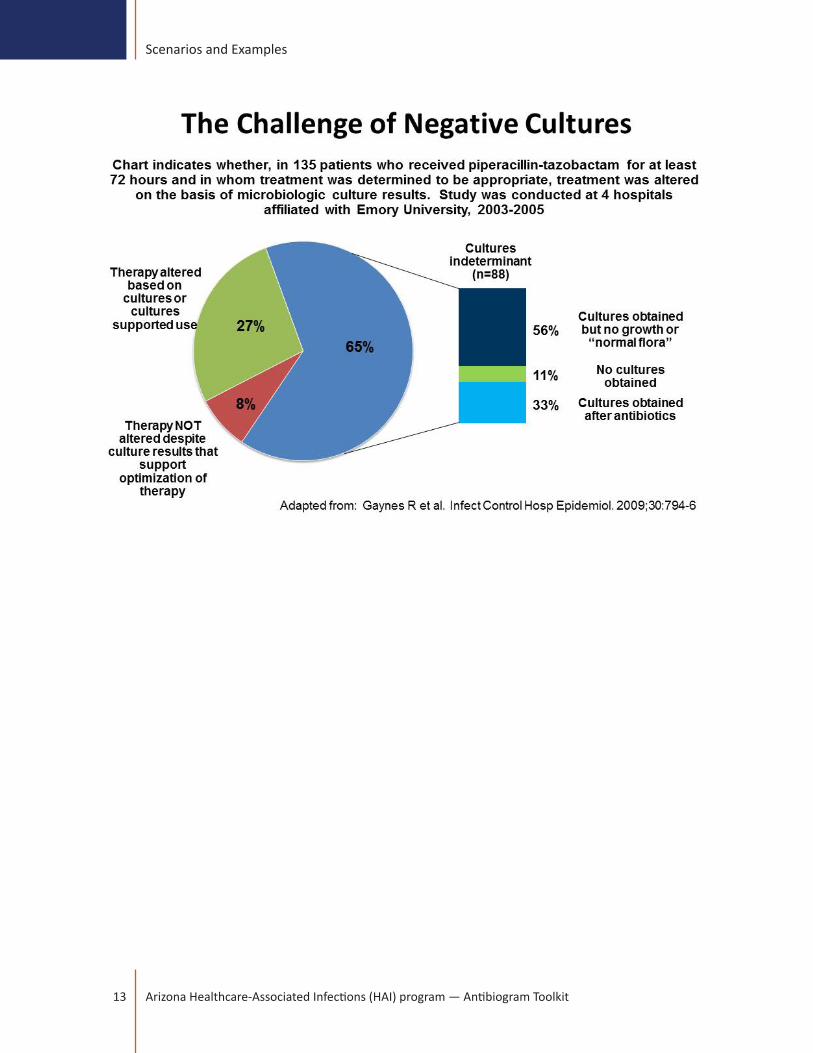
A brief study by Gaynes et al. (see figure below) demonstrated that in the majority of situations it might not be possible to target antimicrobial therapy based on culture results. Even in 135 cases in which initial empiric piperacillin-tazobactam therapy was judged appropriate therapy could not be altered in the majority of patients. The inability or failure to de-escalate after 72 hours of use arose from “indeterminate culture” results in 65% of cases. Of these indeterminate cultures, 56% represented cultures obtained without growth or ‘normal flora’, 11% of patients had no cultures obtained, and 33% of cultures were obtained after antibiotics were given. Suggestions are provided in this study which can be employed selectively to narrow the spectrum of therapy.
Solutions may provide educational opportunities in the emergency department and admitting clinicians:• Obtain cultures prior to antibiotic administration. When possible, note on the microbiology lab slip
any antibiotics given prior to admission and their timing, both oral and intravenous. In the ED, recent antibiotic administration generally applies to intravenous agents given as soon as IV access is achieved. Unfortunately, communication between healthcare workers does not consistently avoid this error. Patients who cannot produce a high-quality sputum sample should be induced as soon as possible using respiratory therapists and protocols for sputum induction prior to administration of antibiotics. While antibiotic distribution into tissues is time-dependent even orally administered antibiotics can be absorbed fairly rapidly in some individuals.
• The lack of culture results within 24 hours of admission may largely represent cultures “lost” or not processed. Everyone has seen cultures in the ED which were not sent to the laboratory, not placed on ice, or not otherwise drawn into the appropriate tubes. A process and time-labor analysis may provide ideas for process improvement.
• Blood culture contamination is not infrequent albeit low (2-4% is commonly cited, but rates may be significantly higher). Along with the practice of ‘swabbing non-sterile wounds or tissue’ there is little wonder why coagulase-negative staphylococci represent large numbers of isolates on many antibiograms. Appropriate site cleansing prior to drawing blood cultures has reduced contamination rates significantly and should be studied as a process improvement project. Blood draws from an existing IV line may also increase blood contamination rates. Again, wounds cultures should be taken from deep tissues and not just ‘swabbed’.
• When bacteremia due to a vascular source is suspected, submit blood cultures with instructions to plate on nutritionally-supplemented media (viridians streptococci) and hold such cultures for a longer period of time (according to the laboratory’s protocol). Rapid identification of slow-growing gram-positive or gram-negative pathogens can reduce hospitalization days and possibly complication from persistent bacteremia which has not been documented by culture results.
13 Arizona Healthcare-Associated Infections (HAI) program — Antibiogram Toolkit
Scenarios and Examples

14Arizona Healthcare-Associated Infections (HAI) program — Antibiogram Toolkit
Presenting Multi-Institutional Cumulative Antibiogram Data: Local, Regional, and National Results
While an antibiogram from a single institution is one of the key activities of an antibiotic stewardship program, there may be opportunities to construct an antibiogram representing several or even hundreds of institutions.
There have been many difficulties associated with compiling such antibiograms, including quality assurance and data verification of results prior to calculating average percent susceptibilities. The most difficult challenge has been to risk stratify reporting institutions because multi-institutional antibiograms may represent a large array of hospitals and long-term care facilities. For example, antibiogram data from a large academic hospital which performs organ and hematopoietic transplants might be expected to have more resistance compared to a small community non-teaching hospital with less association with long-term care facilities.
While many examples are provided in the literature, a multi-institutional antibiogram should contain the following elements, and efforts should ensure that certain data can be acquired from all participants:
• Laboratory testing methodology
• MIC breakpoints used to interpret S, I, and R.
• Representation of the key pathogens, such as E.coli, K.pneumoniae, Enterobacter spp., P.aeruginosa, S. aureus (including MRSA), S.pneumoniae, and Enterococcus spp.
• Risk score for each institution, such as case-mix index; or, demographic categorization of each hospital
• Percentiles at 10%, 25%, 50% (median), 75%, and 90% are useful to identify outliers. In the table below, percentiles are most useful for large numbers of institutions, such as state and national data. This methodology is used by the CDC’s NHSN program. For example, at the 25th percentile, 25% of the hospitals had lower %S rates and 75% of the hospitals had higher %S rates. If the %S rate is below the 25th percentile, determine whether it is below the 10th percentile. If the %S rate is, then it is a low outlier which may be due to resistance issues within the institution or feeding of high numbers of patients from SNFs where resistance may be a greater problem. Regardless, the institutions with more resistance deserve attention. Of course, there may also be reporting inaccuracies and these should be ruled out first. On the other side of this is the institution included in the 90 percentile for %S (i.e., 90% of the hospitals in the data set have %S rates which are lower than the 90 percentile performers. For top performing institutions, these should be analyzed for efficiency of the antibiotic stewardship program. These best practice centers can be targeted for duplicating antibiotic prescribing which might reduce resistance in other institutions.
Scenarios and Examples

15 Arizona Healthcare-Associated Infections (HAI) program — Antibiogram Toolkit
Scenarios and Examples
Pathogen # Isolates
# Institutions Reporting
%S, ceftriaxone Percentile† (%S ceftriaxone; K.pneumoniae)
Pooled mean
Range (hi. lo) 10% 25% 50%
(median) 75% 90%
K.pneumonaieAll 2,888 7 85 61, 94 na 75 90 95 na
Urinary 2,510 7 84 58, 94 na 74 89 94 naNon-urinary 378 7 93 79, 100 na 81 96 99 na
† N=7. Due to the low number of sites, percentiles were interpreted as follows. For all isolates, 1 institution (~10th percentile) had %S of 61%, 2 institutions (~25th percentile) had susceptibility rates of 75% or lower, and 5 institutions (~75th percentile) had susceptibility rates of 92% or lower. The 50% value (median) is the middle value of 7 institutions; therefore, for all isolates considered amongst 7 sites, 3 institutions had % susceptibility rates which were lower than 90% (all isolates), 89% (urinary isolates), and 96% (non-urinary), and 3 institutions had %susceptibility rates which were higher than these median values.

16Arizona Healthcare-Associated Infections (HAI) program — Antibiogram Toolkit
Scenarios and Examples
Presenting Trends in Resistance As An Educational Section of the Antibiogram
A challenge with antibiograms is the presentation of data which is restricted to a specific one-year period. This creates a lack of perspective, such as trends in resistance rates or the rise/decline of pathogens which are medically important.
An appropriate perspective reflecting such trends can be reserved for a section of the antibiogram which is not commonly used for educational purposes – the margin.
• Due to space limitations, the number of graphs and tables should be minimized.
• Alternatively, these may be presented as part of an extended and ongoing educational program which aim is to provide perspective in resistance through trending over 5-year (or greater) periods.
• Also, the rise of medically important pathogens which have not been observed in past years is very valuable for both close observation and as a patient safety issue as frequently such organisms present few options for selection of antimicrobials.
• Pathogens of epidemiologic importance should also be presented, such as Clostridium difficile and isoniazid-R and rifampin-R strains of Mycrobacterium tuberculosis.
Examples are provided below:
17 Arizona Healthcare-Associated Infections (HAI) program — Antibiogram Toolkit
Scenarios and Examples
Institutional Antibiograms Do Not Provide Information On How Antibiotic Use is Epidemiologically Linked to Resistance Rates
Cumulative antibiogram reports do not provide details as to the density of antibiotic use and therefore adverse trends in resistance or the emergence of new MDR pathogens cannot be directly linked to the local use of a specific antibiotic or class. Similarly, antibiograms may not provide evidence that local microbiologic outcomes are a result of changes in antibiotic use patterns, although it is the implied function of the antibiotic stewardship program. While antibiotic use applies selective pressure for the emergence of resistance, there is little data to guide clinicians of an ASP to determine how resistance trends can be altered. There are several limitations to studies which highlight the complexity between antibiotic use and bacterial resistance even when both are studied as local and simultaneous occurrences.
• Resistance and high antibiotic density may not occur in the same hospital unit
• Changes must be studied over a period of several years; a change in resistance in the recent antibiogram should not be assumed to result from changes in antibiotic pressures. More sophisticated methods should be employed, such as interrupted time-series analyses.
• Outside influences, such as imported resistance, is not accounted for in an antibiogram.
• Antibiograms do not assess the changes in MICs since S, I, an R are determined by breakpoints. Migration of MICs towards the breakpoint is a harbinger towards resistance.
• Hospital-wide antibiograms do not provide detailed analysis of specialized areas of the hospital or patient subpopulations. Therefore, emerging pockets of resistance may be missed. The overall bug-drug susceptibility values dilutes out the effect of an emerging resistance problem.
• Antibiograms constructed using a first-isolate method underestimates true resistance since susceptible isolates may be replaced by resistant ones during therapy.
• Antibiograms do not capture multidrug resistant organisms; only single bug-drug combinations are represented.
• Resistance may be curtailed through other measures, such as infection prevention measures, and includes improvements in hand hygiene, patient isolation and patient movement protocols, improved technology for insertion and maintenance of entry sites for central lines, and updated room cleaning procedures.
• Changes in antibiotic policies frequently result in “squeezing the balloon” whereby restriction of one antibiotic class results in over-utilization of another.
The deficiencies of an antibiogram based on its static nature of analysis should not discourage clinicians involved with ASP activities from creating a more innovative and useful tool.

18Arizona Healthcare-Associated Infections (HAI) program — Antibiogram Toolkit
Scenarios and Examples
Assessing Resistance Trends: Utilizing Statistical Analysis to Evaluate Changes in Susceptibility Rates
Historic annual antibiogram data can be an invaluable tool to help track trends in changing resistance and indicate a need for further investigation and potential action. Additionally, comparisons can be made from within institutions (from inpatients to outpatients) or externally (from one institution to regional or national data). Generally, this is determined by evaluating changes in %S estimates between different data sets for specific organisms and antimicrobials. A crucial part of analysis is determining the precision of a %S estimate and the significance of an increase or decrease in susceptibility in order to identify the need for action.
A confidence interval is used to provide an estimate of how precise the observed %S is when used to guide clinical decision making. The sample size (number of isolates tested) influences the precision of the estimate and the subsequent confidence interval. The larger the sample size, the more precise the resulting observed %S; the smaller the sample size, the less precise. This serves to validate the %S value and allows the data analyst to determine with what confidence the observed %S represents the broader population.
One common statistical test utilized to determine statistically significant differences in resistance rates is the Chi-squared test. Generally, a P value of < 0.05 is accepted to indicate that the observed differences are not likely due to chance. Information about Chi-squared calculations can be found in biostatistics textbooks, however, the CLSI M39-A3 consensus document has appendices that may be used as a guide to determine statistical significance. Keep in mind, the tables provided in this document can only be used if the two populations being compared are of similar sample size.
While analysis of resistance trends as described above can identify “statistically significant” differences, this should not be confused with or imply a “clinically or epidemiologically important” difference. In the case of a large number of isolates (sample size), small changes in %S such as a decrease from 63.2% to 61.9% may be statistically significant, but deemed unimportant when evaluating in regards to clinical application. Conversely, in the case of a small number of isolates, a change in %S from 80% to 55% may not be statistically significant but clinically may alert the institution to a potential emergence of resistance. In both of these cases, the institution(s) must determine whether the results are due to true changes in susceptibility or confounded by other factors including changes in the patient population, sample collection practices, laboratory testing or data reporting.
Regardless of the method used, critical analysis of changes in antimicrobial resistance patterns using antibiogram data can help identify areas of improvement related to antimicrobial prescribing and provide a focus for stewardship activities.

19 Arizona Healthcare-Associated Infections (HAI) program — Antibiogram Toolkit
Scenarios and Examples
Using the Antibiogram as Part of Antimicrobial Stewardship Initiatives
Antibiograms have a variety of applications to clinical practice and data gathered can help identify potential opportunities for improved antimicrobial prescribing. While practitioner education plays a key role in prescribing practices, improvement can also be realized through targeted initiatives. This goal can be achieved through several different stewardship efforts which vary in complexity when considering implementation and impact. The following are some select examples of how antibiogram data can be incorporated into stewardship-related activities.
Formulary Considerations:• In response to increasing resistance trends, institutions may consider formulary changes using
antibiogram data as a guide. Often these involve changing agents within the same class.
• A study by Empey et al described a significant decrease in the observed rates of ceftazidime-resistant Pseudomonas aeruginosa, ceftazidime-resistant Klebsiella pneumoniae and piperacillin-resistant Pseudomonas aeruginosa infections in patients after changing their cephalosporin formulary from ceftazidime and cefotaxime to cefepime.
Antibiotic restriction:• Based on antibiogram susceptibility trends, use of specific agents or classes of agents may be restricted or
controlled. Traditionally this has applied to broad-spectrum agents but could be individualized based on local antibiogram data. Prescribers must obtain prior approval in order to use the restricted agent.
Prospective review:
• Similar to antibiotic restriction, this intervention identifies targeted agents based on resistance trends and aims to decrease use. However, the method employed here utilizes a back end approach which requires an infectious diseases expert to review all uses of the prescribed agent and make recommendations in order to decrease inappropriate use and impact resistance rates.
Order Set/Clinical Pathway Design:• Antibiogram data and trends can be incorporated into the design of hospital-specific order sets,
guidelines, and clinical pathways in order to increase or decrease empiric use of specific agents based on susceptibility.
• An example of this would be developing empiric antibiotic selections as part of a severe sepsis admission order set. Based on the hospital antibiogram, cefepime, piperacilllin/tazobactam, and tobramycin have consistently high susceptibilities to most gram-negative organisms, including Pseudomonas aeruginosa. Comparatively, fluoroquinolones may demonstrate lower gram-negative susceptibilities and these susceptibilities have continually trended downward over the past several years. Using this information, the order set could be built to include only cefepime and piperacillin/tazobactam as primary first line agents for gram-negatives. While fluoroquinolones may be excluded from the selection list, tobramycin can be included as an adjunct agent. Again, empiric first-choice antibiotics will be based upon the antibiogram, but a more focused examination of previous cultures obtained from septic patients may be warranted since this is the target population.
20Arizona Healthcare-Associated Infections (HAI) program — Antibiogram Toolkit
Scenarios and Examples
Computer-assisted decision support services (CaDSS):• Some institutions have the ability to embed predefined pathways and restrictions on antimicrobial
selection electronically as part of the ordering process.
• A study by Pestotnik et al found that a computer-assisted decision support program resulted in an overall reduction antibiotic use, of 22.8% over the study period. The institution’s antibiogram remained stable over the 7-year period.
It should be noted that often these stewardship initiatives are established with the two-pronged goal of improving patient outcomes and improving resistance rates. While specific patient outcomes can be measured, it is more difficult to assess the true impact of a specific stewardship initiative on changes in rates of resistance, as these often appear months or years after an intervention and can be influenced by a number of factors. Additionally, decreasing the use of one or more antibiotics will invariably cause an increase in use of another agent or class of agents. It is important to take the susceptibility changes for these other agents into account when assessing impact.

21 Arizona Healthcare-Associated Infections (HAI) program — Antibiogram Toolkit
Reading List
A Brief Reference List on Antibiograms
Binkley S, Fishman N, LaRosa L, et al. Comparison of unit-specific and hospital-wide antibiograms: potential implications for selection of empirical antimicrobial therapy. Infect Control Hosp Epidemiol. 2006;27(7):682-7.
Christoff J, Tolentino J, Mawdsley E, et al. Optimizing empirical antimicrobial therapy for infection due to gram-negative pathogens in the intensive care unit: utility of a combination antibiogram. Infect Control Hosp Epidemiol. 2010;31(3):256-61.
CLSI. Analysis and Presentation of Cumulative Antimicrobial Susceptibility Test Data; Approved Guideline- Third Edition. CLSI document M39-A3. Wayne, PA: Clinical Laboratory Standards Institute; 2009.
D’Agata E, Cataldo M, Cauda R, Tacconelli E. The importance of addressing multidrug resistance and not assuming single-drug resistance in case-control studies. Infect Control Hosp Epidemiol. 2006;27(7):670-4.
Dellit TH, et al. Infectious Diseases Society of America and the Society for Healthcare Epidemiology of America Guidelines for Developing an Institutional Program to Enhance Antimicrobial Stewardship Clin Infect Dis. 2007;44:159-77
Empey K, Rapp R, Evans M. The effect of an antimicrobial formulary change on hospital resistance patterns. Pharmacotherapy. 2002;22(1):81-7.
Gaynes R, Gould C, Edwards J, et al. A multicenter study on optimizing piperacillin-tazobactam use: lessons on why interventions fail. Infect Control Hosp Epidemiol. 2009;30(8):794-6.
Hindler J, Stelling J. Analysis and presentation of cumulative antibiograms: a new consensus guideline from the Clinical Laboratory Standards Institute. Clin Infect Dis. 2007;44:867-73.
Kuper KM, et al. Antimicrobial susceptibility testing: a primer for clinicians. Pharmacotherapy 2009;29:1326–1343.
McGregor J, Bearden D, Townes J, et al. Comparison of antibiograms developed for inpatients and primary care outpatients. Diagn Microbiol Infect Dis. 2013;76:73-9.
Pakyz A. The utility of hospital antibiograms as tools for guiding empiric therapy and tracking resistance. Pharmacotherapy. 2007;27(9):1306-12.
Pestotnik SL, et al. Implementing antibiotic practice guidelines through computer-assisted decision support: clinical and financial outcomes. Ann Intern Med 1996;124:884-890.
Schulz L, Fox B, Polk R. Can the antibiogram be used to assess microbiologic outcomes after antimicrobial stewardship interventions? A critical review of the literature. Pharmacotherapy. 2012;32(8):668-76.
Slain D, Sarwari A, Petros K, et al. Impact of a multimodal antimicrobial stewardship program on Pseudomonas aeruginosa susceptibility and antimicrobial use in the intensive care unit setting. Crit Care Res Pract. 2011; Article ID 416426:1-5; doi:10.1155/2011/416426.

22Arizona Healthcare-Associated Infections (HAI) program — Antibiogram Toolkit
Appendix
THE CUMULATIVE ANTIBIOGRAM REPORT: TEMPLATES & SUGGESTIONS
The following templates for antibiograms serve as examples for reporting antimicrobial susceptibilities against gram-negative and gram-positive pathogens (isolates ≥30 per reporting period) with a separate template for Streptococcus pneumoniae.
These templates are best adapted to an 8” x 14” legal sized sheet which can be doubly folded into a convenient 3.5” x 8” form.
A face page listing contact information of key clinicians should be listed (see panel to right). Phone or pager numbers of key contact personnel should be provided as well as those of the Antimicrobial Stewardship Committee and ancillary personnel such as the ID service for consultation, Infection Prevention, Microbiology, ID Pharmacist, Drug Information, and Central Pharmacy.
Although drug costs have been traditionally included on antibiograms (i.e., a plus-sign scoring system or wholesale acquisition cost for standard dose sizes) the conversion of branded products to generics, multiple manufacturers of generics, drug shortages, and pharmacy contract pricing and rebates makes assignment of prices even by a ranking system obsolete. A focus on accurate empiric drug therapy directed through antimicrobial susceptibilities and interpretations should be the primary focus of the antibiogram. Education of clinicians regarding antimicrobial prescribing practices rather than pharmacy expenditures makes the antibiogram more valuable. Empiric antimicrobial recommendations can be included for major infections, such as pneumonia, cellulitis, COPD exacerbation, urinary tract infection, and sepsis/septic shock. These may be further divided into community-associated and hospital-associated infections, such as hospital-acquired or ventilator-associated pneumonia (HAP or VAP, respectively), febrile neutropenia, and central-line infections with suspected bacteremia.
Hospitals with restrictive formularies may indicate antimicrobials which require ID approval or other approved formulary indications.
St. Elsewhere Medical CenterAntimicrobial Susceptibility
Summary2012 Calendar Year
Antimicrobial Stewardship ProgramClinical Microbiology; Dept of
Pathology & Laboratory Medicine
The information contained in this summary can also be found on the “Antibiogram” link on the hospital intranet: http://www.stelsewhereASP.edu/
For questions concerning antibiotic susceptibilities or antibiogram interpretation, please call:Edward E. Coli, Clinical Microbiology Supervisor:
555-555-5555Sally M. Onella, PharmD., ASP Pharmacist:
555-555-5556 (ID pager)
Frequently called numbers:Antimicrobial Testing Laboratory
555-555-5557Infectious Diseases (Adult)
555-555-5558Infectious Diseases (Peds)
555-555-5559Drug Information Center
555-555-5560Infection Prevention
555-555-5561Inpatient Pharmacy
555-555-5562

St. E
lsew
here
M
edic
al C
ente
r20
12 A
ntib
iogr
am
Isol
ates
, Jan
-Dec
201
2
% S
usce
ptib
le
% S
usce
ptib
le fo
r Gra
m-N
egat
ive
Isol
ates
USE
OF
IN V
ITR
O D
ATA
MU
ST B
E IN
TER
PRET
ED I
N R
EFER
ENC
E T
O C
LIN
ICA
L S
TATU
S, S
ITE
OF
INFE
CTI
ON
, A
ND
PE
NET
RA
TIO
N O
F T
HE
AN
TIM
ICR
OB
IAL
AN
TIB
IOTI
C
Amikacin
Gentamicin
Tobramycin
Ampicillin
Ampicillin-ulbactam
Piperacillin-tazobactam
Aztreonam
Cefazolin
Ceftriaxone
Cefepime
Ciprofloxacin
Meropenem
Trimethoprim-sulfamethoxazole
Nitrofurantoin
Org
anis
m#
Stra
ins
Esch
eric
hia
coli
Kle
bsie
lla
pneu
mon
iae
Ente
roba
cter
cl
oaca
eEn
tero
bact
er
aero
gene
sPr
oteu
s m
irabi
lis
Salm
onel
la s
pp
Shig
ella
spp
Citr
obac
ter
freu
ndii
Aci
neto
bact
er
baum
anni
iPs
eudo
mon
as
aeru
gino
saSt
enot
roph
omon
as
mal
toph
ilia
[App
ropr
iate
foot
note
s m
ay b
e in
clud
ed in
this
box
with
refe
renc
e to
eith
er a
ntim
icro
bial
sor
pat
hoge
ns.
For e
xam
ple,
it s
houl
d be
not
ed th
at
nitro
fura
ntoi
n is
pre
scrib
ed fo
r urin
ary
tract
infe
ctio
ns o
nly.
Als
o, d
osin
g of
pip
erac
illin
-tazo
bact
am fo
r tre
atm
ent o
f ser
ious
pse
udom
onal
infe
ctio
ns
shou
ld c
onsi
der h
ighe
r dos
ages
and
/or e
xten
ded
infu
sion
s, if
app
licab
le]
Key
Not
es o
n
An
timic
robi
al S
usce
ptib
ilitie
s [T
his
sect
ion
shou
ld
be
incl
uded
in
an
tibio
gram
s to
disc
uss
impo
rtan
t tr
ends
in
resis
tanc
e fo
r im
port
ant
path
ogen
s, g
raph
s or
tab
les
whi
ch t
rack
ant
imic
robi
al u
se o
r ch
ange
s in
M
DRO
pa
tter
ns,
Clos
trid
ium
di
ffici
le
infe
ctio
n tr
ends
an
d in
form
atio
n,
KPC
and
MRS
A in
cide
nces
, an
d re
com
men
datio
ns
for
inte
rpre
ting
susc
eptib
ilitie
s w
ith n
ew a
gent
s or
tes
ting
syst
ems.
New
dos
ing
reco
mm
enda
tions
may
be
su
gges
ted,
su
ch
as
for
colis
tin,
amin
ogly
cosid
es, o
r van
com
ycin
]
Mis
cella
neou
s Sus
cept
ibili
ty
Info
rmat
ion
[Tes
ting
for
anae
robe
s an
d TB
m
ay
be
inte
rmitt
ent
but
rem
ain
rele
vant
in
som
e ce
nter
s. I
mpo
rtan
t rem
inde
rs m
ay b
e st
ated
in
th
is se
ctio
n in
ef
fort
s to
ex
tend
an
timic
robi
al st
ewar
dshi
p pr
inci
ples
, etc
]

St. E
lsew
here
M
edic
al C
ente
r20
12 A
ntib
iogr
am
Isol
ates
, Jan
-D
ec 2
012
% S
usce
ptib
le
% S
usce
ptib
le fo
r Gra
m-P
ositi
ve Is
olat
esU
SE O
F IN
VIT
RO
DA
TA M
UST
BE
INTE
RPR
ETED
IN
REF
EREN
CE
TO
CLI
NIC
AL
STA
TUS,
SIT
E O
F IN
FEC
TIO
N,
AN
D P
ENET
RA
TIO
N O
F T
HE
A
NTI
MIC
RO
BIA
L A
NTI
BIO
TIC
ALL
Isol
ates
(fro
m a
ll pa
tient
s &
sou
rces
)B
lood
Isol
ates
(fro
m a
ll pa
tient
s)*
Clindamycin
Doxycycline
Erythromycin
Oxacillin
Penicillin
Rifampin
Trimethoprimi-Sulfamethoxazole
Vancomycin
Ampicillin
Daptomycin
Linezolid
Oxacillin
Vancomycin
Gentamicin(SYN)
Streptomycin(SYN)
Org
anis
m#
Stra
ins
(all/
bl
ood)
Stap
hylo
cocc
us
aure
us(a
ll)14
73/
107
----
Out
patie
nt78
110
0--
--
Inpa
tient
461
100
----
ICU
231
100
----
Met
hici
llin-
resi
stan
t S. a
ureu
s62
5/
41
Coa
gula
se-
nega
tive
stap
hylo
cocc
us§
1005
/
12
1
Virid
ans
grou
p St
rept
ococ
cus
(ste
rile
site
s on
ly)
37/
(10)
----
----
----
--
Ente
roco
ccus
fa
ecal
is †
425/
3254
62
Ente
roco
ccus
fa
eciu
m‡
94/
(12)
6160
Exa
mpl
es o
f foo
tnot
es fo
r gra
m-p
ositi
ve p
atho
gens
follo
w:
* In
clud
es a
gent
s ac
cept
able
for t
reat
men
t of b
lood
stre
am in
fect
ion.
ID
con
sult
is re
com
men
ded
for b
lood
stre
am in
fect
ions
due
to g
ram
-pos
itive
infe
ctio
ns.
† 19
% h
igh-
leve
l res
ista
nce
to b
oth
GE
N S
YN
and
STR
SY
N
‡ 4
4% h
igh-
leve
l res
ista
nce
to b
oth
GE
N S
YN
and
STR
SY
N§
Exc
lude
s S
. lug
dune
nsis
and
S. s
apro
phyt
icus
( ) L
ess
than
30
isol
ates
; sus
cept
ibili
ty re
sults
are
not
pro
vide
d
Key
Not
es o
n G
ram
-Pos
itive
An
timic
robi
al S
usce
ptib
ilitie
s [T
his
sect
ion
shou
ld b
e in
clud
ed i
n an
tibio
gram
s to
di
scus
s im
port
ant
tren
ds i
n re
sista
nce
for
impo
rtan
t pa
thog
ens,
suc
h as
Sta
phyl
ococ
cus
aure
us
and
vanc
omyc
in-r
esist
ant
Ente
roco
ccus
].
[An
expa
nded
col
umn
for
all s
trai
ns
and
bloo
d iso
late
s is
incl
uded
in t
his
tem
plat
e, b
ut m
ay a
lso b
e ap
plie
d to
th
e te
mpl
ate
for
gram
-neg
ativ
e pa
thog
ens.
Also
not
e th
is te
mpl
ate
also
dist
ingu
ishes
loca
tion
of p
atie
nt
at
time
of
spec
imen
co
llect
ion.
W
hile
thi
s is
only
an
exam
ple
for
S.
aure
us,
it m
ay b
e co
nsid
ered
for
ot
her
path
ogen
s w
hich
m
ay
be
subj
ect
to s
peci
fic h
ospi
tal-a
cqui
red
infe
ctio
n re
port
ing]
. [N
ew d
osin
g re
com
men
datio
ns m
ay
be s
ugge
sted
in
this
box,
suc
h as
va
ncom
ycin
dos
ing
to a
chie
ve h
ighe
r tr
ough
ser
um c
once
ntra
tions
or l
ow-
dose
am
inog
lyco
sides
w
hen
appr
opria
te
for
trea
tmen
t of
in
fect
ive
endo
card
itis]
. [Im
port
ant
rem
inde
rs m
ay b
e st
ated
in
thi
s se
ctio
n in
effo
rts
to e
xten
d an
timic
robi
al
stew
ards
hip
prin
cipl
es].

St. E
lsew
here
M
edic
al C
ente
r20
12 A
ntib
iogr
am
Isol
ates
, Jan
-Dec
201
2
% S
usce
ptib
le
% S
usce
ptib
le fo
r Str
epto
cocc
us p
neum
onia
eU
SE O
F IN
VIT
RO
DA
TA M
UST
BE
INTE
RPR
ETED
IN
REF
EREN
CE
TO
CLI
NIC
AL
STA
TUS,
SIT
E O
F
INFE
CTI
ON
, A
ND
PEN
ETR
ATI
ON
OF
TH
E A
NTI
MIC
RO
BIA
LA
NTI
BIO
TIC
Amoxicillin (PO)
Cefotaxime
Ceftriaxone
Clindamycin
Erythromycin
Levofloxacin
Moxifloxacin
Penicillin (IV)
Penicillin (PO)
Trimethoprim-sulfamethoxazole
Vancomycin
Org
anis
m#
Stra
ins
S. p
neum
onia
e(A
LL)
100
--a--a
--a64
§10
0
Non
-men
inig
itis
100
--94
†95
†--
----
--84
†--
----
Men
ingi
tis10
0--
85‡
84‡
----
----
64‡
----
--E
xam
ples
of f
ootn
otes
for S
trept
ococ
cus
pneu
mon
ia in
clud
e th
e fo
llow
ing
exam
ples
:
aB
reak
poin
ts d
iffer
for c
efot
axim
e, c
eftri
axon
e, a
ndpe
nici
llin
base
d on
dia
gnos
is†
Sus
cept
ible
bre
akpo
int f
or S
.pne
umon
iae
in p
atie
nts
with
men
ingi
tis is
≤ 0
.5 m
g/L
for c
efot
axim
e an
d ce
ftria
xone
and
≤ 0
.06
mg/
L fo
r pen
icill
in‡
Sus
cept
ible
bre
akpo
int f
or S
.pne
umon
iae
in p
atie
nts
with
non
men
ingi
tis in
fect
ions
is ≤
1 m
g/L
for c
efot
axim
e an
d
c
eftri
axon
e an
d ≤
2 m
g/L
for p
enic
illin
§S
usce
ptib
le b
reak
poin
t for
S.p
neum
onia
eis
≤ 0
.06
mg/
L fo
r pen
icilli
n w
hen
peni
cilli
n V
is a
dmin
iste
red
by th
e or
al ro
ute
Key
Not
es o
n St
rept
ococ
cus p
neum
onia
Antim
icro
bial
Sus
cept
ibili
ties
[Thi
s se
ctio
n sh
ould
be
in
clud
ed
in
antib
iogr
ams
to
disc
uss
impo
rtan
t tre
nds i
n re
sista
nce
for t
his p
atho
gen]
[F
or fe
w o
ther
pat
hoge
ns a
re su
scep
tibili
ties a
nd th
eir r
epor
ting
so
conf
usin
g as
with
Str
epto
cocc
us p
neum
onia
. Th
is is
ofte
n re
late
d to
diff
erin
g br
eakp
oint
s de
pend
ing
on w
heth
er t
he p
atho
gen
is
isola
ted
from
CSF
as
with
bac
teria
l men
ingi
tis o
r fr
om b
lood
as
in
pneu
moc
occa
l pn
eum
onia
w
ith
bact
erem
ia.
N
ote
that
th
e nu
mbe
r of
str
ains
is
100
but
the
sam
e fo
r no
n-m
enin
gitis
and
m
enin
gitis
. Th
us, t
his
pres
enta
tion
expr
esse
s al
l iso
late
s in
ter
ms
of %
susc
eptib
le a
pplie
d to
bot
h br
eakp
oint
s.
It is
impo
rtan
t to
no
te in
thi
s bo
x th
e nu
mbe
r of
pne
umoc
occa
l iso
late
s fr
om C
SF
and
non-
CSF
spec
imen
s. A
lso,
the
antib
iogr
am t
empl
ate
may
be
expa
nded
to
addi
tiona
l row
s to
incl
ude
adul
t an
d pe
diat
ric d
ata
sepa
rate
ly]
[D
osin
g re
com
men
datio
ns m
ay b
e su
gges
ted
in th
is bo
x, e
spec
ially
w
hen
deal
ing
with
the
beta
-lact
am a
gent
s an
d va
ncom
ycin
for t
he
trea
tmen
t of m
enin
gitis
]