Embed Size (px)
Citation preview
Arizona Department of Agriculture
Lisa A. James
Grant Program Manager
Ashley Worthington
Grant Program Coordinator
Specialty Crop Block Grant Program
Agreement No. 12-25-B-1655
Final Performance Report
December 28, 2016
Revised and re-submitted
February 2, 2017
Arizona Department of Agriculture
Specialty Crop Block Grant Program
Agreement No. 12-25-B-1655
Contact Information
Lisa James, Grant Program Manager
Agricultural Consultation and Training Program
Phone: 602-542-3262
Fax: 602-364-0830
Email: [email protected]
Contents
Page
Introduction 2
Education Projects
2014 SWAS – A Collaborative Educational Experience 2
Arizona Specialty Crop Reference Guide (Updates 2016) 12
Continuation of GHP/GAP Certification Training and Promotion Program 14
Continuation of GHP/GAP Certification Cost-Share Program – 2014 19
Edible School Gardens 21
Fruit and Vegetable Learning Garden Phase II 23
Virtual Arizona Experience: Promoting Specialty Crops 25
Arizona Agriculture: Bee’s Amazing Adventure 31
Marketing Projects
Arizona Grow Marketing Efforts Phase 3 35
Plant Something Campaign – Public Outreach III 37
Research Projects
Breeding for Improved Nutrient Use Efficiency 39
Enhancing IPM in Arizona Vegetable Crops 44
Managing Weeds in Nursery Containers 48
Mechanism for Improving Seed Placement Uniformity 50
Pathogen Transmission to Crops from Animals 55
Pesticide Diagnostic Laboratory for Arizona Vegetables 66
Reducing Pesticide Risks in Arizona Lettuce 69
Survey of Arizona Wine Grape Production 79
Sustainable Management Practices for Bagrada Bug 83
Appendices 97
Arizona Department of Agriculture
Specialty Crop Block Grant Program
Agreement No. 12-25-B-1655
Introduction
On September 24, 2013, the Arizona Department of Agriculture (ADA) entered into a
cooperative agreement with the United States Department of Agriculture (USDA), Agricultural
Marketing Service (AMS) in the amount of $1,318,053.18 in FY13 Specialty Crop Block Grant
Program – Farm Bill funds to fund seventeen projects specifically designed to increase the
consumption and enhance the competitiveness of Arizona Specialty Crops. Projects within the
Arizona State Plan include two marketing projects, six education projects and nine research
projects and are initially one to two years in duration. The expiration of the grant period is
September 29, 2016.
On October 30, 2014, AMS approved an amendment to this agreement that added the project,
“Continuation of GHP/GAP Certification Cost-Share Program – 2014”.
On August 5, 2016, AMS approved an amendment to this agreement that added the project,
“Arizona Specialty Crop Reference Guide (Updates 2016)”.
2014 SWAS – A Collaborative Educational Experience This project was completed on September 30, 2014
Project Summary The Southwest Ag Summit was conceived with the specific purpose of bringing cutting edge
information to specialty crop growers and affiliated people as it relates to arid land agriculture.
Yuma is in the middle of well over a million acres of arid land agriculture that has its own
specific needs and issues. The land, the weather, the water all requires attention to detail and
constant need for solutions to problems that keep surfacing year after year. In our partnership
with Yuma County Cooperative Extension and the University of Arizona Research Farm we are
able to present current information on real time problems as they develop. With the return of the
Field Demonstrations we are introducing hands on solutions to irrigation, tillage, transplanting
and automation of labor-intensive cultivation practices. The interaction between growers,
researchers, specialists and educators is a catalyst for finding even more solutions as they present
their information during our breakouts. It has always been our goal to improve the efficiency and
quality of specialty crops.
Project Approach Our formula for success has been slowly evolving for several years. We have reached a point in
our journey that we have a great event and it meets our goals of providing information to
industry. Our needs are now to keep improving on the value of the information and to reach out
and touch more people.
We focused not only on great sources of information but also on how to spread the word on what
we have to offer. We spent a good amount of time with Yuma Cooperative Extension and
University of Arizona Ag. Research, putting together a program of pertinent topics and
outstanding presenters. Our program of breakouts for this Summit reflect our success:
- Honey Bee Interactive Panel – Bee Health and Pollination
- Integrated Pest Management Regulatory Update
Page 2 of 147
Arizona Department of Agriculture
Specialty Crop Block Grant Program
Agreement No. 12-25-B-1655
- Fresh Produce Safety
- Mechanical Thinning vs. Hand Thinning
- Risks of Heavy Metals in Desert Vegetables
- Variable Rate Phosphorous Management in Desert Vegetables
- Seeking Genetic Path toward Improved Phosphorous Use in Fertilizer Efficiency in
Vegetables
- Control of Weeds and Soil Borne Diseases with Steam and Heat-applications of New
Technologies in Vegetables.
Utilizing Arizona Western College’s (AWC) larger classrooms for breakouts proved ideal for
this. Plenty of room built in technology and personnel well trained in IT. The auditorium was the
perfect venue for our Bee Panel. This is an area of agriculture of extreme importance due to
science and emotion seeming to clash over the cause of declining bee populations. We brought in
an insecticide industry representative, a bee researcher from APHIS, and two beekeepers, one
with over 80,000 hives and one with several thousand. The panel and ensuing breakout were
excellent in presenting pollinator facts and practices.
The Field Demonstrations brought back portion of the Summit we had to do without last year
with our move to AWC and one year due to being rained out. We were able to take advantage of
the AWC Land Lab specifically for this purpose. Once again our partnership with AWC grew in
a direction we were unsure of earlier. We feel that this event really puts on display equipment
that has tremendous implications in improving cultural practices. This year we demonstrated:
- Innovations in sprinkler systems
- Several automatic thinners that have improved greatly in the last two years
- Transplanters from several different manufacturers
- Several innovative tractors and implements
- GPS applications in cultivation
One of our more successful markers for this event was the number of attendees who signed up in
advance of the Summit. In the past it was normal for us to have 100 to 200 register and pay on
event day. This year we had 795 attendees already registered in advance and only a smattering of
25 or 30 the day of the event. This gave us a pretty secure feeling that we are finally getting out
both by reputation of our content presented and our marketing. Our partnerships with Yuma
County Farm Bureau (YCFB), Yuma Visitors Bureau(YVB) and California Agriculture Pest
Control Advisors (CAPCA) have given us more exposure through their mailing lists, access to
members and the YVB marketing program that helps in making the right kind of contact; contact
that creates interest and attraction.
This year we added a wrap up Insider Magazine. It was produced to remind attendees of the
information presented. It was sent to over 4,000 addresses so it will invariably land in the laps of
many that did not attend giving them some information they missed. And hopefully it will attract
them to the Summit in 2015. A budget adjustment was requested and approved on September 29,
2014.
Page 3 of 147
Arizona Department of Agriculture
Specialty Crop Block Grant Program
Agreement No. 12-25-B-1655
Goals and Outcomes Achieved Each year we use a survey to measure stated goals as well as to give us base information that will
assist us in outreach the following year. This survey allowed us to measure some of our goals
below.
1. Increase the attendance to the 2014 SWAS Academic programs by vegetable and
melon industry members (Goal) by 8% from 525 (Benchmark) to 567 (Target) measured
by surveys, registration and attendance lists. (Performance Measure)
Of those attendees who completed the survey, 83.84% indicated that their occupation
involves the melon or vegetable industry. Not every attendee completed a survey. When the
83.84% is applied to the total number of registrations (795), we estimate that 667 of the 2014
SWAS participants have occupations that involve the vegetable and melon industry, which
would be an increase of 27%.
2. Increase the reach of the SWAS by measuring how likely attendees are to share
materials with coworkers and/or staff unable to attend the SWAS (Goal) by 10% from 250
people (Benchmark) to 275 people (Target) measured by survey questions about
participants’ sharing SWAS materials. (Performance Measure)
Of the 328 attendees who completed the survey, 134 (40.85%) indicated they planned to
share the information with “Staff;” 262 (79.88%) indicated they planned to share the information
with “Coworkers;” 40 (12.20%) indicated they planned to share the information with “Media;”
and 172 (52.44%) indicated they planned to share the information with “Friends/Family.” (On
this survey question, participants were allowed to select more than one answer.) The survey
results clearly indicate that participants found the SWAS information very valuable and they
wanted to share the information with people who were unable to attend the 2014 SWAS. A total
of 302 respondents indicated that they will share materials with coworkers and/or staff, which is
an increase of 21%.
3. Increase the attendance to the 2014 SWAS Field Demonstration by vegetable and
melon industry members (Goal) by 10% from 200 (Benchmark) to 220 (Target) measured
by surveys, registration and attendance lists. (Performance Measure)
Of those attendees who completed the survey, 39.94% indicated that they attended the 2014
SWAS Field Demonstration. 114 out of the 328 people (34.75%) who answered the survey
question about attending the Field Demonstration indicated that their occupations involved the
vegetable and melon industry. Not every attendee completed a survey. From the survey results,
we know at least 114 people whose occupations involve the vegetable and melon industry
attended the Field Demonstration. When the 83.84% rate (those who indicated on the survey
that their occupation involves the melon or vegetable industry) is applied to the total number of
registrations (795) we estimate that 267 of the 2014 SWAS Field Demonstration participants
have occupations that involve the vegetable and melon industry. Given the actual survey
respondents (114), we fell short of our goal of 220 people. Applying the survey percentages to
the total number of participants, we exceeded our goal of vegetable and melon industry members
attending the Field Demonstration by 47 people, which is an increase of 33.5%.
Page 4 of 147
Arizona Department of Agriculture
Specialty Crop Block Grant Program
Agreement No. 12-25-B-1655
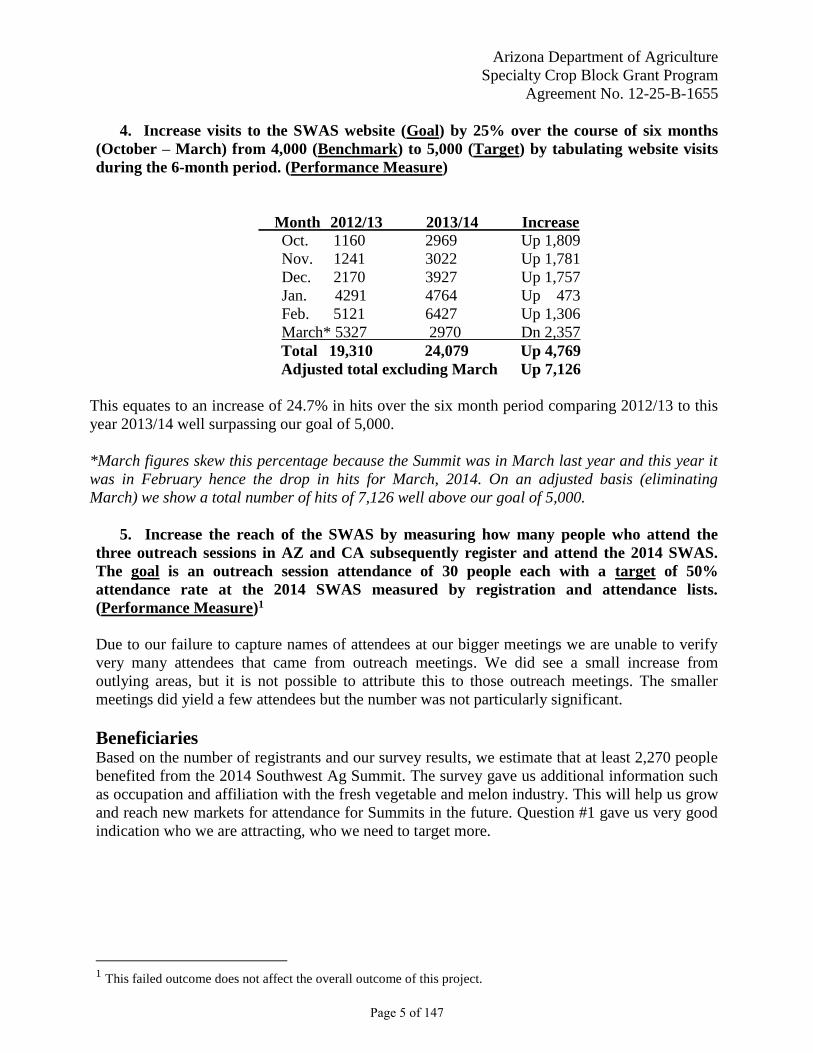
4. Increase visits to the SWAS website (Goal) by 25% over the course of six months
(October – March) from 4,000 (Benchmark) to 5,000 (Target) by tabulating website visits
during the 6-month period. (Performance Measure)
Month 2012/13 2013/14 Increase
Oct. 1160 2969 Up 1,809
Nov. 1241 3022 Up 1,781
Dec. 2170 3927 Up 1,757
Jan. 4291 4764 Up 473
Feb. 5121 6427 Up 1,306
March* 5327 2970 Dn 2,357
Total 19,310 24,079 Up 4,769
Adjusted total excluding March Up 7,126
This equates to an increase of 24.7% in hits over the six month period comparing 2012/13 to this
year 2013/14 well surpassing our goal of 5,000.
*March figures skew this percentage because the Summit was in March last year and this year it
was in February hence the drop in hits for March, 2014. On an adjusted basis (eliminating
March) we show a total number of hits of 7,126 well above our goal of 5,000.
5. Increase the reach of the SWAS by measuring how many people who attend the
three outreach sessions in AZ and CA subsequently register and attend the 2014 SWAS.
The goal is an outreach session attendance of 30 people each with a target of 50%
attendance rate at the 2014 SWAS measured by registration and attendance lists.
(Performance Measure)1
Due to our failure to capture names of attendees at our bigger meetings we are unable to verify
very many attendees that came from outreach meetings. We did see a small increase from
outlying areas, but it is not possible to attribute this to those outreach meetings. The smaller
meetings did yield a few attendees but the number was not particularly significant.
Beneficiaries Based on the number of registrants and our survey results, we estimate that at least 2,270 people
benefited from the 2014 Southwest Ag Summit. The survey gave us additional information such
as occupation and affiliation with the fresh vegetable and melon industry. This will help us grow
and reach new markets for attendance for Summits in the future. Question #1 gave us very good
indication who we are attracting, who we need to target more.
1 This failed outcome does not affect the overall outcome of this project.
Page 5 of 147
Arizona Department of Agriculture
Specialty Crop Block Grant Program
Agreement No. 12-25-B-1655
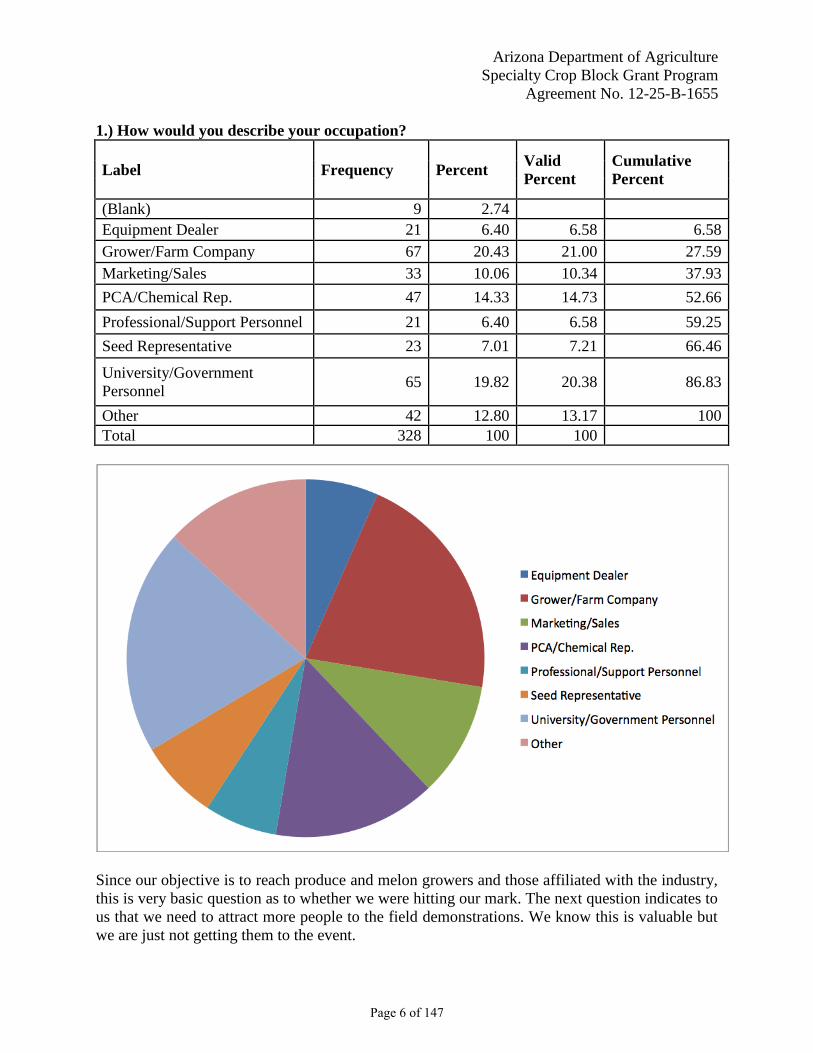
1.) How would you describe your occupation?
Label Frequency Percent Valid
Percent
Cumulative
Percent
(Blank) 9 2.74
Equipment Dealer 21 6.40 6.58 6.58
Grower/Farm Company 67 20.43 21.00 27.59
Marketing/Sales 33 10.06 10.34 37.93
PCA/Chemical Rep. 47 14.33 14.73 52.66
Professional/Support Personnel 21 6.40 6.58 59.25
Seed Representative 23 7.01 7.21 66.46
University/Government
Personnel 65 19.82 20.38 86.83
Other 42 12.80 13.17 100
Total 328 100 100
Since our objective is to reach produce and melon growers and those affiliated with the industry,
this is very basic question as to whether we were hitting our mark. The next question indicates to
us that we need to attract more people to the field demonstrations. We know this is valuable but
we are just not getting them to the event.
Page 6 of 147
Arizona Department of Agriculture
Specialty Crop Block Grant Program
Agreement No. 12-25-B-1655
2.) Does your occupation involve the melon or vegetable industry?
Value
Label Frequency Percent
Valid
Percent
(Blank) 2 .61
Yes 275 83.84 84.36
No 51 15.55 15.64
Total 328 100
3.) Did you attend the Field Demonstration?
Value
Label Frequency Percent
Valid
Percent
(Blank) 1 .3
Yes 131 39.94 40.06
No 196 59.76 59.94
Total 328 100
A very large part of our purpose is to provide valuable information to producers of vegetables
and melons. Question number four provided us with valuable feedback on how it has assisted in
other ways beside just the presentations. This will also guide us in which direction to continue
and in some instances to go in another.
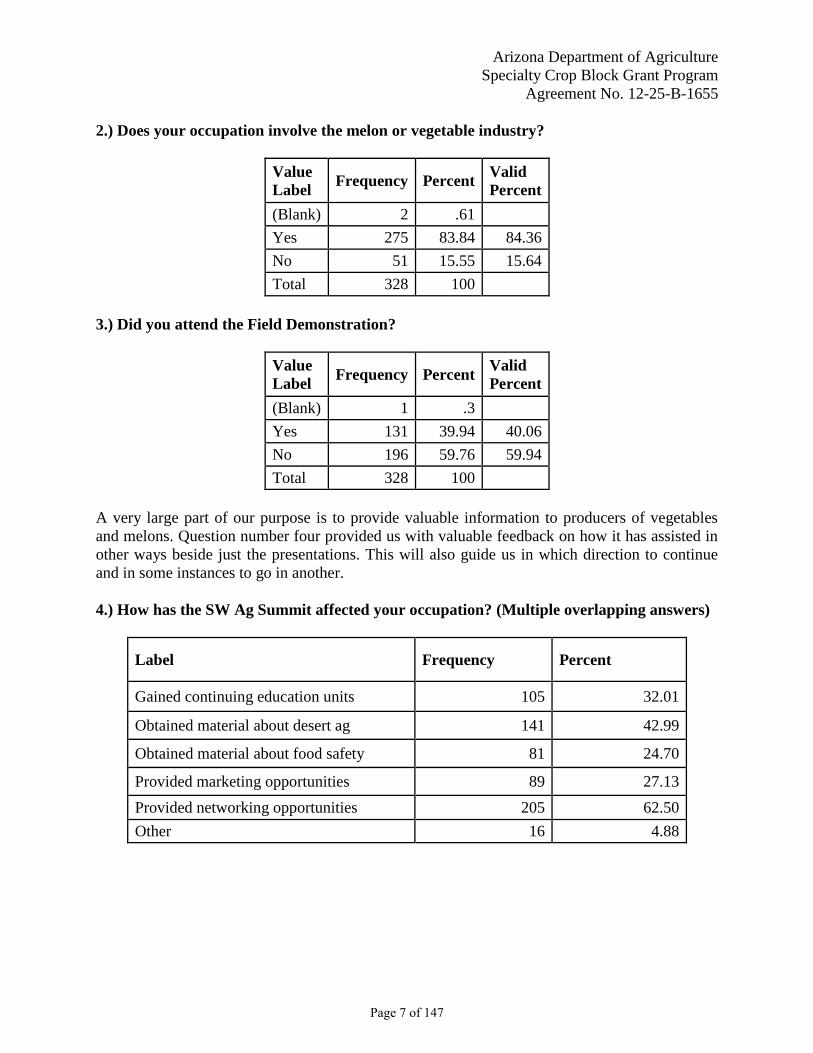
4.) How has the SW Ag Summit affected your occupation? (Multiple overlapping answers)
Label Frequency Percent
Gained continuing education units 105 32.01
Obtained material about desert ag 141 42.99
Obtained material about food safety 81 24.70
Provided marketing opportunities 89 27.13
Provided networking opportunities 205 62.50
Other 16 4.88
Page 7 of 147
Arizona Department of Agriculture
Specialty Crop Block Grant Program
Agreement No. 12-25-B-1655
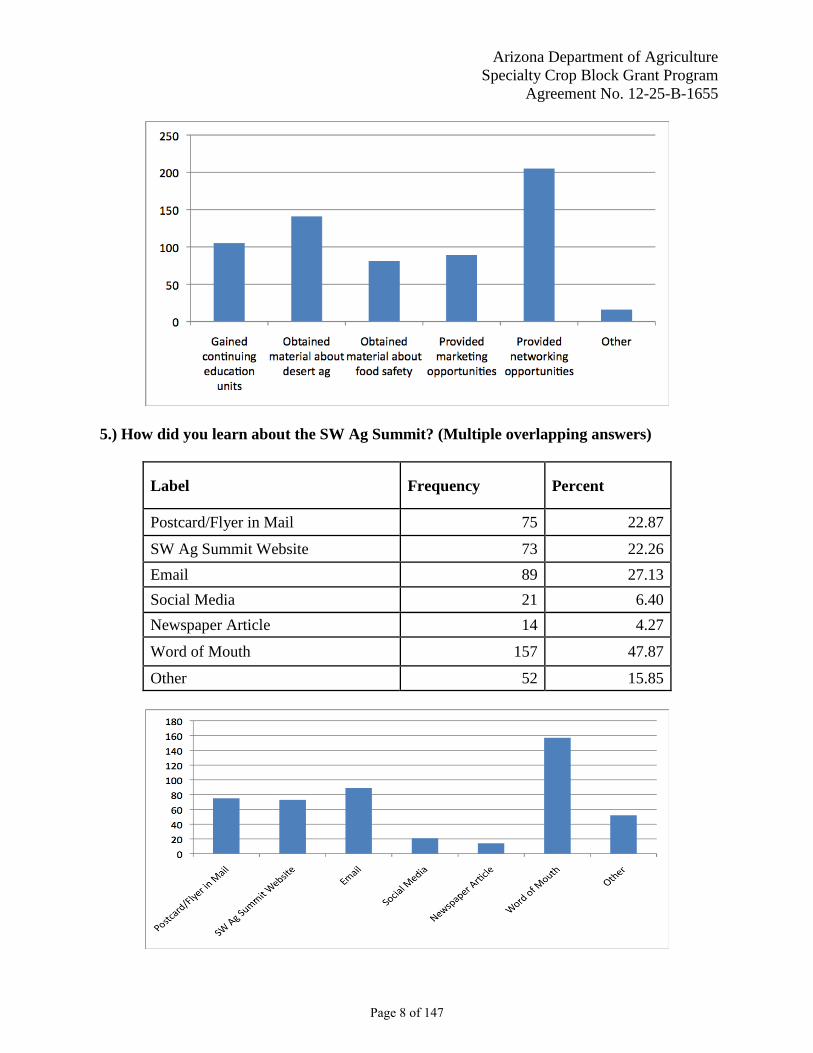
5.) How did you learn about the SW Ag Summit? (Multiple overlapping answers)
Label Frequency Percent
Postcard/Flyer in Mail 75 22.87
SW Ag Summit Website 73 22.26
Email 89 27.13
Social Media 21 6.40
Newspaper Article 14 4.27
Word of Mouth 157 47.87
Other 52 15.85
Page 8 of 147
Arizona Department of Agriculture
Specialty Crop Block Grant Program
Agreement No. 12-25-B-1655
We have always felt that another mark of success is if they leave the summit and share
information learned at the Summit then we are expanding our value on a secondary group. Of
course the real proof would be if the secondary market starts showing up at the next conference
and becomes part of our primary market. The fact that our attendees signed up in advance I
would say that this is a very good indicator that we are doing just that.
6.) How likely are you to share information you obtained from the SW Ag Summit with
others?
Distribution of answers from “1 Less Likely” to 5 “Very Likely”
Information Sharing
Mean 4.40
Standard Error 0.04
Median 5.00
Mode 5.00
Standard Deviation 0.78
Sample Variance 0.60
Kurtosis 2.35
Skewness -1.43
Range 4
Minimum 1
Maximum 5
Sum 1439
Count 327
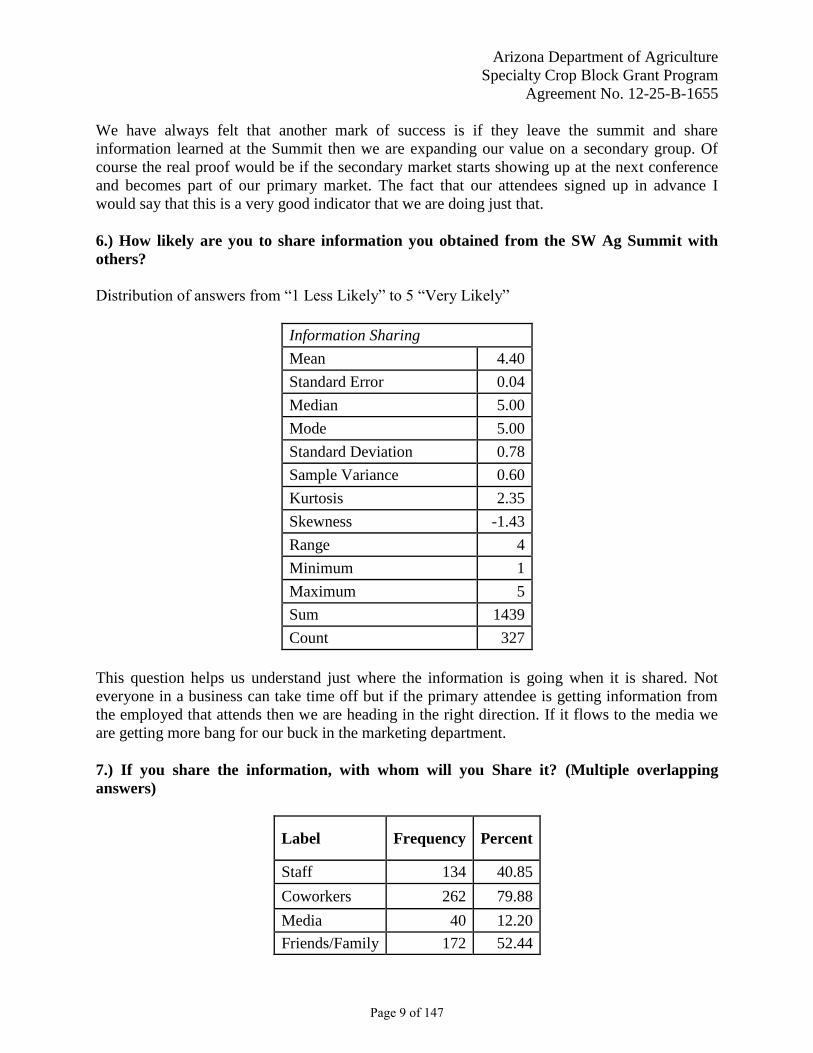
This question helps us understand just where the information is going when it is shared. Not
everyone in a business can take time off but if the primary attendee is getting information from
the employed that attends then we are heading in the right direction. If it flows to the media we
are getting more bang for our buck in the marketing department.
7.) If you share the information, with whom will you Share it? (Multiple overlapping
answers)
Label Frequency Percent
Staff 134 40.85
Coworkers 262 79.88
Media 40 12.20
Friends/Family 172 52.44
Page 9 of 147
Arizona Department of Agriculture
Specialty Crop Block Grant Program
Agreement No. 12-25-B-1655
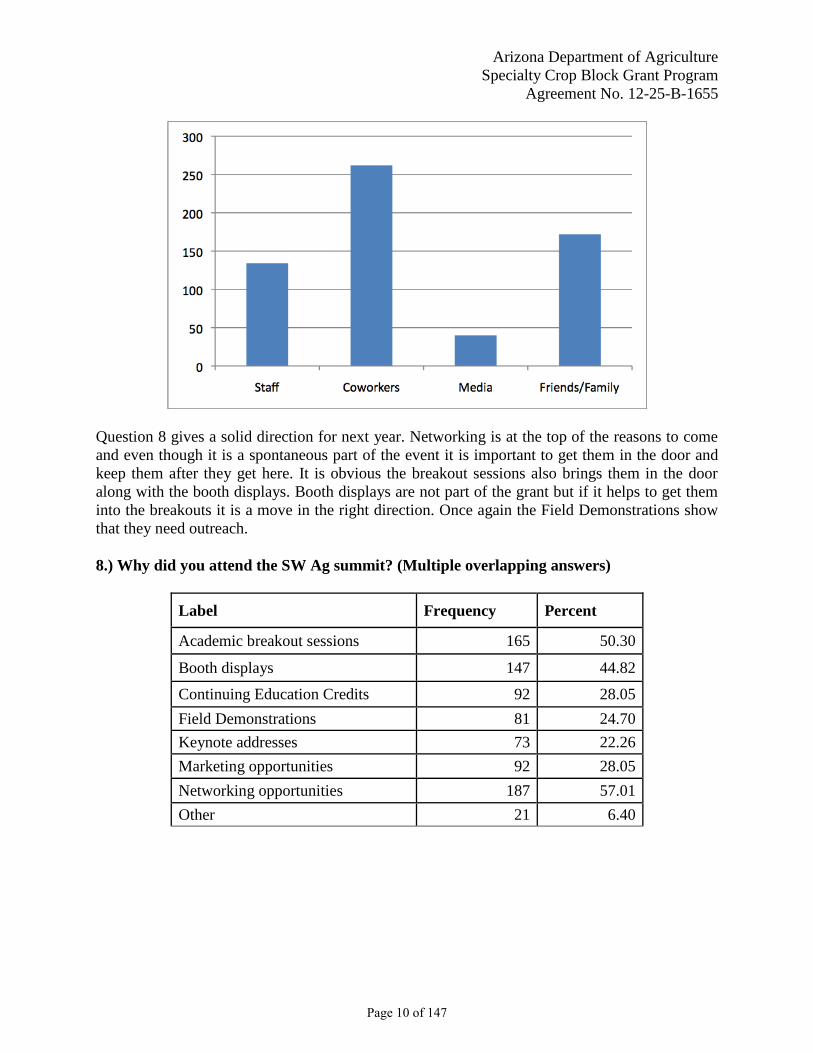
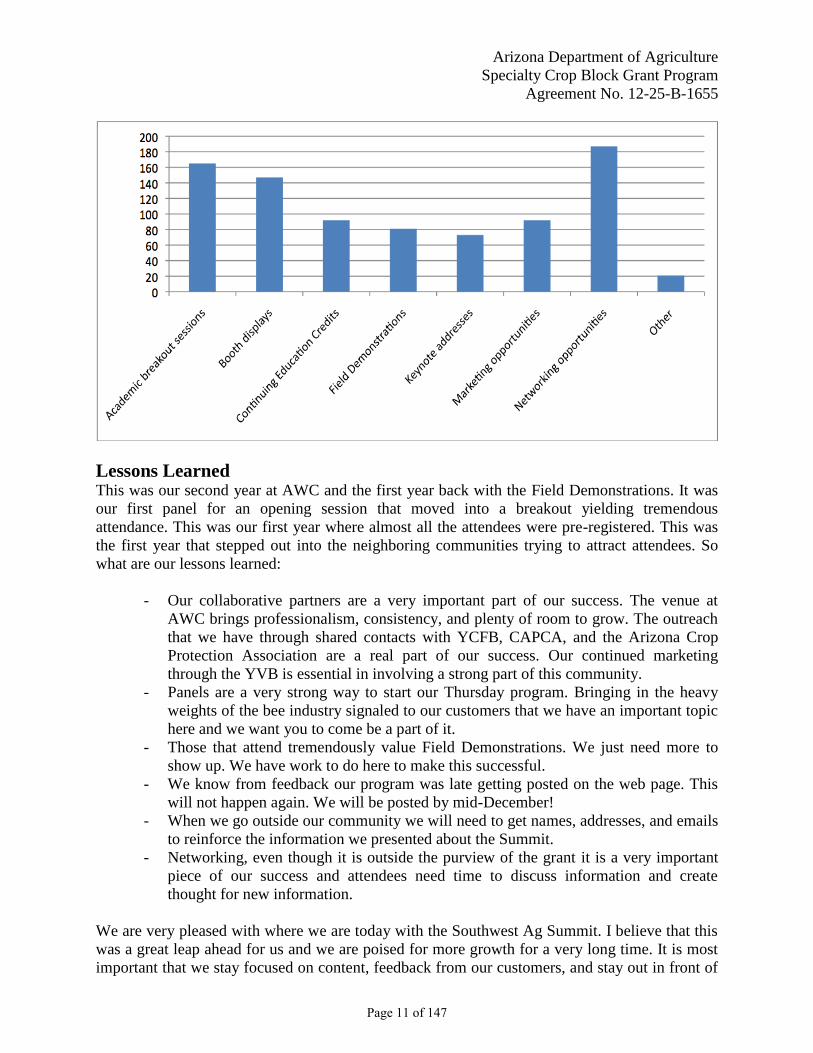
Question 8 gives a solid direction for next year. Networking is at the top of the reasons to come
and even though it is a spontaneous part of the event it is important to get them in the door and
keep them after they get here. It is obvious the breakout sessions also brings them in the door
along with the booth displays. Booth displays are not part of the grant but if it helps to get them
into the breakouts it is a move in the right direction. Once again the Field Demonstrations show
that they need outreach.
8.) Why did you attend the SW Ag summit? (Multiple overlapping answers)
Label Frequency Percent
Academic breakout sessions 165 50.30
Booth displays 147 44.82
Continuing Education Credits 92 28.05
Field Demonstrations 81 24.70
Keynote addresses 73 22.26
Marketing opportunities 92 28.05
Networking opportunities 187 57.01
Other 21 6.40
Page 10 of 147
Arizona Department of Agriculture
Specialty Crop Block Grant Program
Agreement No. 12-25-B-1655
Lessons Learned This was our second year at AWC and the first year back with the Field Demonstrations. It was
our first panel for an opening session that moved into a breakout yielding tremendous
attendance. This was our first year where almost all the attendees were pre-registered. This was
the first year that stepped out into the neighboring communities trying to attract attendees. So
what are our lessons learned:
- Our collaborative partners are a very important part of our success. The venue at
AWC brings professionalism, consistency, and plenty of room to grow. The outreach
that we have through shared contacts with YCFB, CAPCA, and the Arizona Crop
Protection Association are a real part of our success. Our continued marketing
through the YVB is essential in involving a strong part of this community.
- Panels are a very strong way to start our Thursday program. Bringing in the heavy
weights of the bee industry signaled to our customers that we have an important topic
here and we want you to come be a part of it.
- Those that attend tremendously value Field Demonstrations. We just need more to
show up. We have work to do here to make this successful.
- We know from feedback our program was late getting posted on the web page. This
will not happen again. We will be posted by mid-December!
- When we go outside our community we will need to get names, addresses, and emails
to reinforce the information we presented about the Summit.
- Networking, even though it is outside the purview of the grant it is a very important
piece of our success and attendees need time to discuss information and create
thought for new information.
We are very pleased with where we are today with the Southwest Ag Summit. I believe that this
was a great leap ahead for us and we are poised for more growth for a very long time. It is most
important that we stay focused on content, feedback from our customers, and stay out in front of
Page 11 of 147
Arizona Department of Agriculture
Specialty Crop Block Grant Program
Agreement No. 12-25-B-1655
our issues that continue to arise in the production of specialty crops. This project enhances the
competitiveness of specialty crops which leads to their increased consumption.
Contact Person Bruce Gwynn
Southwest Ag Summit Director
(928) 503-2003
Additional Information Gross program income attributed to specialty crops is estimated at $47,228.00 and comes from
registration fees and sponsors. Gross income is utilized to fund expenses not covered by the
Specialty Crop Block Grant such as $14,780 for meals for the day and half event and another
$15,340 to cover other costs also not covered by the grant. The estimated net program income for
the 2014 SWAS of $16,694 will be reinvested into the 2015 SWAS helping us to sustain
Southwest Ag Summits goal to further improve the competitiveness of the Arizona specialty
crop business. We do this by educating growers and industry members alike on emerging and
upcoming challenges.
Arizona Specialty Crop Reference Guide (Updates 2016) This project was completed on December 31, 20162
Project Summary On August 5, 2016 the specialty crop guide project was approved by AMS and added to the State
Plan.
The Purpose of this project was to update and reproduce an
educational reference guide for consumers which included:
Where our fruits, vegetables and plants come from and
the benefits reaped from buying Arizona grown produce
and plants
Directory of Farmer’s Markets, U-Pick Farms and
Vineyards throughout Arizona
Listing of Arizona Specialty Crop availability by season
Food safety information for fruits and vegetables (What’s
being done and what consumers can do)
The Department printed 5,000 Specialty Crop Guides in the
2006-2007 grant cycles and 9,900 in the FB2010 grant cycle.
The ADA updated and printed an additional 21,500 copies at
the end of the FB2009 and approximately 20,000 at the end of
the FB2011 grant cycles. The guide was well-received among
2 This completion date is based on the final delivery of the guides. However, funds for this project were encumbered
in our accounting system prior to September 30, 2016.
Page 12 of 147
Arizona Department of Agriculture
Specialty Crop Block Grant Program
Agreement No. 12-25-B-1655
the public and therefore a request was made to update and re-print the guide. The information in
the previous guide was reviewed, updated and sent to the design company for printing. The
Arizona Specialty Crop Guide will increase consumer awareness and consumption of Arizona
specialty crops through its distribution at county libraries, cooperative extension offices, and
various agricultural events.
Project Approach In August of 2016, the SCBGP Program Coordinator began the process of updating the previous
version of the Arizona Specialty Crop Guide. Revisions were made based on the most current
information available at the time.
Also, in August of 2016, the Department entered into a contract with Esser Design to make the
revisions and print approximately 25,000 copies of the updated guide. The new guides were
delivered to the Department in December of 2016. Distribution of the guides began immediately,
with drop shipments to libraries and extension offices (statewide) sent directly from the printer.
Included in the guide is a request for recipients to complete an online survey to determine the
increase in awareness of specialty crops. The survey questions are designed to determine the
change in attitudes, awareness, and consumption of Arizona Specialty crops resulting from the
information obtained in the guide. The guide and survey link will be available on the Arizona
Grown website, www.azgrown.org.
On December 12, 2016 the guide was posted to the ADA’s website and is currently in progress
of being posted on the Arizona Grown website.
Goals and Outcomes Achieved Our goal is to reach approximately 57,500 Arizona consumers by distributing approximately
25,000 guides. To date 14,000 guides have been distributed to Public Libraries (statewide) and
University Cooperative Extension Offices (statewide). With this distribution we will have
reached half our goal over the next few months by reaching more than 32,000 Arizona
consumers (based on average readership per copy of 2.3). During the next two years guides will
be distributed to various events, conferences and meetings (statewide) to reach and hopefully
surpass our overall goal.
We anticipate that 85% of the new survey participates will demonstrate an increased awareness
of Arizona specialty crops and other useful information in the guide. Our previous sample survey
indicated that 47 of 51 participants had an increased awareness of Arizona specialty crops.
Previous survey data will be compared with new survey data to confirm that responses are from
new survey participants. Results from this survey will be included in a supplemental report in
March 2017 and posted on the Arizona Grown website.
Lessons Learned There were no specific lessons learned regarding this project.
Page 13 of 147
Arizona Department of Agriculture
Specialty Crop Block Grant Program
Agreement No. 12-25-B-1655
Contact Persons Ashley Estes
602-542-0972
Lisa James
602-542-3262
Continuation of GHP/GAP Certification Training and Promotion
Program This project was completed on September 30, 2016
Project Summary The University of Arizona, Yuma County Cooperative Extension, in collaboration with the
Arizona Department of Agriculture, Agricultural Consultation and Training (ACT) Program,
continued the development and implementation of the USDA, GHP/GAP Training Program for
Arizona specialty crop producers from October 2013 through September 2016. The focus of the
training program provides workshop participants a means to initiate the USDA, GHP/GAP
certification process and adhere to the recommendations made in the Food and Drug
Administration’s Guide to Minimize Microbial Food Safety Hazards for Fresh Fruits and
Vegetables.
The outreach curriculum, initially established in 2011, has grown from a piloted commercial
producer, Yuma-based focus into a program that covers many Producers/Growers, Distributors,
Wholesalers, and Handlers throughout Arizona. Since its inception, over 400 participants have
taken advantage of the program.
Project Approach
As a means to mitigate food safety risks by implementing an Arizona GHP/GAP training
program, the project continues to design, develop and implement the GHP/GAP training
curriculum for commercial growers, shippers, coolers, distributers and warehouses within
Arizona. The development of the curriculum was based on the USDA GHP/GAP audit itself,
and was segmented into 7 key food safety aspects that covered crop growing, harvesting,
processing, storage, traceability, warehousing and security. A series of 10, Arizona GHP/GAP
training workshops were conducted during the funding period (October, 2013 – September,
2016). During this period, 282 workshop participants were provided with a collection of user-
friendly templates which include records, documents and policies which enable users to fully
implement a GHP/GAP food safety plan and begin the process of record keeping and
certification. The Arizona Department of Agriculture, Agriculture Consultation and Training
(ACT) is a key collaborative component of the program, providing a program liaison (Mr.
Stewart Jacobson) who initiates follow-up, guidance and consultation for participants after the
training as they begin the process of gaining USDA certification.
Page 14 of 147
Arizona Department of Agriculture
Specialty Crop Block Grant Program
Agreement No. 12-25-B-1655
D. Project Activities
YEAR 1 (10/2013 – 9/2014)
a. First Quarter (Oct. 2013 – Dec. 2013) Activities:
An Instructional Specialist (Karen Edwards) was hired on 1 October on an
as-needed basis.
A GHP/GAP refresher was delivered on 3 October to 22 fresh produce
warehouse operators in Nogales, Arizona.
b. Second Quarter (Jan. 2014 – Mar. 2014) Activities:
None
c. Third Quarter (Apr. 2014 – Jun. 2014) Activities:
A GHP/GAP training workshop was conducted in Prescott, Arizona
(Yavapai County) on April 29, 2014. There were 21 workshop attendees.
Currently, there are 19 GHP/GAP certified growers/handlers/shippers in
Arizona
d. Fourth Quarter (Jul. 2014 – Sept. 2014) Activities:
A Group GHP/GAP exploratory meeting was held in Prescott, AZ
(Yavapai County) on August 12, with 15 attendees.
YEAR 2 (10/2014 – 9/2015)
a. First Quarter (Oct. 2014 – Dec. 2014) Activities:
A Group GAP planning meeting was held in Phoenix on November 3,
2014. Attending were Kurt Nolte (University of Arizona), Stewart
Jacobson (Arizona Department of Agriculture), Brett Cameron (Arizona
Department of Agriculture), Katrin Themlitz (Yavapai County, AZ
Farmers Market Coordinator) and Mike O’Conner (Yavapai County
Grower). The purpose of the meeting was to review the agenda and
discuss format for the November 11, 2014 upcoming formal Group GAP
meeting in Prescott (11/12/2014).
A Yavapai County Group GAP meeting was held in the University of
Arizona Cooperative Extension, Yavapai County office on November 12,
2012. Details of the meeting are included in Appendix A. A draft Group
GAP Quality Management System was developed as a result of the
meeting, and is included in Appendix B.
b. Second Quarter (Jan. 2015 – Mar. 2015) Activities:
A GHP/GAP overview and lecture was provided to 125 attendees during
the Greenhouse Crop Production and Engineering Design Short Course in
Tucson on March 25, 2015.
A GHP/GAP training workshop was conducted in Phoenix, Arizona
(Maricopa County) on March 26, 2015. There were 23 workshop
attendees.
Currently, there are 16 GHP/GAP certified growers/handlers/shippers in
Arizona
A Fresh Produce Safety Conference was held in Yuma, Arizona on March
31, 2015, 110 growers, shippers and handlers were in attendance. A 1-
hour, morning breakout session, spearheaded by Mr. Stewart Jacobson
(Fresh Produce Safety, Arizona Department of Agriculture), featured an
Page 15 of 147
Arizona Department of Agriculture
Specialty Crop Block Grant Program
Agreement No. 12-25-B-1655
overview of the GHP/GAP program in Arizona (Lodging Reimbursement
Requested). An afternoon, hands-on field training session was held at the
University of Arizona, Yuma Agricultural Center that focused on field
level risk assessment from an auditor perspective. Mr. Jacobson and Mr.
Larry Bender (Arizona Department of Agriculture) conducted the
afternoon session, 65 attendees.
The Yavapai County Group GAP dialog continued, with representatives
from the USDA-AMS and the Wallace Center providing full support and
partial funding for the Arizona Group GAP effort.
c. Third Quarter (Apr. 2015 – Jun. 2015) Activities:
The Yavapai County Group GAP project continues, with the development
of the Quality Management System being edited.
A second AZ Group GAP effort is being organized in Central Arizona
(Phoenix) which is being facilitated by Kurt Nolte (UA) and Stewart
Jacobson (ADA).
No USDA GHP/GAP training workshops were conducted during this
quarter.
d. Fourth Quarter (Jul. 2015 – Sept. 2015) Activities:
The Yavapai County Group GAP project has been put on hold for the time
being due to internal group concerns.
A second AZ Group GAP effort is being organized in Central Arizona
(Phoenix) which is being facilitated by Stewart Jacobson (ADA) and Kurt
Nolte (UA). The Central Arizona Group GAP, Quality Management
System has been submitted to AMS for review.
No USDA GHP/GAP training workshops were conducted during this
quarter.
An Oral Presentation was made at the American Society for Horticultural
Science annual conference, August 7, 2015 in New Orleans, LA. The
session abstract listed in Appendix A of the 2015, fourth quarter report.
YEAR 3 (10/2015 – 9/2016)
a. First Quarter (Oct. 2015 – Dec. 2015) Activities:
The “Grown in Arizona,” Group GAP (GGAP), Quality Management Plan
was submitted to the USDA AMS for internal review during Quarter 3 of this
project.
After the review, the USDA AMS (Ms. Donna Burke-Fonda) provided
feedback via a report, and mentioned that Grown in Arizona has a great
platform for the further development.
Grown in AZ is taking the necessary next steps in preparation for participation
in the USDA GroupGAP Program. Ms. Burke-Fonda suggesting developing a
collaboration with the Wallace Center while the USDA finishes the
development of the GroupGAP Program.
It was suggested that Grown in AZ participate in the Community of Practice,
and in training that the USDA has provided for GroupGAP pilot groups.
USDA will provide guidance which will include information on how to
transition from a Pilot to the official Program.
Page 16 of 147
Arizona Department of Agriculture
Specialty Crop Block Grant Program
Agreement No. 12-25-B-1655
The GGAP program would be the first of its kind in Arizona.
b. Second Quarter (Jan. 2016 – Mar. 2016) Activities:
Traveled to Salt Lake City, Utah with Mr. Stewart Jacobson (Arizona
Department of Agriculture) to promote the Arizona USDA GHP/GAP training
curriculum at an annual production meeting on February 17, 2016. The trip
was fully funded by Utah State University.
A GHP/GAP overview and lecture was provided to 136 attendees during the
Greenhouse Crop Production and Engineering Design Short Course in Tucson
on March 23, 2016.
c. Third and Fourth Quarters (Apr. 2016 – Sept. 2016) Activities:
No USDA GHP/GAP training workshops were conducted during this quarter.
5 GHP/GAP students participated in the online GHP/GAP training sessions.
Goals and Outcomes Achieved Workshop Participation and USDA Certified GHP/GAP Producers
A total of 282 people participated in the 2013 -2016 training program, the bulk of which were
identified as small Arizona specialty crop producers. Regions within Arizona which specifically
requested and received GHP/GAP training included, Maricopa, Nogales, Prescott, Tucson,
Yuma, and the Greater Phoenix area.
The overall goal of the project is to increase the number of specialty crop growers
certified/approved by the USDA as being in compliance with the GHP/GAP guidelines. As a
result of the program, 24 producers have successfully passed GHP/GAP audits during the
funding period and are currently USDA certified, essentially a 50% overall increase since the
beginning of the project.
One of the instrumental outcomes of the current project involved the development of the Arizona
Group GAP compliance program. This is a result of the significant areas of expertise and
dedication from the Arizona Department of Agriculture and University of Arizona staff to
implement and direct the Arizona Group GAP program. Moreover, the development and
evolution of food hubs, innovative businesses whose role is to mediate between small- and mid-
scale farmer needs and those of buyers, including larger institutional, retail, and food service
buyers, has showcased the need for the Group GAP Certificate Program. One of the most
important strategies to emerge from worldwide efforts to address market requirements for third
party GAP verification is the cooperative or “group approach” to food safety, based on the
Quality Management System (QMS) methodology of ISO 9000, in which a group of farms
develop shared standard quality and operating procedures and are audited as one body. And, our
initial findings suggest that the overall collaboration of multiple entities, agencies, and
stakeholders are needed to support the development and implementation of a USDA AMS Group
GAP certification.
Publications
Rivadeneira, P, KJ Renick, E Malott, J McLain, KD Nolte and CM Rock. 2016. The Southwest
Arizona Track and Scat Glovebox Guide. University of Arizona, College of Agricultural and
Life Sciences. URL: http://cals-mac.arizona.edu/sites/cals-
bigmac/files/track_and_scat_glovebox_guide.pdf.
Page 17 of 147
Arizona Department of Agriculture
Specialty Crop Block Grant Program
Agreement No. 12-25-B-1655
Nolte, KD. 2016. The 10 Year Anniversary of Intensive Field Level Fresh Produce Safety
Programming in Arizona: What Works and What Doesn’t (HortScience, Abstr.accepted).
Nolte, KD, CM Rock, P Kahn-Rivadeneira and S Jacobson. 2015. Initiating a Group GAP,
Fresh Produce Safety Certification Program in Arizona. HortScience 50(9):S195 (Abstr.)
Carr, D, KJ Renick, E Malott, P Rivadeneira, JT McLean, KD Nolte, CM Rock, K Edwards and
G Andrejko. 2015. The Southwest Arizona Track and Scat Glovebox Guide. College of
Agriculture and Life Sciences, University of Arizona.
Bond, R, M Partyka, P Aminabadi, CM Rock, KD Nolte, E Atwill, R Bond and M Jay-Russell.
2014. Evaluation of Indicator Escherichia coli, Fecal Coliforms, E coli O157 and Salmonella
spp. in Surface Waters of the Southwest Desert Canal Network. Abstract published in the
proceedings of the 2014 International Association for Food Protection, Indianapolis, IN, No. P1-
140.
Brassill, N, K Bright, A Tamimi, KD Nolte, C Gerba and CM Rock. 2014. The Assessment of
Escherichia coli as an Indicator of Microbial Quality of Irrigation Waters Used for Produce.
Abstract published in the proceedings of the 2014 International Association for Food Protection,
Indianapolis, IN, No. P1-19.
Renick, K, RM Foor and KD Nolte. 2013. Continuing Agricultural Education: Relationship
between Adult Learning Styles and Educational Delivery Method Preferences. HortScience
48(9):S203. (Abstr.)
Nolte, KD, S Jacobson, B Cameron. 2013. The Arizona Good Agricultural Practices / Good
Handling Practices Certification Program. URL: http://cals.arizona.edu/fps/GAP-Training
Nolte, KD. 2013. Fresh Produce Safety Outreach Programs. URLs:
https://www.facebook.com/FoodSafety101; https://twitter.com/FreshFoodSafety;
https://youtube.com/user/FreshProduceSafety?feature=mhee
Beneficiaries The GHP/GAP training program rapidly grew into a statewide curricula designed for large and
small specialty crop producers. The number and nature of GHP/GAP participants in workshops
across the state suggests that the program has had a greater reach in Arizona than originally
assumed. While specialty crop growers, processors and distributors continue to be a central
focus, the numbers of smaller growers seeking a means of satisfying the Arizona Approved
Source requirements have shown interest in becoming GHP/GAP certified. This is in addition to
Arizona school garden programs, some farmers markets as they too are interested in coordinating
and implementing food safety standards within their regions or counties.
Lessons Learned Assessing the GHP/GAP Training and Certification Program
Since the GHP/GAP training program was initiated, we understand that the number of specialty
crop producers completing certification have not necessarily reached our anticipated
expectations. As a result, program follow-up assessments were conducted during June/July,
2016, that involved all GHP/GAP workshop participants to date. Assessment findings continue
to suggest:
1. GHP/GAP programming indicates that Arizona growers participating in workshops are
gaining a greater understanding of good growing and handling practices.
Page 18 of 147
Arizona Department of Agriculture
Specialty Crop Block Grant Program
Agreement No. 12-25-B-1655
2. Activities that some small Arizona growers are most commonly pursuing are
participating in GHP/GAP training, writing some form of a food safety plan, and making
convenient on-farm food safety modifications.
3. Knowledge in GHP/GAP is not necessarily leading to behavior change in the form of
USDA GHP/GAP certification. Change is primarily occurring among growers when they
are required by those buying their produce to provide evidence of on-farm food safety
practices.
4. Growers reported that the primary reason they did not carry out any of these GAP
behaviors is that they are not required to do so, indicating that the external expectations
of produce buyers is currently the primary driver in generating grower behaviors. Time,
money, and the technical complexity of requirements are also viewed as barriers to
implementation.
In this light, we anticipate continued, and greater involvement from the Arizona Department of
Health Services and County Health Departments in Arizona who are key in supporting approved
food sourcing in Arizona for large and small buyers of specialty crops. We feel that extended
outreach from their perspective, and others, will enhance the culture and awareness of Arizona
food safety and increase those that either seek certification or actual certification completers.
Contact Person Dr. Kurt D. Nolte
University of Arizona
928-726-3904
Continuation of GHP/GAP Certification Cost-Share Program - 2014 This project was completed on September 30, 2016
Project Summary
On October 30, 2014 the GHP/GAP Cost Share Program was approved by AMS and added to
the State Plan. As of September 30, 2016 fourteen cost share applications had been received and
processed.
There is an increased demand for buyers and consumers of specialty crop products for
independent verification and certification that producers and other fresh produce handlers are
following Good Handling Practices (GHP) and Good Agricultural Practices (GAP) to improve
food safety. The University of Arizona , Yuma County Cooperative Extension and the Arizona
Department of Agriculture, Agricultural Consultation and Training ACT) Program have
collaborated in an effort to implement a USDA GHP/GAP cost-share program to assist Arizona
specialty crop producers/growers, distributors, wholesalers and handlers with the costs of
GHP/GAP certification. Although budget adjustments were necessary due to less than
anticipated audit costs and number of applications, the program itself, which began in October
2010 has been successful.
Project Approach The purpose of this program was to offer and provide a certification fee, cost share
reimbursement program for fresh fruit and vegetable producer’s distributors, wholesalers and
Page 19 of 147

Arizona Department of Agriculture
Specialty Crop Block Grant Program
Agreement No. 12-25-B-1655
handlers that become USDA GHP/GAP certified. This cost share program would provide
assistance to those producers looking for a jump-start in addressing food safety.
The cost share program was promoted by staff during GHP/GAP trainings where presentations
were made. A total of 282 people participated in the 2013 -2016 training program, the bulk of
which were identified as small Arizona specialty crop producers. Staff attended several industry
events, where specialty crop producers were present, to speak with individuals and promote the
program to eligible participants. Staff also regularly checked the USDA audit program website
for potential applicants who had completed a GHP/GAP audit and would qualify for the cost
share program. Letters were sent to these potential applicants informing them of their eligibility
and encouraging them to participate in the GHP/GAP cost share program. The program was
promoted on the ADA’s website as well as the University of Arizona’s Fresh Produce Safety
website.
Once an applicant became GHP/GAP certified they would submit a GHP/GAP application
(Appendix C) to the ADA. ADA staff would then review the application for completeness. If
any required documentation was missing staff would contact the applicant requesting that the
missing documentation be submitted. Once all documentation was received and verified by staff
the application was submitted to the ADA’s accounting office for payment.
Goals and Outcomes Achieved
The goal of this project was to increase the number of GHP/GAP audit participants who would in
turn participate in the cost-share program to reduce their audit costs.
Cost-share applications for this funding cycle began in February 2015 following the amendment
to the State Plan in October 2014. During the nearly 2-year period of the FB2013 funding we
received 14 applications. At least five of the fourteen applicants had participated in the
GHP/GAP training provided by the UofA and the Specialty Crop Program. There were also five
applicants that were new to the cost-share program which reflects an increase of 20% in
participation. Unfortunately, the increase fell short of the goal of 25% increase in participation.
Knowledge in GHP/GAP is not necessarily leading to behavior change in the form of USDA
GHP/GAP certification. Change is primarily occurring among growers when they are required
by those buying their produce to provide evidence of on-farm food safety practices.
Based on a program assessment conducted by the GHP/GAP Training Program Coordinators,
“growers reported that the primary reason they did not carry out any of these GAP behaviors is
that they are not required to do so, indicating that the external expectations of produce buyers is
currently the primary driver in generating grower behaviors. Time, money, and the technical
complexity of requirements are also viewed as barriers to implementation.”
Beneficiaries A total of 14 specialty crop producers, distributors, wholesaler and handlers benefited, by
reduced audit costs, and maintaining or increasing their market share. The economic benefit to
fresh fruit and vegetable producers was reduced costs for implementing a GHP/GAP program
Page 20 of 147
Arizona Department of Agriculture
Specialty Crop Block Grant Program
Agreement No. 12-25-B-1655
and maintaining profitability by meeting (what was understood to be buyer demands for)
GHP/GAP implementation.
GHP/GAP Cost-Share applicants were reimbursed an average of $378.00 per audit.
More than 250 specialty crop producers, distributors, wholesaler and handlers benefited from
attending a GHP/ GAP training where they received information on the GHP/GAP cost share
program and the benefit to becoming GHP/GAP certified.
Lessons Learned It is anticipated that until GHP/GAP certification becomes mandatory, this program will remain
underutilized. However, that does not take away from the importance of the program.
Contact Person Lisa James
602-542-3262
Edible School Gardens This project was completed on September 30, 2015
Project Summary Today’s children may be the first generation of Americans whose life expectancy will be shorter
than that of their parents. Seventy-five percent (75%) of Americans eat less than two servings of
fruits and vegetables per day. Connecting people to their food source and educating them about
the importance including 5 – 13 servings of nutritious fruits, vegetables and nuts into their diet –
every day – is paramount to arresting this unhealthy trend.
The purpose of this project is to create 50 edible school gardens in Arizona in order to provide
access to fruits and vegetables, teach children the importance of good nutrition and increase the
demand for specialty crops.
Project Approach Western Growers Foundation (WGF) worked with Arizona Department of Education (ADE) to
promote the grant opportunity to K-12 schools throughout the state via email. WGF received 74
completed applications for the grant and chose 50 grant winners. Those grant winners were
provided with a grant check for $1,500 each plus a copy of Arizona Gardens for Learning book,
Producepedia bookmarks and seed packets to get the gardens started. WGF was in regular
contact with several of the grant recipients via social media, CSGN.org and email and received
status updates as well as photos of the edible garden projects. WGF visited Ingleside Middle
School and wrote a story about the visit http://www.csgn.org/news/selling-back-sustainability
and earned media coverage.
http://www.yumasun.com/news/somerton-district-seeks-more-well-rounded-education-for-
students/article_dfb3450e-9467-11e4-9281-0fb5c2b01009.html
Page 21 of 147
Arizona Department of Agriculture
Specialty Crop Block Grant Program
Agreement No. 12-25-B-1655
http://www.prweb.com/releases/2014/02/prweb11593951.htm
At the end of the grant project period, grant recipients were asked to provide receipts of all
purchases made with grant funds, photos and to complete an online survey. According to the
survey submissions, at least 8,138 students participated in the gardens established through
planting, tending, harvesting, taste testing and seed saving.
The budget projected a cost of $750 to spend on printing books to provide to the schools which
was ultimately not needed due to a surplus from a previous printing of books. The surplus funds
were mistakenly overlooked until the end of the grant and were not needed or used.
Goals and Outcomes Achieved
The goals of this project were to create 50 edible school gardens and increase the number of
children with an understanding of good nutrition and where food comes from. WGF was able to
meet the goal of 50 edible school gardens by giving out 50 $1,500 grants to K-12 schools in
Arizona. The other project goal was largely successful with over 8,000 students involved in these
edible gardens. Of the 8,000 students the teachers and/or garden coordinators reported that on
average 95% of them; (1) understood where their food comes from after participating in the
garden; and (2) had at least one favorite specialty crop as a result of their garden involvement.
In addition to meeting the project goals, WGF was able to collect some valuable and interesting
statistics about the use of these edible gardens. According to the survey submissions, WGF found
that 100% of the schools used their garden to teach science lessons. Additionally, the gardens
were used to teach math (83%), literature (51%), art (46%), cooking (34%) and history (26%)
among other subjects.
Beneficiaries Specialty crops planted at the edible school gardens included lettuce, tomatoes, cabbage,
broccoli, carrots, watermelons, sweet corn, kale and herbs – among many other specialty crops.
WGF believes that all Arizona specialty crop farmers benefit when consumers learn about how
their food is grown and the importance of good nutrition, those farmers who grow the crops
featured at these school gardens especially benefited. There are at least thirty-nine Arizona
specialty crop farmers who grow the crops listed above.
Arizonans, who, by learning from the garden, increase their consumption of fruits and vegetables
and thereby improving their health.
Lessons Learned School gardens can be incorporated into the curriculum for various subjects beyond the obvious
subject, science. It was surprising how many schools were utilizing the garden to teach lessons in
multiple subjects considering that requires buy-in from multiple teachers. WGF has found that
the interest and need for school gardens is continuing to grow and is benefiting the children
through physical activity and healthier eating habits in addition to the educational aspect.
Page 22 of 147
Arizona Department of Agriculture
Specialty Crop Block Grant Program
Agreement No. 12-25-B-1655
Contact Person Sabrina Blair
Western Growers Foundation
949-885-4789
Fruit and Vegetable Learning Garden Phase II This project was completed on September 30, 2015
Project Summary Today’s children may be the first generation of Americans whose life expectancy will be shorter
than that of their parents. Seventy-five percent (75%) of Americans eat less than two servings of
fruits and vegetables per day. Connecting people to their food source and educating them about
the importance including 5 – 13 servings of nutritious fruits, vegetables and nuts into their diet –
every day – is paramount to arresting this unhealthy trend.
The purpose of this project is to sustain the Fruit and Veggie Garden and provide enhanced
experiences that connect for all Arizonans – children and adults, residents and tourists – visiting
the zoo. During Phase II composting and worm bins were installed to educate visitors about
sustainability and the full life cycle of a plant. Animal resistant fencing and netting was installed
to keep feral vermin from eating the growing produce. Lesson cards were created and distributed
to visitors to teach them about composting in conjunction with the worm and compost bins.
Lastly, an educational video was produced to teach visitors about Arizona farmers. The video
plays on a loop daily next to the garden and is also viewable on the Producepedia website,
http://www.producepedia.com/content/meet-arizona-farmers.
Project Approach After significant planning, scheduling, and budget modifications, Phase II of the garden was
completed and included: worm and composting bins, benches, animal resistant fencing and
netting over garden beds, planting of seasonal specialty crop plants and new signage for the
garden as well as educational signs in each garden bed. In addition to the physical additions,
2,500 lesson cards were also created and distributed to help educate visitors on composting.
Producepedia bookmarks continued to be distributed totaling approximately 120,000 pieces over
the grant project period. Due to revised plans, the construction timeline was extended and
installation was completed between February 1, 2014 and September 30, 2015 by various
vendors such as Desert Earth Works, EPS and in-kind man hours from the Zoo, Western
Growers Foundation and Rousseau Farming. The project was overseen by EPS, the Zoo’s VP of
Operations and WGF’s VP of Marketing and Senior Marketing Coordinator.
Rousseau Farming was an integral part of this project. Rousseau Farming guided the project,
contributed staff to the Farmer Talks, funded additional construction and donated plants, seeds
and volunteers to help the Zoo’s horticulturist manage the garden.
Western Growers Foundation staff managed the project, set meetings, due dates and worked with
the landscape architect.
Page 23 of 147
Arizona Department of Agriculture
Specialty Crop Block Grant Program
Agreement No. 12-25-B-1655
There were several challenges with this grant project: (1) key personnel changes at Western
Growers Foundation when the VP of Marketing for WGF left the company at the beginning of
the last quarter, leaving the Senior Marketing Coordinator for WGF to get up to speed on the
project and ensure timeliness and completion of the grant project; (2) the excess supply of
Producepedia bookmarks and a dramatically lesser cost for lesson cards opened up a large
portion of the budget to be reallocated; (3) with the new budget and subsequent construction in
the garden itself lead the Zoo and Rousseau Farming to enlarge their plans for the space which
meant increasing the project budget which was supplemented by Rousseau Farming.
Goals and Outcomes Achieved On August 27, 2015, AMS approved a revised Expected Measurable Outcome for this project.
The goal of this project was to sustain the Zoo’s Fruit and Vegetable Learning Garden and
provide enhanced experiences that connect Zoo visitors with Arizona specialty crop farming and
teaches the importance of eating fruits and vegetables. The Learning Garden was sustained and
enhanced through the installation of worm and compost bins, benches, animal resistance fencing
and netting to protect the garden crops and signage around the garden. The visitor experiences
were enhanced through the Farmer Talks to educate local students on specialty crop farming in
Arizona.
The Zoo handed out over 200 survey cards to student visitors (See samples in Appendix D)
during the 5 Farmer Visits. The survey included the following questions:
Name the farmer you just met and what they grow.
Where is his/her farm located?
Name three fruits or vegetables grown in AZ.
What are three career positions available in AZ specialty crop farming?
What are some of your favorite fruits or vegetables and how do you like to prepare/eat
them?
The survey cards were collected and data was compiled to measure awareness of specialty crop
farming in Arizona. The goal was to have 80% of surveyed students would be able to; (1) name
at least three fruits or vegetables grown in Arizona; and/or (2) name three careers in Arizona
specialty crop farming. Between the 202 students surveyed, 90% of them were able to name
three Arizona grown fruits or vegetables and 46% were able to name three careers in Arizona
specialty crop farming. WGF considers this goal to be completed because the students that
participated were very engaged with their farmer visits; were able to successfully name at least
three fruits or veggies grown in Arizona and had a personal interaction with a local specialty
crop farmer.
Beneficiaries Specialty crops planted at the Fruit and Vegetable Learning garden included lettuce (romaine,
red leaf, and head), spinach, eggplant, tomatoes, cabbage, broccoli, cauliflower, carrots, melons,
sweet corn, kale and herbs – among many other specialty crops. WGF believes that all Arizona
specialty crop farmers benefit when consumers learn about farmers’ work, how their food is
grown and the importance of good nutrition, those farmers who grow the crops featured at the
Page 24 of 147
Arizona Department of Agriculture
Specialty Crop Block Grant Program
Agreement No. 12-25-B-1655
Zoo or participated in the Farmer Talks especially benefited. There are at least thirty-nine
Arizona specialty crop farmers who grow the crops listed above.
Arizonans, who, by learning from the garden, increase their consumption of fruits and vegetables
and thereby improving their health.
Lessons Learned Managing a large scale construction project from afar with multiple parties involved proved to be
a learning curve for WGF staff. Luckily, WGF had the support of a local farm, Rousseau
Farming, to lend their specialty crop expertise to the garden and keep the project moving in a
direction that will be best benefit visitors to the Zoo. Rousseau Farming’s staff graciously
volunteered for the Farmer Talks, provided additional funding, supplies and labor to the project.
The Zoo’s horticulturist, director of experiences, press officer and VP of operations all
enthusiastically supported and engaged in the project. EPS’ lead architect kept the project on
track and acted as a liaison between all parties.
Contact Person Sabrina Blair
Western Growers Foundation
949-885-4789
Additional Information Appendix D includes lesson cards, sample student surveys and photos of the garden.
Virtual Arizona Experience: Promoting Specialty Crops This project was completed on June 30, 2016
Project Summary Agriculture remains Arizona’s second largest industry, but the means of production have
changed dramatically in recent years due to water concerns, transportation costs, and other
factors. Agritourism, such as U-Pick farms, festivals, and direct-to-consumer sales at farmers
markets can substantially increase a producer’s profit, and have the potential to directly feed the
local economy, both keeping money in state and attracting money from out of state.
This project used blogs, pages, videos, and an interactive map to raise the profile and agritourism
appeal of specialty crops. Each crop is a burgeoning agritourism product with high economic
potential, a recovering agricultural product, a specialty product, or an agricultural product vital to
Arizona’s economy. This project advertised over 50 individual farms, orchards, vineyards, or
direct-to-consumer businesses within Arizona.
The project aims to promote production regions as tourism destinations, which benefits not only
crop producers but tourism-related businesses, such as hotels and restaurants. This idea is
especially relevant in instances where towns sponsor or support agritourism-related events,
particularly the Yuma area and areas of the Verde Valley.
Page 25 of 147
Arizona Department of Agriculture
Specialty Crop Block Grant Program
Agreement No. 12-25-B-1655
As Arizona’s agricultural industry changes and more farmland is converted for urbanization,
producers must adapt to new economic challenges and opportunities. Increasing a producer’s
agritourism profile takes advantage of the closer proximity of these previously remote farms as
urban areas expand and offers new streams of revenue such as direct-to-consumer purchases and
markets for retail food and beverage and artisan products. In addition, these producers provide a
valuable educational resource and opportunity to connect people to the food they eat. Both of
these opportunities are ripe for expansion, as movements such as Local First provide support and
promotion to state-owned businesses and products, and the popularity of agritourism rises
nationwide as part of a general renaissance of the “slow food” movement and artisan products. In
some cases, specialty crop products receive sponsorship or financial assistance from municipal
sources such as Visit Yuma. Furthermore, the rise of blogs and social media outlets enable the
possibility for broad engagement of specific populations of enthusiasts. Pages, maps, and videos
produced by the Arizona Experience for the purpose of expanding knowledge of and access to
specialty crop products and the agritourism events associated with their production can be used
by a variety of interested parties, including producers, proprietors, tourism promoters, chambers
of commerce, agricultural guilds, and agritourism aficionados to leverage the work they are
doing to promote specialty crops in their area or as pieces of featured media. In addition, this
project can provide benefit to the tourism industry by providing ready-made media that
showcases agritourism opportunities around the state.
This project has received no funds from previous funding cycles.
Project Approach During the course of the grant, the Arizona Experience team extended the web environment of
the Arizona Experience website to show agritourism opportunities associated with ten specialty
crops: apples, olives, lemons (now citrus), sweet corn, lavender, viticultural grapes, dates,
romaine lettuce, chili type peppers, and pumpkins.
A team of one coordinator and one videographer visited the following places and events: Yuma
Medjool Date Festival (Yuma, AZ), Yuma Lettuce Days (Yuma, AZ), Red Rock Lavender
Festival (Concho, AZ), Camp Verde Corn Fest (Camp Verde, AZ), Apple Annie’s Apple Fest
(outside Wilcox, AZ), Salsa Fest (Safford, AZ), Queen Creek Olive Mill Olive Festival (Queen
Creek, AZ), pumpkin festivals at Vertuccio Farms, Mother Nature Farms, Schnepf Farms and
Tolmachoff Farm (Phoenix area), and U-pick events at Truman Ranch II and Cotton Lane Citrus
(Surprise, AZ), and Sonoita Winegrowers Festival (Sonoita, AZ). At each event, at least 4 hours
of video were captured of the growers, products, tourists/patrons and videos roughly five minutes
in length were produced. In addition to capturing growers and industry professionals, the team
had the opportunity to capture many cottage and side industries and feature a little information
on these entities in the videos, to show how agritourism can bring opportunities for cottage
industries to an area.
One intern designed a specialty introduction and helped develop video branding.
Ten web pages were produced as part of a Celebrating Specialty Crops blog to give information
about tourism opportunities and general interest to the public.
Page 26 of 147
Arizona Department of Agriculture
Specialty Crop Block Grant Program
Agreement No. 12-25-B-1655
Research on information regarding the crops, locations, seasonality, availability, and recipes
associated with the crops was performed. Much of the research drew from information available
through partners including Local First Arizona and the Arizona Farm Bureau; the Arizona
Cooperative Agricultural Extension also provided assistance. Additional information was
gleaned through gardening websites specializing in Arizona cultivation. Locations of U-Pick
farms were calculated and entered into a master spreadsheet which was used as the basis of the
U-Pick Crop map.
A team of web developers and map makers developed two custom maps using Python. Maps
included custom icons and carefully thought-out features such as directions and availability
(hours of operation and, for crops, seasonality).
To develop the Wine Trails map, growers and wine producers were reached out to personally and
asked to provide information on their business. Information could include products, varietals,
special amenities, descriptions, images, and business hours. The Wine Trails map was designed
to feature all the above types of information, though in many cases the team received less
information than that.
Arizona Farm Bureau provided census information regarding commercial production of specialty
crops. Local First Arizona helped suggest the list of specialty crops to feature and promoted map
products in their blog. Some of the locations featured on the specialty crop U-Pick Farm map
were discovered using the Local First Good Food Finder product. Arizona Office of Tourism
promoted the specialty crops map in their blog.
Goals and Outcomes Achieved Final work products include:
One “Celebrating Specialty Crops” blog hosted at arizonaexperience.org with ten entries,
one for each specialty crop. Pages include images, information on commercial cultivation
of crops, specialty crop growing at home, and tourism opportunities associated with the
crop:
Lavender: http://arizonaexperience.org/specialty-crops/blogs/lavender
Wine and Wine Map: http://arizonaexperience.org/specialty-crops/blogs/new-interactive-map-
arizona-wineries-and-other-good-news
Apples: http://arizonaexperience.org/specialty-crops/blogs/apples
Olives: http://arizonaexperience.org/specialty-crops/blogs/olives
Romaine Lettuce: http://arizonaexperience.org/specialty-crops/blogs/lettuce
Medjool Dates: http://arizonaexperience.org/specialty-crops/blogs/dates
Sweet Corn: http://arizonaexperience.org/specialty-crops/blogs/sweet-corn
Chili Peppers: http://arizonaexperience.org/specialty-crops/blogs/chili-peppers
Pumpkins: http://arizonaexperience.org/specialty-crops/blogs/pumpkins
Lemons (citrus): http://arizonaexperience.org/specialty-crops/blogs/lemons-and-citrus
Ten videos of specialty crop tourism events featuring growers, producers, tourists, and
associated cottage industries. Each video appears on YouTube and on the blog post
Page 27 of 147
Arizona Department of Agriculture
Specialty Crop Block Grant Program
Agreement No. 12-25-B-1655
(accessible through the links above). Each video is approximately 5 minutes long, with a
customized introduction and branding. Videos are free for use by the specialty crop and
tourism communities and the Sweet Corn video appears on the Camp Verde Corn Fest
website.
Two custom interactive maps showing availability and directions to agriculture
experiences. One map features U-Pick opportunities for featured specialty crops; one
features wineries, vineyards, and tasting rooms. The wine trails map was built with the
ability to be managed by the wine-producing community in order to keep the map current
in a rapidly changing industry.
o Wine Trails Map: http://arizonaexperience.org/live-maps/az-wine-map
o U-:Pick Farm map: http://arizonaexperience.org/live-maps/u-pick-farm-map
Promotion: Upon completion of the maps and other major milestones, press releases were
circulated to local papers, partners, industry members, and local business bureaus and
tourism interests. The maps were featured in blogs by the Arizona office of Tourism,
Local First Arizona, articles in Phoenix New Times and Edible Baja Arizona, a radio spot
on KTAR, and on multiple social media outlets.
Long term use of the maps has been measured using Google Analytics. Metrics have
revealed that use of both the wine map and the crop map are more prevalent in the winter
months. In winter, the wine map receives between 600-700 visitors a month, the crop
map receives approximately 300 visitors. Approximately 90% of those visitors are new.
A post-project survey was circulated to members of the winegrowing industry to gauge
effectiveness of the map. The survey revealed that though multiple efforts to engage the
growers were made during the building of the map, through the Arizona Winegrowers
Association (formerly Southeast Arizona Winegrowers Association) many do not show
significant interest in updating their entries themselves. The wine map has not been
widely adopted as a tool throughout the industry, as was hoped.
GOAL: Targets include reaching 50,000 hits at the AASCM web page by the end of Year 2,
engaging over 1,000 participants in discussions and activities on specialty crops and related
agritourism at the 20 agritourism events we plan to attend, and assessing promotional products
through in-person outreach efforts at least three of these events (TARGET).
OUTCOME: Hit numbers are assumed to reach approximately half that total. The Specialty Crop
U-Pick Farm Map received 1,810 views between January 1, 2016 and August 31, 2016; the
Arizona Wine Trails map received 4,495 views during that time frame, for a total of 6,305 map
views alone. Google Analytics before Jan 1 are not available; I believe this is due to a relocation
of the hosted map done by the former AZGS webmaster (the webmaster resigned in May and the
position remains open). More views occur during cool weather months than during the summer
and the rate of new users remains steady at approximately 89-90%; given these numbers stay
constant within their current patterns of fluctuation (the Arizona Experience site itself has seen a
steady rise in views), projected outcomes at the end of two years would approximate 25,000 page
views. In addition to map views, we expect to see a steady increase of views for individual blog
pages and videos. The Camp Verde Corn Fest video has received over 900 views; in two years
Red Rock Lavender farm has received close to 150 views without promotion. With seasonal
promotion through social media, we hope that these media will find a steady though cyclical
Page 28 of 147
Arizona Department of Agriculture
Specialty Crop Block Grant Program
Agreement No. 12-25-B-1655
audience and reasonably expect that this rate of exposure will remain steady or slightly increase,
as has been the case with general traffic to the Arizona Experience website.
GOAL: Targets include increasing the number of collaborators to include 31 specialty crop-
producing farms and 25 additional agriculture and agritourism-related agencies or businesses
(TARGET). Success will be measured by the number of organizations that contribute content to,
and cross-promote, the AASCM by the end of Year 2 (PERFORMANCE MEASURE).
OUTCOME: The project did successfully reach out to 33 U-Pick farm producers and over 50
producers of wine or viticultural grapes. Additional parties reached include members of the
media and the tourism industry. These parties use the product with varying degrees of
enthusiasm, either posting about it in their newsletters, blog, or social media, or linking to pages
or media. Sadly, adoption of the wine map by the winegrowing community was not nearly as
robust as projected or hoped for. A post-event survey aimed at that community indicated that
some thought the map was hard to read, others indicated that the information was not current,
and few
People surveyed at agritourism events indicated enthusiasm for such events and a willingness to
return. People were willing to drive up to 100 miles to attend an event that they liked. Especially
popular at these events are family activities designed for children.
Beneficiaries The major group to utilize the Wine Trails map is tourists who visit the Arizona Office of
Tourism site. 60% of the traffic to the Wine Trails map is driven from the Arizona Office of
Tourism site. We are therefore measuring one beneficiary as the audience who sees the map and
the crop pages and learns more about Arizona's opportunities for agritourism. Google analytics
shows that these visitors are approximately 750 users/ per month. Of these users, there is no way
to accurately track how many were compelled to visit a winery, thus increasing revenue and
business.
Among the initial beneficiaries are the members of the wine industry themselves, who had the
chance to be represented in the map: 37 Arizona businesses. However, a follow-up survey
showed that only about a third of the respondents used the map for promotional purposes
themselves, so direct beneficiaries getting a usable tool is decreased from the previous total. This
population All products will remain free to use.
Approximately half the pages and videos have been released too recently to determine the long-
term impact they have on agritourism for those specialty crops, as interest is seasonal. As
festivals for Chili peppers, olives, pumpkins, dates, and lemons are upcoming, producers and
stakeholders in these festivals will again be reminded about the free promotional material
available for their use. The specialty crop map receives approximately 190 hits per month.
However, views of crop videos are still negligible. One business informed the Arizona
Experience that it closed.
Page 29 of 147
Arizona Department of Agriculture
Specialty Crop Block Grant Program
Agreement No. 12-25-B-1655
Lessons Learned The first lesson learned is that early engagement and constant contact with all stakeholders is
extremely important. The project would have done well to create give consistent updates at timed
intervals to a listserv of potential partners, producers, and members of business, tourism, and
industry. As opposed to heavy contact with a few key people for short periods, I would change
the methodology to plan for steady contact with a broad audience and timed intervals. I believe
this would have the effect of keeping stakeholders more excited about the overall project, rather
than just certain parts of the project, and therefore more likely to promote it when parts that are
not directly relevant to their specialty crop are completed.
Another lesson learned is that it was far more difficult than originally anticipated to receive
information from people. Producers often had to be contacted multiple times, even those who
expressed enthusiasm and support for the project. I believe this is because producers are so busy
taking care of their immediate tasks. When it came to engaging winegrowers, I got virtually no
response when I asked them to manually determine the latitude and longitude points of their
business and growing areas, even though I created an illustrated step-by-step instruction sheet.
The second time we made a push for engagement, we circumvented the latitude and longitude
requirement, instead getting the locations and determining the lat and long points in-house.
Response was much more robust.
One additional thing about the maps that I would change in retrospect is to identify a target
group of early testers before the release of the map. In the survey, some respondents found the
map hard to read and hard to identify locations. We had completed our internal testing, but the
map had not been tested among the community it was meant to serve.
We shot hours of videos at each location for the purpose of best conveying all of the activities
offered at a given event. Beyond a produce focus, the goal was to show how these events offered
family activities, educational opportunities, and a chance for local clubs, interest groups, and
artisans to exhibit or perform. While I believe these “extras” were conveyed well in the videos
and served the purpose of illustrating the many reasons to visit an event, the footage took an
exceedingly long time to go through. In the future, I would take a more targeted approach to
filming.
Finally, the project underwent several major staff changes, including two mapmakers and a
webmaster. While staff changes are a reality in any job, it serves as an internal reminder that
there should be an internal continuity, making sure that all parties are familiar with software and
procedures that are used to build the product.
Contact Person Rowena Davis
520.621.2408
Additional Information The maps, blog posts, and videos have enhanced the competiveness of agritourism opportunities
associated with Arizona specialty crops by listing and linking to purveyors of specialty crops on a
Page 30 of 147
Arizona Department of Agriculture
Specialty Crop Block Grant Program
Agreement No. 12-25-B-1655
web platform that receives, overall, almost 25,000 site visits every month. Splash pages and images
in the front page image slider advertise the crop blog and maps to every visitor of the Arizona
Experience site’s home page. All materials remain free to use and distribute for personal or
commercial gain.
The U-Pick map garnered several articles at the time of its release, and additional spots in
various social media outlets. Notable news coverage includes:
Phoenix New Times article -
http://blogs.phoenixnewtimes.com/bella/2015/04/arizona_agritourism_farm_map.php
AOT write up - http://visitarizona.com/press-room/aot-in-action/april-14-2015-industry-
news#interactive
Edible Baja Coverage - https://www.ediblebajaarizona.com/interactive-map-draws-day-
trip-path-to-arizonas-u-pick-farms
KTAR News (Phoenix radio station)
The Wine Trails map drew similar coverage.
Arizona Agriculture: Bee’s Amazing Adventure This project was completed on September 30, 20143
Project Summary Arizona Agriculture: Bee’s Amazing Adventure is a children’s literature book that brings
farming and ranching in the Grand Canyon state to life, exploring the state’s rich agricultural
diversity through the eyes of Pee Wee Bee. Delighting elementary-aged children as she flits
from field to field, Pee Wee shares fascinating facts about agriculture that stimulate young
minds, helping school children understand the integral role that agriculture plays in Arizona’s
economy. Filled with carefully researched information and eye-catching photography. Bee’s
Amazing Adventure is a trusted classroom and library resource that interactively captures the
essence of Arizona agriculture with emphasis on the specialty crop industry.
Arizona Agriculture: Bee’s Amazing Adventure will be utilized for many years during the
University of Arizona College of Agriculture and Life Sciences Cooperative Extension’s (UA
CALS CE) Agriculture Literacy Days program. This book was written because there was no
elementary level children’s book about Arizona’s agriculture industry.
Project Approach During AZ Ag Literacy Days, individuals involved in the agriculture community volunteer to go
into one or more classrooms during the school’s fall quarter with special emphasis during the
three school days prior to Thanksgiving. Every teacher that has a volunteer go into their
classroom to read the book receives a copy for their classroom library. Volunteers are
encouraged to bring in items representing their agriculture operation. For example, a beekeeper
may bring honey sticks or a nurseryman may bring in plants. This practice is called “multi-
sensory learning” and research shows the comprehension of students is increased.
3 On April 1, 2014, a timeline extension to September 30, 2014 was granted by the ADA to the sub-grantee.
Page 31 of 147
Arizona Department of Agriculture
Specialty Crop Block Grant Program
Agreement No. 12-25-B-1655
The concept of using an outside speaker with visual aids should increase the student’s
knowledge about, and consumption of Arizona’s specialty crops. Volunteers in AZ Ag Literacy
Days were asked to collect benchmark data on the students. This included a pre-test
documenting student knowledge about and consumption of specialty crops. Participating
teachers then administered a follow-up consumption survey to the students one week after the
volunteer had read the book in class.
Monica Kilcullen Pastor, Associate Programmatic Area Agent, UA College of Agriculture and
Life Sciences Cooperative Extension (UA CALS CE): Served as PI on the grant facilitating the
writing, editing, and publishing of the children’s book; coordinating the development of
marketing materials including book marks, flyers, website, and book trailer with the publisher;
sharing the process of publishing a children’s book at one National Conference; and coordinating
the interactions with the partners.
Brandon Moak, Program Coordinator, Sr., UA CALS CE: Served as AZ Ag Literacy Days
Program Manager to coordinate day-to-day logistical functions of the program, working with
volunteers and teachers; as technology expert to facilitate streamlined communications with
educators, develop and implement effective electronic evaluations, and coordination of reports.
Five Star Publishing, Linda Radke, President: Providing award-winning book production,
consultation and marketing services, the Five Star team assisted UA CALS CE with editing,
publishing, printing, website development, logo design and corporate/product branding. Setting
the bar for industry excellence, Five Star Publications and Little Five Star are recognized as
leaders in creativity, innovation and customer service.
Goals and Outcomes Achieved UA CALS CE coordinated efforts with the authors, Maricopa County Farm Bureau (initial
funder), and the publisher in the development of the children’s book. This included input into the
book layout, photos, website design, Facebook page, and securing book endorsements.
Twenty-five volunteers registered to read a digital version of the children’s book to 104
classrooms throughout the state as part of the 2013 Arizona Agriculture Literacy Days. Almost
3000 students participated in the event. Books were mailed to each of these classes once it was
printed. On September 23, the 2014 AZ Ag Lit Days began receiving volunteers’ registrations to
visit and read in classrooms during this fall quarter (October 20 – December 19). As of October
30, a total of 18 volunteers had registered to read in 59 classrooms of which 12 have already
received a visit. Data is still being gathered to determine the number of students reached thus far
and will continue to be gathered to determine the overall number of volunteers, classrooms, and
students. This data will be compiled at the completion of the 2014 AZ Ag Lit Days which is after
the required submittal date of this report.
Received and analyzed data from volunteers and teachers for the 2013 AZ Ag Literacy Days.
(See Appendix E) Results indicate that students’ knowledge regarding Specialty Crops grown in
Arizona increased significantly for five of the seven commodities (lettuce, melons, nuts, citrus,
Page 32 of 147
Arizona Department of Agriculture
Specialty Crop Block Grant Program
Agreement No. 12-25-B-1655
and eggs).4 There was no significant change in students’ knowledge regarding chile peppers or
honey. A possible explanation for this is that students were already aware that chile peppers were
grown in Arizona. It may also stand to reason that children struggled to conceptualize honey as a
commodity grown in Arizona due to it not living or growing as do the other commodities. There
was no significant increase in students’ consumption of Specialty Crops. This may be due to the
fact that students have very little decision making in what food is brought into their homes. What
youth choose to eat may be more reflective of the eating habits of the adults in their lives. It is
conceivable that students’ desire to eat specialty crop foods did increase, but that these foods
were not made available to the students.
The book has received two awards and applications have been submitted for additional awards. It
was named a finalist in the USA Best Book Awards in the Children’s Educational division. It
was also awarded the Story Monster Approved designation from a judging panel comprised of
youth. Award applications have been submitted to garner additional recognition. Applications,
along with copies of the book, have been submitted to One Book AZ; 2014 Animals, Animals,
Animals Book Festival; and the Children’s Book Council for three categories: Outstanding
Science, Notable Social Studies, and Children’s Choices. The book was selected for the
Children’s Book Council Hot Off the Press program and was featured on their website homepage
on 9/2/2014. Publisher’s Weekly listed the book in their news article about new children’s books
for Fall 2014.
Several notable individuals voluntarily submitted endorsements of this book. Two are
prominently displayed on the back cover. They include the Honorable Jeff Flake, United States
Senate, Arizona and Dr. Denton Santarelli, Superintendent of Peoria Unified School District and
ASA Superintendent of the Year in 2012. Other individuals include Carolyn Warner, founder and
president of Corporate Education Consulting and former AZ Superintendent of Public
Instruction; Lella K. Martin, elementary school teacher; and Susan Maland, administrator of
academic support, past principal, and English department chair for Glendale Union High School
District.
The book has been promoted through a variety of digital media, which includes the book’s
website (arizonaagriculturebook.com), the Book Trailer
(https://www.youtube.com/watch?v=biA6DacnisM), the book’s Facebook page
(ArizonaAgricultureBeesAmazingAdventure), and a spot on PBS children’s show, Super Why!
which aired November 6, 7, and 10-12. Additional promotional materials include pre-order and
order flyers and order forms which are displayed in the front office of UA CALS CE in Maricopa
County, and these, in addition to book marks and pencils, are distributed at educational events
and during educational presentations. An ad has also been placed in Bear Essential News’
November issue: Farm-to-Face: Where Does My Food Come From.
The educational events and presentations in which the book was promoted include the Tucson
Festival of Books with approximately 1000 visitors to the booth over two days; five Farm-City
Partnership breakfasts with over 300 attendees; school garden event in Bullhead City, AZ;
4 Eggs were included in the list of specialty crops submitted in the State Plan. It appears that this error was missed
by both the ADA and AMS and was not communicated back to the sub-grantee. Therefore, the survey in Appendix
E included questions and results for eggs as though they were a specialty crop.
Page 33 of 147
Arizona Department of Agriculture
Specialty Crop Block Grant Program
Agreement No. 12-25-B-1655
National Farm to cafeteria Conference; Dia de Los Niño’s with over 500 visitors to the booth;
American Association of Agricultural Educators Conference; SNAP-Ed Partners conference;
Summer Agricultural Institute; and three School Garden Food Safety trainings.
Beneficiaries School children and their teachers are the beneficiaries. In 2013 during Arizona Agricultural
Literacy Days, twenty-five volunteers read the book in 104 classrooms. It was reported that
approximately 3,000 students participated. In 2014, during Arizona Agricultural Literacy Days,
thirty-one volunteers read the book in 101 classrooms. It was reported that approximately 2,626
students participated. These audiences now have access to accurate information with appropriate
photos about Arizona’s agriculture industry.
More than half of the book discusses specialty crops. The main character, Pee Wee Bee,
represents the bee industry and is featured throughout the book. The book narrative encompasses
thirty-two pages. Specialty crops are either mentioned or used in photos on pages 7, 21, and 28.
Specialty crops are discussed in detail, including facts and photos, on pages 10 – 15, 20 – 23, and
30 – 32. The listed specialty crops are bees/honey, lettuce, pistachios, pecans, melons, chile
peppers, citrus, nursery plants and eggs.
Individuals who read the book are able to expand and enhance their knowledge about the
specialty crop industry in Arizona with the hope that they would increase their consumption of
these products that are locally grown in our state. This would therefore help increase the sales of
commodities of those individuals in the industry.
Lessons Learned Coordinating approval of narrative changes, photos, and layout from the authors and the initial
funders caused unanticipated delays in the publishing timeline. Writing a children’s book is also
a challenging task. It necessitates the explanation of a complex industry in very few words that
are understandable to elementary grade readers while displaying informative, accurate photos
that encompass Arizona’s dynamic agriculture industry.
The projection to reach 200 classrooms each of the two years was very optimistic. It was
surmised that the volunteers were not comfortable using the electronic version of the book in
2013. Only 104 classrooms were reached in 2013. Volunteers are still being solicited for the
2014 AZ Ag Literacy Days so classroom numbers are net yet available.
Contact Person Monica Kilcullen Pastor 602-827-8217 [email protected]
Additional Information A copy of Arizona Agriculture: Bee’s Amazing Adventure and a media kit were sent by the
Publisher, per the contract, to the following: Publishers Weekly, Green Teacher, Scottsdale
Public Library System, Scholastic, Kid Lit Reviews, Independent Pub magazine, Reader Views
Kids, KidStop toys, Yikes! Toys, The Bookworm store, Children's Museum of Phoenix, Phoenix
Page 34 of 147
Arizona Department of Agriculture
Specialty Crop Block Grant Program
Agreement No. 12-25-B-1655
Zoo, Readerlink Distribution Services, LLC, Social Studies School Service, Booklist - American
Library Association, Raising Arizona Kids Magazine, Foreword Magazine, School of Arts &
Sciences, Gardner’s Book Service, Treasure Chest Books, American West Books, Inc., Barnes &
Noble, National Geographic KIDS, Arizona State Library, Holly Henley, Arizona State Library,
Irene Garnett, Tamera Thornton, Arizona Republic, School Library Journal, Portland Book
Review, Grade Reading, and Southwest Books of the Year.
Arizona Grown Marketing Efforts Phase 3
This project was completed on December 31, 2014
Project Summary AZ Grown Marketing Efforts Phase 3 focused on a four month large media campaign with
purchased media to educate and engage the public on where and why to buy locally grown
produce and nursery plants both of which are important specialty crops in the state of Arizona.
An added benefit of this phase was to provide an elevated awareness of the AZ Grown logo by
utilizing digital billboards to highlight the AZ Grown logo and the purchase of Arizona grown
plants and produce. Although the campaign focused primarily on the digital billboards, Facebook
posts and content continued as well as other easily available social media tactics that worked in
harmony with Facebook.
Project Approach R&R Partners began working on Phase 3 of the continuing AZ Grown efforts to increase
visibility and awareness of the importance of buying local produce and plants in Arizona. AZ
Grown billboard ads were placed around the valley and the campaign ran for 10 weeks. Two
additional boards were provided per week by the network company as an added bonus. The
billboard campaign not only continued to raise awareness of the AZ Grown brand but also drove
increased visitation to the AZ Grown website.
Facebook content calendars were created for each month and reviewed by project partners. Once
approved they were then added daily to the AZ Grown Facebook page. Each day focused on
raising awareness of a particular Arizona Grown produce or plant. Some posts contained
information on how to use a specific plant or produce while some provided information on where
to buy local.
Arizona Grown fruit and veggie stress balls were distributed to teachers and presenters at the
Summer Agricultural Institute (SAI). SAI is a five-day tour designed to teach K-12 teachers
about Arizona’s agricultural production and help them incorporate that knowledge in the
classroom curriculum. SAI combines hands-on learning about agriculture with practical
curriculum development. Teachers receive Arizona Specialty Crop Lessons which includes 30
lessons written by 16 Arizona teachers. All lessons teach about Arizona's specialty crop industry
and have been aligned to Arizona's Academic Standards. Each lesson encompasses more than
one subject area. This is a great opportunity for teachers to learn about Arizona’s fruit and
vegetable production and to pass on that knowledge to the children in their classrooms.
Page 35 of 147
Arizona Department of Agriculture
Specialty Crop Block Grant Program
Agreement No. 12-25-B-1655
Goals and Outcomes Achieved Facebook
Facebook performed well with high engagement numbers but low in new fans. The goal of this
project was to increase the number of likes by 1,500. In hindsight, this goal may have been a bit
out of reach to achieve. At the beginning of Phase 3, Facebook likes totaled 1,632 unique
individuals. For this grant we were to track the increase from Phases 1 and 2. At the end of Phase
3, AZ Grown Facebook likes totaled 1,888 unique individuals.
Although there has been a low number of new likes the level of opt-outs (unlikes) is extremely
low. Only two people unliked the page during this period. This statistic is simply unheard of and
speaks to the high quality of the content that is connecting with the group of fans we have
engaged with. It is one thing to gain a fan, but it is harder to keep them and the effort to maintain
our audience is exceeding our expectations.
Our most engaged post was on “peaches in season” which reached 658 people.
Website
During the 9 month campaign, we had 5,183 page views with 1,788 unique users viewing the
page for an average of 200 unique visitors per month which fell short of our estimated goal of
300. Although a bit lower than projected the majority of the traffic was during the run of the
billboards this spring which shows how well the billboards worked to drive interest to the site.
These numbers are impressive because we did not have digital online banners or advertising to
initiate click-throughs to the site. We had to rely on mental recall of the website URL and the
action of users typing it in manually following their commute.
Each session (actively engaged viewers) averaged 2.49 page views; Average session time was
1:30; 84% of visitors during the billboard campaign were new with only 16% being returning
visitors. This means the increase of brand awareness was significant.
Beneficiaries The biggest beneficiary is the consumer and the ability to educate and connect them to locally
grown plants and produce.
Although a specific number of growers who benefited from this project cannot be determined,
the Arizona Nursery Association has over 60 growers in the state and the increased demand for
locally grown plant material by retailers benefits all growers and retailers. Western Growers
represents an estimated 120 produce growers in Arizona and again, the increase in demand for
locally grown produce by consumers will benefit the retailers as well as the growers in the state.
Lessons Learned Facebook continues to be the key to our success as numbers continue to grow, engagement
remains high and our fans stay with us. What we are seeing is a slowdown in acquisition of new
fans. This is due to the lack of Facebook advertising and promoted/boosted posts. Facebook
promoted posts are an inexpensive way to boost our engagement and fans. Additional advertising
Page 36 of 147
Arizona Department of Agriculture
Specialty Crop Block Grant Program
Agreement No. 12-25-B-1655
may be the key to engaging new fans in the future. Facebook promoted posts have been included
in the Phase 5 activities.
Contact Person
Deborah Atkinson
602-542-3579
Plant Something Campaign – Public Outreach III This project was completed on September 29, 2016
Project Summary The Arizona Nursery Association applied for a Plant Something Campaign Public Outreach III
grant as a continuation of grants awarded in previous cycles. Our aim with this grant was to
expand the successful Plant Something promotion with a goal of increasing the sale and use of
Arizona grown landscape plants and trees. Through previous grants, the basic tools were
developed and assisted in taking the promotion nationwide. This grant enabled ANA to manage
the current partners and market to other partners as well as continued the promotion of the Plant
Something message to the general public with a goal of continuing to increase sales of plants and
trees in Arizona. This campaign has shown in the past, an increase in sales, and this grant was
designed to continue that momentum.
Project Approach These grant funds provided for the use of media advertising, printing, social media and web
advertising to target the general public to increase awareness of the campaign which promotes
purchasing plants and trees therefore increasing the sales of ornamental nursery stock. Since the
program had been well-established with previous grant funds, it was vitally important to have
another grant to expand the public’s awareness of the Plant Something campaign. This grant
also had funds to promote the Plant Something campaign to additional partners.
Specific items completed with grant funds include digital billboards, radio advertisements,
printing of brochures and banners, social media and web advertisements, printed hats and bags as
well as keeping up the Plant Something website and Facebook pages during the duration of this
grant.
Goals and Outcomes Achieved 1) Sales in Retail Nurseries:
Arizona grown low water use plant sales will increase during the promotional period.
ANA emailed surveys to retail nurseries to report plants sales during same month cycles in 2014
compared to 2013 to measure the effectiveness of the promotion. In the same survey, ANA
gathered results for 2015 compared to 2014.
Reported results were as follows:
Comparing ANA member retail nursery sales in 2014 to 2013, an average decrease of 4.5% was
reported.
Page 37 of 147
Arizona Department of Agriculture
Specialty Crop Block Grant Program
Agreement No. 12-25-B-1655
Comparing ANA member retail nursery sales in 2015 to 2014, an average increase of 13.6% was
reported.
2) Increase the competitiveness and long term sustainability of the national nursery industry by
making the Plant Something materials available nationwide. 6 states per year will join in 2014 &
2015. At least 50% of their membership will utilize the materials.
At the beginning of this grant, 12 states were partners. At the end of this grant, 22 states are
partners, therefore, just below the target goal of 24 states. The partner states were unwilling to
give a percentage of use by their members since there is no way for them to determine exact
usage by their members. However, most states are reporting the campaign is eagerly being
adopted by members.
Beneficiaries The project benefited the entire Arizona nursery crop industry. This industry, according to the
2007 survey, has total sales of $644 million and includes the 200 members of the Arizona
Nursery Association as well as an estimated 1000 landscapers in Arizona. Educating consumers
of the environmental benefits of planting landscapes has resulted again in an increase in sales on
the retail level which will in turn, increase Arizona grower sales. Because the grant met a need
of each level of the Arizona industry as well as the general public, an actual number cannot be
quantified.
Lessons Learned We learned that selecting media advertising is much easier if you have used the media before and
liked the results.
We learned that spreading this message to the nation was doable, however, very time-consuming
for an association with one full time staff person working on this project and board of directors
are not quick in making decisions.
We learned that statistics from sales year over year or month over month, could indicate a
decrease due to weather or economic conditions and not really relate to the success of the
program we were measuring.
Contact Person
Cheryl Goar, Executive Director, Arizona Nursery Association, 1430 W Broadway Suite 110,
Tempe, AZ 85282, Phone 480-966-1610 or Email [email protected]
Additional Information We believe the Plant Something promotional campaign has increased awareness of the
competitiveness and consumption of ornamental plants in Arizona. Through our previous
surveys, a 10% increase in sales was reported by the retail nurseries. However, a decrease was
reported for this first time since the inception of the program. We would argue this had more to
do with the economy and weather related issues rather than the success of our program.
Page 38 of 147
Arizona Department of Agriculture
Specialty Crop Block Grant Program
Agreement No. 12-25-B-1655
We believe that an indicator of the popularity and success of this Plant Something promotion is
that many other states are applying for Plant Something grants for their states from the Specialty
Crop Block Grant program and 22 states are partners in the program.
Program income for the grant period was $13,000 collected from member state partners. The
income, along with previously reported income received in the FB2012 grant period, was used to
produce two videos for the plant something partners, to add additional states to the national
website, to hire a contract employee to solicit marketing materials from member partners and
educate them on the program and to get them to use it more, to develop a partner user manual
and an organized drop box where all artwork is shared.
Copies of any and all promotional materials, digital billboards, radio advertisements, printed
items and videos are available upon request. Website is www.plant-something.org and Facebook
page is under Plant Something.
Breeding for Improved Nutrient Use Efficiency This project was completed on September 30, 2015
Project Summary A physiological mechanism has been unraveled by which plants utilize a proton pyrophosphatase
(H+-PPase) transporter to alter root activity and nutrient and water uptake. With SCBG 2011-29
funding, we had already shown promising results with H+-PPase genetically transformed lettuce
under field conditions. However, we were cognizant that consumers may remain disinclined to
accept food crops modified using molecular approaches. More recently, we had obtained
evidence that this trait may be present in existing lettuce lines based on variation in rhizosphere
acidification capacity. Seeds of both transporter- enhanced, that we developed using molecular
techniques, and conventional cultivars obtained from the USDA collection were grown in
nutrient limiting media in the presence of a pH indicator. These preliminary findings suggested
that some conventional lettuce cultivars will display phenotypes similar to our well-characterized
transporter-enhanced lines, including improved performance under low-nutrient conditions. The
objective of this research is to screen lettuce lines for rhizosphere acidification and improved
production and N and P uptake, and identify a potential breeding strategy that might be used to
develop more nutrient efficient lettuce types. All studies involved the Pavane x Parade
recombinant inbred lines (RILS) of lettuce for which markers and mapping have been completed
for Quantitative Trait Loci analysis (QTL). One study involved evaluation of rhizosphere
acidification capacity of these lettuce lines. Other studies involved response to N and P in short
term greenhouse studies. Finally, field studies were conducted to evaluate the response of these
RILS to N and P. All studies show significant differences among cultivars in rhizosphere pH
modification, above ground dry matter production and yield, and above ground N and P
accumulation. Analysis shows there were significant QTLs, suggesting a strong likelihood that
N and P fertilizer use efficiency can be improved through traditional breeding techniques.
Project Approach All studies involved the Pavane x Parade recombinant inbred lines (RILS) of lettuce for which
markers and mapping have been completed to facilitate Quantitative Trait Loci (QTL) analysis.
The QTL analysis should enable us to find genes or combinations of genes that result in proved
nutrient use efficiency.
Page 39 of 147
Arizona Department of Agriculture
Specialty Crop Block Grant Program
Agreement No. 12-25-B-1655
pH Experiment
The first study was aimed at characterizing variation in rhizosphere pH modification. All RILS
(77 lines labeled 1429 through 1502 with four sublines) and the parents (Pavane and Parade)
were planted into seedling trays and were germinated in a growth chamber. A week later, when
the true leaves emerged, the seedling trays were moved into a larger growth chamber, with
brighter light. The plants were watered when needed, and we fertilized with Hoagland’s solution
once a week. Two weeks after planting 15 plants, 5 plants per beaker, (3 beaker replications per
line) were moved into a beaker containing 20 mL Hoagland solution. Three days later the
Hoagland solution was discarded and 20 mL of de-ionized water was added to the beaker with
the seedlings. Two days later de-ionized water was poured out and 30 mL of quarter strength
Hoagland solution was added to the beaker (pH adjusted to 6.5). The pH of the liquid medium
was recorded daily for several days using a pH meter.
Greenhouse P Fertilizer and RIL Experiment
For this experiment we used a Casa Grande loam (Fine-loamy, mixed, superactive, hyperthermic
Typic Natrargid, reclaimed) soil testing very low in sodium bicarbonate extractable P (Olsen-P).
The Olsen P test is the common approach for estimating plant available P in calcareous soils.
The soil was weighed into 500 mL pots. All pots received 0.5 g of a controlled release N (CRN)
fertilizer source so that N would not be limiting. The P fertilizer treatments were 0, 0.25, and 0.5
g mono-ammonium phosphate (MAP) per pot. RIL and parent seedlings at the four-leaf stage
were transplanted into pots. The experiment included the three P rates described above, all RILS
and the parents (Pavane and Parade) with three replications for a total of 693 pots. The above-
ground plants (shoots) were harvested at the cupping stage. After taking a soil sample, roots
were collecting by manually washing away the soil from the root mass. Shoots and roots were
dried, weights were recorded, and plant tissue was ground for P analysis. Data were subjected to
statistical analysis and QTL analysis.
Greenhouse N Fertilizer and RIL Experiment
This experiment was similar in methodology to the P experiment described above except that N
was the fertilizer variable of interest. All pots received 0.5 g MAP so that P would not be
limiting in this experiment. The N fertilizer rates were 0, 0.25 and 0.5 g CRN. The RILS and
parents were planted as above. Soil samples and above-ground plant weights were collected as
described above. Due to issues with quantitatively recovering roots in the above experiment, we
decided it was not productive to try and collect roots in this experiment. All tissue was ground
and processed for N analysis. Data were subjected to statistical analysis and QTL analysis.
Field P Fertilizer and RIL Experiment
This study was conducted on a field mapped as a Casa Grande loam testing low in Olsen P. The
entire plot area received 200 kg N/ha as CRN so that N would not be limiting. The P fertilizer
rates were 0, 50, and 100 kg P/ha as MAP. The RILS and parents were direct seeded on two line
elevated beds on 1m centers. Because of logistical limitations of effectively managing an
extremely large number of field plots, only the parents (Pavane and Parade) were replicated
within each P fertilizer treatment. This is common field methodology with RILs. The total
number of field plots in this experiment was 227 individual plots. The crop was established with
sprinklers. After stand establishment, the field was irrigated by furrow irrigation. The lettuce
was thinned to stand. Marketable yields (marketable weight of 10 heads) and whole above
ground plants were collected at maturity. The above-ground plants were dried, weighed, ground,
Page 40 of 147
Arizona Department of Agriculture
Specialty Crop Block Grant Program
Agreement No. 12-25-B-1655
and analyzed for P. Data were subjected to statistical analysis and QTL analysis. Since we did
not have replication for all lines within every P fertilizer regime in the field experiment, testing
could be performed using the observed variation of the parents (which were replicated) or the
fertilizer rate by cultivar interaction term. In this discussion we used the interaction term for
testing, thus we could not test the interaction term.
Field N Fertilizer and RIL Experiment
The design of this field experiment was similar to the P field experiment except N was the
variable of study. The entire plot area was fertilized with 100 kg P/ha as MAP. The N rates were
0, 100, and 200 kg N/ha as CRN. The RILs and parents were planted within each fertilizer
regime. The crop was established with sprinklers. After stand establishment the field was
irrigated by furrow irrigation. The lettuce was thinned to stand. Marketable yields and whole
above ground plants were collected at maturity. The above-ground plants were dried, weighed,
ground, and analyzed for N. Data were subjected to statistical analysis and QTL analysis.
Goals and Outcomes Achieved Note: Please refer to Appendix F for all tables and figures referenced in this section.
pH Modification Experiment
The mean observations from the pH experiments are shown in Figure 1. Statistical analysis for
the pH measured 24 hours after the plants were placed in pH adjusted Hoagland’s solution shows
that there were significant differences (P <0.01) among the lines and the untreated control (no
plants in the beaker). Line number 1439 had the lowest pH of 3.91 and line 1444 was a close
second at 3.98 but the differences between these two were not statistically significant. The pH of
Hoagland’s solution was 6.50 at the beginning of the experiment and remained fairly constant
during the measurement period. After 24 hours, mean pH values were markedly decreased in all
but 8 of the lines we tested. There were 16 lines where the mean pH ranged from 4.07 to 4.91.
Line 1472 had a mean solution pH of 4.99 and was significantly different from the pH of 3.91
observed for 1439 noted above.
After 48 hour, the solution pH values increased for most lines. There were only 3 lines, 1442,
1458 and 1430 with pH values that ranged from 4.62 to 4.99. There were 41 lines with a pH
greater than 6.5 (ranged from 6.51 and 7.45), including the parents ‘Pavane’ and ‘Parade’.
Comparing mean pH data across the 24 and 48 hours periods, we found that there were 4 lines
that resulted in solution pH levels significantly lower than both the parents. The lines were 1440,
1430, 1451 and 1442. Research has shown that a plant capacity to lower the pH of rhizosphere is
associated with improved nutrient use efficiency.
Greenhouse P Fertilizer and RIL Experiment
The mean results for the greenhouse P fertilizer experiment are shown in Figure 2. Shoot dry
matter significantly (Table 1) varied to P fertilizer rate and cultivar. In addition, the cultivar by P
rate interaction was statistically significant indicating response to P varied by cultivar. Lines
1488, 1461, 1486, 1439, 1460, and 1436 all produced dry matter yields greater than at least 20
other lines. Interestingly, root dry weight was not statistically affected by P fertilizer rate or
cultivar. It was difficult to quantitatively harvest roots. We observed during washing that many
of the fine roots often washed away with the soil so this data is of little use.
Page 41 of 147
Arizona Department of Agriculture
Specialty Crop Block Grant Program
Agreement No. 12-25-B-1655
Above ground tissue P concentration did significantly increased to P fertilizer rate and there were
significant cultivar and cultivar by P fertilizer rate interactions. Lines 1455 1471-1, 1490, 1502,
Pavane, 1478, 1475, 1467, 1456, and 1468 had higher P concentrations then a least 20 other
entries. Total P uptake also statistically varied by P fertilizer rate and cultivar (Figure 3). The
interaction was also statistically significant. The line 1502 resulted in higher P uptake compared
to all other lines. The lines 1474, 1478, 1473, and 1470 were higher than a least 20 other entries.
The significant P rate by cultivar interaction indicates that in many cases cultivars varied in their
response to P.
As expected residual soil test P after harvest significantly increased by P rate (Table 1).
Interestingly, however, it also varied by cultivar suggesting that cultivars varied in their ability to
extract P from the soil.
Greenhouse N Fertilizer and RIL Experiment
The mean results for the greenhouse N fertilizer experiments are shown in Figure 4. Shoot dry
significantly (Table 1) varied to N fertilizer and cultivar. Furthermore, there was a significant N
rate by cultivar interaction. Above ground dry matter production was highest for 1490, Parade,
1445, and 1437.
There were statistically significant differences in above ground tissue N concentration to N
fertilizer and cultivar. The higher leaf N concentrations were in entries 1431, 1481, 1485, 1141,
and 1491. Total above-ground N accumulation (N uptake) was significantly increased by N
fertilizer rate and there significant differences among cultivars (Figure 5). Furthermore, the N
rate by cultivar interactions was statistically significant. As noted previously, calculated above-
ground uptake is the product of total above-ground dry matter accumulation and above ground
tissue concentration. The entries producing the highest uptake were 1495, Parade, 1490, and
1436. These were among the highest dry matter producers. They were not among those
resulting in the highest N concentrations but they were not among the lower ones either. It seems
dry matter production large drove the observed results for N uptake with N concentration
important to a lesser degree.
Interestingly residual ammonium-N and nitrate-N also significantly varied by N fertilizer rate
and cultivar. This suggest the cultivars varied in their ability to extract N from the soil (Table
1).
Field P Fertilizer and RIL Experiment
The results for the field P fertilizer experiment are shown in Figure 6. Above ground dry matter
production and marketable yield significantly increased to P fertilizer rate and varied by cultivar.
For example, lines 1430, 1440, 1441, 1447, and 1470 produced marketable yield greater than 4.4
kg and dry matter production greater than 30 g/plant. Interestingly, entry 1430 and 1440 which
were among those that produced the highest above ground dry matter and marketable yield, were
also among those that maintained lower solution pH through the 48 hour measurement period in
the pH experiment.
Above ground tissue P concentration significantly increased with P fertilizer but overall cultivars
effects were not statistically significant (Figure 7). Nevertheless, there were a few significant
(P<0.05) cultivar differences that might be inferred when using a non-protected least significant
Page 42 of 147
Arizona Department of Agriculture
Specialty Crop Block Grant Program
Agreement No. 12-25-B-1655
difference (LSD) comparisons. For example, using non-protected LSD comparisons, lines 1429,
1431, 1441, 1465, 1476, 1485, 1500, and 1502 resulted in higher P concentrations than 20 or
more other cultivar lines. Similarly, 1442, 1456, and 1472 resulted in lower P concentrations
than 15 or more lines.
Above ground P accumulation was significantly (P<0.01) different to P fertilizer rate and
cultivar. For example, entry 1502 produced higher P uptake than 68 other entries, lines 1441,
1476, 1492, 1496, and 1500 resulted in higher P uptake compared to more than 20 other entries.
The calculation of P uptake is the product of dry matter production and measured P
concentration. Since, differences in dry matter production were more pronounced that
differences in P concentration, the differences in P uptake are likely more associated with dry
matter production.
Field N Fertilizer and RIL Experiment
Marketable yield significantly increased to N fertilizer rate and varied by cultivar (Table 2).
Interestingly, measured dry weight increased to N rate but not by cultivar (Figure 8). If we use
non-protected LSD comparisons, differences are few. For example, the highest above ground
dry weight was for entry 1457 and it was only significantly greater than 42 other lines using non-
protected LSD comparisons. The next highest value is for entry 1439 and it is only significantly
better than nine other entries using non-protected LSD comparisons.
Above ground N concentration significantly increased to N fertilizer rate but not overall by
cultivar (Table 2). However, using non-protected LSDs a few inferred differences emerge. The
highest mean N concentration is 1.99% for entry 1435 but it is only significantly different using
the non-protected LSD of 0.45 from 27 other entries. The next highest mean value of 1.93% for
entry 1463 is only significantly different from 17 other entries using the non-protected LSD.
Similarly, N uptake increased to N fertilizer rate but overall effects to cultivar were not
significant (Table 2 and Figure 9). If we use non-protected LSD comparisons, differences are
few. The most interesting is line 1483 that produced significantly higher uptake than all but two
cultivars. Any other comparison does not exceed 5.
QTL Analysis
The QTLs detected in QTL network are shown in Table 3 where “A” is the additive effect, p-
value of the effect, and R2 is the proportion of the total variation explained by the QTL.
“Position” is the position of the peak marker in cM and “AE” is additive x environment effect for
each nutrient input level (low, med=medium, and high) follow with AE and its p-value. A
significant AE indicates that the effect of the QTL was not the same in each environment. All AE
here are positive values, indicating that difference between the QTL alleles was larger in some
environments. Significance of QTLs was determined at α=0.05 by 1000 permutations. A positive
“A” means Pavane allele has the superior genotype (higher value), and a negative “A “means
Parade allele has the superior genotype.
Table 4 shows QTL LOD scores by detected by single marker regression (SMR) and composite
interval mapping (CIM) were analyzed in the software qgene. Many traits were not normally
distributed. Log 10 transformation was performed for all traits prior to analysis. Each replicate
and environment (nutrient level) was tested separately. Critical LOD for α=0.05 by 1000
Page 43 of 147

Arizona Department of Agriculture
Specialty Crop Block Grant Program
Agreement No. 12-25-B-1655
permutations. All significant LOD peaks are listed below. Significant QTLs detected by other
methods indicated with and asterisk.
Discussion
All studies show significant differences among cultivars in rhizosphere pH modification, above
ground dry matter production and yield, and above ground N and P accumulation. Analysis
shows there were significant QTLs, suggesting N and P fertilizer use efficiency can be improved
through tradition breeding techniques. Evaluating this prospect was the objective of these
studies funded under SCBG 13-12.
Outreach
We have presented these studies funded under SCBG 13-12, along with those results obtained
under SCBG 11-29 to outline prospects for improved nutrient use efficiency through genetics in
grower workshops and field days. We estimated 80% of the vegetable industry in Arizona have
been exposed to these studies. Those exposed include growers, managers, and technical advisors.
In the presentation we estimate that we had contact with 387 individuals.
Beneficiaries The beneficiaries will ultimately be the lettuce industry. The public would also benefit from
reduced negative environmental impacts associated with fertilizations. However the objectives
of this study were to evaluate and demonstrate the prospects for breeding for improved
efficiency. The actual benefits can only be realized through a breeding program which was
beyond the scope of this project. We estimate that we had contact with 387 individuals.
Lessons Learned This study showed as we initially hypothesized, there is a strong possibility of improving
fertilizer use efficiency using traditional breeding technologies.
Contact Person Charles A. Sanchez
928-782-3836
Enhancing IPM in Arizona Vegetable Crops This project was completed on September 30, 2015
Project Summary Arizona growers are one of the leading producers of fresh-market vegetables in the U.S.,
producing vegetables and melons on 134,000 acres at an estimated value of over $900 million
annually. However, vegetable cropping systems in Arizona are pest-intensive and growers
annually spend millions of dollars battling a multitude of insect pests, weeds and plant diseases.
Furthermore, new pest problems periodically challenge the industry causing unwanted economic
losses. Because of the high crop values and consumer demands for aesthetically appealing and
pesticide-free produce, Arizona vegetable growers are forced to use IPM tactics that are both
effective and safe. UA Extension Specialists and Research Scientists have been working with
Page 44 of 147
Arizona Department of Agriculture
Specialty Crop Block Grant Program
Agreement No. 12-25-B-1655
local growers for years in developing useful information that will assist them in their pest
management activities and their endeavors to satisfy consumer and regulatory demands.
Continual maintenance of existing IPM programs and implementation of new IPM strategies is
essential for sustaining economically and environmentally sound production of vegetable crops
in Arizona. Cost-effective adoption of new reduced-risk control technologies by growers and
PCAs will require a significant knowledge base of pest biology, ecology, impact and
management. Because “All IPM is local”, the knowledge base necessary for training young
PCAs and implementing new IPM approaches must be developed specifically for desert growing
conditions in Arizona. Presently, information on vegetable IPM in Arizona has resulted almost
exclusively through the efforts of several University of Arizona Cooperative Extension
specialists and agents who have developed objective, research-based IPM information on insects,
weeds and plant diseases. Although individual research programs are adequately supported from
local and national grant funding, resources to sufficiently support IPM educational programs for
desert vegetable crops are scarce. to continue on with our team efforts to enhance our unbiased,
science-based multidisciplinary IPM outreach program that emphasizes the development,
validation, and delivery of timely and relevant information and technologies for managing pests
in Arizona vegetable and melon crops that 1) reduces reliance on broadly-toxic pesticides
without sacrificing yield, quality and profitability, and 2) concurrently minimizes dietary and
environmental risks.
Project Approach The objective of this two-year project were achieved by strategically investing in an extension
educator to assist team members in delivering and demonstrating IPM in local high value,
vegetable production systems. Similar projects have been funded since 2009 year by the SCBGP
to provide support for an extension educator. The extension educator, Mr. Marco Pena, was hired
in late November 2009 where he initiated and continues to participate in a number of project
activities in association with the team members. The Vegetable IPM team members, who are
responsible for the majority of the educational materials and activities, include Dr. John
Palumbo, Extension Entomologist; Dr. Mike Matheron, Extension Plant Pathologist; and Mr.
Barry Tickes, Area Weed Specialist.
The most significant activity in which the Vegetable IPM Team has been engaged is in the
maintenance of an innovative outreach system for delivering timely and relevant information to
our varied Arizona stakeholders and beneficiaries through our Vegetable IPM Updates. During
the present project the Vegetable IPM Team has delivered 53 bi-weekly updates that provided
new and useful information to vegetable growers and PCAs with the assistance of our extension
educator. These email updates contained detailed information on insect, weed, disease
management along with market information that are presently important to Arizona vegetable
growers. Each update contained at least one electronic pdf document available on our website
that contains timely research information addressing a relevant local pest problem. These updates
have been sent to PCAs, growers and other agribusinesses every two weeks since early January
2010. The updates can be found at http://ag.arizona.edu/crops /vegetables /advisories
/advisories.html.
The Arizona Vegetable IPM team members have set up and participated in field translational
research and on-farm demonstrations with cooperating vegetable growers in the Yuma county
Page 45 of 147
Arizona Department of Agriculture
Specialty Crop Block Grant Program
Agreement No. 12-25-B-1655
area. Several projects that were completed during this project included herbicide demo trials for
melons and broccoli, and large translational research projects which focused on area-wide
whitefly and virus management. We also maintain diagnostic services for insect, pathogen and
weed identification which includes a pesticide diagnostics laboratory maintained by our
Assistant in Extension.
In 2013, an area-wide pheromone trapping network was established where real-time information
on trap captures are provided via our email updates. The trap captures are presented graphically
on a weekly basis and are also available upon request from our stakeholders. This trapping
network was expanded in 2014 and 2015 (from 8 to 15 trap locations).
Our Vegetable IPM Team, participated in the development and publications of miscellaneous
extension publications that have been provided on-line via our Arizona Crop Information internet
site http://ag.arizona.edu/crops/ .The team also successfully organized and participated annually
in numerous educational meetings including the Lettuce Insect, Disease and Weed Workshop
held annually in April, the AZCPA Desert Ag Conference held annually in May, the Desert Pre-
Season Vegetable Workshop held annually in Aug, and the Fall Desert Crops Workshop held
each October. The extension educator has also produced a number of video demonstrations on
various aspects of vegetable IPM. These videos and others can be found on our Vegetable IPM
Video Archive page which contains a collection of educational videos from current research
work in vegetable crops by University of Arizona Researchers. Finally, the extension educator
has been engaged with numerous stakeholders soliciting input for identifying their IPM
needs/priorities as well as feedback on the relevance of our deliverables.
Goals and Outcomes Achieved Our primary expected outcome for this project was to increase awareness and technical
knowledge of IPM among target audiences. Based on the activities described above, the
Vegetable IPM Team achieved this goal by producing and delivering numerous educational
materials, workshops, meetings, and grower demonstrations. A total of 46 continuing education
units (CEUs) were provided by the team during this project with attendance at these meeting
ranging from 41 to over 300 attendees, which is a significant increase to the usual meeting
attendance which rarely exceeded 60 participants. An increase of awareness has also been
demonstrated by the number of subscribers to our VegIPM Updates over the course of the last 2
years. When we initiated the project in January 2010, our list serve contained about 170
emails addresses. At the completion of this project, the email list serve contained slightly
more than 700 addresses who receive our bi-weekly update. This list continues to grow
monthly via word of mouth among growers, PCAs and other industry stakeholders statewide.
Based on the overwhelming increase in subscriptions and users of our IPM information, we
estimate that IPM awareness and usage by stakeholders has clearly increased by more than
30%. In addition, upon request from a popular regional publication, our IPM Veg updates are
published bi-weekly on their website which caters to stakeholders throughout the western US:
the Western Farm Press, http://westernfarmpress.com/. This publication reaches well over a 1000
subscribers throughout the western U.S. In addition, we receive positive feedback on the
information we provide via these updates. Most of the comments are very complimentary and
inform us that the information is constructive to the daily activities of the growers and PCAs who
view the updates.
Page 46 of 147
Arizona Department of Agriculture
Specialty Crop Block Grant Program
Agreement No. 12-25-B-1655
Our long term expected outcome was to increase the use of IPM tactics. We been measuring this
outcome though the Insect, Disease, and Weed Losses Workshops described above. To date we
have collected baseline data (2004-2015) on sampling, pesticide usage, threshold usage and
profitability that will allow us to measure changes in grower behaviors in the IPM tactics they
adopt. During this project we have continued to collect data on sampling, IPM tactics and
pesticide usage. The data collected specifically shows that PCAs are now scouting at higher
intensity levels, where field visits increased 10% per week since 2010. Also the usage of
economic decisions levels (i.e., action thresholds) has increased through the awareness of insect,
weed and disease pressure. PCAs have reduced the number of spray applications of broadly toxic
insecticides by almost 20% since 2010. Perhaps most important has been the steady increase in
the use of “soft” reduced-risk pesticides. PCAs continue to treat a greater number of lettuce acres
with soft chemistry rather than the broad spectrum OP/carbamate chemistries.
Beneficiaries The stakeholders who directly benefitted from this project include vegetable growers, PCAs,
vegetable seed company representatives, Agri-chemical Industry representatives, and
miscellaneous agribusinesses. The impact of this project on the beneficiaries is best measured by
the significant increase in attendance at educational meetings, and the rapid growth in our list
serve for our VEG IPM updates, which increase 2-fold during the project. We have only had
three individuals cancel their subscription since we began the project in 2010. The number of
positive comments by our stakeholders concerning the updates is also a positive measurement of
the relevancy of our activities. The fact that a large regional agricultural publication also
requested to use our updates indicates the value in the outcomes of this project. Based on the
updates alone, we estimate that well over 500 stakeholders in Arizona, (and likely another 200 in
California and other states) have benefitted from this project.
The economic impacts of this project are difficult to measure at this time, but our quantification
through our Insect, Disease, and Weed Losses Workshops has shown a definite measure in
behavior which has certainly resulted in economic and environmental improvements. Direct
benefits to the stakeholder are best explained through our results from the Workshops that show
a trend in the consistent reduction in total pesticide usage in crops like lettuce, and in particular,
organophosphate pesticide usage by stakeholders. This also occurred with an increased usage of
soft, reduced risk chemistry which has a significantly reduced risk in mammalian and
environmental toxicity. Furthermore, these surveys indicate that PCAs are scouting more, with
an increased consideration of pest biology/ecology when making IPM decisions.
Lessons Learned The most helpful lesson learned from this project was that to reach our stakeholders we had to
adapt to new technology. Smart-phone, tablet and laptop computer technology is now employed
by all growers and PCAs so the email updates are a great mechanism to deliver timely, relevant
information as opposed to fax and postal mailings that we used to use prior to this project. This
approach was very easy to implement and maintain, and is obviously appreciated by our
clientele.
Page 47 of 147
Arizona Department of Agriculture
Specialty Crop Block Grant Program
Agreement No. 12-25-B-1655
Contact Person John C. Palumbo, Professor and Extension Specialist, Yuma Agricultural Center
928-782-5885
Additional Information For a complete access to the Veg IPM Updates, associated publications, and IPM videos that cite
the results of this project, please go to:
http://ag.arizona.edu/crops /vegetables/advisories/advisories.html
Managing Weeds in Nursery Containers This project was completed on December 31, 2014
Project Summary This project is part of an ongoing effort to reduce the incidence of weeds in nursery containers, a
serious problem identified by Arizona growers. Weeds compete with nursery plants for water,
fertilizer, light and space; and some weeds, such as spurge, may pose health and safety hazards
for nursery workers. This project investigated available chemical options to manage weeds in
nursery containers, trained nursery workers in best weed management practices and produced
data that has been and will continue to be shared through a variety of outlets.
Project Approach Initial visits were made to wholesale nursery production yards throughout Maricopa County to
survey weed pressure and assess worker willingness to participate in trainings. Herbicide
efficacy trials were set up at two grower-cooperator sites. Worker training sessions included
weed identification and herbicide application techniques. Phytotoxicity screenings were
conducted on new products to assess their suitability for use in low desert container production
systems. It was determined that all of the industry standard pre-emergence herbicides are
effective at reducing weed germination, if applied at the labeled rate. Most of the nursery
workers that were trained initially applied the products below the labeled rate resulting in poor
weed control. Calibration trainings taught workers to apply products correctly for better
management.
Goals and Outcomes Achieved Since 2010, applied research has been conducted at wholesale grower sites to evaluate best
practices for managing spurge. Laminated posters and a YouTube teaching about spurge
management in English and Spanish have been created and distributed to nurseries around
Arizona. Results from the research have been presented at the Southwest Horticulture Annual
Day of Education (SHADE), the annual meeting of the American Society for Horticultural
Science, the First Annual CALS Poster Symposium and to the Western Society for Weed
Management. This work has also captured national attention and was featured in a press release
by the Weed Science Society of America in 2013. In 2014, Dr. Worku Burayu was hired and
conducted spurge management and herbicide calibration trainings with 100 nursery
professionals.
Page 48 of 147

Arizona Department of Agriculture
Specialty Crop Block Grant Program
Agreement No. 12-25-B-1655
Outcomes:
Nursery workers, managers and owners increased their knowledge (GOAL) during the 12
month project (TARGET) from a 2 to 6 (1 is least and 10 is best) (BENCHMARK) on
sanitation, formulation, calibration, and uniform & proper rate of application
training/education as a result of their training (PERFORMANCE MEASURE).
A comprehensive plan to manage weeds in nursery containers was developed. Increased
herbicide application efficiency results in fewer pesticide applications in nurseries.
Herbicide efficacy trials at research plots indicated that opportunities for improved control
do exist, with products such as Marengo G, freehand and Biathlon herbicides. It also
indicated the availability of alternative such as mulches to herbicides.
The incidence of weed pressure in nursery containers at grower sites was reduced (GOAL)
by 25% -50% over the course of 12 months (TARGET). This was measured by visual
assessments of weed pressure (BENCHMARK) in containers that were loaded onto trucks
prior to distribution (PERFORMANCE MEASURE).
Beneficiaries More than 100 participants including workers, growers, managers and owners were given
education/training or talks to increase their awareness of weeds pressure in nursery
production and increased their ability to scout nursery for weeds pressure (Table 1).
Ten nursery production industries outreached and 14 specific growing sites visited.
Their knowledge on math calculation ability rose to 5-6 levels from 2-3 level of the range 1
to 10 (1-least, 10 best).
Survey results indicated that weed management is still a major production challenge in
Arizona nursery, with prostrate spurge, bittercress and desert broom listed as major
problems.
Interviews, surveys and field visit reiterated that hand removal of weeds, herbicides and
mulches are the main tool available in the fight against weeds for growers producing field
and container grown plants.
The following Arizona nurseries were beneficiaries of the trainings:
AAA Landscape
All Seasons Wholesale Growers
Arid Solution Nursery
Baseline Tree Company
Desert Horizon Nursery
Desert Tree Farm
Dream With Colors
Mountain States Wholesale Nursery
Sunrise Tree Farm
Western Tree Company
Lessons Learned Our work in the area of managing weeds in nursery containers has yielded practical advice for
nursery growers. Available products work and if a zero tolerance attitude is adopted regarding
the most hazardous weeds, management to acceptable levels is possible. It is up to the workers
Page 49 of 147
Arizona Department of Agriculture
Specialty Crop Block Grant Program
Agreement No. 12-25-B-1655
and those that supervise them to ensure that the practices we have developed are implemented. If
the behavior of the nursery workers doesn’t change, weeds will continue to be one of the most
challenging issues.
Contact Person Kelly Murray Young
602-827-8219
Mechanism for Improving Seed Placement Uniformity This project was completed on August 31, 2016
Project Summary Over the last couple of years, automated machines for thinning lettuce have been commercialized
offering the potential to provide significant labor and cost savings to growers. Their adoption
however has been limited due in part to their poor performance when plants are irregularly
spaced. Uniform plant spacing is critical since these systems require separation between leaves
on adjacent plants to reliably identify and remove individual seedlings. Although vegetable
seeds are typically sown with precision planters, seed placement uniformity is surprisingly poor.
Research studies with lettuce have shown that only about 75% of the seeds planted with a
precision planter were placed within 0.5 inches of the target spacing. After thinning the stand
with an automated machine, about 10% of the plants were spaced closer than 3 inches apart
(missed plants) and about than 70% of the plants were spaced within 1.5 inches of the optimal
final plant spacing of 10.5 inches. This resulted in increased time for hand laborers required to
remove excess seedlings and a lower than ideal percentage of plants properly spaced for
optimum yield and quality. The overall goal of this project is to develop technologies that
improve planter seed placement uniformity and automated thinner performance. Specific
technical objectives are to improve seed placement accuracy by 1) making modifications to
existing planters and 2) a developing a cell wheel planter for precision placement of seed. This
proposal enhances and builds on the accomplishments of a previously funded ADA SCBGP
project. In that project, a prototype automated thinning machine for lettuce was developed. The
device’s novel technologies have been commercialized and several units have been sold. Three
additional companies have entered the automated thinning market and in 2015 and
approximately 30% of the acreage is thinned by machine. Improving seed placement uniformity
will enhance the performance of these machines, thereby increasing their adoption. An
additional benefit is that development and utilization of these technologies will reduce post
thinning labor requirements and thereby lower production costs.
Project Approach One hypothesis for improving seed placement precision was to better control seed delivery.
Conventional vacuum planters release seeds at distance of more than 3 inches above the soil
surface. Consequently, small deviations in seed release angle can have a dramatic effect on seed
placement precision. To test this hypothesis, two modifications of a conventional vacuum
planter model Stanhay 785 Singulaire planter (Stanhay Webb Ltd., Bourne, UK) were developed.
The first modified unit had the standard furrow opener replaced with a custom designed opener
that reduced the seed release height from 3.2 to 2.6 in. Henceforth, this unit will be referred to as
the “Mid-Ht” vacuum planter. The second modified unit tested had a seed drop height of 1.9 in.
Page 50 of 147
Arizona Department of Agriculture
Specialty Crop Block Grant Program
Agreement No. 12-25-B-1655
To obtain such a low drop height, the bottom of the planter’s metering unit casting was cut off
and milled flat. A custom made furrow opener was then attached to the bottom of the unit. This
configuration was termed “Low-Ht.” These units were compared with the unmodified unit (Vac-
Conv). To further investigate the effect of control of seed delivery on seed spacing uniformity,
belt planters were also investigated. Belt planters differ from vacuum planters in that they
release seed when the hole carrying the seed passes an opening in the bottom of the planter - in
essence seed is released freely with a horizontal velocity. Vacuum planters, on the other hand,
release seed when the seed passes the vacuum “cut-off” point where the pressure differential
holding the seed to the seed plate is eliminated. Another difference is that belt type planters
typically release seed at lower heights as compared to vacuum planters, but the amount depends
on the type of furrow opener used. Here, a belt planter equipped with a conventional opener
(Belt-Conv) and a unit equipped with an aftermarket opener manufactured by Sutton Ag
Enterprises (Belt-Sutton Ag) were included for testing. Seed drop heights were 1.9 and 2.5
inches respectively.
The second reason for poor seed placement precision is that seeds bounce and roll after
encountering the soil surface. To address this, a pressurized cell wheel style planter was
developed that allows seed cells moving at speeds equivalent to, or nearly equivalent to typical
planter travel speeds. This feature allows seed to be released with a rearward horizontal velocity
equal to, or nearly equal to, the forward speed of the planting unit. Further, the planter unit was
designed to release seed at a minimal height above the soil surface, thereby limiting seed velocity
in the vertical direction. By minimizing the relative velocity between the seed and soil surface,
the amount the seed bounces and rolls after placement is minimized. As a result, the design
should provide consistent and accurate seed spacing. An invention disclosure on the novel
design was submitted to Tech Launch Arizona, the University of Arizona’s patent office. Three
iterations of the design were fabricated and tested. Although the designs showed promise, none
were able to feed seed reliably due to the high rotation rate of seed metering cell wheel. It is
believed that with further research, a satisfactory design could be developed however, due to
grant period time limitations, this work could not be completed. As a consequence, we were
unable to include a cell wheel planter design in the planned field trials.
Goals and Outcomes Achieved To address the address the measurable outcomes of the project, two studies were conducted. In
the first study, the performance of the three vacuum planter and two belt planter configurations
were tested in situ with pelleted lettuce seed at four travel speeds ranging from 1.0 to 2.5 mph.
Seed spacing measurements were recorded and analyzed. In the second study, the same planter
configurations were evaluated, however, in this experiment the seeds were germinated, thinned
by an automated thinning machine and pertinent post thinning performance measurements were
recorded including crop plant spacing accuracy, hand weeding time and crop yield. Three travel
speeds ranging from 1.0 to 2.5 mph were examined.
Results of the first experiment showed that when averaged over all test speeds, the Belt-Conv
configuration had significantly better seed placement accuracy, fewer skips and lower seed
placement variability as compared to Vac-Conv. At low speeds, Belt-Conv had less than 1%
closely seed spacings (≤1.2 inches) that would be considered difficult to thin by machine, while
the percentage for Conv-Vac was 5.3%. Further, the percentage of seeds within ± 0.4 inches of
Page 51 of 147
Arizona Department of Agriculture
Specialty Crop Block Grant Program
Agreement No. 12-25-B-1655
the target spacing for Belt-Conv was 93% and pointedly higher than Vac-Conv at 64%. The data
also showed that planter performance declined dramatically at speeds over 1.5 mph. These
findings suggest that there was a travel speed threshold, above which seed bounce and roll have a
significant negative affect seed placement precision. Considering all assessment factors, the
results showed that operating speeds for planters be kept to around 1.5 mph or lower to obtain
best performance and acceptable levels of closely spaced seeds for good automated thinning
machine performance.
Examining the project’s first measurable outcome where the goal was to increase the percentage
of seeds placed within ±0.5 inches of the target location by 10%, the objective was not met in the
study conducted. However, the Mid-Hit configuration where the planters seed drop height was
lowered increased the percentage of precisely spaced seeds (±0.5 inches of target location) by an
average of 5%. The maximum improvement occurred at a travel speed of 1.0 mph where seed
placement precision increased by 9%. The Mid-Ht configuration also had 47% less closely
spaced seeds that would be difficult to thin by machine than Vac-Conv. Although the expected
performance gains were not realized, the improvements realized should be enough to result in
significantly improved automated thinning performance – i.e. fewer excess seedlings left in the
field after thinning. Another beneficial finding was that belt planters provided superior
performance as compared to vacuum planters. The percentage of seeds placed within ±0.5 inch
of the target location was 20 percentage points higher (a 39% increase) with the belt planter.
This finding is important in that it goes against the common perception that vacuum planters are
more accurate than belt planters. With an educational effort promoting these significant gains in
performance, growers may be convinced to switch back to the older style belt planters to
improve planter and subsequently, automated thinner performance.
In the second experiment, the remaining measurable outcomes were addressed. The first of these
was to increase the percentage of plants after automated thinning that are spaced ±1.5 inches of
the desired final plant spacing from 75% to 85%. This goal was not achieved in the experiment
conducted. One possible reason for this is that the experiment was confounded in that the
percentage of plants spaced within the desired spacing was much lower than expected (<49%)
for all treatments. This was due to a very poor plant stand. Even so, the modifications made to
conventional vacuum planters showed promise for improving crop plant spacing. The best
performing planter was the Low-Ht configuration where percentage of plants within the desired
spacing was 5% percentage points higher (11% increase) as compared to the standard unit (Vac-
Conv). In a more typical situation where 75% of the plants are at the optimal plant spacing, an
11% increase would result in having over 83% within ±1.5 of the desired plant spacing which is
very close to the measurable outcome goal of 85%.
The experiment’s second measurable outcome was to decrease the time required by hand crews
to remove excess plants after machine thinning from 6 hr/ac to 4.8 hr/ac, or 1.2 hr/ac. This goal
was not achieved, again possibly due to experimental conditions. In the study, the percentage of
plants that were closely spaced and considered to be time consuming to remove was very low,
less than 2% for all treatments. As a result, there were no significant differences in hand
weeding labor requirements between planter configurations. If better germination rates had been
obtained, the number of closely spaced plants would have been higher. In this scenario, the
effect planter performance on hand weeding labor rates could be more readily determined and
perhaps the expected differences would have been found.
Page 52 of 147
Arizona Department of Agriculture
Specialty Crop Block Grant Program
Agreement No. 12-25-B-1655
The final expected measurable outcome from this experiment was to increase the percentage of
marketable heads from 80% to 83%. Results of the experiment were variable, with no consistent
trends for any of the treatments. With no significant difference found, the expected measurable
outcome was not achieved. Due to the confounded experiment, it is recommended that the
experiment be repeated to better determine if the measurable outcomes were achieved.
Beneficiaries The primary accomplishment of the project was the development of vacuum planter
modifications that lowered seed drop height and significantly improved planter performance. The
best performing designs increased the percentage of precisely spaced seeds (±0.5 inches of target
location) and the percentage optimally spaced crop plants (±1.5 inches of desired spacing) by
5%. This will be of benefit to the approximately 150 growers in Arizona who raise direct
seeded vegetable crops since uniform plant spacing is important for maximizing yield. The best
design also had 47% less closely spaced seeds that would be difficult to thin by hand or machine
as compared to the conventional planter. This will be of benefit to the roughly 150 Arizona
growers who raise crops that are thinned since less hand labor will be required to remove excess
seedlings and automated machine thinning performance will improve. While not quantitatively
shown in the experiment conducted in this project, a 47% reduction in closely spaced plants
would reduce the time required by hand crews to remove excess plants after machine thinning by
an estimated 0.6 hr/ac. This estimate is based on data from published studies on the effect on the
number of closely spaced plant on labor requirements. If these results were obtained and labor
rates were $13/hr, growers would save approximately $4/ac. Further, if yields were increased by
1% through improved seed spacing uniformity and optimally spaced plants, gross farm revenues
would increase by about $75/ac. If these gains were realized on the 50,000 acres of iceberg and
romaine lettuce raised in Arizona, growers would save $200,000 annually in labor costs and
increase revenues by $3.75 million. Other beneficiaries include manufacturers of precision
planters, researchers and industry representatives who, along with growers, were informed of the
results of this project through the various outreach means listed in the Additional Information
section.
Lessons Learned Although seed drop height had a significant effect on seed placement precision, we learned that
the magnitude of the relative velocity between the seed and the soil surface has a much larger
effect. This is due to the fact that seeds bounce and roll after encountering the soil surface. As
such, future designs for improving precision planter performance should focus on releasing seed
with a rearward horizontal velocity equal to, or nearly equal to, the forward speed of the planting
unit. One such unit was attempted to be developed in this project, however the high rate of seed
plate rotation required prevented seed from being able to be fed reliably. Just prior to the
termination of this project, equipment manufacturers commercialized row crop planters that
utilize innovative brush belts to release seed with rearward velocities equal to planter travel
speed. This brush belt concept should be investigated by researchers for precision vegetable
seed planters.
An unexpected result was that belt type planters performed significantly better than vacuum
planters as the opposite is commonly believed to be true. Another unexpected outcome was that
there appears to be a critical speed, above which belt and vacuum planter performance decline
Page 53 of 147
Arizona Department of Agriculture
Specialty Crop Block Grant Program
Agreement No. 12-25-B-1655
significantly. In the studies conducted here, that speed appears to be around 1.5 mph. This
information has value to growers as it gives them a guideline on how to maximize performance.
Unfortunately, the expected measurable outcomes could not be validated as a result of a poor
stand establishment and a compromised experimental trial. The modifications made to vacuum
planters, however, were shown to significantly improved performance. As such, further studies
to determine their effect on hand thinning labor costs, automated thinning machine performance,
post thinning labor costs, final plant spacing uniformity and crop yield are recommended.
Contact Person Mark C. Siemens
(928) 782-3836
Additional Information This project has enhanced the competiveness of lettuce crops raised in Arizona through
improved planter designs and knowledge about planting systems. Planter modifications were
made that improve seed spacing uniformity, reduce the percentage of plants that are difficult to
remove by hand or machine and increase the percentage of plants are the optimally spaced for
yield and quality. By lowering labor costs and increasing yield, farm profits are increased and
thereby crop production is inherently more competitive. Improved planter performance will also
help increase the adoption of automated lettuce thinning machines since uniform plant spacing is
important for good performance. Utilization of these machines lowers production cost which in
turn makes lettuce produced in Arizona more price competitive.
An extensive outreach effort has been made to educate growers, industry, equipment
manufacturers and researchers about the knowledge gained and accomplishments of this project.
A listing of these efforts follows.
Refereed Publications and Patents
Siemens, M.C., & Gayler, R.R. 2016. Improving seed spacing uniformity of precision vegetable planters.
Appl. Eng. Agric., 32(5), 579-587. DOI 10.13031/aea.32.11721.
Siemens, M.C. and R.R. Gayler, 2014. Seed metering system and apparatus for precision metering of
seed. Invention Disclosure. University of Arizona Tech Launch Arizona. Docket Number UA 15-
098. 7 pp.
Non-Refereed Publications Siemens, M.C. & Gayler, R.R. 2015. Improving seed spacing uniformity of precision vegetable planters.
ASABE paper No. 152190060, pp. 11. St. Joseph, Mich: ASABE.
Web Apps Siemens, M.C., Soni. A. & Marjari, N. 2016. Web-Based Tool for Analyzing Planter and Automated
Lettuce Thinning Machine Performance V.2. Tucson, Ariz.: University of Arizona. Available at
http://testsite.seedandplantspacinganalyzer.webhost.uits.arizona.edu/sps-analyzer.
Siemens, M.C. & Soni. A. 2015. Web-Based Tool for Analyzing Planter and Automated Lettuce
Thinning Machine Performance V.1. Tucson, Ariz.: University of Arizona. Available at
http://seedandplantspacinganalyzer.webhost.uits.arizona.edu/sps-analyzer.
Page 54 of 147
Arizona Department of Agriculture
Specialty Crop Block Grant Program
Agreement No. 12-25-B-1655
Popular Press Publications Andrade, K.G. 2015. Planting Seed of the Future: Yuma Ag Center Making Inroads with Agricultural
Technology. Yuma Daily Sun, August 30, p. 1, 3. Yuma, Ariz.: The Sun.
Presentations Siemens, M.C. 2016. Seed Spacing Uniformity of Vegetable Planters and Tools to Assess Performance.
2016 Lettuce Days, Yuma, Ariz., February 26-27. 15 hours. Attendance - 800.
Siemens, M.C. 2016. Seed Spacing Uniformity of Vegetable Planters and Tools to Assess Performance.
2016 Southwest Ag Summit Field Demonstration, Yuma, Ariz., February 24. 4 hours. Attendance
- 250.
Siemens, M.C. 2016. Seed Placement Uniformity and its Effect on Automated Thinner Performance.
Automated Technologies Field Day, Yuma, Ariz., January 15. 30 minutes. Attendance - 55.
Siemens, M.C. 2015. Comparing and Improving Seed Spacing Uniformity of Vacuum and Belt Planter.
2015 Pre-Season Vegetable Workshop, Yuma, Ariz., August 2. 30 minutes. Attendance - 65.
Siemens, M.C. 2015. Improving Seed Spacing Uniformity of Precision Vegetable Planters. 2015
ASABE Annual International Meeting, New Orleans, La., July 28. 15 minutes. Attendance - 25.
Pathogen Transmission to Crops from Animals This project was completed on September 30, 2015
Project Summary Wild and domestic animals have been implicated in fecal contamination of produce resulting in
foodborne outbreaks. However, growers have only limited information on which fecal sources
present the most hazards to fresh produce, specifically leafy greens. As a result, all fecal
deposition is treated as highly pathogenic, resulting in loss of produce and revenue. This study
worked to screen a multitude of fecal samples for molecular markers specific to foodborne
pathogens including Listeria monocytogenes, Shiga-toxin producing E. coli, Salmonella
enteritidis, and Campylobacter jejuni. Data on the presence of these pathogens was incorporated
into databases to estimate bacterial survival from each fecal source. Finally, the research and
extension team developed a user-friendly tool to facilitate effective communication of scientific
results to the agriculture industry and to increase awareness of risk at the earliest points in the
food production chain.
Since the much-publicized 2007 California spinach outbreak of E. coli O157:H7 and the
subsequent identification of feral hogs as the pathogen source, efforts have been heightened
nationwide to exclude all animals, wild and domestic, from fresh produce fields. The risks
presented by animal scat were also addressed in the recent Food Safety Modernization Act
(FSMA), which requires the US Food and Drug Administration to include animal invasion in
setting science- and risk-based standards for the safe production and harvesting of fruits and
vegetables. However, databases of pathogen presence and survival in field fecal depositions are
limited and contain little to no information on the relative risk for emerging pathogens implicated
in recent foodborne outbreaks (e.g., Listeria, non-O157 Shiga-toxin producing E. coli).
Expansion of current databases through screening of fecal samples from wild and domesticated
animals, for traditional pathogens (e.g., Salmonella, Campylobacter) as well as pathogens of
emerging concern, is critical for accurate risk assessments of produce safety. Furthermore, there
exists a need to develop user-friendly tools for effective communication of scientific results to
agricultural industry in order to increase awareness of risk at the earliest points in the food
production chain.
Page 55 of 147
Arizona Department of Agriculture
Specialty Crop Block Grant Program
Agreement No. 12-25-B-1655
Project Approach Databases of pathogen presence and survival in field fecal depositions are limited, and contain
little to no information on the relative risk for emerging pathogens (such as Listeria
monocytogenes) implicated in recent foodborne outbreaks (Surveillance for Foodborne Disease
Outbreaks, 2013). Published information also is usually collected only after an outbreak has
occurred, so background levels of existing pathogens in the environment are not currently well
known. Ruminant animals (Laidler et al., 2013), and feral swine (Cornick & Helgerson, 2004)
are considered to be reservoirs of E. coli O157:H7, a Shiga toxin-producing pathogen. However,
little more is known about whether other animal species can act as reservoirs of pathogens
known to cause foodborne illness, or if there are differences in pathogen shedding rates between
wild and domestic animals. It has been previously suggested that domestic animals harbor higher
concentrations of pathogens in their feces than wild animals due to living in close proximity to
other animals and humans (Rice et al., 2003).
Pathogens of concern for this study include Shiga toxin-producing E. coli, Salmonella spp., L.
monocytogenes, and Campylobacter jejuni, which have all been acknowledged by the Centers for
Disease Control (CDC) as important bacterial foodborne pathogens (Scallan et al., 2011).
Objectives of this study were to: (1) screen fecal samples from a vast range of animals for the
presence of these pathogens, and (2) to incorporate the resulting data into user-friendly tools for
growers, field workers, and other industry personnel. Using bacterial culture/enrichment and
molecular techniques, we assessed whether or not there are certain species of animals that
present a greater incidence of carrying pathogens than others, and if there is a difference between
wild and domestic animals.
This research supports the goals of the Leafy Green Marketing Agreement (LGMA) and FSMA
guidelines by providing data necessary for more accurate assessment of the risks associated with
animal intrusion into agricultural fields. Directing the communication of the final data to industry
will, in turn, focus the risk assessment results on the earliest points in the food production chain.
Significant Contributions and Roles of Project Partners:
Dr. Channah Rock, Associate Professor and Water Quality Specialist at UA and lead PI
for this project, coordinated the management of this project, including the supervision of
graduate students, visiting interns and staff; organized activities and communications
with project partners; convened project meetings; interacted with stakeholders to review
data; supervised development of outreach and data outputs; contributed to the
development of outreach materials and workshops related to the project, and has
presented information about this project to growers and other local stakeholders in
Arizona and California.
Dr. Jean McLain, Associate Director for the Water Resources Research Center helped to
develop and refine the sampling approach used for the study and contributed to the
development of outreach materials including presentation and workshop materials
supplied to stakeholders. Additionally, she provided guidance to the graduate student and
helped to troubleshoot specific assays used in this project.
Page 56 of 147
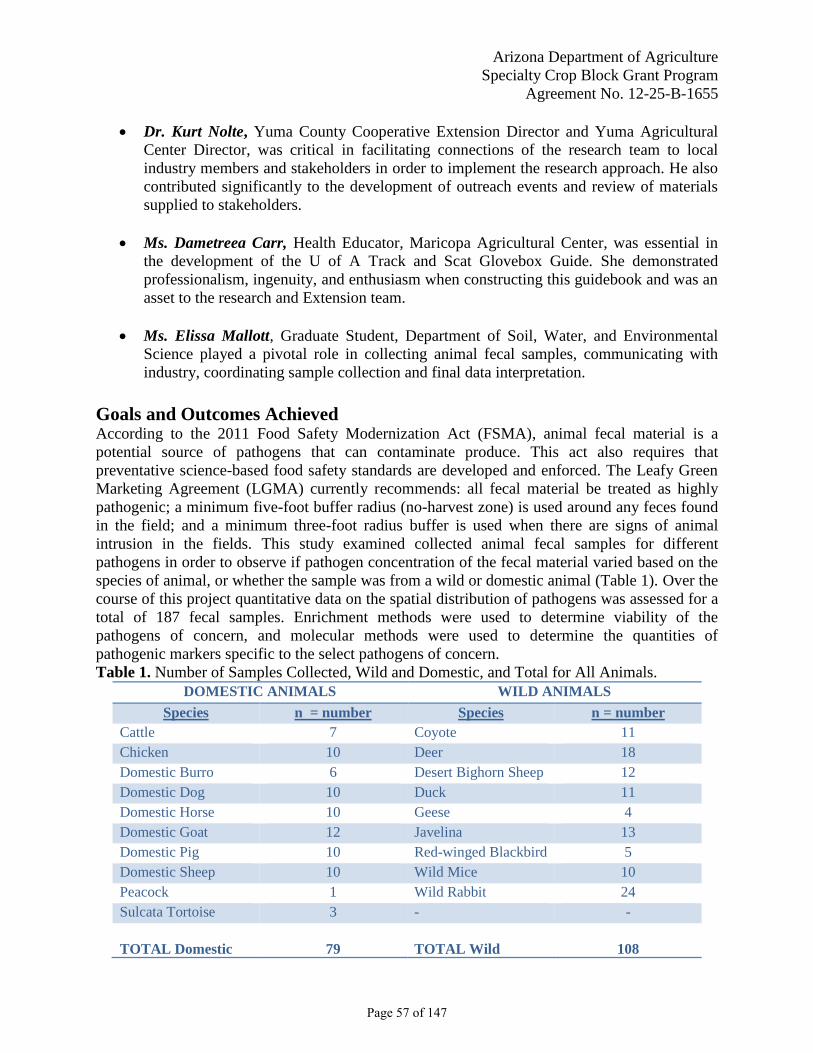
Arizona Department of Agriculture
Specialty Crop Block Grant Program
Agreement No. 12-25-B-1655
Dr. Kurt Nolte, Yuma County Cooperative Extension Director and Yuma Agricultural
Center Director, was critical in facilitating connections of the research team to local
industry members and stakeholders in order to implement the research approach. He also
contributed significantly to the development of outreach events and review of materials
supplied to stakeholders.
Ms. Dametreea Carr, Health Educator, Maricopa Agricultural Center, was essential in
the development of the U of A Track and Scat Glovebox Guide. She demonstrated
professionalism, ingenuity, and enthusiasm when constructing this guidebook and was an
asset to the research and Extension team.
Ms. Elissa Mallott, Graduate Student, Department of Soil, Water, and Environmental
Science played a pivotal role in collecting animal fecal samples, communicating with
industry, coordinating sample collection and final data interpretation.
Goals and Outcomes Achieved According to the 2011 Food Safety Modernization Act (FSMA), animal fecal material is a
potential source of pathogens that can contaminate produce. This act also requires that
preventative science-based food safety standards are developed and enforced. The Leafy Green
Marketing Agreement (LGMA) currently recommends: all fecal material be treated as highly
pathogenic; a minimum five-foot buffer radius (no-harvest zone) is used around any feces found
in the field; and a minimum three-foot radius buffer is used when there are signs of animal
intrusion in the fields. This study examined collected animal fecal samples for different
pathogens in order to observe if pathogen concentration of the fecal material varied based on the
species of animal, or whether the sample was from a wild or domestic animal (Table 1). Over the
course of this project quantitative data on the spatial distribution of pathogens was assessed for a
total of 187 fecal samples. Enrichment methods were used to determine viability of the
pathogens of concern, and molecular methods were used to determine the quantities of
pathogenic markers specific to the select pathogens of concern.
Table 1. Number of Samples Collected, Wild and Domestic, and Total for All Animals.
DOMESTIC ANIMALS WILD ANIMALS
Species n = number Species n = number
Cattle 7 Coyote 11
Chicken 10 Deer 18
Domestic Burro 6 Desert Bighorn Sheep 12
Domestic Dog 10 Duck 11
Domestic Horse 10 Geese 4
Domestic Goat 12 Javelina 13
Domestic Pig 10 Red-winged Blackbird 5
Domestic Sheep 10 Wild Mice 10
Peacock 1 Wild Rabbit 24
Sulcata Tortoise 3 - -
TOTAL Domestic
79
TOTAL Wild
108
Page 57 of 147
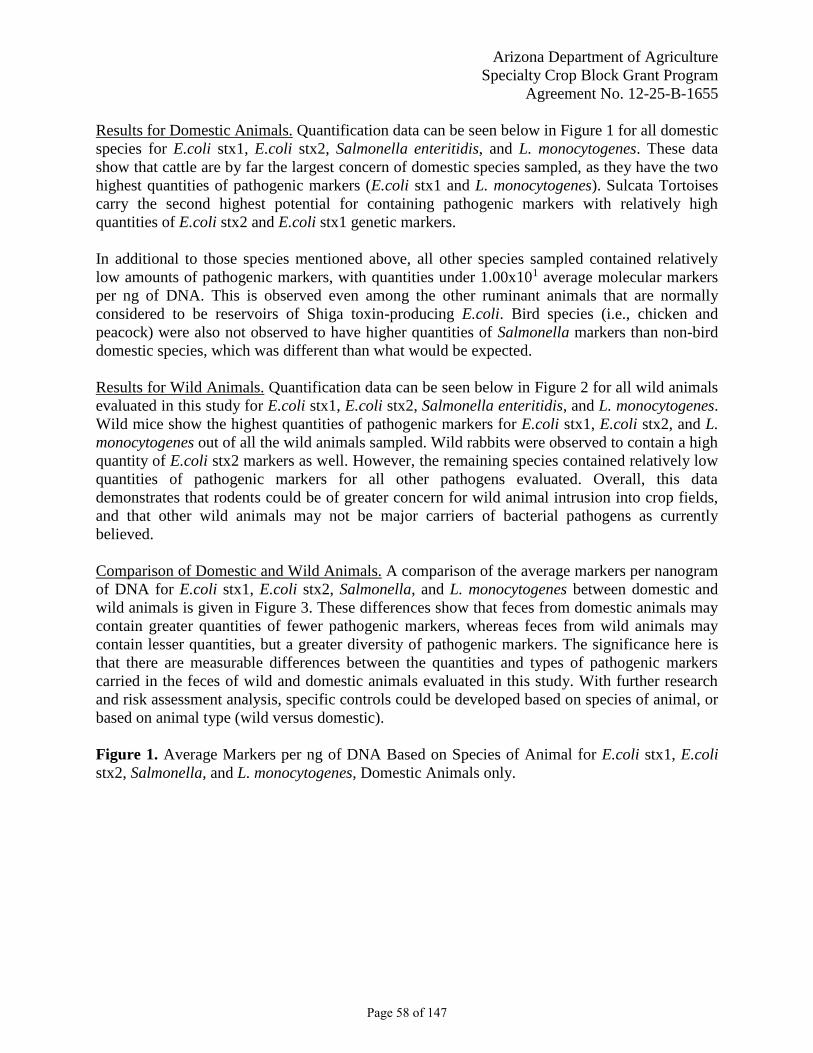
Arizona Department of Agriculture
Specialty Crop Block Grant Program
Agreement No. 12-25-B-1655
Results for Domestic Animals. Quantification data can be seen below in Figure 1 for all domestic
species for E.coli stx1, E.coli stx2, Salmonella enteritidis, and L. monocytogenes. These data
show that cattle are by far the largest concern of domestic species sampled, as they have the two
highest quantities of pathogenic markers (E.coli stx1 and L. monocytogenes). Sulcata Tortoises
carry the second highest potential for containing pathogenic markers with relatively high
quantities of E.coli stx2 and E.coli stx1 genetic markers.
In additional to those species mentioned above, all other species sampled contained relatively
low amounts of pathogenic markers, with quantities under 1.00x101 average molecular markers
per ng of DNA. This is observed even among the other ruminant animals that are normally
considered to be reservoirs of Shiga toxin-producing E.coli. Bird species (i.e., chicken and
peacock) were also not observed to have higher quantities of Salmonella markers than non-bird
domestic species, which was different than what would be expected.
Results for Wild Animals. Quantification data can be seen below in Figure 2 for all wild animals
evaluated in this study for E.coli stx1, E.coli stx2, Salmonella enteritidis, and L. monocytogenes.
Wild mice show the highest quantities of pathogenic markers for E.coli stx1, E.coli stx2, and L.
monocytogenes out of all the wild animals sampled. Wild rabbits were observed to contain a high
quantity of E.coli stx2 markers as well. However, the remaining species contained relatively low
quantities of pathogenic markers for all other pathogens evaluated. Overall, this data
demonstrates that rodents could be of greater concern for wild animal intrusion into crop fields,
and that other wild animals may not be major carriers of bacterial pathogens as currently
believed.
Comparison of Domestic and Wild Animals. A comparison of the average markers per nanogram
of DNA for E.coli stx1, E.coli stx2, Salmonella, and L. monocytogenes between domestic and
wild animals is given in Figure 3. These differences show that feces from domestic animals may
contain greater quantities of fewer pathogenic markers, whereas feces from wild animals may
contain lesser quantities, but a greater diversity of pathogenic markers. The significance here is
that there are measurable differences between the quantities and types of pathogenic markers
carried in the feces of wild and domestic animals evaluated in this study. With further research
and risk assessment analysis, specific controls could be developed based on species of animal, or
based on animal type (wild versus domestic).
Figure 1. Average Markers per ng of DNA Based on Species of Animal for E.coli stx1, E.coli
stx2, Salmonella, and L. monocytogenes, Domestic Animals only.
Page 58 of 147
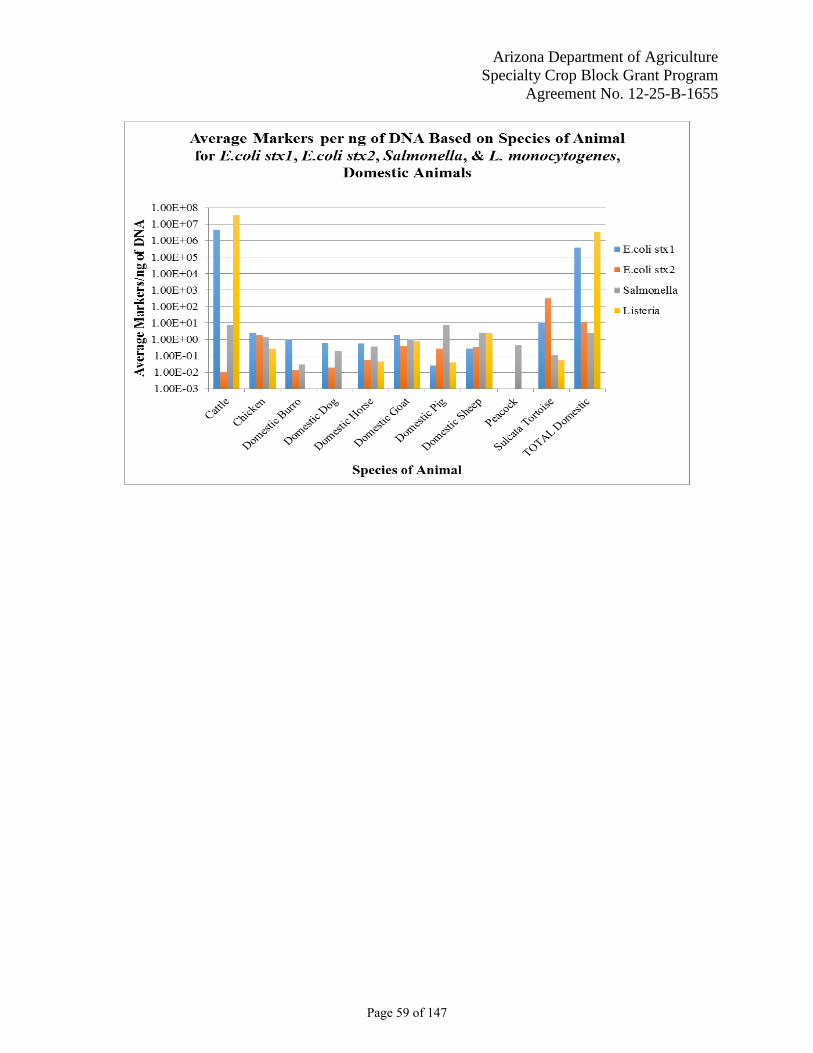
Arizona Department of Agriculture
Specialty Crop Block Grant Program
Agreement No. 12-25-B-1655
Page 59 of 147
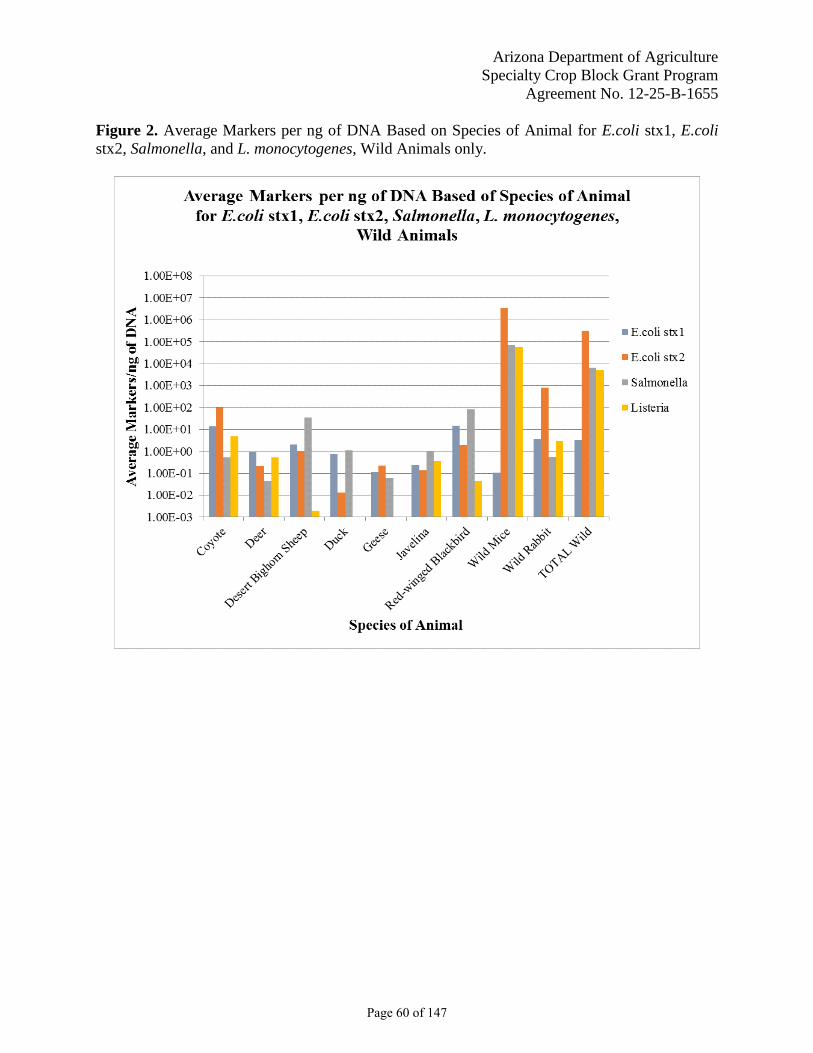
Arizona Department of Agriculture
Specialty Crop Block Grant Program
Agreement No. 12-25-B-1655
Figure 2. Average Markers per ng of DNA Based on Species of Animal for E.coli stx1, E.coli
stx2, Salmonella, and L. monocytogenes, Wild Animals only.
Page 60 of 147
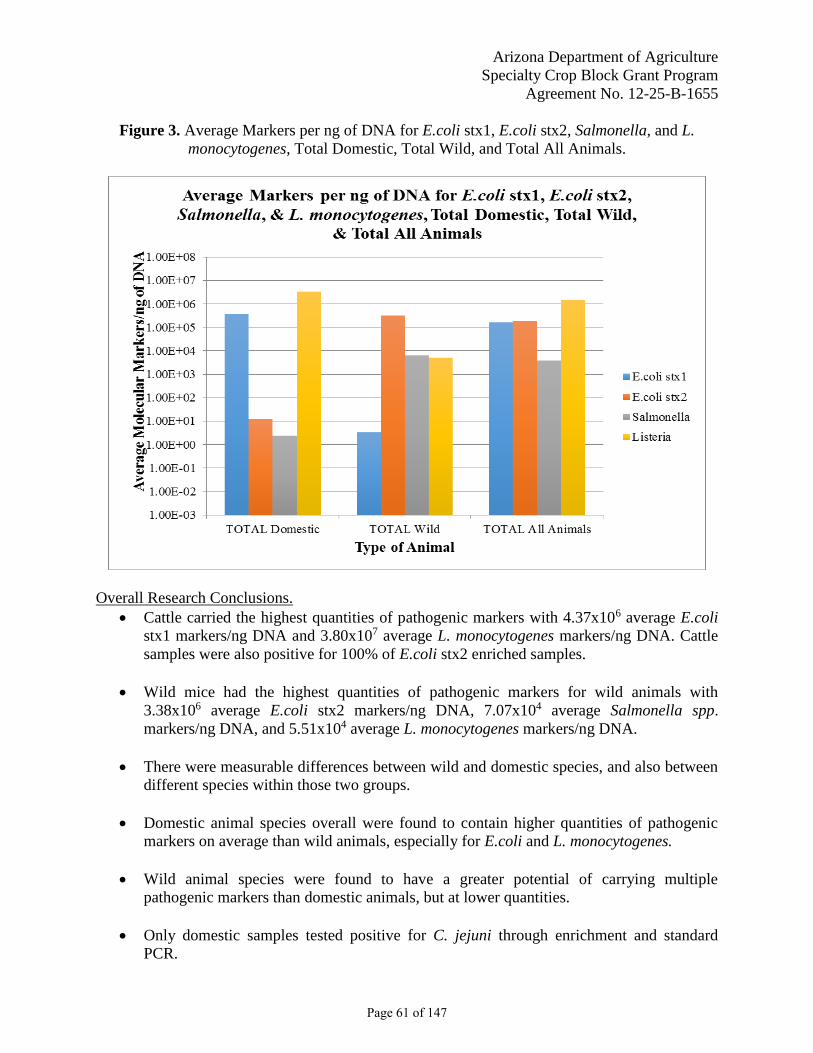
Arizona Department of Agriculture
Specialty Crop Block Grant Program
Agreement No. 12-25-B-1655
Figure 3. Average Markers per ng of DNA for E.coli stx1, E.coli stx2, Salmonella, and L.
monocytogenes, Total Domestic, Total Wild, and Total All Animals.
Overall Research Conclusions.
Cattle carried the highest quantities of pathogenic markers with 4.37x10⁶ average E.coli
stx1 markers/ng DNA and 3.80x10⁷ average L. monocytogenes markers/ng DNA. Cattle
samples were also positive for 100% of E.coli stx2 enriched samples.
Wild mice had the highest quantities of pathogenic markers for wild animals with
3.38x10⁶ average E.coli stx2 markers/ng DNA, 7.07x10⁴ average Salmonella spp.
markers/ng DNA, and 5.51x10⁴ average L. monocytogenes markers/ng DNA.
There were measurable differences between wild and domestic species, and also between
different species within those two groups.
Domestic animal species overall were found to contain higher quantities of pathogenic
markers on average than wild animals, especially for E.coli and L. monocytogenes.
Wild animal species were found to have a greater potential of carrying multiple
pathogenic markers than domestic animals, but at lower quantities.
Only domestic samples tested positive for C. jejuni through enrichment and standard
PCR.
Page 61 of 147
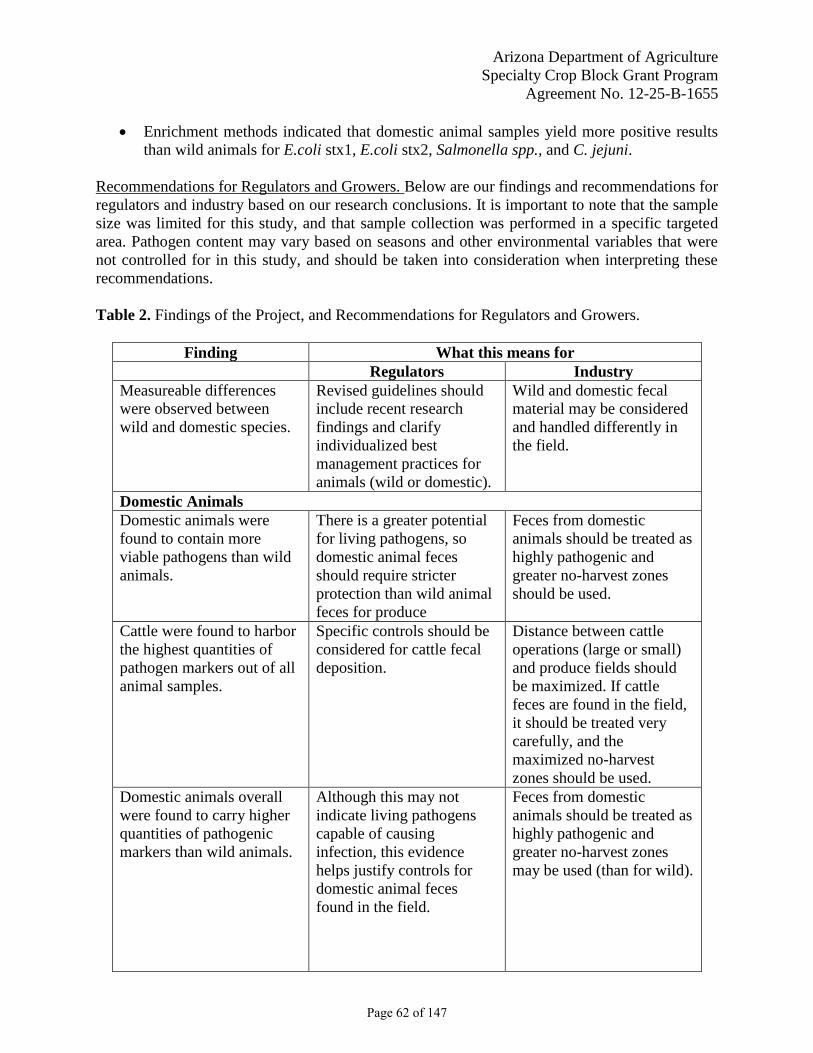
Arizona Department of Agriculture
Specialty Crop Block Grant Program
Agreement No. 12-25-B-1655
Enrichment methods indicated that domestic animal samples yield more positive results
than wild animals for E.coli stx1, E.coli stx2, Salmonella spp., and C. jejuni.
Recommendations for Regulators and Growers. Below are our findings and recommendations for
regulators and industry based on our research conclusions. It is important to note that the sample
size was limited for this study, and that sample collection was performed in a specific targeted
area. Pathogen content may vary based on seasons and other environmental variables that were
not controlled for in this study, and should be taken into consideration when interpreting these
recommendations.
Table 2. Findings of the Project, and Recommendations for Regulators and Growers.
Finding What this means for
Regulators Industry
Measureable differences
were observed between
wild and domestic species.
Revised guidelines should
include recent research
findings and clarify
individualized best
management practices for
animals (wild or domestic).
Wild and domestic fecal
material may be considered
and handled differently in
the field.
Domestic Animals
Domestic animals were
found to contain more
viable pathogens than wild
animals.
There is a greater potential
for living pathogens, so
domestic animal feces
should require stricter
protection than wild animal
feces for produce
Feces from domestic
animals should be treated as
highly pathogenic and
greater no-harvest zones
should be used.
Cattle were found to harbor
the highest quantities of
pathogen markers out of all
animal samples.
Specific controls should be
considered for cattle fecal
deposition.
Distance between cattle
operations (large or small)
and produce fields should
be maximized. If cattle
feces are found in the field,
it should be treated very
carefully, and the
maximized no-harvest
zones should be used.
Domestic animals overall
were found to carry higher
quantities of pathogenic
markers than wild animals.
Although this may not
indicate living pathogens
capable of causing
infection, this evidence
helps justify controls for
domestic animal feces
found in the field.
Feces from domestic
animals should be treated as
highly pathogenic and
greater no-harvest zones
may be used (than for wild).
Page 62 of 147

Arizona Department of Agriculture
Specialty Crop Block Grant Program
Agreement No. 12-25-B-1655
Wild Animals
Wild mice were the wild
animal species found to
carry the greatest quantities
of pathogenic markers.
Rodents, especially mice,
should require strict
controls. It may be
beneficial to require rodent
control surveillance and
prevention measures in
agricultural areas.
Rodent control measures
should be used in
agricultural areas to control
rodent populations. If
evidence of rodents in
produce fields is
discovered, precautions
should be taken to limit
crop exposure to rodent
fecal material.
Although quantities of
pathogenic markers were
lower for wild animals than
domestic, more diverse
markers were found for
wild animals than domestic.
No-harvest zones should be
enforced for wild animal
fecal material. Wildlife
monitoring of agricultural
areas should at least be
recommended, if not
enforced, so that potential
problems could more easily
be traced to the source.
Feces of wild animals can
potentially contain multiple
pathogens, and so, should
be treated as likely
pathogenic and the
recommended no-harvest
zones should be used.
Overall
Animal fecal material is a
potential source of
pathogens. High quantities
of pathogens were not
found in every sample, but
some species were found to
carry significant quantities.
Specific guidelines may be
incorporated to differentiate
between wild and domestic
fecal material when found
in agricultural fields.
Additional research should
be done to expand the
current database, however
this specific data suggests
there are differences that
could be addressed to
improve food safety
standards.
All fecal material should be
treated as pathogenic. Cattle
should be treated with
special caution, and rodent
control measures should be
used near agricultural areas.
An increased awareness of
animal activity in
production fields, and no-
harvest zones should be
practiced.
Track and Scat Glovebox Guide. As a final objective of this research, the research and Extension
team developed a Track and Scat Glovebox Guide to assist growers with the identification of
wild and domestic animal intrusion. This easy-to-use field guide features real tracks and scat
from more than 30 animals commonly found in Southwest Arizona, comprehensive track and
scat identification techniques, risk rankings for each animal, waterproof pages and a ruler to
easily measure tracks and scat in the field.
Risk rankings associated with each animal were determined based on research results presented
above where animal feces were collected and analyzed for four different pathogens: E.coli Stx-1
and Stx-2, Salmonella enteritidis, and Listeria monocytogenes. Risk rankings within the
Glovebox guide are split into 5 categories (high, moderately high, moderate, moderately low,
Page 63 of 147
Arizona Department of Agriculture
Specialty Crop Block Grant Program
Agreement No. 12-25-B-1655
low) and are organized on an easy to read risk arrow that transitions in color from green to red
based on level of risk.
Other topics covered in this field guide include:
Methods of bacterial transfer from animal to crop
Definitions of terms such as pathogen load and infectious dose, and
Animal intrusion best management practices with advice from the Arizona Leafy Green
Marketing Agreement.
Project Evaluation. As a result of this work, fecal pathogen information has been shared with the
broader stakeholder community. It is our intention to share the final results with the Yuma Safe
Produce Council at upcoming stakeholder meetings in 2015 and 2016.
As originally proposed, over the course of this project our team worked directly with the leafy
greens specialty crop industry to identify animals of greatest concern to the food safety industry
in Yuma (GOAL). At the culmination of this research the team surveyed a total of 187 animal
fecal samples, this exceed the (BENCHMARCH) as before this project, no database existed. As
part of the evaluation of this project 10 stakeholders were interviewed at the end of two years to
determine if they are using the recommended guidance regarding animals of greatest risk
(TARGET, PERFORMANCE MEASURE).
Through these evaluation metrics, we believe that we have increased the number of food safety
professionals and growers utilizing the Track and Scat Glovebox Guide (GOAL) from the
current zero (BENCHMARK) to 10 in two years (TARGET) measured by the distribution of
printed handbooks, participation in training events, and follow up communications. To date we
have distributed more than 150 Track and Scat Glovebox Guides, directly indicating interest in
the information and usefulness of the data as well providing a tangible number of growers or
food safety professionals that received this information.
While the team was not given the opportunity to present at the Southwest Ag Summit in
2014/2015 as originally proposed, we were able to present at multiple venues including annual
Food Safety Sessions hosted by the Yuma Safe Produce Council held in Yuma, AZ. During these
meetings, final results were disseminated to the audience. Upon follow-up with stakeholders
(PERFORMANCE MEASURE) in attendance, we believe that at least 50% or 25 stakeholders
(TARGET) of those in attendance were planning to implement concepts learned from this
research. It is our plan to maintain communication with these stakeholder groups in order to
assess additional implementation of water sampling concepts learned from this work.
Beneficiaries This research builds on our expertise in Extension and contributes to a growing body of
knowledge related to food safety research. To date, numerous studies have been conducted
evaluating the potential for fecal matter and animal intrusion to act as a source of enteric
pathogens during crop production. In past studies funded by ADA, we have collected data that
demonstrates high levels of E. coli, and common occurrence of the human pathogens Salmonella
spp., in canal waters used to irrigate fresh produce during canal maintenance events. Our
additional work on animal intrusion examines the potential loading by enteric bacterial
Page 64 of 147
Arizona Department of Agriculture
Specialty Crop Block Grant Program
Agreement No. 12-25-B-1655
pathogens from animals has also shed light on the differences of both domestic and wild animals
that can in turn serve both as a reservoir and a vehicle of produce contamination. This work on
FB13-13 specifically focused on how food safety professionals can assess their operation to
determine if any of the above mentioned “animal intrusion issues” may be of concern. This work
is critically important as it provides tools that stakeholders can use to best assess, and ultimately
make food safety decisions in their operation.
To date we have distributed more than 150 Track and Scat Glovebox Guides, directly indicating
interest in the information and usefulness of the data as well providing a tangible number of
growers or food safety professionals that received this information.
Lessons Learned A positive outcome of this, and past ADA projects, was the leveraging of our food safety
expertise and knowledge in the Yuma and Maricopa regions to acquire additional funding
from partners in Arizona and California. The addition of Dr. Paula Rivadeneira has been
especially beneficial for the research team as she helped tremendously to determine animal
species of greatest concern for the produce industry in the southwest.
As a result of our work on this project, our team was approached to participate in broader
research and Extension projects related to water quality that would directly benefit the local
industry and enhance the competitiveness of the leafy green specialty crop industry. This
includes support from the Center for Produce Safety, Western Growers, and additional
funding from the Arizona Department of Agriculture. We are now able to say we have a
“team” of Arizona researchers and Extension Specialists working together to solve problems
for local industry related to food safety. The Arizona Department of Agriculture has been
critical to the success of these programs.
Contact Person Channah Rock, PhD
Associate Professor & Extension Specialist – Water Quality
Department of Soil, Water & Environmental Science
The University of Arizona
Phone: (520) 374-6258
Email: [email protected]
Additional Information Results from this project directly enhance the competitiveness of Arizona specialty crops due to
the fact that this research, and its outcomes, showcase local stakeholders and their commitment
to food safety. More importantly, this work demonstrates the active engagement between
Arizona growers and the research and Extension community, working together to find tools and
solutions to maintain produce safety. Our research and Extension team was fortunate to partner
with stakeholders across Arizona who not only see the benefits of understanding food safety in
their region but also fully comprehend the long-term impact it will play on produce productivity
and marketability.
See Appendix G for supplemental figures and tables.
Page 65 of 147
Arizona Department of Agriculture
Specialty Crop Block Grant Program
Agreement No. 12-25-B-1655
Pesticide Diagnostic Laboratory for Arizona Vegetables This project was completed on September 30, 2015
Project Summary The ability to accurately detect pesticides in our food and environment has become increasingly
important. Public and private agencies, chemical companies, and the specialty crop industry
demand accurate and reliable information on the presence of pesticides in soil, water, and plant
tissue. This information is also needed to accurately diagnose problems in the field and make
good management decisions.
Advances in analytical chemistry have produced cost-effective techniques that allow us to detect
minute amounts of pesticides in plant tissue, soil, and water. These techniques generally involve
solvent extraction of the pesticide followed by the use of specialized equipment to detect very
small amounts. The most common techniques currently used are gas and liquid chromatography.
The standard unit of measure using this equipment is parts per million (equivalent to one drop in
50 liters), although parts per billion (one drop per 50,000 liters) is becoming more frequent.
As the capacity to detect smaller and smaller levels of pesticides in our food and environment
has grown, so has the public concern for toxic contamination. Government standards have
become more stringent, and there has been a growing demand for more precise and reliable
information. Growers, pest control advisors, and others within the specialty crop industry, have
also expressed more of a demand for information derived from precise laboratory analysis than
from the more traditional use of field evaluation and greenhouse bioassays. University research
and extension personnel have also become more reliant upon this laboratory technology to
support their programs. Qualitative field evaluations are no longer sufficient now that these
techniques are available.
Hundreds of soil, water, and tissue samples are collected from specialty crop fields in Arizona
every year and sent to analytical laboratories offering this type of pesticide analysis. Almost
every state has university-related plant-disease and soil-testing laboratories. Few universities,
however, have laboratories offering pesticide analysis, and most samples are sent to private
laboratories. The cost of this service ranges from $100-$300 per sample. The time it takes to
receive results is variable, with most taking between one and three weeks. In most cases, more
timely results are needed to take remedial action or to make management decisions. Timing is
critical in the management of short-season, high value specialty crops. Some of these crops are
harvested within 30 days of planting. The establishment of an analytical pesticide laboratory at
the University of Arizona Yuma Agriculture Center is not intended to compete with or replace
commercial laboratories offering this service. It is intended to support research programs and the
diagnosis of problems in the field.
When detectible levels of many pesticides that are used on specialty crops are found, it is often
unknown what these levels mean. Many factors affect the response crops have to pesticides
sampling protocols have been developed for collecting samples in the field. Part of this project
has been to establish sampling guidelines. These include: 1) The part of the crop to collect; 2)
Growth stage to collect samples; 3) Sample size needed; and 4) How to preserve samples, and
for how long.
Page 66 of 147
Arizona Department of Agriculture
Specialty Crop Block Grant Program
Agreement No. 12-25-B-1655
Project Approach Preliminary work on this project began during the 2012 vegetable-growing season in the low
desert and the organized efforts were initiated after funding was approved from the Specialty
Crop Block Grant Program. Both gas and liquid chromatograph machines were already in place
in our laboratory at the University of Arizona Yuma Agriculture Center. A part time student was
hired to work with us to identify the techniques needed to best analyze soil and plant tissue.
Hundreds of samples have been processed to evaluate various extraction and detection methods.
Many people and organizations assisted in this effort. These included Frank Jaime (Gown Co.),
Sean Kurokawa (Primus Labs), Larry Evanicky (Shimadzu Corp.), Paul Martin (USDA Desert
Research Center), Danielle Martin (Gowan Co.), and Jaime Archuleta (Shimadtzu Corp.) Steve
Castle (USDA Desert Research Center), and Kurt Nolte (U of Az. Cooperative Extension),
What is detected depends on the sampling and the extraction procedures that have been used.
Several techniques were tested for extracting herbicides from soil and plant tissue. We found that
soil analysis is far more accurate and consistent than is tissue analysis for soil applied herbicides.
The three most commonly used herbicides in lettuce Pronamide, Benefin and Bensulide, for
instance, are applied to soil where they are picked up by the weeds and the crop. Only Pronamide
moves in the plant. Benefin and Bensulide move very little. What we detected in the plant tissue
had been filtered through the soil and plant and was between 0.1 ppm and 3.0 ppm. Seedling
plants are hard to sample and the amount we found in them was extremely variable. In contrast,
we found between three and 150 ppm of these three herbicides in the top inch of the soil and it
was more consistent than what we found in the plant. The soil is easier to sample and more
consistent. The sampling guidelines that we currently give to people wanting us to analyze
lettuce fields for Pronamide, Benefin or Bensulide is to collect a composite sample of 200 g
taken from the top inch of soil. We ask also that they collect separate samples from affected and
unaffected areas of the field if possible, for comparison. We have determined that a modified
QUECHERS solid phase extraction procedure works well for these three herbicides.
The detection process was more straightforward and we had good assistance from both the
hardware and software people at Shimadzu Corporation the manufacturers of the liquid and gas
chromatographs machines and from the chemists at Gowan Company. After much
experimentation and repair, we decided that the high-pressure/UV liquid chromatograph worked
well for the three lettuce herbicides. Samples were spiked by the chemists at Gowan Company
and provided to us as unknowns to verify our results. Our detections were within accepted
standards and we now have good confidence that our extraction and detection procedures are
accurate. We begin informing the industry that could process samples by the end of October,
2013. We have informed people through the vegetable IPM advisories and presentations at some
vegetable production meetings. The number of new compounds and people using the lab have
continued to grow.
Page 67 of 147
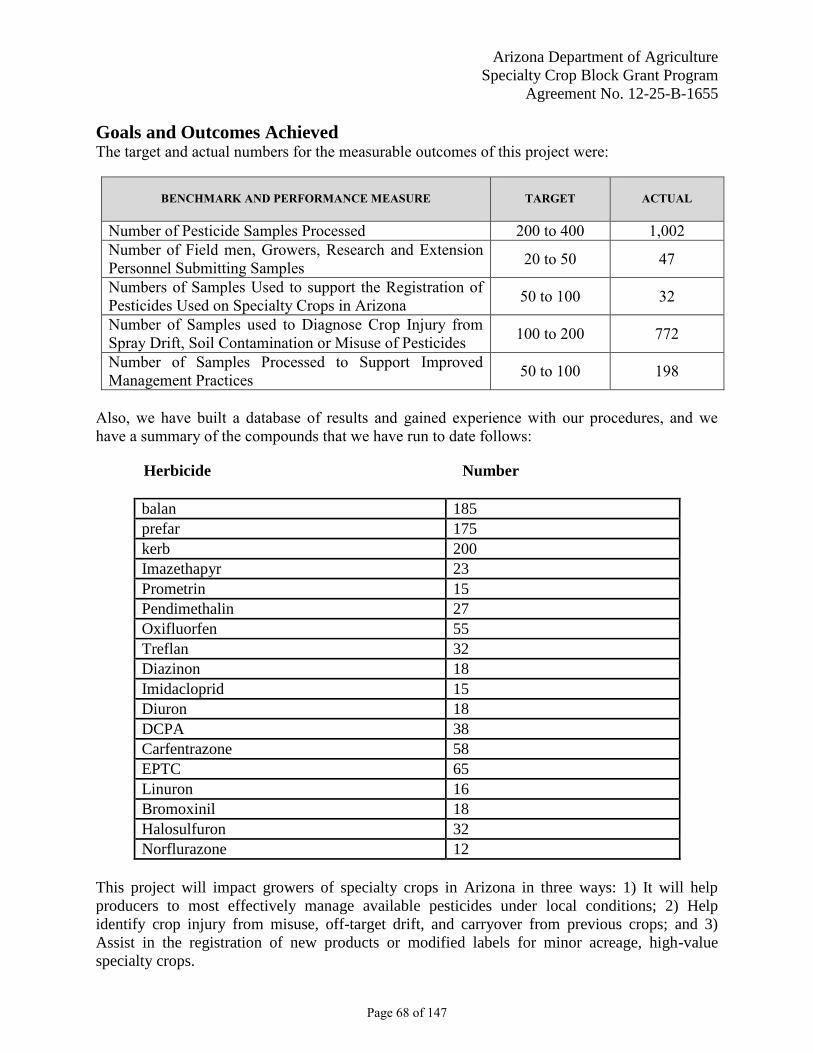
Arizona Department of Agriculture
Specialty Crop Block Grant Program
Agreement No. 12-25-B-1655
Goals and Outcomes Achieved The target and actual numbers for the measurable outcomes of this project were:
BENCHMARK AND PERFORMANCE MEASURE
TARGET
ACTUAL
Number of Pesticide Samples Processed 200 to 400 1,002
Number of Field men, Growers, Research and Extension
Personnel Submitting Samples 20 to 50 47
Numbers of Samples Used to support the Registration of
Pesticides Used on Specialty Crops in Arizona 50 to 100 32
Number of Samples used to Diagnose Crop Injury from
Spray Drift, Soil Contamination or Misuse of Pesticides 100 to 200 772
Number of Samples Processed to Support Improved
Management Practices 50 to 100 198
Also, we have built a database of results and gained experience with our procedures, and we
have a summary of the compounds that we have run to date follows:
Herbicide Number
balan 185 prefar 175
kerb 200 Imazethapyr 23
Prometrin 15 Pendimethalin 27 Oxifluorfen 55
Treflan 32 Diazinon 18
Imidacloprid 15 Diuron 18
DCPA 38 Carfentrazone 58
EPTC 65
Linuron 16 Bromoxinil 18
Halosulfuron 32 Norflurazone 12
This project will impact growers of specialty crops in Arizona in three ways: 1) It will help
producers to most effectively manage available pesticides under local conditions; 2) Help
identify crop injury from misuse, off-target drift, and carryover from previous crops; and 3)
Assist in the registration of new products or modified labels for minor acreage, high-value
specialty crops.
Page 68 of 147

Arizona Department of Agriculture
Specialty Crop Block Grant Program
Agreement No. 12-25-B-1655
The ability to detect how pesticides move in the plant, soil, and water helps producers and pest
control advisors maximize their use. The pesticide diagnostic lab has helped acquire this
information.
The specialty crops that are grown in Arizona are often intensively grown and of high value.
There is a very low tolerance for crop injury from misuse, soil carryover, or off-target drift.
Diagnosing these problems requires the use of accurate and precise detection methods. The
pesticide diagnostic lab will help supply this information.
Chemical companies often cannot justify spending the funds required to register products on
small acreage, high-value crops. Special Local Need (24c) registrations and IR-4 projects are
often the only options available to acquire the use of these products. The pesticide diagnostic lab
can help acquire this information more cost-effectively than can be done using commercial
laboratories.
Beneficiaries The most obvious beneficiaries of this project are Pest Control Advisors and farm managers who
use and recommend pesticides although the entire industry will benefit from having a local
analytical pesticide analytical laboratory. The lab will assist in the collection of data to support
the registration of new pesticides for specialty crops and support food safety investigations. A
total of 47 field men, growers, research and extension personnel submitted 1,002 samples since
the laboratory was established. The results were used in making management decisions and to
support research projects.
Lessons Learned The establishment of the pesticide analytical laboratory has been a continuous learning
experience. Procedures for detecting new products that we have not previously processed are
constantly being developed. Our analysis have become continually more precise and accurate.
One of the most valuable lessons that we have learned is that pesticide levels detected in the soil
are significantly higher and more consistent. Tissue samples run for systemic compounds that
have been filtered through the soil and plant are much lower and inconsistent.
Contact Person Barry Tickes
University of Arizona
Yuma Agriculture Center
(928) 580-9902
Reducing Pesticide Risks in Arizona Lettuce This project was completed on September 30, 2015
Project Summary Over the past two decades, advances in the science and practice of pest management on Arizona
lettuces have reduced pesticide risks and increased safety to people and the environment, and
have allowed Arizona to produce top quality lettuces for a variety of markets. Despite this
Page 69 of 147
Arizona Department of Agriculture
Specialty Crop Block Grant Program
Agreement No. 12-25-B-1655
progress, the produce industry still struggles with public perception and misinformation on the
topic of pesticides and associated risks. The purpose of this project was to increase awareness,
knowledge and dialog among growers, pest control advisors (PCAs) and buyers / marketers of
lettuce on the topic of pesticide risk and its mitigation, using new, scientifically defensible data
specific to AZ lettuce production. Our prior surveys of PCAs and growers, particularly in Yuma,
the center of lettuce production, showed significant interest in pesticide risk mitigation and tools
for understanding and reducing potential environmental risks from pesticides, supporting the
value and timeliness of this project.
The project built on and expanded previous work funded in part through the SCBGP (SCBGP-
FB11-37), in which our team analyzed pesticide use on lettuces in Yuma County from 1991 to
2011. In that project, we collaborated with scientists from the Integrated Plant Protection Center
(IPPC) at Oregon State University to develop a methodology for analyzing AZ pesticide use
data using the ipmPRiME Pesticide Risk Mitigation Engine, a sophisticated, data-based,
comprehensive eco-toxicological tool for assessing grower pesticide practices and mitigating
risk. Results clearly demonstrated the safety record of this industry and showed low and
declining environmental risks over time for 7 different risk indices (e.g., avian acute toxicity).
However, analyses were broad (average use for all lettuces on an annual basis) and for Yuma
County only. In the current project, we updated these analyses through 2013, expanded to
include statewide lettuce records, and conduct detailed retrospective risk trend analyses of
lettuce pesticide use by relevant market sectors (e.g., head vs. leaf lettuce, fall vs. spring). Our
analysis was coupled with an outreach program to educate and engage PCAs, growers and other
stakeholders in a dialog on the topic of pesticide risk and its mitigation. We also made
significant improvements to the ipmPRiME.org online tool, including addition of a new risk
index for pollinators and development of a benchmarking tool specific to Arizona lettuce
pesticide practices.
Project Approach Data preparation
Significant time, including leveraged personnel resources not paid for through this grant,
was invested in evaluating and correcting 2012 and 2013 statewide pesticide use data for
lettuce. Project team discussion resulted in the decision to include 2013 data to make the
market sector analysis as relevant as possible. However, the significant investment in
preparation of additional data resulted in delays of some project outcomes.
Integration of PDF scans of submitted 1080 forms from 2007 – 2013 (provided by ADA),
including over 55,000 1080s for lettuce crops, greatly facilitated verification and
correction of records. We also had several meetings and discussions with ADA partners
throughout this project, identifying ways to reduce data errors to increase efficiency.
Non-Yuma County data had been excluded from the previous analysis due to lack of time
to inspect and verify these records, and we were aware of some problems with these data.
Fournier carefully reviewed all compiled lettuce 1080s outside of Yuma County, many
going back to the mid or late 1990s, and contacted growers and PCAs to verify several
growing locations.
In the sixth quarter, new data mapping approaches developed by Dixon led us to discover
about 15,000 additional lettuce pesticide use records (across all years) with invalid
location data that were previously not detected. (The resolution of our “valid” legals was
Page 70 of 147
Arizona Department of Agriculture
Specialty Crop Block Grant Program
Agreement No. 12-25-B-1655
previously to the Township level; now it is to the section level.) This improved data
screening resulting in detection of “new” errors that required time-consuming individual
inspection and correction.
Data analyses
We completed a revised overall ipmPRiME risk analysis of all lettuce applications
statewide, 1991 to 2013, a dataset with over 7 million records (each chemical application
reported on lettuce over that timeframe, multiplied by 9 risk indexes). The analysis was
reviewed by team members and discussed over emails and conference calls, revised prior
to and again following the PCA workshop in July 2015. The new analysis differs from
the previous one (2011 SCBG project) in several ways.
We added 2012 and 2013 data, and expanded the analysis beyond Yuma County
to include statewide lettuce records.
Refinements were implemented to the ipmPRiME database for the fish toxicity
index since the prior analysis, resulting in lower risk estimates.
Since prior analysis, a new risk index for pollinators has been added to
ipmPRiME, for the first time yielding information on pollinator impacts of
various pesticides used in lettuce.
Access to PDFs of 1080 data forms and improved resolution on maps of valid
agricultural areas enabled correction of errors we did not detect in the previous
dataset.
Market sector summary analyses represent subsets of this overall completed analysis. We
have developed charts that highlight changes in pesticide use patterns and environmental
risk for specific markets, 2008 – 2013 (i.e., spring & fall lettuce crops, grouped by head
lettuces, leaf lettuces, and Romaine) for use in Extension meetings and reports to our
stakeholders.
Finalized, revised charts and other graphics will be used for outreach that extends beyond
the life of this grant project.
Improvements to ipmPRiME.org
Customizing ipmPRiME.org for Arizona Lettuce
With input collected by Fournier from lettuce pest management Extension
specialists (Palumbo, Tickes, Matheron), Guzy made “typical pesticide use”
scenarios for lettuce available as selectable options within ipmPRiME.org prior to
the 2014 SW Ag Summit workshop. Users could select these pre-formed
scenarios then modify applications as needed to reflect their use practices for
spring or fall production. The tool then calculates and outputs risk scores
associated with actual pesticide practices, to inform future decision-making.
These scenarios were reviewed and further refined prior to the July 2015 PCA
workshop.
Guzy developed an integrated benchmarking tool within ipmPRiME.org that
allows users to see how risk scores for their applications compare to the practices
of peers. The tool is based on Arizona lettuce pesticide use data, all applications
reported from 2008 to 2013 (excluding endosulfan, which is no longer labeled for
use). The tool was debuted at the hands-on PCA workshop in July 2015 and was
well received by users.
Page 71 of 147
Arizona Department of Agriculture
Specialty Crop Block Grant Program
Agreement No. 12-25-B-1655
Other noteworthy ipmPRiME improvements
In a separate, leveraged effort, Oregon State University (OSU) collaborators
developed a risk index specific to pollinators. This index was available and was
integrated into our data analyses and into the ipmPRiME.org online tool. Our
workshop participants in July 2015 were the first to benefit from this
development, and were able to review risk data generated for pollinators.
OSU collaborators, made refinements to how the ipmPRiME database calculates
risk outputs for the fish toxicity index, based on new scientific data. (This resulted
in lower risk estimates for AZ lettuce than were previously obtained for this
index.)
Outreach
The team presented a workshop at the Southwest Ag Summit in Yuma on Feb 27, 2014,
including hands-on session held in a computer lab, wherein growers & PCAs could gain
experience with ipmPRiME.org. Jepson presented data from our original risk analysis of
AZ lettuce pesticide use and we conducted pre and post surveys of risk mitigation
knowledge of participants. There was low turnout in the workshop, which was one of 6
concurrent breakout sessions.
Fournier presented results to over 200 PCAs, growers and other agricultural professionals
at the Association of Applied IPM Ecologists in Napa, CA on Feb 2, 2015.
Fournier presented results as part of a pilot Lettuce Pest Losses and Impact Assessment
workshop held in Salinas at the UC Cooperative Extension Office with a small number of
California PCAs on Feb 17, 2015.
Fournier presented an interactive “clicker” survey of PCA / grower / applicator awareness
and knowledge of pesticide risk and its mitigation, April 1, 2015 at a Cooperative
Extension meeting held at Yuma Ag Center.
PCA ipmPRiME workshop, Mission Bay Marriot in San Diego on July 24, 2015.
Working with Palumbo, Fournier identified and invited Yuma-based PCAs that
work in lettuce. 9 PCAs attended, representing 16,550 scouted lettuce acres
(39,000 acres for all crops) in 2015.
The agenda included a presentation by Peter Ellsworth of our overall data analysis
of Arizona pesticide use on lettuce 1991 to 2013, an introduction to the
ipmPRiME online tool by Michael Guzy, followed by a hands-on session using
the ipmPRiME tool to create risk profiles of current pesticide practices.
Participants gained experience on how to log on and enter pesticide applications,
retrieve and interpret risk scores, and identify mitigating practices to reduce risks.
The session included much group discussion and one-on-one interactions with
PCAs that provided great insights, from the user perspective, on the value and
potential uses of ipmPRiME.org. For example, one PCA used the tool to compare
formulations, application method, and different active ingredients among
pyrethroids to better understand the relative risks to pollinators of different
products within this class of insecticides. Several commented directly on how
they would use the tool’s information, for example, by developing a “cheat sheet”
of risk profiles for some of the most common lettuce pesticides they use, to carry
with them and inform decisions without having to return to the website.
2.5 CA and 3.0 AZ CEUs were provided to participants.
Page 72 of 147
Arizona Department of Agriculture
Specialty Crop Block Grant Program
Agreement No. 12-25-B-1655
Fournier conducted a pre-and-post evaluation that showed increases in knowledge
and interest of pesticide risk and risk mitigation about potential environmental
risks of pesticides among participants. The evaluation also collected data on the
user experience that will help us to improve the ipmPRiME tool. 100% of
participants agreed that the benchmarking tool helped them to understand how
their practices compared to other PCAs. 67% said they would consider using
ipmPRiME in the future to evaluate pesticide risks, 33% said they would
definitely use it.
Our outreach goals have been met under this grant; however, the information from this
this work will continue to be used in our general outreach approach well after the
termination of this project. Results from market sector analyses will continue to be shared
at Extension meetings and other appropriate venues, along with the results of any revised
or expanded understanding that results from further examination of this rich data set.
A UA Cooperative Extension publication “ipmPRiME.org: Making Informed Pesticide
Use Decisions Based on Risk” was accepted, laid out and produced in PDF form. As we
go to press, we are making final refinements to figures and tables. A second Extension
publication on the fundamentals of risk was not completed in the term of this grant. The
industry report on lettuce pesticide use will be developed for industry use, but not
published, as was determined through our Advisory Committee and other stakeholder
input.
Jepson, Guzy and co-authors published an article in a scientific journal that reviews the
science behind the risk indices that make up ipmPRiME. While this was not directly
related to the Arizona Lettuce analysis, publication of these data are important because
they explain the scientific underpinnings of the ipmPRiME tool that support the risk
analyses generated. This article will be cited in our future publications:
Jepson PC, Guzy M, Blaustein K, Sow M, Sarr M, Mineau P, Kegley S. 2014.
Measuring pesticide ecological and health risks in West African agriculture to
establish an enabling environment for sustainable intensification. Phil. Trans. R.
Soc. B 369: 20130491.
Scientific presentations. This work continues to be well received in academic circles as
advancing the science and capacity of quantifying reductions in risk resulting from
technological advancements and use of IPM approaches.
Fournier and Guzy both presented research results in a “Big Data” symposium at
the Entomological Society of America Pacific Branch meeting in Tucson on April
8, 2014.
Guzy presented project results of the Yuma County historical lettuce pesticide use
risk analysis (from previous SCBG) in a symposium at the national
Entomological Society of America 2015 Annual Meeting in Portland, OR in
November, 2014. The project team collaborated with Guzy on the presentation.
Communication
Throughout this project, we conferred with OSU IPPC collaborators on technical issues
and development of outputs including presentation of results to grower communities. Our
interactions included conference calls, emails and face-to-face meetings.
Advisory Committee role and input. We have annual meetings and ongoing interactions
with members of our Arizona Pest Management Center Pesticide Use Database Advisory
Page 73 of 147
Arizona Department of Agriculture
Specialty Crop Block Grant Program
Agreement No. 12-25-B-1655
Committee. The group is made up of PCAs, growers, industry representatives and state
regulators. We regularly present updates of projects and outputs that make use of
pesticide use data and seek stakeholder input.
We have engaged PCAs and growers to help us understand and correct errors in 1080
pesticide location data (non-existent township, range and section locations that have been
consistently, repeatedly submitted on 1080 forms to ADA).
Significant Results, Accomplishments, Recommendations & Conclusions
The results demonstrate a general trend of reduction in risk resulting from lettuce
pesticide practices in Arizona over the time period analyzed. This risk is quantified
separately for 9 different risk indices (such as avian acute toxicity, avian reproductive
toxicity, fish chronic, etc.) for each active ingredient and major chemical class for each
year (1991 – 2013).
Beyond this general risk reduction trend, analyses reveal a few current pesticide practices
that indicate moderate to high risk for certain risk indices. These uses will be looked at
closer in the context of the market sector summaries and availability of alternate practices
explored. This will lead to future outreach beyond the term of this grant.
The addition of the pollinator risk index to ipmPRiME was of interest to our
stakeholders, given current concerns about pollinator safety. The recent court action in
the 9th Circuit on sulfoxaflor which will result in the cancellation of all uses in
agriculture, at least for a time, is driven by these same pollination issues and has major
consequences for the lettuce and specialty crop industries. US-EPA is challenged by
litigants to supply the science on which to base regulatory policy on this issue. This
science-based, peer-reviewed, independent tool and its development will be crucial to
demonstrating the investments of this industry to protect the environment including
pollinator protections. All feedback from users indicated that ipmPRiME is a valuable
resource for the industry.
Significant Contributions and Roles of Project Partners:
Al Fournier, IPM Program Manager with the APMC at UA and lead PI for this project,
supervised the management of the APMC Pesticide Use Database, including supervision
of Wayne Dixon; coordinated activities and communications with IPPC partners;
convened the APMC Pesticide Use Database advisory committee and advised them on
this project; interacted with stakeholders to review and correct data errors; supervised
development of data outputs; contributed to the development of the analytical approach,
presented information about this project to agricultural stakeholders and scientific
audiences, and served as primary editor and a second/corresponding author of the
Extension publication.
Wayne Dixon, Assistant in Extension for IPM Assessment and Database Specialist for
the APMC, helped to develop and has refined the APMC Pesticide Use Database;
evaluated and corrected data and supervised others in this work; developed an improved
method to identify potential location errors in data, integrated new information and tables
needed to support the ipmPRiME analysis; developed data outputs and contributed to the
development of the analytical approach.
Peter Ellsworth, Director of the APMC, IPM Specialist/Professor and State IPM &
Pesticide Coordinator, greatly contributed to the development of the analytical approach
Page 74 of 147
Arizona Department of Agriculture
Specialty Crop Block Grant Program
Agreement No. 12-25-B-1655
and identification of data anomalies, to all advisory and stakeholder meetings and
discussions, and to all outreach performed under this grant; developed graphical
representations of data for use in presentations, contributed to the Extension publication
and collaborated with UA specialists and IPPC partners in interpretation of data.
Michael Guzy & Paul Jepson, collaborators at the Integrated Plant Protection Center are
both professors at Oregon State University. Guzy was primarily responsible for
conducting the risk analysis of Arizona data using ipmPRiME and the development of the
benchmarking tool; they both greatly contributed to the development of the analytical
approach used and of the new pollinator index as part of ipmPRiME; delivered data
summaries and charts and assisted us in data interpretation, presented at workshops and
contributed as coauthors to publications. Guzy was the lead author for the Extension
publication.
Robert Tolton, David Hall & Jack Peterson. Arizona Department of Agriculture,
Environmental Service Division. Robert Tolton oversees 1080 data entry and supervises a
temp employee who was partially funded through this project. David Hall manages
ADA’s 1080 database and interacts with Wayne Dixon on the transfer of data to our
database. Both Tolton and Hall, along with Director Peterson, have contributed to
important discussions that have led to process improvements that detect, intercept, and/or
correct errors from entering the upstream database that we depend on for this project.
APMC Pesticide Use Database Advisory Committee. The committee members have
provided input and feedback throughout this project on a number of 1080 data issues.
Their input has guided this project including altering its course specifically to meet their
needs.
Goals and Outcomes Achieved Outcome 1. We will generate new scientific knowledge (GOAL): pesticide risk profiles for
specific lettuce market sectors (TARGET). PERFORMANCE MEASURE will be availability of
this information to the lettuce industry and publication of findings in scientific journal.
This outcome was achieved. The data generated allow us to compare risk levels from different
years for any given active ingredient (AI) or class of chemistry for any of nine risk indices
(aquatic algae, aquatic invertebrates, fish chronic, small mammal acute, avian acute, avian
reproductive and inhalation, earthworms and pollinators). The average level of risk reduction
achieved across all chemistries varies by AI and risk index, but the trend for all indices is either
continually low or negligible risk detected, or moderate levels of risk that show an improving
trend towards increased safety over time. Although more work (beyond the scope and term of
this grant) is needed to fully explore and interpret this rich data set, we have produced
scientifically defensible data documenting a clear reduction of pesticide risk in Arizona lettuce
production over the last two decades. This information is already available to the Arizona lettuce
industry, and some of it has been presented and discussed in our Advisory Committee. We
anticipate inclusion of some charts or data summaries in an unpublished industry report to be
shared with stakeholders in the near future. Jepson et al. have published one scientific article
about the science behind ipmPRiME. The Arizona lettuce data analysis has not been published at
the request of our Advisory Committee.
Page 75 of 147
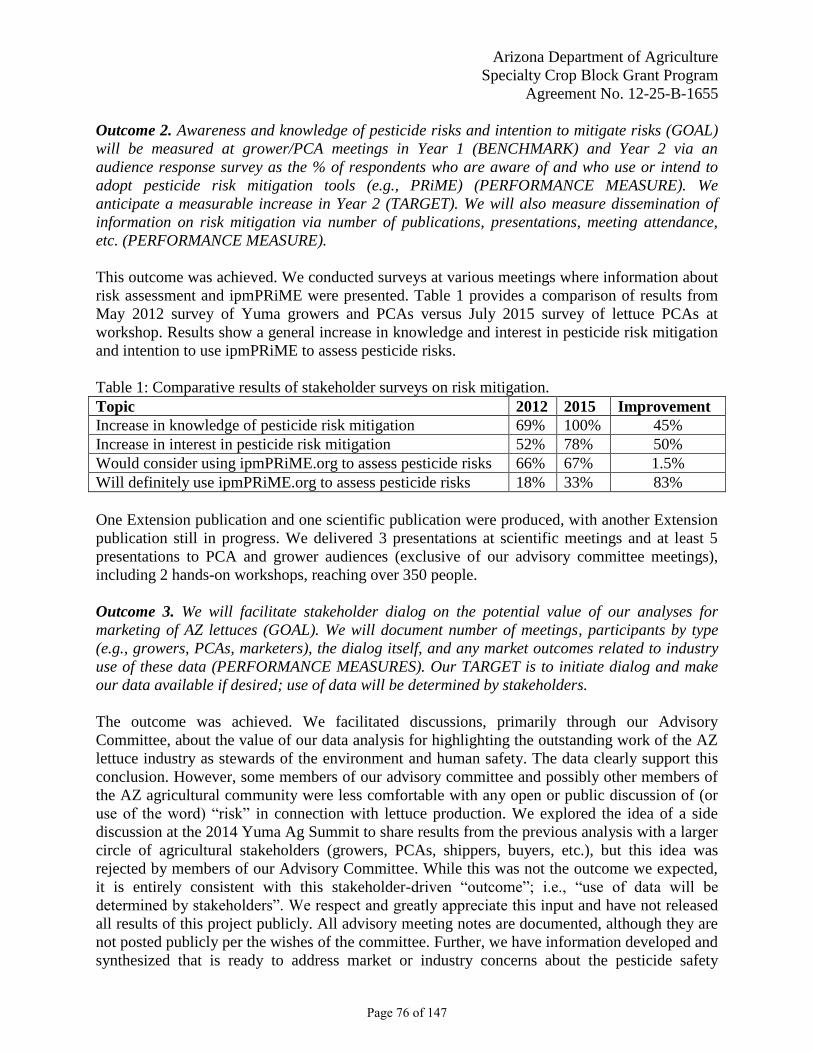
Arizona Department of Agriculture
Specialty Crop Block Grant Program
Agreement No. 12-25-B-1655
Outcome 2. Awareness and knowledge of pesticide risks and intention to mitigate risks (GOAL)
will be measured at grower/PCA meetings in Year 1 (BENCHMARK) and Year 2 via an
audience response survey as the % of respondents who are aware of and who use or intend to
adopt pesticide risk mitigation tools (e.g., PRiME) (PERFORMANCE MEASURE). We
anticipate a measurable increase in Year 2 (TARGET). We will also measure dissemination of
information on risk mitigation via number of publications, presentations, meeting attendance,
etc. (PERFORMANCE MEASURE).
This outcome was achieved. We conducted surveys at various meetings where information about
risk assessment and ipmPRiME were presented. Table 1 provides a comparison of results from
May 2012 survey of Yuma growers and PCAs versus July 2015 survey of lettuce PCAs at
workshop. Results show a general increase in knowledge and interest in pesticide risk mitigation
and intention to use ipmPRiME to assess pesticide risks.
Table 1: Comparative results of stakeholder surveys on risk mitigation.
Topic 2012 2015 Improvement
Increase in knowledge of pesticide risk mitigation 69% 100% 45%
Increase in interest in pesticide risk mitigation 52% 78% 50%
Would consider using ipmPRiME.org to assess pesticide risks 66% 67% 1.5%
Will definitely use ipmPRiME.org to assess pesticide risks 18% 33% 83%
One Extension publication and one scientific publication were produced, with another Extension
publication still in progress. We delivered 3 presentations at scientific meetings and at least 5
presentations to PCA and grower audiences (exclusive of our advisory committee meetings),
including 2 hands-on workshops, reaching over 350 people.
Outcome 3. We will facilitate stakeholder dialog on the potential value of our analyses for
marketing of AZ lettuces (GOAL). We will document number of meetings, participants by type
(e.g., growers, PCAs, marketers), the dialog itself, and any market outcomes related to industry
use of these data (PERFORMANCE MEASURES). Our TARGET is to initiate dialog and make
our data available if desired; use of data will be determined by stakeholders.
The outcome was achieved. We facilitated discussions, primarily through our Advisory
Committee, about the value of our data analysis for highlighting the outstanding work of the AZ
lettuce industry as stewards of the environment and human safety. The data clearly support this
conclusion. However, some members of our advisory committee and possibly other members of
the AZ agricultural community were less comfortable with any open or public discussion of (or
use of the word) “risk” in connection with lettuce production. We explored the idea of a side
discussion at the 2014 Yuma Ag Summit to share results from the previous analysis with a larger
circle of agricultural stakeholders (growers, PCAs, shippers, buyers, etc.), but this idea was
rejected by members of our Advisory Committee. While this was not the outcome we expected,
it is entirely consistent with this stakeholder-driven “outcome”; i.e., “use of data will be
determined by stakeholders”. We respect and greatly appreciate this input and have not released
all results of this project publicly. All advisory meeting notes are documented, although they are
not posted publicly per the wishes of the committee. Further, we have information developed and
synthesized that is ready to address market or industry concerns about the pesticide safety
Page 76 of 147
Arizona Department of Agriculture
Specialty Crop Block Grant Program
Agreement No. 12-25-B-1655
practices or policies of this industry. By having this information “at the ready”, the industry can
effectively address any pesticide risk based crisis that threatens their markets in the future. We
have also secured a methodology that is scientifically robust and could be invoked quickly,
funding permitting, to update and analyze current pesticide use practices as they relate to
ecotoxicological risks in any specialty crop produced in Arizona.
Beneficiaries Direct beneficiaries of this project include Arizona lettuce growers & PCAs (43 growers and 55
PCAs with submitted pesticide data for lettuce in 2013) and others associated with the industry
(buyers, packers & shippers, etc.) All would potentially benefit from information produced that
can demonstrate a reduced risk of current pesticide practices relative to the past. All agricultural
growers (598), PCAs (214) and custom applicators (1,216) are among our potential target
audience for future trainings on pesticide risk mitigation (beyond the scope of this grant). This
type of educational effort could result in further reductions of ecotoxicological risks of pesticide
use for lettuce and other specialty crops in the future due to heightened awareness of and
education on this topic and valuable tool. (Previous trainings by our OSU collaborators in the
Pacific Northwest and elsewhere have demonstrated documented risk reductions in field
pesticide practices following risk mitigation training). During this grant term we reached over
250 agricultural stakeholders (growers, PCAs, Ag industry) and over 100 scientists in the
academic community with results and information from this project.
Lessons Learned Our collaborations with partners at IPPC were educational and mutually beneficial to both
the APMC Pesticide Use Database and the ipmPRiME, Pesticide Risk Mitigation Engine.
Because of this project, toxicity profiles for chemistries previously absent from the
ipmPRiME database were added; others were corrected or updated. Our exchange of data
allowed for identification of minor errors in both their database and our own, which have
now been corrected.
Our ongoing interactions with ADA and discussions regarding the 1080 data have helped to
improve the accuracy and quality of pesticide use data. Furthermore, Environmental Services
Director, Jack Peterson (a member of our Advisory Committee) has often expressed interest
and appreciation for the outcomes of this project (and other 1080 data projects). Specifically,
our data demonstrate the quality of work and environmental stewardship of the Arizona
lettuce (and specialty crop) industry.
The PCA workshop in July 2015 included ample discussion on the value of the tool, how
PCAs would most likely use the tool, the kinds of information of most interest to them (e.g.,
comparison of risk profiles of alternate pyrethroids; use of the pollinator risk index to
demonstrate safety of certain products to bees), and how the user interface and other aspects
of the ipmPRiME tool could be improved. One interesting suggestion was how the tool could
be used to develop a “cheat sheet” of risk profiles for some of the most common lettuce
pesticides. This could be used as a reference without investing time to frequently return to the
website or learn/re-learn the tool.
IPM is about reducing risks: economic risks to growers, and risks to people and the
environment from pests and from pest management practices. The Arizona lettuce industry
is on the cutting edge, using a higher proportion of reduced risk products than broad-
spectrum pesticides, and producing safe, healthy, high quality produce that feeds the country
Page 77 of 147
Arizona Department of Agriculture
Specialty Crop Block Grant Program
Agreement No. 12-25-B-1655
and the world. Our data demonstrate scientifically the outstanding work and outcomes
produced by this industry. In partnership with our industry stakeholder advisory committee,
we hope to eventually get this message out to the public in a way that is acceptable to the
industry, as we feel they have much to be proud about.
Contact Person Al Fournier, University of Arizona, Maricopa Agricultural Center & Arizona Pest Management
Center
520-374-6240
Additional Information How has the project enhanced the competitiveness and / or increased the consumption of Arizona
specialty crops?
1. Lettuce PCAs and specialty crop PCAs in general are more aware of the complex set of
information that assesses risk of any pesticide use practice. They are therefore better
equipped to interact with growers and buyers who raise future concerns about the
proactive measures they are taking to protect environmental resources such as fish, birds,
small mammals and aquatic invertebrates. Over time, this will engender confidence in
Arizona’s specialty crop products and preserve and enhance markets for their sale,
making them more competitive than specialty crops produced by foreign markets where
this understanding and careful choice of pesticide practices is not enabled. As long term
impacts of this project, measurement of these accomplishments at this time is not
possible.
2. Each individual touched by this effort becomes aware of the pollinator risks associated
with individual pesticide practices, enabling them to alter choices when needed or more
importantly to interact, once again, with growers, buyers and markets armed with
science-based, peer-reviewed information that justifies their pesticide actions. These
internal conversations among pest managers, growers, and their buyers/markets are
private ones and not easily monitored or measured.
3. While elements of our information have not been broadly or publicly shared through
publication of reports, our Advisory Committee suggested that by having this a priori
report and associated information and analyses “on the shelf” that it will be readily
available to address any challenges or criticisms of the pesticide practices or proactive
efforts of this industry segment. In this way and ongoing into the future, the industry will
be poised to engage those in the marketplace trying to make decisions about consumption
and purchase of Arizona lettuces and specialty crops in general with scientifically
defensible analyses of their practices.
4. A progressive approach to this topic and active engagement of ADA in the development
of better, error-free data engenders confidence in the state lead agency charged with
regulating pesticide practices by this industry. This alone carries with it benefits to the
industry in preventing undue or unnecessary regulations, regulatory action, and
enforcement. Industry sectors that are free to develop and implement tools such as
ipmPRiME without regulatory requirement are then also free to use this information to
both promote their industry and defend their practices on a voluntary basis.
Page 78 of 147

Arizona Department of Agriculture
Specialty Crop Block Grant Program
Agreement No. 12-25-B-1655
Arizona lettuces are the first and only crop to be subjected to this type of risk analysis. This
project has demonstrated that it is possible to structure Arizona pesticide use data for ipmPRiME
analysis to chart changes in risk of pesticide practices over time for a given industry. We see
great potential for similar analyses in other crops in the future. Project partners submitted two
USDA grant proposals during the course of this project with the goal of funding a similar
pesticide risk analysis of Arizona cotton; however, these projects were not selected for funding.
Nevertheless, Cotton Incorporated sees these types of efforts as central to the demonstration of
the sustainability of any effort and has provided a small seed-grant (2 yrs) to support our goal of
expanding analyses to the cotton pesticide dataset.
A presentation about the ipmPRiME Pesticide Risk Mitigation Engine and the previous overall
analysis of Arizona pesticide use (1991 to 2011 for Yuma County) is posted online at
https://prezi.com/qpxwxj9l5u_d/copy-of-bubble-animation-with-
timeline/?auth_key=53a3949f80b3c39c2eb5ab9a82b228821019e9ae
Survey of Arizona Wine Grape Production This project was completed on March 31, 2015
Project Summary Arizona wineries, and the vineyards that support the production of wine, have grown
substantially in numbers during the past 5 years. There are currently over 60 bonded wineries in
the state; in the year 2000 there were 10 bonded wineries. Each winery either has its own
vineyard or sources grapes from a vineyard. Before this project, there was no survey or
mechanism to determine the acreage, tonnage, employment, or economic impact of this industry
and the vineyards which are its foundation. (ISSUE) Most other wine producing states are
providing detailed data to the National Agricultural Statistics Service (NASS). Arizona is not.
This project worked with NASS to conduct a confidential survey, under its direction, to provide
the data necessary to allow verifiable reporting of the economic impact of wine grape
growers. (NEED)
The completed survey is similar to one conducted by NASS for the Oregon wine grape growers.
It includes data about acreage, varietals grown, crop loss and reason for loss, price of grapes,
county in which activity occurred, county or state to which the grapes were sold. This data has
benefited all 70 known growers in the state and provided them with valuable marketing
opportunities for the industry as a whole but also for the growing wine tourist market that
impacts other farmers and ancillary businesses. This has also be valuable in persuading other
farmers to join in the growing of wine grapes with its associated low water usage, low chemical
usage and blossoming agri-tourism benefits. (IMPORTANCE)
Currently, many wine makers in Arizona are forced to obtain grapes for their wines from other
states (mostly California and New Mexico). This is due to the fact that there is insufficient
production of wine grapes in the state. The completed survey translates into body of knowledge
of the desirability of growing wine grapes for farmers in Arizona. It is estimated that over 300
acres of new wine grape development took place in the spring of 2015. Many of the decisions
related to this new development were made based on the Survey. (TIMELINESS)
Page 79 of 147
Arizona Department of Agriculture
Specialty Crop Block Grant Program
Agreement No. 12-25-B-1655
Project Approach This project conducted a confidential survey of wine grape growers in the State of Arizona to
determine acreage planted, productivity, and varietals of wine grapes planted in the State and
established a baseline for future reporting of the economic impact of the wine industry and
reporting to USDA and related organizations. The survey was successful in obtaining
information from a significant majority of the growers that was not currently available to the
industry and the public concerning the extent and impact of wine grape production. The Arizona
Wine Growers Association did partner with the National Agricultural Statistics Service (NASS)
in conducting the survey. Upon completion of the survey, the information published in a report
(Appendix H) and provided to the growers and the general public in an effort to enhance the
profile of the growing wine industry. The information in the report was used and quoted
extensively in publications and periodicals, including an insertion in the March-June issue
(Appendix H) of AZ Wine Lifestyle magazine.
The results presented in this report represent the first set of comprehensive statistics on Arizona’s
growing vineyard industry. The survey was sponsored by the Arizona Wine Growers Association
and conducted by USDA’s National Agricultural Statistics Service. The survey consisted of a
census of known Arizona vineyards. Ninety-six potential operations were included. Sixty-four
reported planted acres in 2013. Twenty-six reported no acreage in 2013. Six operations did not
participate. A final response rate of 94 percent was achieved.
The report includes basic descriptive statistics including total statewide acreage, yield and
production; acreage, yield and production by region, county and variety; total value of
production; indications on the use of production practices and types of production losses; and
expectations on future planting intentions.
Significant Findings:
Statewide value of production totaled $2.2 Million.
Seventy-four percent of all wine grape production came from the Willcox region.
The top five varieties in terms of planted acres were Cabernet Sauvignon, Syrah, Grenache,
Zinfandel, and Merlot.
The top five varieties in terms of production were Syrah, Grenache, Cabernet Sauvignon,
Mourvedre, and Sangiovese.
Arizona growers intend to plant an additional 350 acres by the end of 2016.
Spur pruning was used by 67 percent of all growers and was the most common practice used.
Nearly 41 percent of all growers reported losses from birds and\or animals in 2013.
Arizona Wine Growers Association (PROJECT PARTNER)
Arizona Wine Growers Association (AWGA) represents the Arizona wine industry producing
value-added crops that are transforming Greater Arizona’s economy by creating jobs, increasing
the tax base, drawing tourists, and preserving the farming heritage and rural lifestyle. AWGA
serves grape growers and winemakers in Arizona, allying its members for representation,
promotion and education. The association strives to advance with integrity the sustainable
growth and production of authentic Arizona-grown wines. AWGA incorporated as a 501-c (5)
labor and agriculture organization representing wineries, winemakers, grape growers, wine grape
researchers, retailers, hospitality-related businesses, valued-added agricultural producers or
groups, vendors, and wine consumers.
Page 80 of 147
Arizona Department of Agriculture
Specialty Crop Block Grant Program
Agreement No. 12-25-B-1655
The AWGA provided the vision, general oversight and administration (ROLE) of this grant
project. In addition, the AWGA assisted in the identification of the individual grower-
participants and communicated with the growers about the purpose, status and progress of the
survey project. (CONTRIBUTION)
USDA National Agricultural Statistics Service (NASS) (PROJECT PARTNER)
The USDA's National Agricultural Statistics Service (NASS) conducts hundreds of surveys
every year and prepares reports covering virtually every aspect of U.S. agriculture. Production
and supplies of food and fiber, prices paid and received by farmers, farm labor and wages, farm
finances, chemical use, and changes in the demographics of U.S. producers are only a few
examples.
NASS is committed to providing timely, accurate, and useful statistics in service to U.S.
agriculture. To uphold our continuing commitment, NASS will:
Report the facts on American agriculture, facts needed by people working in and depending
upon U.S. agriculture.
Provide objective and unbiased statistics on a preannounced schedule that is fair and
impartial to all market participants.
Conduct the Census of Agriculture every five years, providing the only source of consistent,
comparable, and detailed agricultural data for every county in America.
Serve the needs of our data users and customers at a local level through our network of State
field offices and our cooperative relationship with universities and State Departments of
Agriculture.
Safeguard the privacy of farmers, ranchers, and other data providers, with a guarantee that
confidentiality and data security continue to be our top priorities.
The NASS did oversee the completion of the survey and analysis and publication of the
information collected. (ROLE) The final report on the ARIZONA VINEYARD SURVEY - 2013
was completed in September of 2014 and the published document was distributed to the AWGA
and the participating growers. (CONTRIBUTION)
Goals and Outcomes Achieved The long-term objective was to establish a baseline for the ongoing survey of the Arizona grape
growing industry. The 2013 Survey established that baseline and efforts are now underway with
the University of Arizona Extension Service and other private sector partners to continue the
survey and update the development and expansion of grape vineyards in Arizona.
The goal of the project was to increase grower, consumer and governmental awareness of the
growth and viability of the wine grape industry. This was accomplished by completing the
survey and distribution of the information to the members of the AWGA through meetings and
brochures. The consumer was provided this information through the publication of news articles
referencing the information in magazines (Arizona Vines and Wines), newspapers (Arizona
Republic, Arizona Range News and others).
Governmental agencies, including the Arizona Department of Water Resources and the Arizona
Department of Liquor Licenses and Control were made aware by the publication by the AWGA
of the results of the survey.
Page 81 of 147
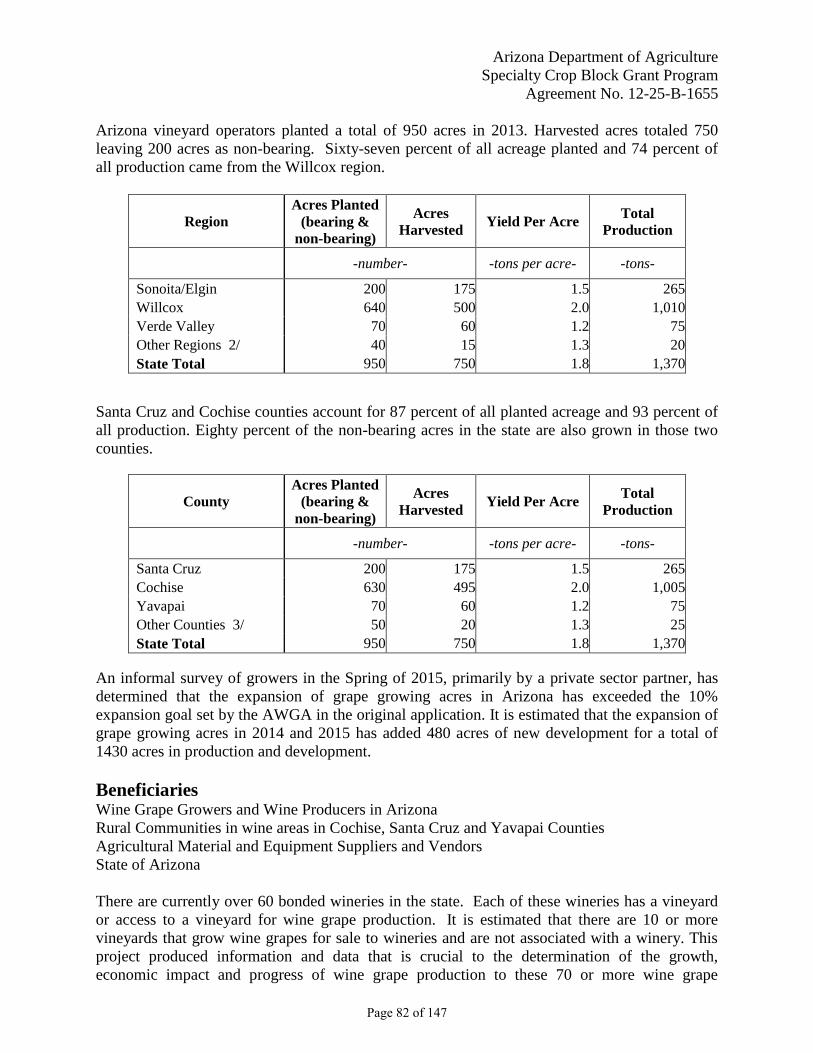
Arizona Department of Agriculture
Specialty Crop Block Grant Program
Agreement No. 12-25-B-1655
Arizona vineyard operators planted a total of 950 acres in 2013. Harvested acres totaled 750
leaving 200 acres as non-bearing. Sixty-seven percent of all acreage planted and 74 percent of
all production came from the Willcox region.
Region
Acres Planted
(bearing &
non-bearing)
Acres
Harvested Yield Per Acre
Total
Production
-number- -tons per acre- -tons-
Sonoita/Elgin 200 175 1.5 265
Willcox 640 500 2.0 1,010
Verde Valley 70 60 1.2 75
Other Regions 2/ 40 15 1.3 20
State Total 950 750 1.8 1,370
Santa Cruz and Cochise counties account for 87 percent of all planted acreage and 93 percent of
all production. Eighty percent of the non-bearing acres in the state are also grown in those two
counties.
County
Acres Planted
(bearing &
non-bearing)
Acres
Harvested Yield Per Acre
Total
Production
-number- -tons per acre- -tons-
Santa Cruz 200 175 1.5 265
Cochise 630 495 2.0 1,005
Yavapai 70 60 1.2 75
Other Counties 3/ 50 20 1.3 25
State Total 950 750 1.8 1,370
An informal survey of growers in the Spring of 2015, primarily by a private sector partner, has
determined that the expansion of grape growing acres in Arizona has exceeded the 10%
expansion goal set by the AWGA in the original application. It is estimated that the expansion of
grape growing acres in 2014 and 2015 has added 480 acres of new development for a total of
1430 acres in production and development.
Beneficiaries Wine Grape Growers and Wine Producers in Arizona
Rural Communities in wine areas in Cochise, Santa Cruz and Yavapai Counties
Agricultural Material and Equipment Suppliers and Vendors
State of Arizona
There are currently over 60 bonded wineries in the state. Each of these wineries has a vineyard
or access to a vineyard for wine grape production. It is estimated that there are 10 or more
vineyards that grow wine grapes for sale to wineries and are not associated with a winery. This
project produced information and data that is crucial to the determination of the growth,
economic impact and progress of wine grape production to these 70 or more wine grape
Page 82 of 147
Arizona Department of Agriculture
Specialty Crop Block Grant Program
Agreement No. 12-25-B-1655
growers. With this reliable survey, governmental and private lenders can reasonable determine
the potential viability of the wine industry and its vineyards. Wine grapes are a growing industry
in Arizona that before the survey, was believed to be booming. The survey has added legitimacy
and scientific accuracy to what is believed, by those involved, to be happening. A legitimate,
accurate survey has allowed those who are on the sidelines to have confidence in the claims of
growth and increased profits by bringing the information out into the open in a reliable manner.
Other states that have supported their nascent wine grape industries have reaped substantial
rewards in the form of increased employment (vineyards, wineries and tasting rooms), increased
tourism and ancillary benefits to other businesses (hotels, restaurants, stores). This survey is the
foundation upon which these benefits rest.
Lessons Learned The primary result of the survey report was to establish a baseline of information and to motivate
the AWGA to pursue continued data collection on grape growing in Arizona. We believe the
survey also demonstrated to winemakers that there was indeed an adequate supply of grape
production in the state to base their new or expanded wine production operations on.
Contact Person Rod Keeling, President
Arizona Wine Growers Association
10277 E Rock Creek Ln
Pearce, AZ 85625
520-507-2301
Additional Information Based on the required report of wine production to the Arizona Department of Liquor Licenses
and Control (ADLLC), the total production of wine by Arizona wineries in 2014 was 238,373
gallons. (Appendix H) When this survey was conducted in 2013, there were 60 licensed
wineries in Arizona. In June 2015, there were 92 licensed wineries in Arizona.
Attached as separate documents in Appendix H:
ARIZONA VINEYARD SURVEY - 2013
AZWine Lifestyle Magazine March-June Article
Report of Wine Production in Arizona 2014 ADLLC
Sustainable Management Practices for Bagrada Bugs This project was completed on September 30, 2015
Project Summary The bagrada bug, Bagrada hilaris, was first discovered in southern California in 2008 and now
has a geographic range that encompasses four southwestern states including agricultural and
urban areas of Arizona. Key to its rapid spread is its capacity to find and utilize cultivated and
wild members of the Brassicaceae, also known as the mustard or crucifer plant family. Crops
Page 83 of 147
Arizona Department of Agriculture
Specialty Crop Block Grant Program
Agreement No. 12-25-B-1655
belonging to this family include broccoli, cabbage, cauliflower, kale and many others, all of
which are extremely vulnerable to attack in the seedling stage and as young plants. The bagrada
bug has consistently demonstrated a remarkable capacity to locate newly emergent crops during
the fall planting season and descend upon whole fields in destructive numbers. Excessive feeding
damage to apical meristems can result in damage to the terminal growing point leading to either
adventitious bud break (e.g., cabbage plants with multiple, unmarketable heads) or plants with no
reproductive head being formed (e.g., broccoli with no crowns). The potential economic impact
of Bagrada bugs on the western vegetable industry could be quite significant considering that the
production of brassicaceous crops in Arizona was collectively valued at over $150 million in
2011.
After four consecutive years of bagrada bug attack on brassicaceous crops including a heavy
attack in 2012, Arizona vegetable growers are better prepared to respond to the sudden
infestations that occur in their newly planted fields each fall. However, questions have been
raised in the industry over how long chemically intensive control programs can be sustained. In
addition, organic growers of Brassicaceous crops have had little recourse but to suffer heavy
losses due to early season infestations of bagrada bug. For these reasons, alternative
management approaches are needed by Arizona growers that will not only benefit conventional
management programs by reducing insecticide selection pressure, but will also provide a set of
long term control tactics that will be compatible with growers of organic broccoli and other
organic brassicaceous crops. By taking advantage of well-developed sensory mechanisms that
promote the mass invasions of bagrada bugs into emergent crops, fundamental ecological field
studies were designed to allow us to better understand bagrada bug host preferences for the
purpose of developing new control methods that greatly reduce infestations in commercial crops.
Research Objectives: Objective 1 – Evaluate various brassicaceous species in greenhouse and
field trials to determine relative attractiveness to bagrada bug. Objective 2 – Working with the
most attractive species from Obj. 1, develop trap crop strategies in the field that most effectively
reduce numbers of bagrada bugs entering the protected crop. Objective 3 – Evaluate flight
capabilities and relative sensitivity to plant volatiles to develop more effective trap crop
techniques.
Project Approach Objective 1 Our approach to Objective 1 was to conduct a series of host-choice tests under
greenhouse and field conditions to evaluate the host selection behavior of the bagrada bug on
commercial cruciferous seedlings. In addition, a separate choice test was conducted to
investigate the selection behavior of bagrada bug adults for broccoli plants of various growth
stages: cotyledon, 1-leaf, 2-leaf, and 4-leaf plant stages. Eleven commercial cruciferous
vegetable cultivars were selected for evaluation in the host preference tests: arugula/roquette,
broccoli, green cabbage, red cabbage, napa cabbage, cauliflower, kale, Kohlrabi, green mustard,
red mustard, and radish. In addition, two non-crop cruciferous plant species, sweet alyssum and
stock, were included in the host selection tests as they are popular ornamental landscape species.
All plant species used in the tests were direct-seeded into 5 × 5 cm2 pots for germination with a
commercial-grade potting soil (Miracle-Gro®) and irrigated daily in the greenhouse. All adult
insects used for preference studies were obtained from a bagrada bug colony maintained at the
Yuma Agricultural Center.
Page 84 of 147
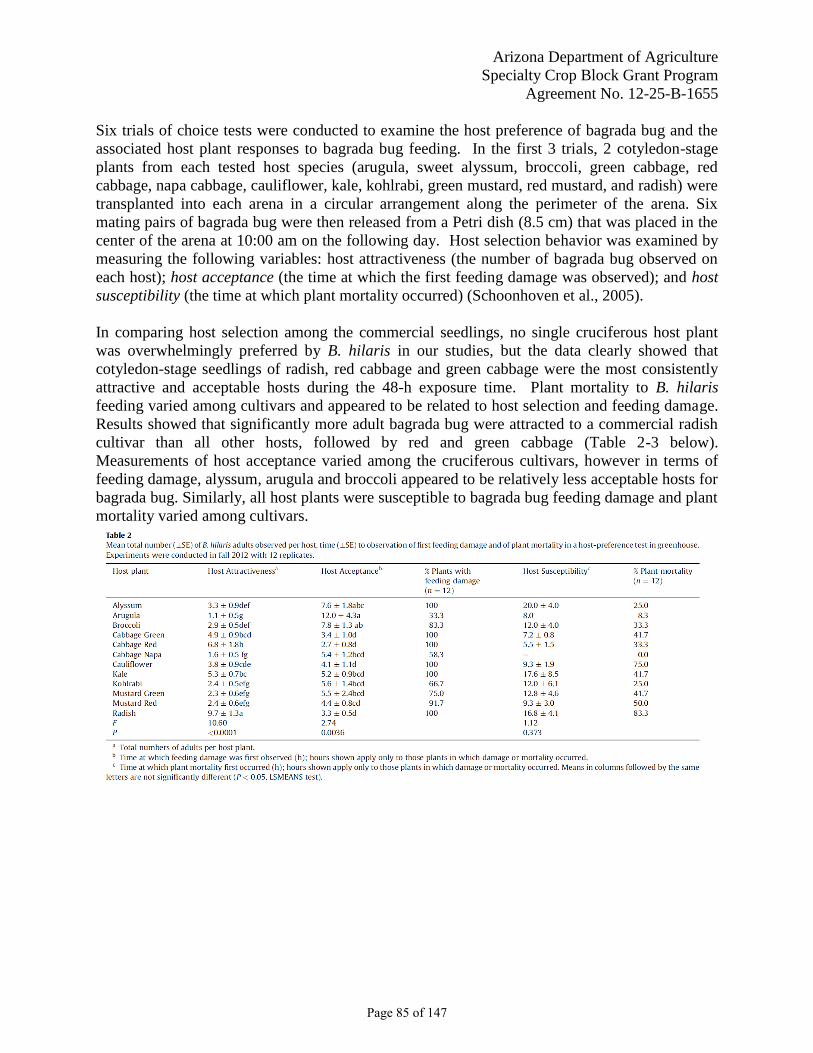
Arizona Department of Agriculture
Specialty Crop Block Grant Program
Agreement No. 12-25-B-1655
Six trials of choice tests were conducted to examine the host preference of bagrada bug and the
associated host plant responses to bagrada bug feeding. In the first 3 trials, 2 cotyledon-stage
plants from each tested host species (arugula, sweet alyssum, broccoli, green cabbage, red
cabbage, napa cabbage, cauliflower, kale, kohlrabi, green mustard, red mustard, and radish) were
transplanted into each arena in a circular arrangement along the perimeter of the arena. Six
mating pairs of bagrada bug were then released from a Petri dish (8.5 cm) that was placed in the
center of the arena at 10:00 am on the following day. Host selection behavior was examined by
measuring the following variables: host attractiveness (the number of bagrada bug observed on
each host); host acceptance (the time at which the first feeding damage was observed); and host
susceptibility (the time at which plant mortality occurred) (Schoonhoven et al., 2005).
In comparing host selection among the commercial seedlings, no single cruciferous host plant
was overwhelmingly preferred by B. hilaris in our studies, but the data clearly showed that
cotyledon-stage seedlings of radish, red cabbage and green cabbage were the most consistently
attractive and acceptable hosts during the 48-h exposure time. Plant mortality to B. hilaris
feeding varied among cultivars and appeared to be related to host selection and feeding damage.
Results showed that significantly more adult bagrada bug were attracted to a commercial radish
cultivar than all other hosts, followed by red and green cabbage (Table 2-3 below).
Measurements of host acceptance varied among the cruciferous cultivars, however in terms of
feeding damage, alyssum, arugula and broccoli appeared to be relatively less acceptable hosts for
bagrada bug. Similarly, all host plants were susceptible to bagrada bug feeding damage and plant
mortality varied among cultivars.
Page 85 of 147
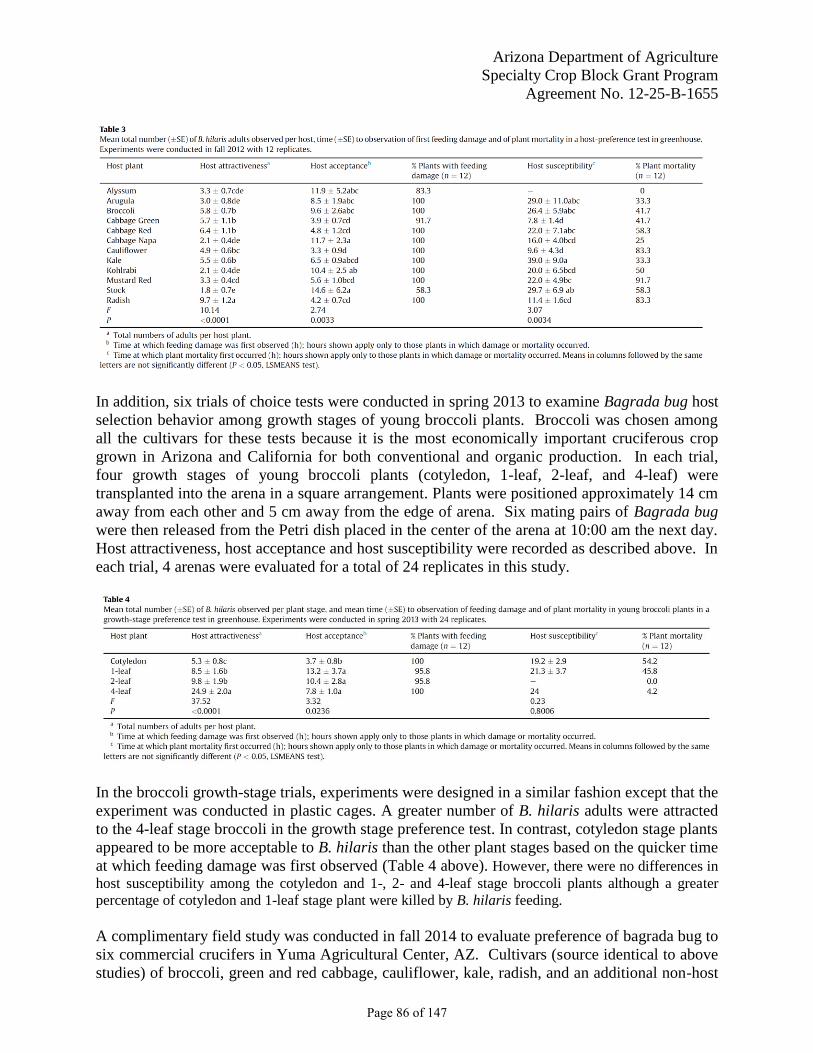
Arizona Department of Agriculture
Specialty Crop Block Grant Program
Agreement No. 12-25-B-1655
In addition, six trials of choice tests were conducted in spring 2013 to examine Bagrada bug host
selection behavior among growth stages of young broccoli plants. Broccoli was chosen among
all the cultivars for these tests because it is the most economically important cruciferous crop
grown in Arizona and California for both conventional and organic production. In each trial,
four growth stages of young broccoli plants (cotyledon, 1-leaf, 2-leaf, and 4-leaf) were
transplanted into the arena in a square arrangement. Plants were positioned approximately 14 cm
away from each other and 5 cm away from the edge of arena. Six mating pairs of Bagrada bug
were then released from the Petri dish placed in the center of the arena at 10:00 am the next day.
Host attractiveness, host acceptance and host susceptibility were recorded as described above. In
each trial, 4 arenas were evaluated for a total of 24 replicates in this study.
In the broccoli growth-stage trials, experiments were designed in a similar fashion except that the
experiment was conducted in plastic cages. A greater number of B. hilaris adults were attracted
to the 4-leaf stage broccoli in the growth stage preference test. In contrast, cotyledon stage plants
appeared to be more acceptable to B. hilaris than the other plant stages based on the quicker time
at which feeding damage was first observed (Table 4 above). However, there were no differences in
host susceptibility among the cotyledon and 1-, 2- and 4-leaf stage broccoli plants although a greater
percentage of cotyledon and 1-leaf stage plant were killed by B. hilaris feeding.
A complimentary field study was conducted in fall 2014 to evaluate preference of bagrada bug to
six commercial crucifers in Yuma Agricultural Center, AZ. Cultivars (source identical to above
studies) of broccoli, green and red cabbage, cauliflower, kale, radish, and an additional non-host
Page 86 of 147
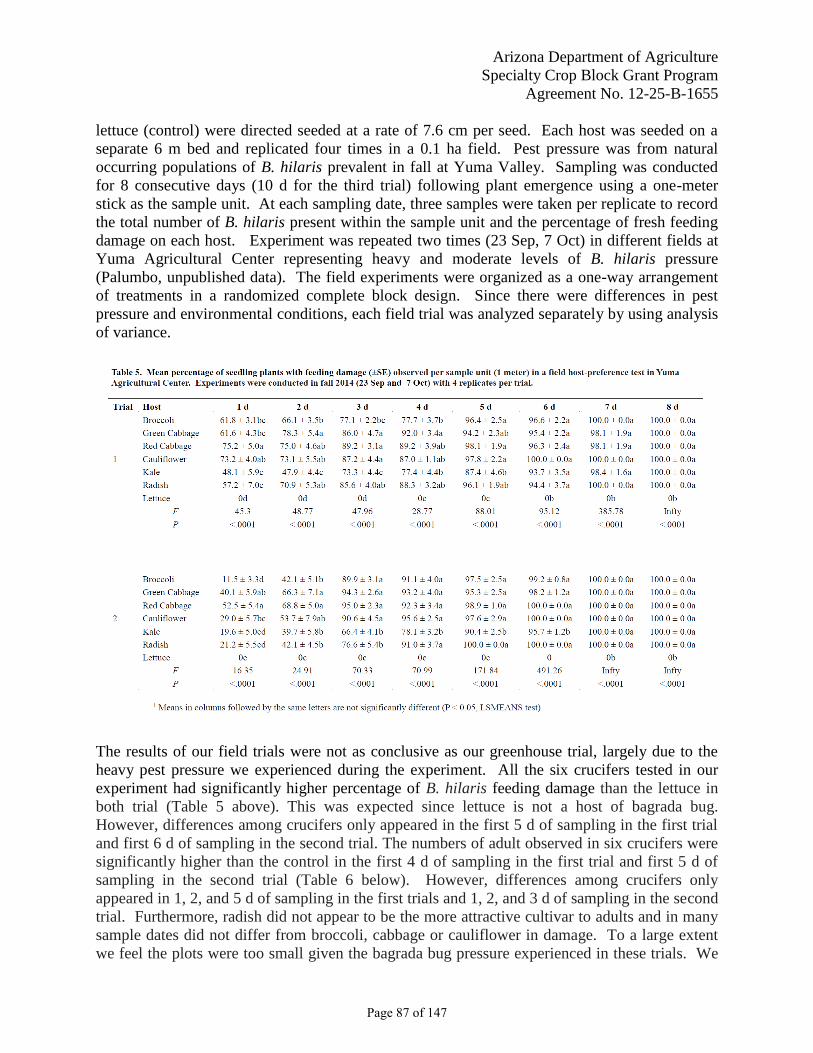
Arizona Department of Agriculture
Specialty Crop Block Grant Program
Agreement No. 12-25-B-1655
lettuce (control) were directed seeded at a rate of 7.6 cm per seed. Each host was seeded on a
separate 6 m bed and replicated four times in a 0.1 ha field. Pest pressure was from natural
occurring populations of B. hilaris prevalent in fall at Yuma Valley. Sampling was conducted
for 8 consecutive days (10 d for the third trial) following plant emergence using a one-meter
stick as the sample unit. At each sampling date, three samples were taken per replicate to record
the total number of B. hilaris present within the sample unit and the percentage of fresh feeding
damage on each host. Experiment was repeated two times (23 Sep, 7 Oct) in different fields at
Yuma Agricultural Center representing heavy and moderate levels of B. hilaris pressure
(Palumbo, unpublished data). The field experiments were organized as a one-way arrangement
of treatments in a randomized complete block design. Since there were differences in pest
pressure and environmental conditions, each field trial was analyzed separately by using analysis
of variance.
The results of our field trials were not as conclusive as our greenhouse trial, largely due to the
heavy pest pressure we experienced during the experiment. All the six crucifers tested in our
experiment had significantly higher percentage of B. hilaris feeding damage than the lettuce in
both trial (Table 5 above). This was expected since lettuce is not a host of bagrada bug.
However, differences among crucifers only appeared in the first 5 d of sampling in the first trial
and first 6 d of sampling in the second trial. The numbers of adult observed in six crucifers were
significantly higher than the control in the first 4 d of sampling in the first trial and first 5 d of
sampling in the second trial (Table 6 below). However, differences among crucifers only
appeared in 1, 2, and 5 d of sampling in the first trials and 1, 2, and 3 d of sampling in the second
trial. Furthermore, radish did not appear to be the more attractive cultivar to adults and in many
sample dates did not differ from broccoli, cabbage or cauliflower in damage. To a large extent
we feel the plots were too small given the bagrada bug pressure experienced in these trials. We
Page 87 of 147
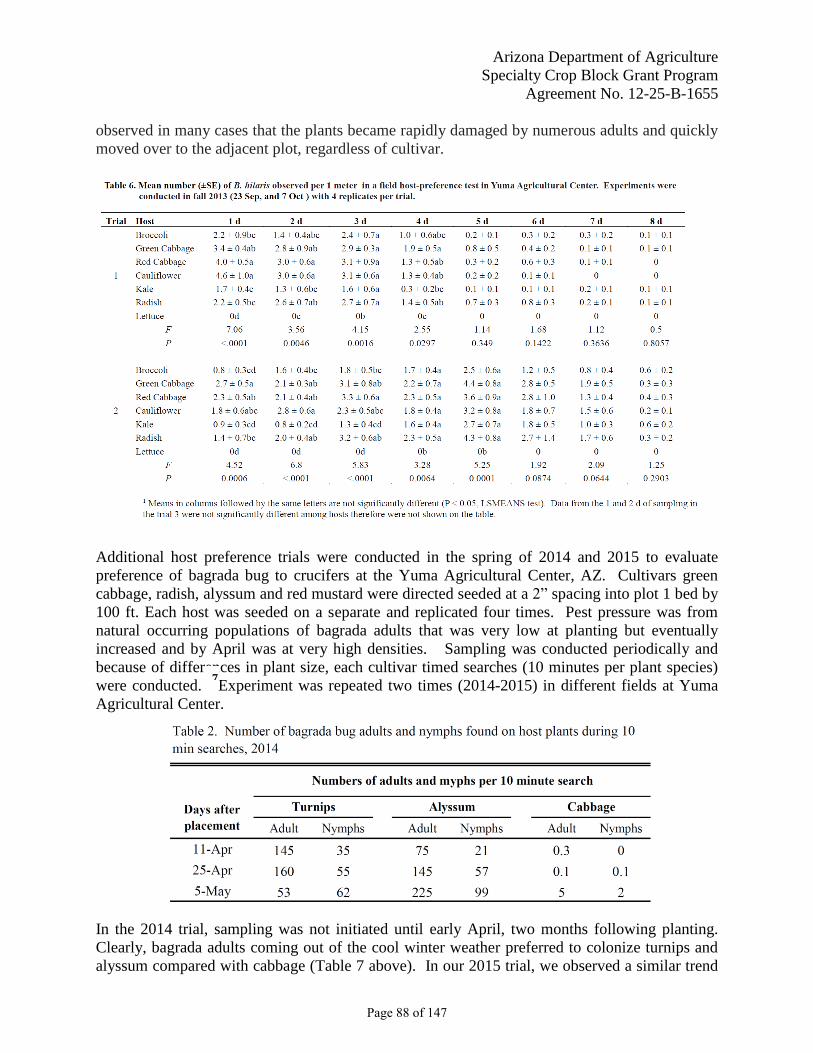
Arizona Department of Agriculture
Specialty Crop Block Grant Program
Agreement No. 12-25-B-1655
observed in many cases that the plants became rapidly damaged by numerous adults and quickly
moved over to the adjacent plot, regardless of cultivar.
Additional host preference trials were conducted in the spring of 2014 and 2015 to evaluate
preference of bagrada bug to crucifers at the Yuma Agricultural Center, AZ. Cultivars green
cabbage, radish, alyssum and red mustard were directed seeded at a 2” spacing into plot 1 bed by
100 ft. Each host was seeded on a separate and replicated four times. Pest pressure was from
natural occurring populations of bagrada adults that was very low at planting but eventually
increased and by April was at very high densities. Sampling was conducted periodically and
because of differences in plant size, each cultivar timed searches (10 minutes per plant species)
were conducted. Experiment was repeated two times (2014-2015) in different fields at Yuma
Agricultural Center.
In the 2014 trial, sampling was not initiated until early April, two months following planting.
Clearly, bagrada adults coming out of the cool winter weather preferred to colonize turnips and
alyssum compared with cabbage (Table 7 above). In our 2015 trial, we observed a similar trend
7
Page 88 of 147
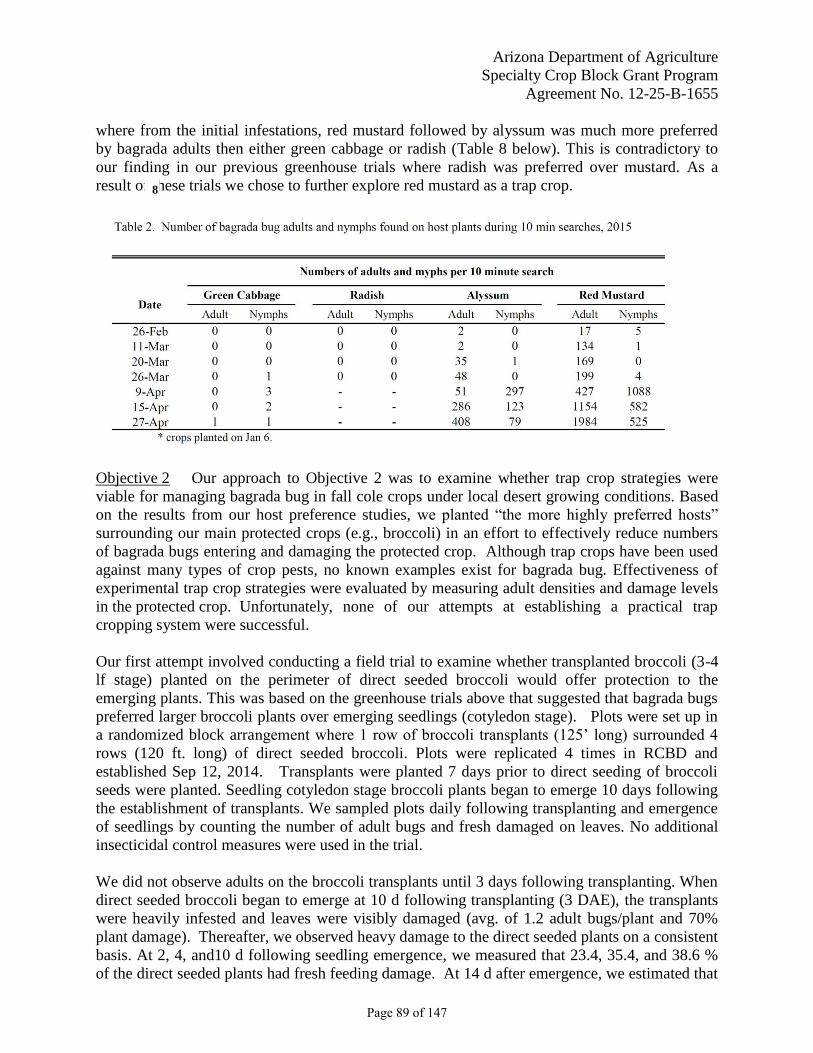
Arizona Department of Agriculture
Specialty Crop Block Grant Program
Agreement No. 12-25-B-1655
where from the initial infestations, red mustard followed by alyssum was much more preferred
by bagrada adults then either green cabbage or radish (Table 8 below). This is contradictory to
our finding in our previous greenhouse trials where radish was preferred over mustard. As a
result of these trials we chose to further explore red mustard as a trap crop.
Objective 2 Our approach to Objective 2 was to examine whether trap crop strategies were
viable for managing bagrada bug in fall cole crops under local desert growing conditions. Based
on the results from our host preference studies, we planted “the more highly preferred hosts”
surrounding our main protected crops (e.g., broccoli) in an effort to effectively reduce numbers
of bagrada bugs entering and damaging the protected crop. Although trap crops have been used
against many types of crop pests, no known examples exist for bagrada bug. Effectiveness of
experimental trap crop strategies were evaluated by measuring adult densities and damage levels
in the protected crop. Unfortunately, none of our attempts at establishing a practical trap
cropping system were successful.
Our first attempt involved conducting a field trial to examine whether transplanted broccoli (3-4
lf stage) planted on the perimeter of direct seeded broccoli would offer protection to the
emerging plants. This was based on the greenhouse trials above that suggested that bagrada bugs
preferred larger broccoli plants over emerging seedlings (cotyledon stage). Plots were set up in
a randomized block arrangement where 1 row of broccoli transplants (125’ long) surrounded 4
rows (120 ft. long) of direct seeded broccoli. Plots were replicated 4 times in RCBD and
established Sep 12, 2014. Transplants were planted 7 days prior to direct seeding of broccoli
seeds were planted. Seedling cotyledon stage broccoli plants began to emerge 10 days following
the establishment of transplants. We sampled plots daily following transplanting and emergence
of seedlings by counting the number of adult bugs and fresh damaged on leaves. No additional
insecticidal control measures were used in the trial.
We did not observe adults on the broccoli transplants until 3 days following transplanting. When
direct seeded broccoli began to emerge at 10 d following transplanting (3 DAE), the transplants
were heavily infested and leaves were visibly damaged (avg. of 1.2 adult bugs/plant and 70%
plant damage). Thereafter, we observed heavy damage to the direct seeded plants on a consistent
basis. At 2, 4, and10 d following seedling emergence, we measured that 23.4, 35.4, and 38.6 %
of the direct seeded plants had fresh feeding damage. At 14 d after emergence, we estimated that
8
Page 89 of 147
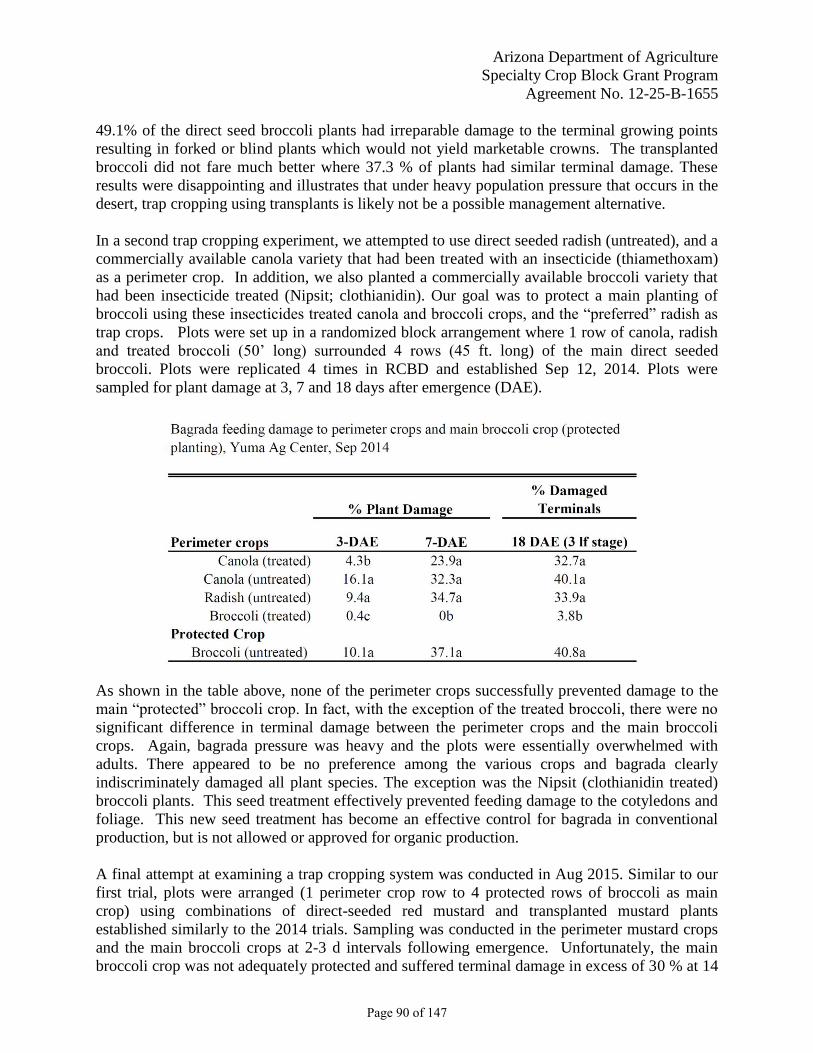
Arizona Department of Agriculture
Specialty Crop Block Grant Program
Agreement No. 12-25-B-1655
49.1% of the direct seed broccoli plants had irreparable damage to the terminal growing points
resulting in forked or blind plants which would not yield marketable crowns. The transplanted
broccoli did not fare much better where 37.3 % of plants had similar terminal damage. These
results were disappointing and illustrates that under heavy population pressure that occurs in the
desert, trap cropping using transplants is likely not be a possible management alternative.
In a second trap cropping experiment, we attempted to use direct seeded radish (untreated), and a
commercially available canola variety that had been treated with an insecticide (thiamethoxam)
as a perimeter crop. In addition, we also planted a commercially available broccoli variety that
had been insecticide treated (Nipsit; clothianidin). Our goal was to protect a main planting of
broccoli using these insecticides treated canola and broccoli crops, and the “preferred” radish as
trap crops. Plots were set up in a randomized block arrangement where 1 row of canola, radish
and treated broccoli (50’ long) surrounded 4 rows (45 ft. long) of the main direct seeded
broccoli. Plots were replicated 4 times in RCBD and established Sep 12, 2014. Plots were
sampled for plant damage at 3, 7 and 18 days after emergence (DAE).
As shown in the table above, none of the perimeter crops successfully prevented damage to the
main “protected” broccoli crop. In fact, with the exception of the treated broccoli, there were no
significant difference in terminal damage between the perimeter crops and the main broccoli
crops. Again, bagrada pressure was heavy and the plots were essentially overwhelmed with
adults. There appeared to be no preference among the various crops and bagrada clearly
indiscriminately damaged all plant species. The exception was the Nipsit (clothianidin treated)
broccoli plants. This seed treatment effectively prevented feeding damage to the cotyledons and
foliage. This new seed treatment has become an effective control for bagrada in conventional
production, but is not allowed or approved for organic production.
A final attempt at examining a trap cropping system was conducted in Aug 2015. Similar to our
first trial, plots were arranged (1 perimeter crop row to 4 protected rows of broccoli as main
crop) using combinations of direct-seeded red mustard and transplanted mustard plants
established similarly to the 2014 trials. Sampling was conducted in the perimeter mustard crops
and the main broccoli crops at 2-3 d intervals following emergence. Unfortunately, the main
broccoli crop was not adequately protected and suffered terminal damage in excess of 30 % at 14
Page 90 of 147
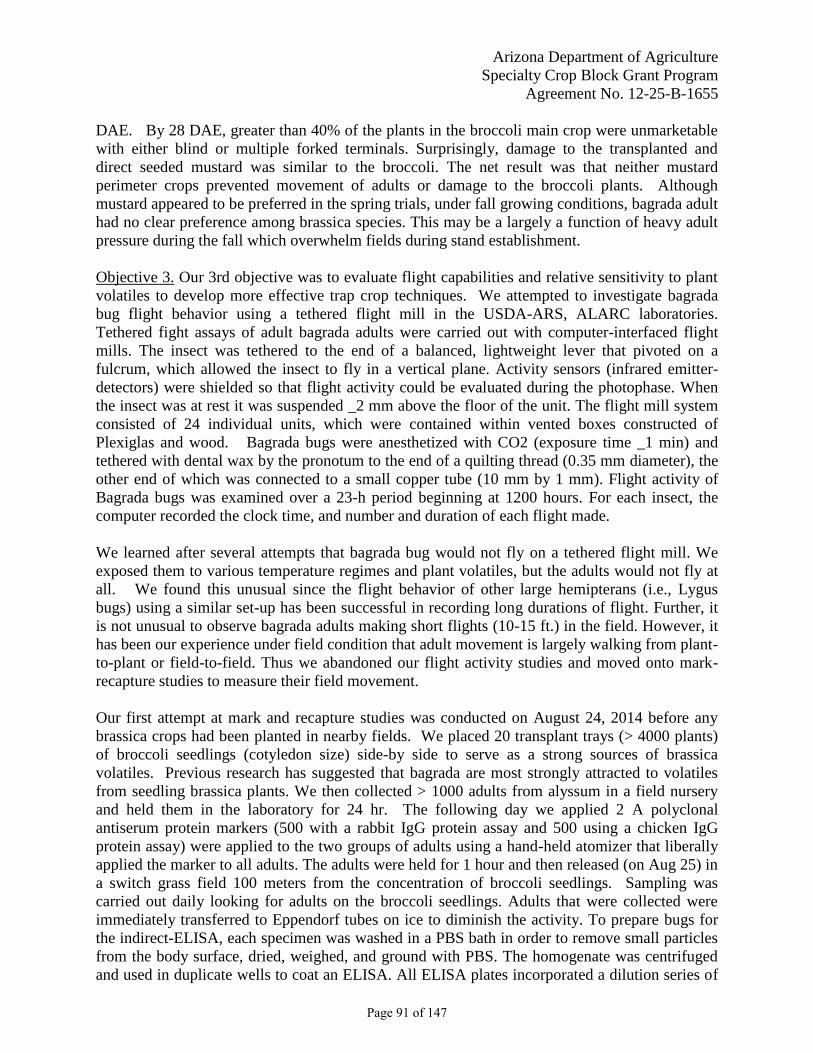
Arizona Department of Agriculture
Specialty Crop Block Grant Program
Agreement No. 12-25-B-1655
DAE. By 28 DAE, greater than 40% of the plants in the broccoli main crop were unmarketable
with either blind or multiple forked terminals. Surprisingly, damage to the transplanted and
direct seeded mustard was similar to the broccoli. The net result was that neither mustard
perimeter crops prevented movement of adults or damage to the broccoli plants. Although
mustard appeared to be preferred in the spring trials, under fall growing conditions, bagrada adult
had no clear preference among brassica species. This may be a largely a function of heavy adult
pressure during the fall which overwhelm fields during stand establishment.
Objective 3. Our 3rd objective was to evaluate flight capabilities and relative sensitivity to plant
volatiles to develop more effective trap crop techniques. We attempted to investigate bagrada
bug flight behavior using a tethered flight mill in the USDA-ARS, ALARC laboratories.
Tethered fight assays of adult bagrada adults were carried out with computer-interfaced flight
mills. The insect was tethered to the end of a balanced, lightweight lever that pivoted on a
fulcrum, which allowed the insect to fly in a vertical plane. Activity sensors (infrared emitter-
detectors) were shielded so that flight activity could be evaluated during the photophase. When
the insect was at rest it was suspended _2 mm above the floor of the unit. The flight mill system
consisted of 24 individual units, which were contained within vented boxes constructed of
Plexiglas and wood. Bagrada bugs were anesthetized with CO2 (exposure time _1 min) and
tethered with dental wax by the pronotum to the end of a quilting thread (0.35 mm diameter), the
other end of which was connected to a small copper tube (10 mm by 1 mm). Flight activity of
Bagrada bugs was examined over a 23-h period beginning at 1200 hours. For each insect, the
computer recorded the clock time, and number and duration of each flight made.
We learned after several attempts that bagrada bug would not fly on a tethered flight mill. We
exposed them to various temperature regimes and plant volatiles, but the adults would not fly at
all. We found this unusual since the flight behavior of other large hemipterans (i.e., Lygus
bugs) using a similar set-up has been successful in recording long durations of flight. Further, it
is not unusual to observe bagrada adults making short flights (10-15 ft.) in the field. However, it
has been our experience under field condition that adult movement is largely walking from plant-
to-plant or field-to-field. Thus we abandoned our flight activity studies and moved onto mark-
recapture studies to measure their field movement.
Our first attempt at mark and recapture studies was conducted on August 24, 2014 before any
brassica crops had been planted in nearby fields. We placed 20 transplant trays (> 4000 plants)
of broccoli seedlings (cotyledon size) side-by side to serve as a strong sources of brassica
volatiles. Previous research has suggested that bagrada are most strongly attracted to volatiles
from seedling brassica plants. We then collected > 1000 adults from alyssum in a field nursery
and held them in the laboratory for 24 hr. The following day we applied 2 A polyclonal
antiserum protein markers (500 with a rabbit IgG protein assay and 500 using a chicken IgG
protein assay) were applied to the two groups of adults using a hand-held atomizer that liberally
applied the marker to all adults. The adults were held for 1 hour and then released (on Aug 25) in
a switch grass field 100 meters from the concentration of broccoli seedlings. Sampling was
carried out daily looking for adults on the broccoli seedlings. Adults that were collected were
immediately transferred to Eppendorf tubes on ice to diminish the activity. To prepare bugs for
the indirect-ELISA, each specimen was washed in a PBS bath in order to remove small particles
from the body surface, dried, weighed, and ground with PBS. The homogenate was centrifuged
and used in duplicate wells to coat an ELISA. All ELISA plates incorporated a dilution series of
Page 91 of 147
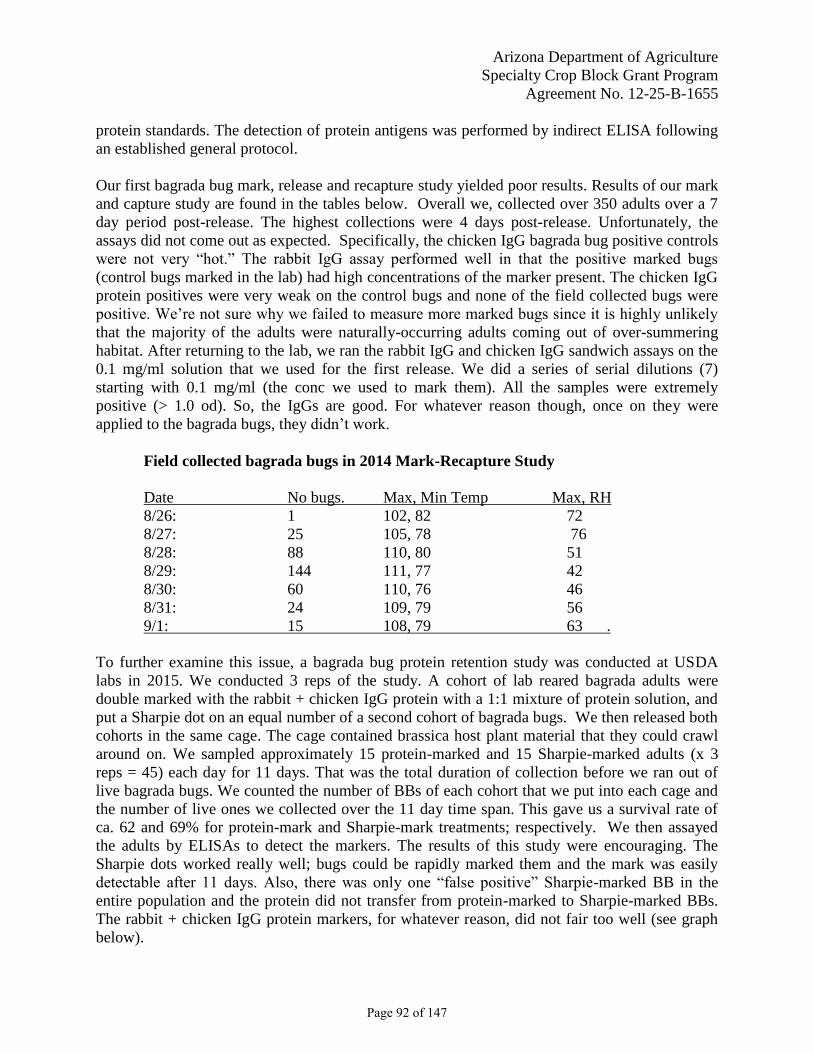
Arizona Department of Agriculture
Specialty Crop Block Grant Program
Agreement No. 12-25-B-1655
protein standards. The detection of protein antigens was performed by indirect ELISA following
an established general protocol.
Our first bagrada bug mark, release and recapture study yielded poor results. Results of our mark
and capture study are found in the tables below. Overall we, collected over 350 adults over a 7
day period post-release. The highest collections were 4 days post-release. Unfortunately, the
assays did not come out as expected. Specifically, the chicken IgG bagrada bug positive controls
were not very “hot.” The rabbit IgG assay performed well in that the positive marked bugs
(control bugs marked in the lab) had high concentrations of the marker present. The chicken IgG
protein positives were very weak on the control bugs and none of the field collected bugs were
positive. We’re not sure why we failed to measure more marked bugs since it is highly unlikely
that the majority of the adults were naturally-occurring adults coming out of over-summering
habitat. After returning to the lab, we ran the rabbit IgG and chicken IgG sandwich assays on the
0.1 mg/ml solution that we used for the first release. We did a series of serial dilutions (7)
starting with 0.1 mg/ml (the conc we used to mark them). All the samples were extremely
positive (> 1.0 od). So, the IgGs are good. For whatever reason though, once on they were
applied to the bagrada bugs, they didn’t work.
Field collected bagrada bugs in 2014 Mark-Recapture Study
Date No bugs. Max, Min Temp Max, RH
8/26: 1 102, 82 72
8/27: 25 105, 78 76
8/28: 88 110, 80 51
8/29: 144 111, 77 42
8/30: 60 110, 76 46
8/31: 24 109, 79 56
9/1: 15 108, 79 63 .
To further examine this issue, a bagrada bug protein retention study was conducted at USDA
labs in 2015. We conducted 3 reps of the study. A cohort of lab reared bagrada adults were
double marked with the rabbit + chicken IgG protein with a 1:1 mixture of protein solution, and
put a Sharpie dot on an equal number of a second cohort of bagrada bugs. We then released both
cohorts in the same cage. The cage contained brassica host plant material that they could crawl
around on. We sampled approximately 15 protein-marked and 15 Sharpie-marked adults (x 3
reps = 45) each day for 11 days. That was the total duration of collection before we ran out of
live bagrada bugs. We counted the number of BBs of each cohort that we put into each cage and
the number of live ones we collected over the 11 day time span. This gave us a survival rate of
ca. 62 and 69% for protein-mark and Sharpie-mark treatments; respectively. We then assayed
the adults by ELISAs to detect the markers. The results of this study were encouraging. The
Sharpie dots worked really well; bugs could be rapidly marked them and the mark was easily
detectable after 11 days. Also, there was only one “false positive” Sharpie-marked BB in the
entire population and the protein did not transfer from protein-marked to Sharpie-marked BBs.
The rabbit + chicken IgG protein markers, for whatever reason, did not fair too well (see graph
below).
Page 92 of 147
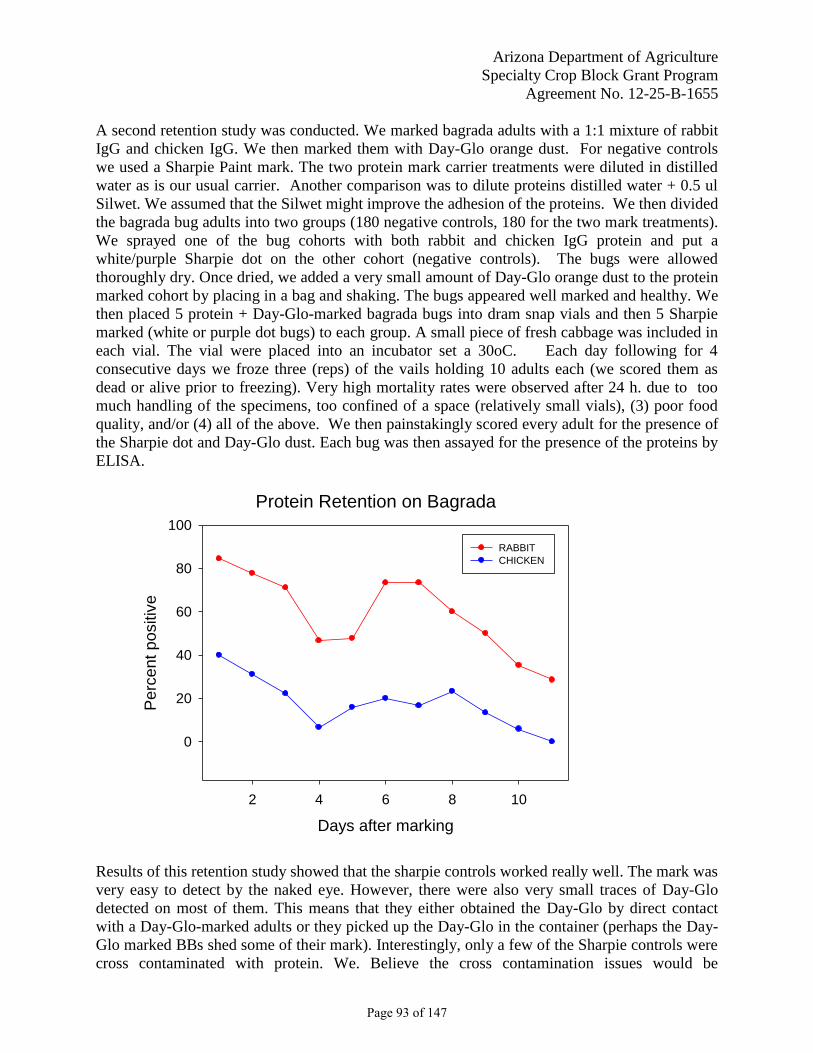
Arizona Department of Agriculture
Specialty Crop Block Grant Program
Agreement No. 12-25-B-1655
A second retention study was conducted. We marked bagrada adults with a 1:1 mixture of rabbit
IgG and chicken IgG. We then marked them with Day-Glo orange dust. For negative controls
we used a Sharpie Paint mark. The two protein mark carrier treatments were diluted in distilled
water as is our usual carrier. Another comparison was to dilute proteins distilled water + 0.5 ul
Silwet. We assumed that the Silwet might improve the adhesion of the proteins. We then divided
the bagrada bug adults into two groups (180 negative controls, 180 for the two mark treatments).
We sprayed one of the bug cohorts with both rabbit and chicken IgG protein and put a
white/purple Sharpie dot on the other cohort (negative controls). The bugs were allowed
thoroughly dry. Once dried, we added a very small amount of Day-Glo orange dust to the protein
marked cohort by placing in a bag and shaking. The bugs appeared well marked and healthy. We
then placed 5 protein + Day-Glo-marked bagrada bugs into dram snap vials and then 5 Sharpie
marked (white or purple dot bugs) to each group. A small piece of fresh cabbage was included in
each vial. The vial were placed into an incubator set a 30oC. Each day following for 4
consecutive days we froze three (reps) of the vails holding 10 adults each (we scored them as
dead or alive prior to freezing). Very high mortality rates were observed after 24 h. due to too
much handling of the specimens, too confined of a space (relatively small vials), (3) poor food
quality, and/or (4) all of the above. We then painstakingly scored every adult for the presence of
the Sharpie dot and Day-Glo dust. Each bug was then assayed for the presence of the proteins by
ELISA.
Protein Retention on Bagrada
Days after marking
2 4 6 8 10
Pe
rce
nt
po
sitiv
e
0
20
40
60
80
100
RABBIT
CHICKEN
Sample size for each day ranges from about 20-45 BBs
Mortality between the protein marked and Shaprie marked BBs was 62, and 69%; respectively over thecouuse of the 11 d study.
There was one false postive Sharpie marked BB (N = ca. 700).
Bottom line: For MRR use the Sharpie.
Results of this retention study showed that the sharpie controls worked really well. The mark was
very easy to detect by the naked eye. However, there were also very small traces of Day-Glo
detected on most of them. This means that they either obtained the Day-Glo by direct contact
with a Day-Glo-marked adults or they picked up the Day-Glo in the container (perhaps the Day-
Glo marked BBs shed some of their mark). Interestingly, only a few of the Sharpie controls were
cross contaminated with protein. We. Believe the cross contamination issues would be
Page 93 of 147
Arizona Department of Agriculture
Specialty Crop Block Grant Program
Agreement No. 12-25-B-1655
eliminated if a larger arena was used. The Day-Glo B marked bugs were well marked. But the
lateral transfer of the mark to the Sharpie controls is a concern. The rabbit IgG worked fairly
well, that is most of them were marked, but the OD readings were much lower than predicted.
Like our previous effort, the chicken IgG mark was not effective and we are not sure why. The
silwet was not any more (probably less) effective than the water only carrier. It also appears that
there was higher mortality associated with the organo-silicone adjuvant.
We’ve come to the conclusion based on these studies that future field mark/release/ recapture
studies should be done using the Sharpie Paint pen (white) mark. A high volume of bugs (1000s)
could easily be marked this way. It would also provide a real time assessment of the recapture
data. Also by placing a large white dot on them, field collected bugs could be reused by placing a
smaller and different colored dot on top of the white dot. Then, the next day we could see if they
remained (doubled marked) at the site.
Goals and Outcomes Achieved The goals of this project were to develop new information that may lead to the development of
alternative management strategies for bagrada bug on desert cole crops. This project certainly
generated some important scientific information and the outcome of this research may in the long
term provide some solutions for the bagrada problem. Our first goal was to determine the
relative attractiveness of various species of plants within the Brassicaceae plant family to
identify candidate species to be used in trap crops for bagrada bug. Prior to this study there was
no ranking of species in terms of attractiveness to bagrada bug from which selection of a
candidate to be used as a trap crop. We chose to evaluate cole crops and plant species commonly
grown in Arizona. The varieties found to be most attractive varied based on how we evaluated
them. Under greenhouse conditions, radish and cabbages were the most attractive brassica
species. However, under fall field conditions with heavy bug pressure, results were inconclusive.
Under spring conditions with lighter insect pressure, red mustard turned out to be highly
attractive to bagrada bugs. We also observed that larger plants (3-4 lf) appeared to attract more
adults than seedlings (cotyledon stage) based on our greenhouse studies. Thus we chose to
pursue the use of transplants and red mustard in our trap cropping studies.
Our second goal to develop a trap crop strategy based on field trials where different trap crops
using red mustard, radish and broccoli transplants were evaluated based on their ability to protect
main broccoli plantings from bagrada bug densities and damage levels. Prior to this project, the
only reference in the scientific literature to trap cropping for bagrada bugs was from the early
1900’s in South Africa. Perhaps now we know why so little information is available on this
management tactic. We were not successful in these studies and outcomes were negative in terms
of achieving our goal. In each of the three studies conducted, none of the perimeter “trap”
plantings prevented bagrada bugs from damaging our “protected” broccoli crops. This was
somewhat surprising given that most perimeter crops currently developed for insects (i.e.,
whiteflies, Diamondback moth) use a 10:1 - 20:1 ratio of protected main crop: perimeter trap
crop to achieve protection of main plantings. In our studies we employed an artificially high 4:1
ratio and were still unsuccessful from adequately attracting and keeping adults in our perimeter
trap planting and preventing them from significantly damaging broccoli plants in the main crop
planting. Because small emerging Brassica seedlings are extremely susceptible to bagrada bug
feeding, we conclude that in our desert cropping systems, trap cropping is not a viable alternative
Page 94 of 147
Arizona Department of Agriculture
Specialty Crop Block Grant Program
Agreement No. 12-25-B-1655
for managing bagrada bugs on fall brassica crops. Perhaps in areas where lighter pest pressure
occurs, trap cropping may work.
Our final goal was to develop greater knowledge of bagrada bug flight capability and perception
of plant volatiles coming from emergent broccoli and related crops. Because bagrada bug is a
new pest to the western Hemisphere, basic knowledge of its biology is very limited. Although we
were unable to determine flight distance capability of bagrada bug using tethered flight mills, we
were able to generate some important information on how to measure their movement. Following
the mark-release –recapture field studies we quickly realized that the protein markers that have
worked so well with other insects were not adequate for bagrada. We’re not sure why this
technique did not work. However, we discovered a more conventional marking method of using
a Sharpie Marker to place a small identifying mark on the adult thorax can be used to accurately
mark and identify recaptured adults in several retention studies conducted in the lab.
Unfortunately, we were unable to transition this method in the field as we ran out of time this
past fall. We plan to continue these studies next year using this technique.
Beneficiaries The stakeholders who will directly benefit from this project include Arizona cole crop growers,
PCAs, and local Agro-business representatives. Much of the information discussed in this report
has been presented to stakeholders via email updates and presentations at local and statewide
educational meetings. Based on the recipients of our email updates and attendees at meetings, it
is estimated that at more than 50 Arizona PCAs and cole crop growers benefited from the
information generated in this project. Information on host plant selection by bagrada can be
useful to the Arizona vegetable industry by providing for them a basic understanding of the
insects feeding behavior and biology. Also, the demonstration that the Nipsit seed treatments
used in our trap cropping studies lead to other non-project related studies that further showed this
technology could effectively protect broccoli seedlings from heavy bagrada pressure. The
product is now being used by local produce growers. Although we were not able to develop a
trap crop strategy, this is useful information to the industry as it determined that trap cropping is
not an option (many growers assumed it would be) and other non-chemical options will have to
be developed in the future. Finally, the mark-recapture studies do not provide any immediate
information for growers, but from a scientific basis, it provides us researchers with a
conventional technique to study bagrada bug behavior and movement for future landscape
ecological studies.
Lessons Learned From a positive perspective, this project enabled us to develop a rearing technique for bagrada
bugs using information we generated from the host plant selection studies that have not been
reported previously in the scientific literature. Accordingly, we now use these techniques to
maintain colonies for studies used in this project as well as other more basic biological studies
we have been conducting. We also determined that sometimes the best approach to solving a
problem is the simplest approach. An example of this is the lack of success we had using a
complex (and expensive) protein marker too mark bugs with. In contrast, using the Sharpie was
actually much less expensive in time and materials and yielded better results.
Page 95 of 147
Arizona Department of Agriculture
Specialty Crop Block Grant Program
Agreement No. 12-25-B-1655
One unexpected outcome of this trial was how effective the Nipsit (clothianidin treated seed) was
in protecting seedling from bagrada. We included it in our trap crop studies as a comparison to
the insecticide treated canola (which was not effective). Unfortunately, using the Nipsit as a trap
crop was not adequate enough to prevent damage to untreated broccoli or canola. However, as a
consequence of these observations we quickly adapted this seed technology into a management
strategy that is currently being used by AZ growers. It has been estimated that about 25% of the
broccoli acreage in AZ was planted to this treated seed in 2015.
I think the most disappointing outcome of this trial was the lack of response of bagrada bugs to
the trap cropping strategies. Based on everything we knew prior to the project coupled with the
outcomes of host plant preference studies, we felt confident that we could develop a non-
chemical control strategy based simply on attractive perimeter plants. What we didn’t anticipate
was the aggressive nature of this pest and its ability to overwhelm small plot. Future research in
this area should be done on a much larger scale, and even then may not be successful, or perhaps
more importantly, practical.
Contact Person John C. Palumbo, Professor and Extension Specialist, Yuma Agricultural Center
928-782-5885
Additional Information As described above, the information generated from this project has been beneficial to the
industry and the results of this research have been presented in various forms at Extension
meeting and included the 2015 Southwest Ag Summit in Yuma, the 2014 and 2015 Desert Ag
Conference in Phoenix, and the Fall Preseason Vegetable Workshop in Yuma.
Publications Palumbo, J. C. 2015. Bagrada bug management tips on desert cole crops. Veg IPM Update, Vol
6, No. 19, Sep 16, 2015.
http://ag.arizona.edu/crops/vegetables/advisories/more/insect141.html
Palumbo J.C. 2015. Evaluation of Clothianidin Seed Treatments for Bagrada Bug Control in
Broccoli, Veg IPM Update, Vol. 6, No. 15, July 22, 2015
http://ag.arizona.edu/crops/vegetables/advisories/more/insect137.html
Page 96 of 147
APPENDIX A Northern AZ Group GAP Update (Forwarded to AMS, 11/21/2014)
A Group GAP Organizational Meeting
Prescott, Arizona (11/12/2014)
On Wednesday, November 12, 2014, a meeting was held at the University of Arizona Cooperative Extension
Office in Prescott, AZ to discuss the Group GAP Project. The meeting was a follow-up to meetings held in April
and August, 2014 which introduced the concept to a variety of local area groups.
The meeting was chaired by Katrin Themlitz, of Sedona who has been spearheading the project since its
inception. Katrin is the co-founder of the Sedona Farmers Market. The recent meeting was attended by 29
growers and representatives of Yavapai Community College, Orme School, Prescott Farmers Markets, a grower
on the Navajo Nation, many local growers, Yavapai County Health Department, U of A CE Yavapai County, Jeff
Shalau, U of A CE Yuma County, Kurt Nolte, and Arizona Department of Agriculture, Ed Foster and Stewart
Jacobson.
A presentation supporting the program was delivered by Mike O’Connor (grower) of Chino Valley who
provided the benefits of integrating Group GAP into production schemes in the area and highlighted the notion
that Group GAP provides a means for enhancing production coordination among area farmers, allows for
greater internal marketing distribution strategies, generates better profit margins, improves consumer
awareness through localized branding, and increases economic development and excitement for the region.
This is in addition to minimizing microbial contamination risk to the consumer, which is the primary mission of
Group GAP.
Katrin distributed a copy of the Quality Management System (QMS) obtained from Good Natured Family Farms
and explained that Yavapai County growers would use it as a working model when developing the QMS for the
Northern AZ Group.
Of the 24 participants in the meeting, only one was doubtful or negative about the project. The gentleman
expressed concern that, as a one man operation, Group GAP would be too complex and time consuming to
function effectively. The remainder of the participants voiced that Group GAP a worthwhile project to pursue
and would provide many benefits that producers in the region vitally need. Spearheaded by Ms. Themlitz, a
local grower driven, Group GAP Organizing Committee has been assembled. The committee is made up of 5
area growers, a Yavapai County Health Official (Paul Katan), Yuma and Yavapai Extension Educators and
representatives from the Arizona Department of Agriculture. The Northern Arizona Group is now fully
committed to the project’s success and is in the development stages of writing their QMS, assembling a Group
GAP technical committee and discussing the possibility of forming a produce distribution hub.
Katrin’s timeline is to complete a first draft of the QMS document by mid-December which would be
submitted to AMS. Upon subsequent review, a final QMS, individual farm audits leading towards USDA
Page 97 of 147
GHP/GAP certifications would be initiated in late spring, 2015. She expressed interest in organizing another
Group GAP focus meeting in late January to review the project and deliver a progress update. It is anticipated
that the Northern Arizona Group GAP will be a formally functioning body by June, 2015.
The Arizona Department of Agriculture and the University of Arizona will continue to provide external
leadership to move the Group GAP project forward in Northern Arizona, and will begin a campaign to promote
the Group GAP in other regions in the state. Discussions are currently underway to develop and implement a
National Group GAP training program and curricula which would provide similar groups the opportunity to
learn from the success currently being observed in Arizona.
Page 98 of 147
APPENDIX B.1
Northern Arizona Group GAP Quality Management System [QMS) Manual
DRAFT – 01/11/2015
Northern Arizona Group GAP “NAZGGAP”
Group Good Agriculture Procedures and Good Handling Procedures Program
Group GAP Pilot Project Internal Audit Manual
Page 99 of 147

Northern Arizona Group GAP
Group Good Agriculture Procedures and
Good Handling Procedures Program
Group GAP Internal Audit Manual
Table of Contents
General Requirements................................................................................................... Page 5 1. Purpose………………………………………………….…..………………………………………………………. Page 5 2. Auditor Definitions …………………………………………………………………………………………….. Page 6 3. NAZGGAP Internal Auditor Responsibilities…………………………………………………………. Page 7 4. NAZGGAP Internal Auditors Qualification …………………………………………………………… Page 7 5. Internal Auditor Training ………….............................................................................. Page 7 6. How are Internal Audits Conducted ……………………………………………………………………. Page 8 7. Corrective Action – Non-Conformity Issues............................................................. Page 8 8. Producer Training …….......…….................................................................................. Page 10 9. Documents and Record Keeping.............................................................................. Page 10 10. External Audits …………………………………………………………………………………………………… Page 11 11. NAZGGAP Program Guidelines …………………………………………………………………………… Page 11
Page 100 of 147
Northern Arizona Group GAP
Group Good Agriculture Procedures and
Good Handling Procedures Program
Quality Assurance & Quality Control Manual
General Requirements: The Northern Arizona Group GAP alliance members (NAZGGAP) Good Agriculture Procedures and Good Handling Procedures (GAP/GHP) Program addresses the constant challenge for the alliance's fruits, vegetables and tree nut producers to grow healthy products safely and responsibly. Increased pressures from consumers, retailers and legislation have placed new demands on growers and farmers. Farmers and growers are required more and more to use production techniques that reduce the impact of farming on the environment, to reduce their use of chemicals, and to make efficient use of natural resources, while safeguarding the welfare of both workers and farm animals. Since its inception NAZGGAP has been able to demonstrate a commitment to good agricultural farming practices which - nowadays, has become essential for accessing the market, particularly the local food market. NAZGGAP has adopted in its good agricultural farming practices the W. K. Kellogg Foundation's definition for good food: healthy, green, fair and affordable. Good food that is:
Healthy - promotes the physical, mental and spiritual wellbeing of individuals, families and communities.
Green - produced in a manner that maintains or improves the quality of land, water, air and other ecological factors.
Fair - minimizes the chance that anyone along the production line was exploited for its creation. Affordable - priced so that people of all socioeconomic backgrounds are able to purchase it and have
access to it.
NAZGGAP also has adopted the US Department of Agriculture' Agriculture Marketing Services Group Good Agriculture Procedures and Good Handling Procedures Audit Program, and developed its own program hereby outlined. NAZGGAP Group Good Agriculture Procedures and Good Handling Procedures Audit Program ensures the overall extraordinary intention of small local family farms to assure food safety from farm to retailer and from farm to consumer. NAZGGAP’s program demonstrates to customers (retailers, food services providers and consumers) that NAZGGAP products are grown utilizing good agricultural farming practices. The Group GAP/GHP program inspires consumer confidence, ensures access to new markets and enhances operating efficiency and competitive market appeal. Furthermore, the Group GAP/GHP program creates opportunities to implement processes for continual improvement; and quite importantly reduces the number of second party audit or inspections to farms. 1. Purpose: 1.1 This document outlines the general requirements of NAZGGAP’s Group Good Agriculture Procedures
and Good Handling Procedures.
Page 101 of 147
1.2 The specific NAZGGAP/USDA Group GAP/GHP program requirements must be met through an approved NAZGGAP Group GAP/GHP Internal Audit Program.
1.3 The requirements of the NAZGGAP member Internal Audit Program are defined in USDA Group GAP/GHP Audit Program.
1.4 The USDA Group GAP/GHP Audit Program ensures that the specific program requirements are supported by a documented USDA Group GAP/GHP Audit checklist. The USDA Group GAP/GHP Audit Program is a voluntary audit program.
1.5 The USDA Group GAP/GHP Audit Program is available to NAZGGAP alliance members. Services are provided by NAZGGAP and USDA AMS Group GAP/GHP Audit Program.
2. Auditor Definitions: 2.1. Approved Internal Auditor: Any internal auditor or auditing entity meeting all requirements of the
NAZGGAP program deems internal auditors approved who work under an approved documented program that addresses the requirements of USDA AMS GAP/GHP Audit Program and upon successful completion of an audit by USDA or by USDA, AMS Recognized Auditors.
2.2. Approval Auditor Authority: USDA-AMS Group GAP/GHP Audit Program will have the authority to approve, deny or suspend approval in accordance with the USDA-AMS Group GAP/GHP Audit Program guidelines.
2.3 Internal Auditor Conflict of Interest: No direct buyer may conduct internal audit. Direct procurement
is defined as a buyer purchasing directly from a producer or a distribution or packing facility.
2.4 Internal Auditor Proficiency Testing: Approved Internal Auditor must have a professional background in the food industry or related audit experience, must satisfactorily complete Cornell University GAP/GHP training program, and participate - as an observer, on audits with a lead approved auditor.
Page 102 of 147
Standard Operating Procedures for NAZGGAP USDA/AMS GAP/GHP Internal Audits
3. NAZGGAP Internal Auditor Responsibilities: NAZGGAP Internal Auditor must follow the policies and procedures outlined in the Procedure, NAZGGAP Quality GAP Verification Programs General Policies and Procedures, in addition to the following:
1. NAZGGAP Internal Auditor must conduct an internal audit annually and supply the results of internal audit to NAZGGAP project director who will compile the group results and submit to the USDA Agriculture Marketing Services, prior to its anniversary date listed on the USDA web site.
2. Internal auditors must review all relevant, appropriate and applicable activities within the scope of the USDA Group GAP/GHP Audit Program as agreement between USDA AMS and NAZGGAP. Internal Audit can be performed by the NAZGGAP internal auditor or by an approved outside agency.
3. Staying current on USDA GAP audit check list and score sheet. 4. Completing a minimum of one continuing education class, conference, or workshop on food
safety. 5. Abide by "NAZGGAP Internal Audit On-Farm Guidance and Code of Conduct" attached. 6. If announced, notifying the farm operator, to determine farm location and date and time of
the audit. 7. It is the internal auditors' responsibility to make sure that the farm is in production and/or
processing of the products being requested for certification. 8. If an internal auditor has questions; contact one of the NAZGGAP project directors and/or
USDA AMS GAP/GHP for clarification. 9. NAZGGAP internal auditor credential and training must be in accordance with the proficiency
testing set above on Definitions section of this document.
4. Who Conducts the Internal Audit?
1. NAZGGAP will appoint qualified internal auditors to conduct comprehensive Group GAP/GHP on all Members of the NAZGGAP alliance.
2. Internal auditors will meet the requirements as established by NAZGGAP and approved by USDA AMS GAP/GHP defined in 3.0 - 3.6.
3. Internal Auditor Conflict of Interest: No direct buyer may conduct internal audit. Direct procurement is defined as a buyer purchasing directly from a producer or a distribution or packing facility.
4. See list below of NAZGGAP Internal Auditors and Qualifications.
5. How are the Internal Auditors Trained? 5.1 Internal Auditor will:
a) have a background in the food safety industry, or related science or agriculture field,
b) or have a background as an experienced auditor in a related field.
Page 103 of 147
c) complete Cornell University GAP/GHP on-line training program as soon as it is available for enrollment
d) participate - as an observer on a minimum of (2) audits with a lead approved auditor.
List Location and Dates of Internal Auditor Training: (TO BE FILLED IN ….)
6. How are Internal Audits Conducted?
1. NAZGGAP auditor will conduct internal Group GAP/GHP once a year on the NAZGGAP alliance members utilizing the most current USDA Audit Verification Checklist Spreadsheet.
2. The farm will be actively producing and processing the product(s) identified for USDA GAP certification.
3. The internal auditor will conduct a comprehensive audit of each participating farm and evaluate them based on the USDA AMS GAP/GHP Audit and corresponding score sheet.
4. Additional audits (announced and/or unannounced) may be warranted and conducted randomly by internal auditors.
5. Internal Auditors will follow internal auditor responsibilities as outlined in 3.0 - 3.6. 6. The USDA AMS GAP/GHP 2011 Audit Check List will be used to conduct internal audits. See
Attached. 7. Corrective Action - Non-Conformity Issues
1. NAZGGAP internal auditor will utilize USDA GAP/GHP non-conformance form as guideline to address non-conformity issues.
2. NAZGGAP internal auditor will identify non-conformity issues and provide guidance for mitigating and/or correcting the issue.
3. A notice of non-conformance will be delivered in writing to the farmer and require a time response in accordance to severity.
4. NAZGGAP internal auditors will require from the farmer a corrective action plan to correct deficiencies encountered during the internal audit and request the farmer to provide a timetable to address all deficiencies.
Page 104 of 147
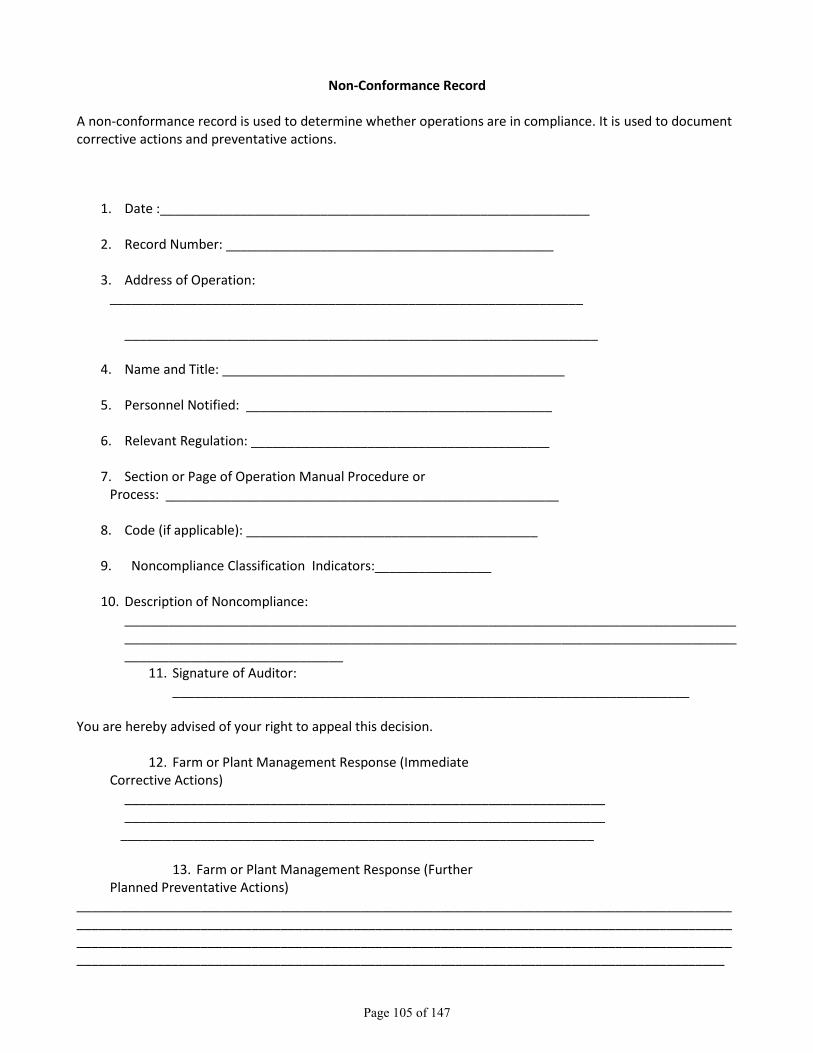
Non-Conformance Record A non-conformance record is used to determine whether operations are in compliance. It is used to document corrective actions and preventative actions.
1. Date :___________________________________________________________
2. Record Number: _____________________________________________
3. Address of Operation: _________________________________________________________________ _________________________________________________________________
4. Name and Title: _______________________________________________
5. Personnel Notified: __________________________________________
6. Relevant Regulation: _________________________________________
7. Section or Page of Operation Manual Procedure or Process: ______________________________________________________
8. Code (if applicable): ________________________________________
9. Noncompliance Classification Indicators:________________
10. Description of Noncompliance: ______________________________________________________________________________________________________________________________________________________________________________________________________
11. Signature of Auditor: _______________________________________________________________________
You are hereby advised of your right to appeal this decision.
12. Farm or Plant Management Response (Immediate Corrective Actions)
__________________________________________________________________ __________________________________________________________________ _________________________________________________________________
13. Farm or Plant Management Response (Further
Planned Preventative Actions) _______________________________________________________________________________________________________________________________________________________________________________________________________________________________________________________________________________________________________________________________________________________________________
Page 105 of 147
This document serves as written notification of your failure to comply with regulatory requirement(s) and could result in additional regulatory or administrative action.
Signature of Farm or Plant Owner or Person in Charge:
________________________________________________
Signature of Auditor ________________________________________________ 8. GAP/GHP Grower-Producers Training: NAZGGAP GAP/GHP Producers Training for Alliance Farms: NAZGGAP has implemented a comprehensive GAP/GHP training for members of the NAZGGAP alliance. Each alliance farm must become GAP/GHP certified to keep a good standing as alliance member. Each farm member of NAZGGAP alliance must have GAP/GHP training. Refresher GAP/GHP training will be conducted annually. Each individual farmer is responsible for preparing and maintaining his/her GAP/GHP Farm Notebook in accordance with NAZGGAP GAP/GHP Manual and USDA AMS GAP/GHP requirements. NAZGGAP internal auditor will conduct annual audits of each farm alliance member. USDA AMS GAP program auditors will conduct an audit of NAZGGAP in accordance to Group GAP/GHP Program and will randomly select farms to perform full audits of a percentage of the total participating alliance members. A list of all producers trained in NAZGGAP GAP program is kept on file. GAP Training Workshops:
(dates to be filled in) 9. How are Documents and Records controlled (Master copy)? Location of Hard Copy: SCFM 2675 W SR 89A, 1164, Sedona AZ 86336 Computer Electronic Copy: SCFM 2675 W SR 89A, 1164, Sedona AZ 86336 or a place agreed upon by alliance members and disclosed and registered with USDA AMS. List of Controlled Documents and Records: 1. Copy of one sample notebook from each community 2. Copy of all internal audits scanned in electronic form 3. Copy of all internal audit results scanned in electronic form. 4. Copy of names and locations of each farm in the Group GAP in electronic form.
5. Copy of all non-conformance notices issued and corrective and preventative measures taken to correct noncompliance in electronic form.
6. Copy of updated internal audit manual in electronic form.
NAZGGAP has developed a series of documents instrumental to provide quality assurance and quality control while conducting internal audits. Most importantly, NAZGGAP internal auditors utilize the same tools (the
Page 106 of 147
most recent USDA Audit Verification Checklist Spreadsheet) used by the USDA GAP/GHP auditors to insure the same criteria while evaluating a farm under this program. The following documents are used and/or reviewed by NAZGGAP internal auditors:
- NAZGGAP Group Good Agriculture Procedures and Good Handling Training Manual - NAZGGAP Group Good Agriculture Procedures and Good Handling Standard Operating Procedure - Current USDA Audit Verification Checklist Spreadsheet - NAZGGAP Group GAP/GHP Visit Verification - Non-Conformance Form - NAZGGAP GAP/GHP Farmer Notebook
Program Documentation
Reference documents and records prepared and maintained by NAZGGAP that describe and record the relevant procedures that conform to the internal audit requirements are maintained for two years. This documentation is in the form of a well-defined quality manual, including controlled program documents and records that meet all program requirements. NAZGGAP GAP/GHP Farmer Notebook will be prepared and maintained by each farmer. Program documentation hard-copies and electronic files are kept in controlled locations. Files are stored at SCFM 2675 W SR 89A, 1164, Sedona AZ 86336 and at the home office of Katrin Themlitz located in Sedona AZ or a location agreeable to alliance members (decided by April 2015).
10. USDA/AMS GAP/GHP External Audits: NAZGGAP Group GAP/GHP Audit Program is audited at least every two (2) years. More frequent audits may be conducted if either numerous minor non-conformances or a major non-conformance are identified during an audit. External Audits are conducted by the USDA AMS Group GAP/GHP Audit Program. 11. NAZGGAP GAP/GHP Program Guidelines: Program Guidelines were developed by NAZGGAP Directors and their Committee in close coordination with USDA Group GAP/GHP Audit Program staff. Future changes to these programs will occur as necessary. NAZGGAP will maintain complete records demonstrating conformance with the NAZGGAP Group Good Agriculture Procedures and Good Handling Procedures Program. Records should be maintained for a minimum of two (2) years. NAZGGAP will notify the USDA Agriculture Marketing Services of any significant changes in the NAZGGAP Group Good Agriculture Procedures and Good Handling Procedures Program. Depending on the nature of the significant change, it may be subject to approval prior to implementation. NAZGGAP Designated Internal Auditors for 2015 NAZGGAP shall identify personnel as lead internal auditors by April 2015 and name them here: NAZGGAP shall identify the following personnel as on-training internal auditors by April 2015 and name them here:
Page 107 of 147
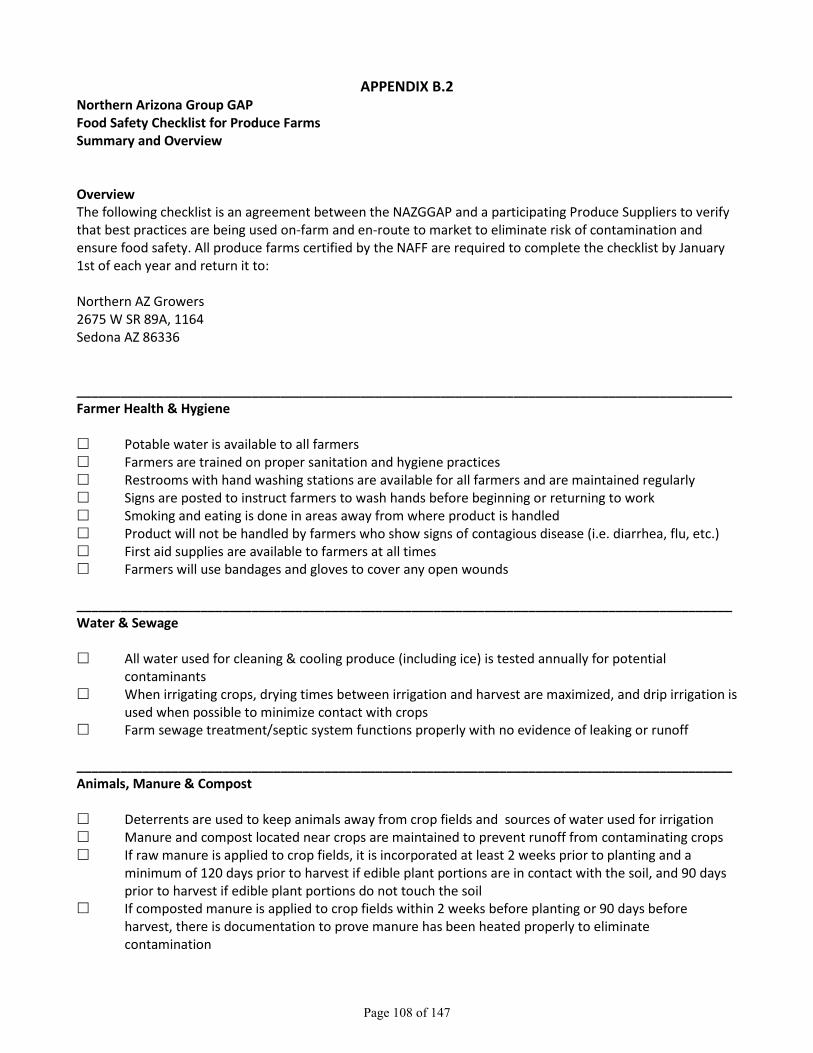
APPENDIX B.2 Northern Arizona Group GAP Food Safety Checklist for Produce Farms Summary and Overview Overview The following checklist is an agreement between the NAZGGAP and a participating Produce Suppliers to verify that best practices are being used on-farm and en-route to market to eliminate risk of contamination and ensure food safety. All produce farms certified by the NAFF are required to complete the checklist by January 1st of each year and return it to: Northern AZ Growers 2675 W SR 89A, 1164 Sedona AZ 86336 __________________________________________________________________________________________ Farmer Health & Hygiene Potable water is available to all farmers Farmers are trained on proper sanitation and hygiene practices Restrooms with hand washing stations are available for all farmers and are maintained regularly Signs are posted to instruct farmers to wash hands before beginning or returning to work Smoking and eating is done in areas away from where product is handled Product will not be handled by farmers who show signs of contagious disease (i.e. diarrhea, flu, etc.) First aid supplies are available to farmers at all times Farmers will use bandages and gloves to cover any open wounds __________________________________________________________________________________________ Water & Sewage All water used for cleaning & cooling produce (including ice) is tested annually for potential
contaminants When irrigating crops, drying times between irrigation and harvest are maximized, and drip irrigation is
used when possible to minimize contact with crops Farm sewage treatment/septic system functions properly with no evidence of leaking or runoff __________________________________________________________________________________________ Animals, Manure & Compost Deterrents are used to keep animals away from crop fields and sources of water used for irrigation Manure and compost located near crops are maintained to prevent runoff from contaminating crops If raw manure is applied to crop fields, it is incorporated at least 2 weeks prior to planting and a
minimum of 120 days prior to harvest if edible plant portions are in contact with the soil, and 90 days prior to harvest if edible plant portions do not touch the soil
If composted manure is applied to crop fields within 2 weeks before planting or 90 days before harvest, there is documentation to prove manure has been heated properly to eliminate contamination
Page 108 of 147
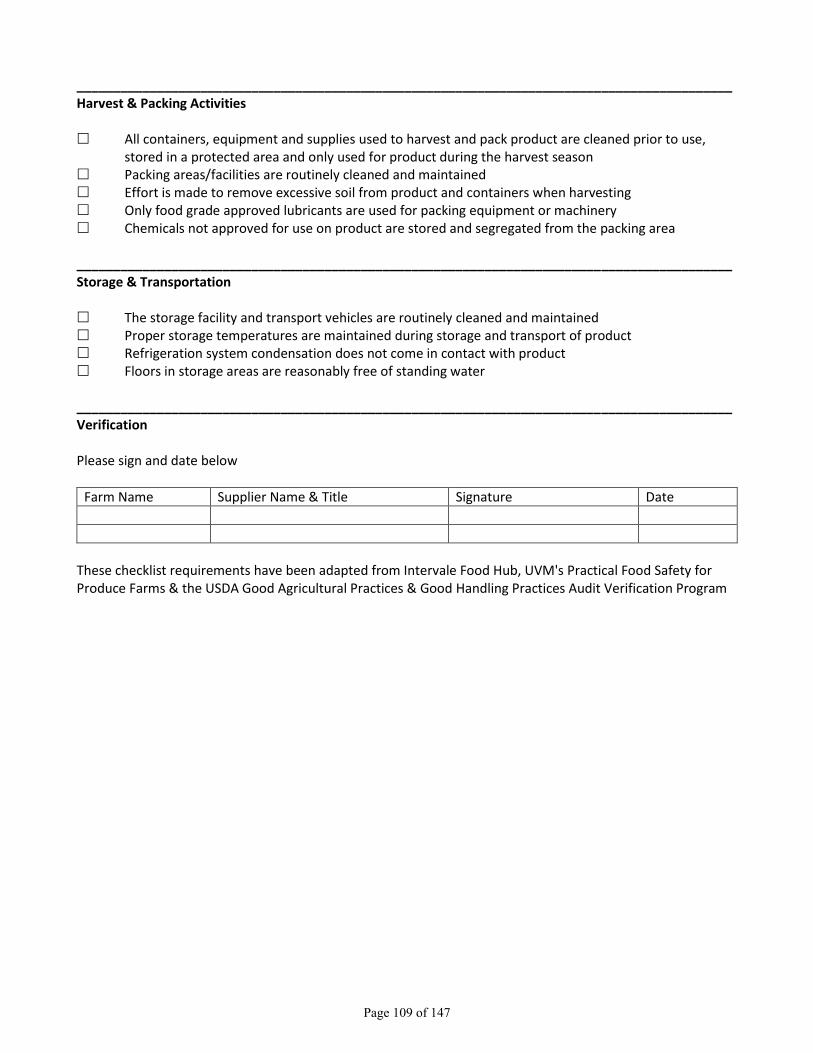
__________________________________________________________________________________________ Harvest & Packing Activities All containers, equipment and supplies used to harvest and pack product are cleaned prior to use,
stored in a protected area and only used for product during the harvest season Packing areas/facilities are routinely cleaned and maintained Effort is made to remove excessive soil from product and containers when harvesting Only food grade approved lubricants are used for packing equipment or machinery Chemicals not approved for use on product are stored and segregated from the packing area __________________________________________________________________________________________ Storage & Transportation The storage facility and transport vehicles are routinely cleaned and maintained Proper storage temperatures are maintained during storage and transport of product Refrigeration system condensation does not come in contact with product Floors in storage areas are reasonably free of standing water __________________________________________________________________________________________ Verification Please sign and date below
Farm Name Supplier Name & Title Signature Date
These checklist requirements have been adapted from Intervale Food Hub, UVM's Practical Food Safety for Produce Farms & the USDA Good Agricultural Practices & Good Handling Practices Audit Verification Program
Page 109 of 147
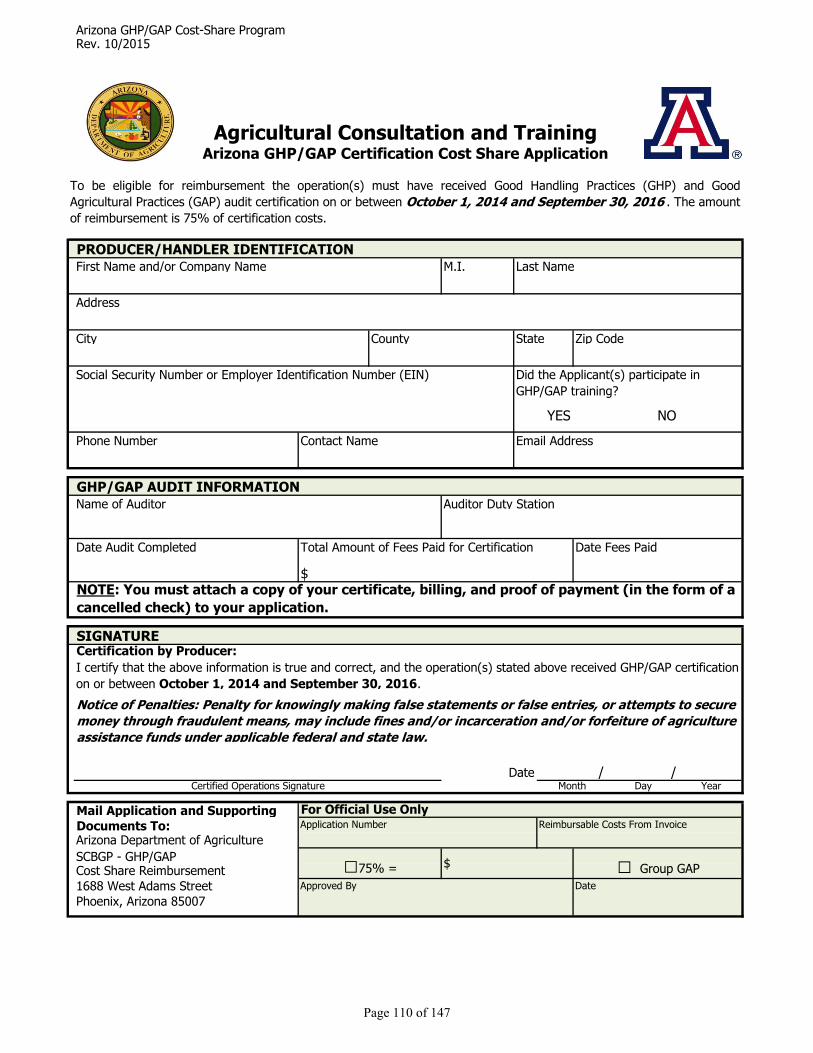
Arizona GHP/GAP Cost-Share ProgramRev. 10/2015
M.I.
State
Social Security Number or Employer Identification Number (EIN)
NO
Total Amount of Fees Paid for Certification
Date /Day
Arizona Department of Agriculture
Phoenix, Arizona 85007
SIGNATURECertification by Producer:
Certified Operations Signature
SCBGP - GHP/GAPCost Share Reimbursement
1688 West Adams Street
□75% = $ □ Group GAP
Agricultural Consultation and Training
PRODUCER/HANDLER IDENTIFICATION
NOTE: You must attach a copy of your certificate, billing, and proof of payment (in the form of a
cancelled check) to your application.
I certify that the above information is true and correct, and the operation(s) stated above received GHP/GAP certification
on or between October 1, 2014 and September 30, 2016.
Notice of Penalties: Penalty for knowingly making false statements or false entries, or attempts to secure
money through fraudulent means, may include fines and/or incarceration and/or forfeiture of agriculture
assistance funds under applicable federal and state law.
Mail Application and Supporting
First Name and/or Company Name
Address
City
Last Name
Auditor Duty Station
Documents To:
County
Phone Number
Did the Applicant(s) participate in
GHP/GAP training?
Zip Code
Approved By Date
GHP/GAP AUDIT INFORMATIONName of Auditor
YES
Date Fees Paid
Arizona GHP/GAP Certification Cost Share Application
Reimbursable Costs From InvoiceApplication Number
/Month Year
Contact Name
To be eligible for reimbursement the operation(s) must have received Good Handling Practices (GHP) and Good
Agricultural Practices (GAP) audit certification on or between October 1, 2014 and September 30, 2016 . The amount
of reimbursement is 75% of certification costs.
Email Address
Date Audit Completed
$
For Official Use Only
Page 110 of 147
Page 111 of 147
Page 112 of 147
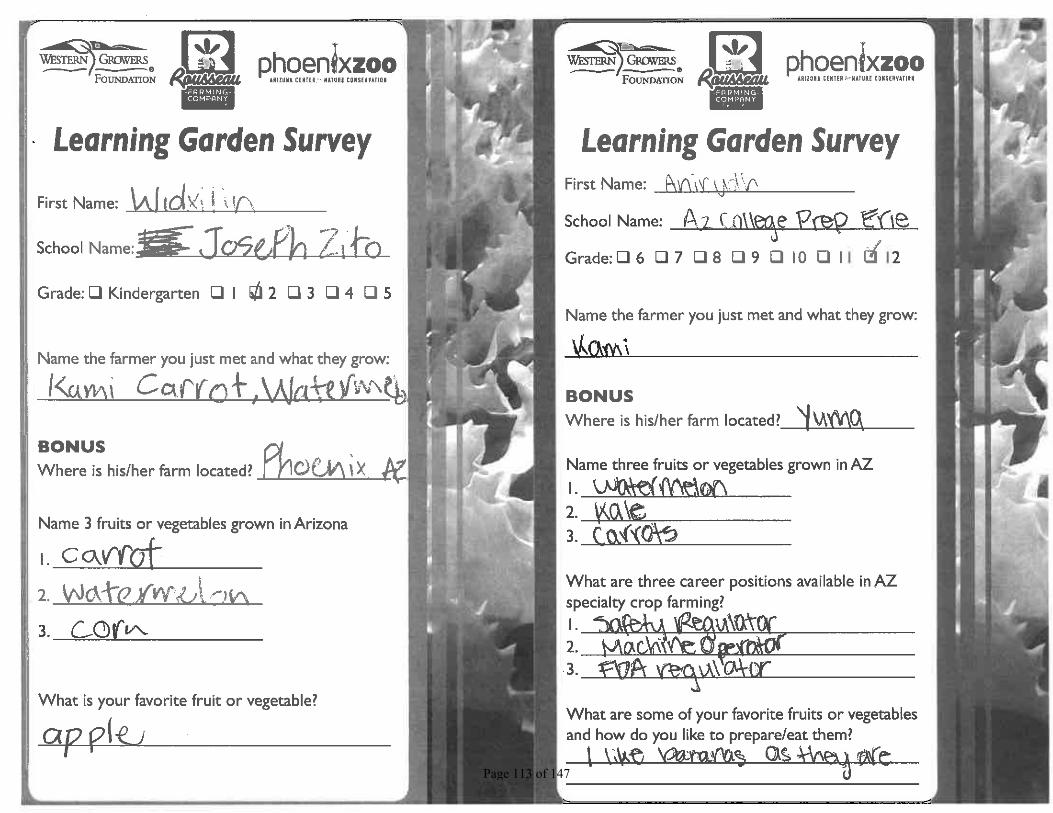
Page 113 of 147
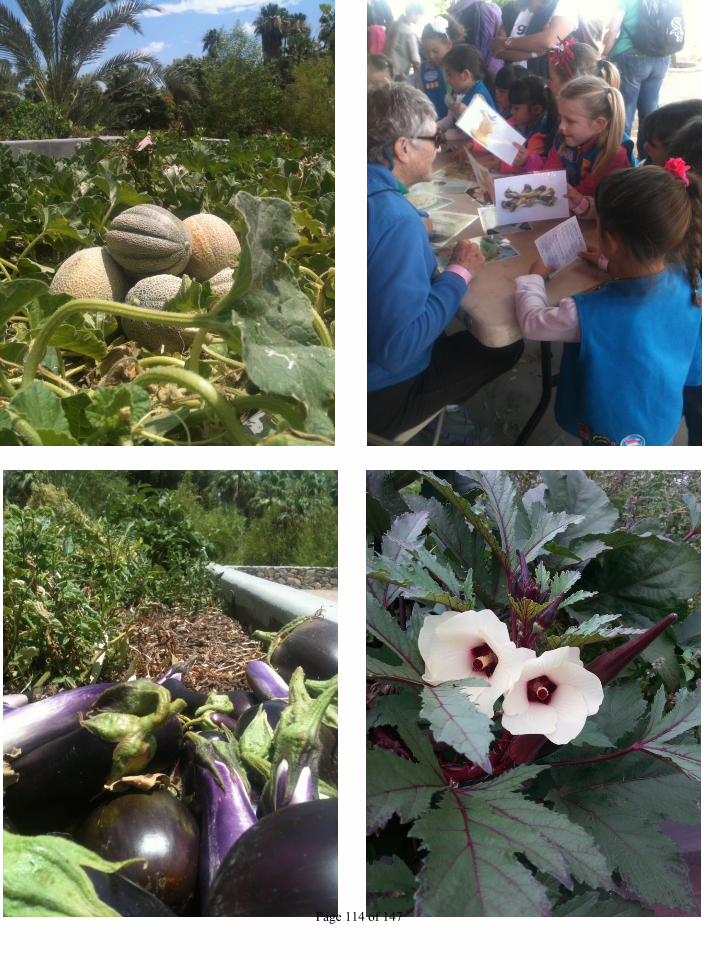
Page 114 of 147
2013 Arizona Agricultural Literacy Days Survey Analysis
A digital version of the recently published book, Arizona Agriculture: Bee's Amazing Adventure,
was read by volunteers to elementary-school-aged children during the fall of 2013 as part of
Arizona Agricultural Literacy Days, an event organized by the Agricultural Literacy Program
through The University of Arizona College of Agriculture and Life Sciences Cooperative
Extension. This is the first children’s book that focuses entirely on Arizona’s unique agriculture
and specifically identified specialty crops. Immediately before the book was read, students were
asked 14 questions regarding their knowledge of specialty crops grown in Arizona and their
consumption of certain specialty crops. These questions were asked of the classroom as a whole
and responses were given by a raise of hands which was recorded. The 14 questions were asked
again approximately one week later.
In addition to reading the book, volunteers were responsible for asking the pre-questions and
recording the responses. Teachers were responsible for asking the post-questions and providing
demographic data.
Demographics: All data was obtained through the 2013 Arizona Agricultural Literacy Days which is held
annually in the fall with emphasis on the three days before Thanksgiving. The opportunity to
volunteer as a reader was announced through various emails and Listservs. A total of 25 people
volunteered and registered to visit 90 classrooms. Of the 25 volunteers, 22 provided pre-question
data for 75 classrooms (an 88.0% response rate for 83.3% of the classrooms). Much of the data
had errors, namely missing data or calculation errors; therefore, data for 45 classrooms were
discarded and 30 were retained (40.0% retention rate). Of the 90 classrooms, 53 teachers
provided post question and demographic data (58.9% response rate). Of these 53 classrooms,
data from 44 classrooms were retained (83.0% retention rate), 9 of which were discarded for
missing data and calculation errors.
From the 44 classrooms, there were a total of 1,124 students who participated, averaging 26
students per classroom. Four kindergarten classes totaled 117 students. Seven first-grade classes
totaled 162 students. Nine second-grade classes totaled 205 students. Nine third-grade classes
totaled 218 students. Thirteen fourth-grade classes totaled 354 students. Two sixth-grade classes
totaled 68 students. Assuming all 90 classrooms were visited, the 2013 AZ Ag Lit Days reached
approximately 2,340 students. Race/Ethnicity and gender are broken down in the following table.
Page 115 of 147
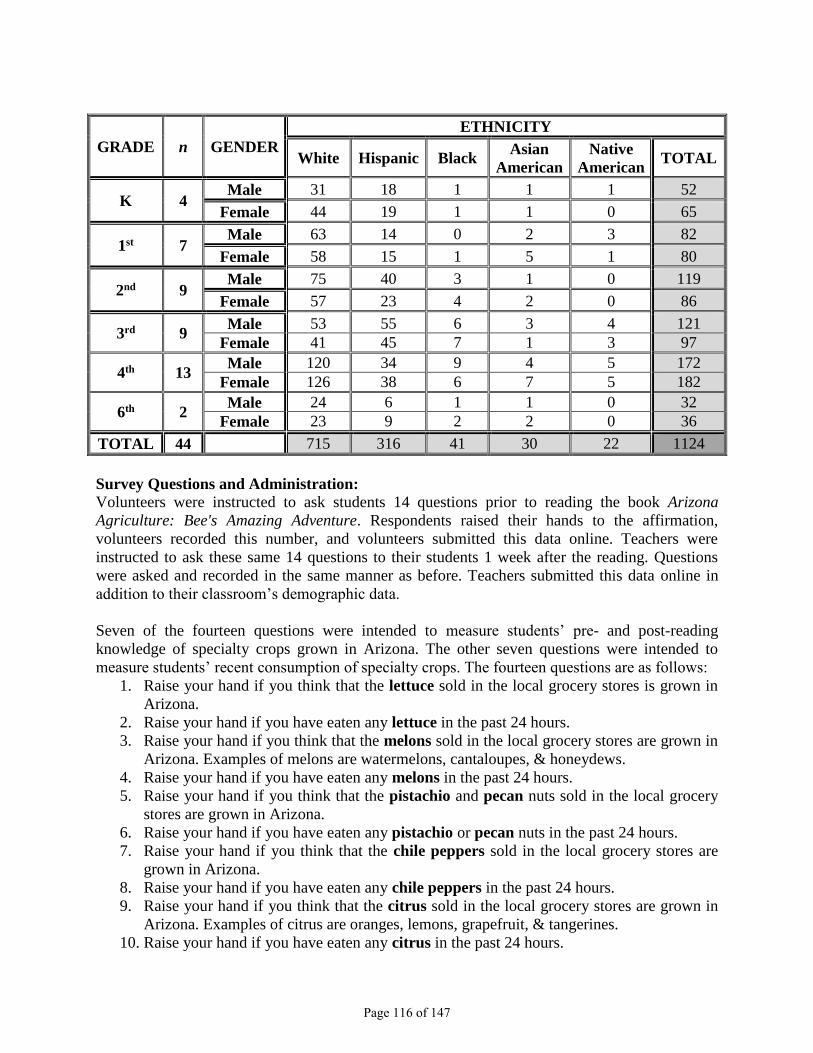
GRADE n GENDER
ETHNICITY
White Hispanic Black Asian
American
Native
American TOTAL
K 4 Male 31 18 1 1 1 52
Female 44 19 1 1 0 65
1st 7 Male 63 14 0 2 3 82
Female 58 15 1 5 1 80
2nd 9 Male 75 40 3 1 0 119
Female 57 23 4 2 0 86
3rd 9 Male 53 55 6 3 4 121
Female 41 45 7 1 3 97
4th 13 Male 120 34 9 4 5 172
Female 126 38 6 7 5 182
6th 2 Male 24 6 1 1 0 32
Female 23 9 2 2 0 36
TOTAL 44 715 316 41 30 22 1124
Survey Questions and Administration:
Volunteers were instructed to ask students 14 questions prior to reading the book Arizona
Agriculture: Bee's Amazing Adventure. Respondents raised their hands to the affirmation,
volunteers recorded this number, and volunteers submitted this data online. Teachers were
instructed to ask these same 14 questions to their students 1 week after the reading. Questions
were asked and recorded in the same manner as before. Teachers submitted this data online in
addition to their classroom’s demographic data.
Seven of the fourteen questions were intended to measure students’ pre- and post-reading
knowledge of specialty crops grown in Arizona. The other seven questions were intended to
measure students’ recent consumption of specialty crops. The fourteen questions are as follows:
1. Raise your hand if you think that the lettuce sold in the local grocery stores is grown in
Arizona.
2. Raise your hand if you have eaten any lettuce in the past 24 hours.
3. Raise your hand if you think that the melons sold in the local grocery stores are grown in
Arizona. Examples of melons are watermelons, cantaloupes, & honeydews.
4. Raise your hand if you have eaten any melons in the past 24 hours.
5. Raise your hand if you think that the pistachio and pecan nuts sold in the local grocery
stores are grown in Arizona.
6. Raise your hand if you have eaten any pistachio or pecan nuts in the past 24 hours.
7. Raise your hand if you think that the chile peppers sold in the local grocery stores are
grown in Arizona.
8. Raise your hand if you have eaten any chile peppers in the past 24 hours.
9. Raise your hand if you think that the citrus sold in the local grocery stores are grown in
Arizona. Examples of citrus are oranges, lemons, grapefruit, & tangerines.
10. Raise your hand if you have eaten any citrus in the past 24 hours.
Page 116 of 147
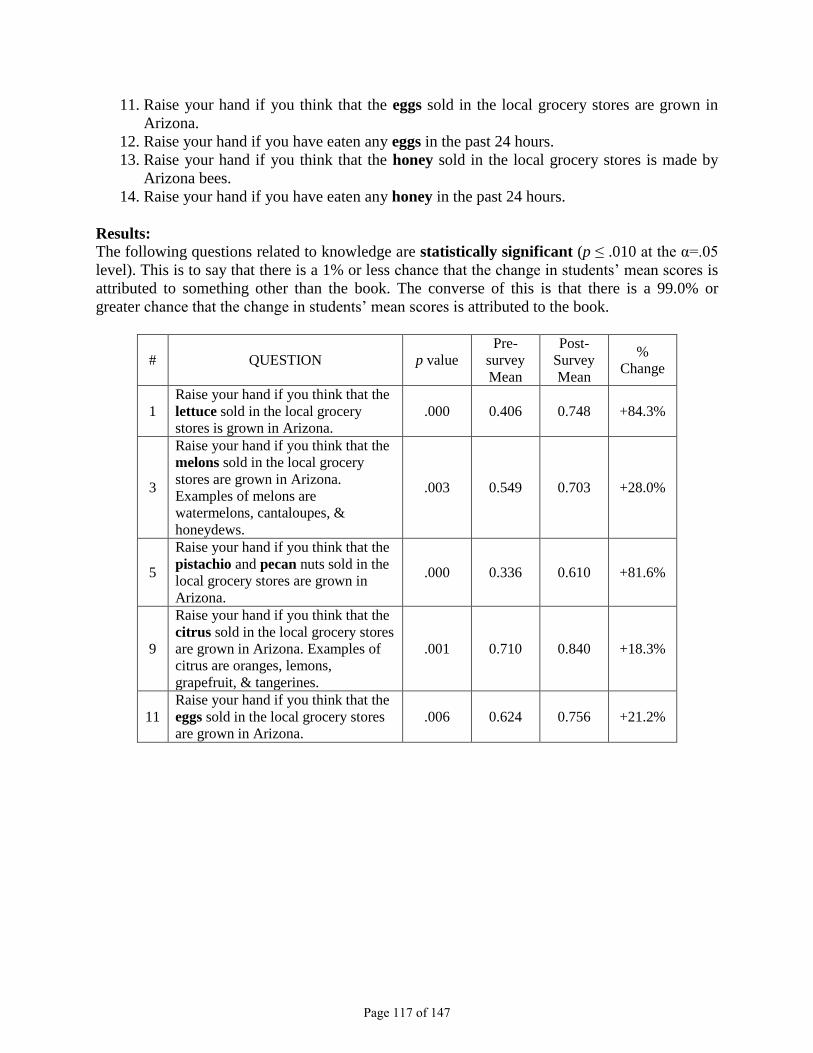
11. Raise your hand if you think that the eggs sold in the local grocery stores are grown in
Arizona.
12. Raise your hand if you have eaten any eggs in the past 24 hours.
13. Raise your hand if you think that the honey sold in the local grocery stores is made by
Arizona bees.
14. Raise your hand if you have eaten any honey in the past 24 hours.
Results: The following questions related to knowledge are statistically significant (p ≤ .010 at the α=.05
level). This is to say that there is a 1% or less chance that the change in students’ mean scores is
attributed to something other than the book. The converse of this is that there is a 99.0% or
greater chance that the change in students’ mean scores is attributed to the book.
# QUESTION p value
Pre-
survey
Mean
Post-
Survey
Mean
%
Change
1
Raise your hand if you think that the
lettuce sold in the local grocery
stores is grown in Arizona.
.000 0.406 0.748 +84.3%
3
Raise your hand if you think that the
melons sold in the local grocery
stores are grown in Arizona.
Examples of melons are
watermelons, cantaloupes, &
honeydews.
.003 0.549 0.703 +28.0%
5
Raise your hand if you think that the
pistachio and pecan nuts sold in the
local grocery stores are grown in
Arizona.
.000 0.336 0.610 +81.6%
9
Raise your hand if you think that the
citrus sold in the local grocery stores
are grown in Arizona. Examples of
citrus are oranges, lemons,
grapefruit, & tangerines.
.001 0.710 0.840 +18.3%
11
Raise your hand if you think that the
eggs sold in the local grocery stores
are grown in Arizona.
.006 0.624 0.756 +21.2%
Page 117 of 147
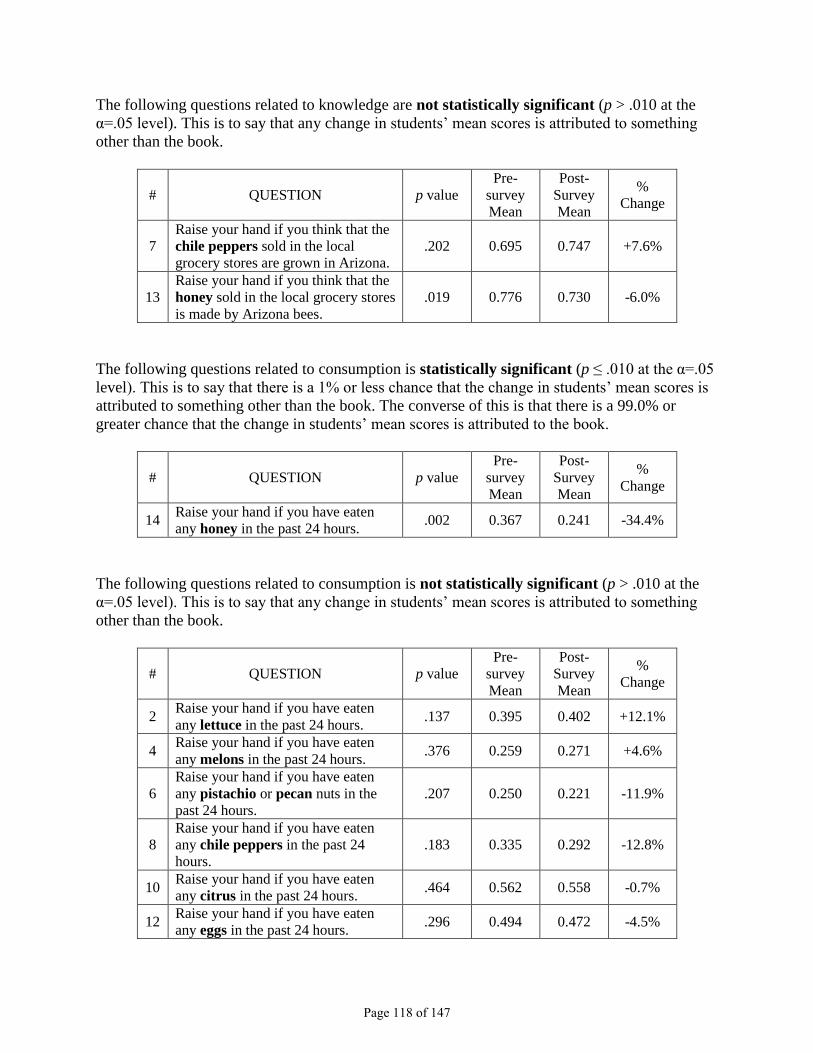
The following questions related to knowledge are not statistically significant (p > .010 at the
α=.05 level). This is to say that any change in students’ mean scores is attributed to something
other than the book.
# QUESTION p value
Pre-
survey
Mean
Post-
Survey
Mean
%
Change
7
Raise your hand if you think that the
chile peppers sold in the local
grocery stores are grown in Arizona.
.202 0.695 0.747 +7.6%
13
Raise your hand if you think that the
honey sold in the local grocery stores
is made by Arizona bees.
.019 0.776 0.730 -6.0%
The following questions related to consumption is statistically significant (p ≤ .010 at the α=.05
level). This is to say that there is a 1% or less chance that the change in students’ mean scores is
attributed to something other than the book. The converse of this is that there is a 99.0% or
greater chance that the change in students’ mean scores is attributed to the book.
# QUESTION p value
Pre-
survey
Mean
Post-
Survey
Mean
%
Change
14 Raise your hand if you have eaten
any honey in the past 24 hours. .002 0.367 0.241 -34.4%
The following questions related to consumption is not statistically significant (p > .010 at the
α=.05 level). This is to say that any change in students’ mean scores is attributed to something
other than the book.
# QUESTION p value
Pre-
survey
Mean
Post-
Survey
Mean
%
Change
2 Raise your hand if you have eaten
any lettuce in the past 24 hours. .137 0.395 0.402 +12.1%
4 Raise your hand if you have eaten
any melons in the past 24 hours. .376 0.259 0.271 +4.6%
6
Raise your hand if you have eaten
any pistachio or pecan nuts in the
past 24 hours.
.207 0.250 0.221 -11.9%
8
Raise your hand if you have eaten
any chile peppers in the past 24
hours.
.183 0.335 0.292 -12.8%
10 Raise your hand if you have eaten
any citrus in the past 24 hours. .464 0.562 0.558 -0.7%
12 Raise your hand if you have eaten
any eggs in the past 24 hours. .296 0.494 0.472 -4.5%
Page 118 of 147
Conclusion:
Five of the seven questions related to knowledge regarding specialty crops (1, 3, 5, 9, & 11) were
statistically significant. This means that 1) the students as a whole were better able to answer
these five questions more correctly, that 2) this increased ability was substantial, and that 3) their
ability to do so is due to what they learned from the book.
With regards to questions 7 & 13 related to knowledge about chile peppers and honey, a high
percentage of students correctly answered these questions on the pre-survey indicating a high
initial knowledge. Statistically speaking, the difference between the pre- and post-means scores
are non-existent. Since the mean scores were so high, it is reasonable to conclude that there was
little room for knowledge increase among the students as a whole.
Questions 2, 4, 6, 8, 10, 12, and 14 all attempted to measure students’ consumption of specialty
crops. A limiting factor in this measurement is that students have very little decision making in
what food is brought into the home. This is more of a function of the eating habits of the adults
in their lives. It is conceivable that students’ desire to eat specialty crop foods did increase, but
that these foods were not made available to the students.
With regards to question 14 related to honey consumption, it was not expected that students’
report would be significantly less. This result may give more credence to the limitations of the
study’s design. Answering questions in a group has a high tendency for social conformity.
Meaning, if individuals are aware that their answer is different than a large enough number of
peers, then that person may be influenced to change his/her answer to be more similar to the
group at large. Furthermore, there is also a tendency in youth to provide answers similar to their
friends. These factors may have been highly present for question 14.
Further research is needed to accurately measure a change in students’ consumption of specialty
crops and food in general. Additionally, the limitations of this study’s design indicates the need
for further research to ascertain how influential the book is at increasing students’ knowledge
about Arizona’s specialty crops. Results from this study indicate that there may be a positive
influence and can be beneficial to students’ education.
Page 119 of 147
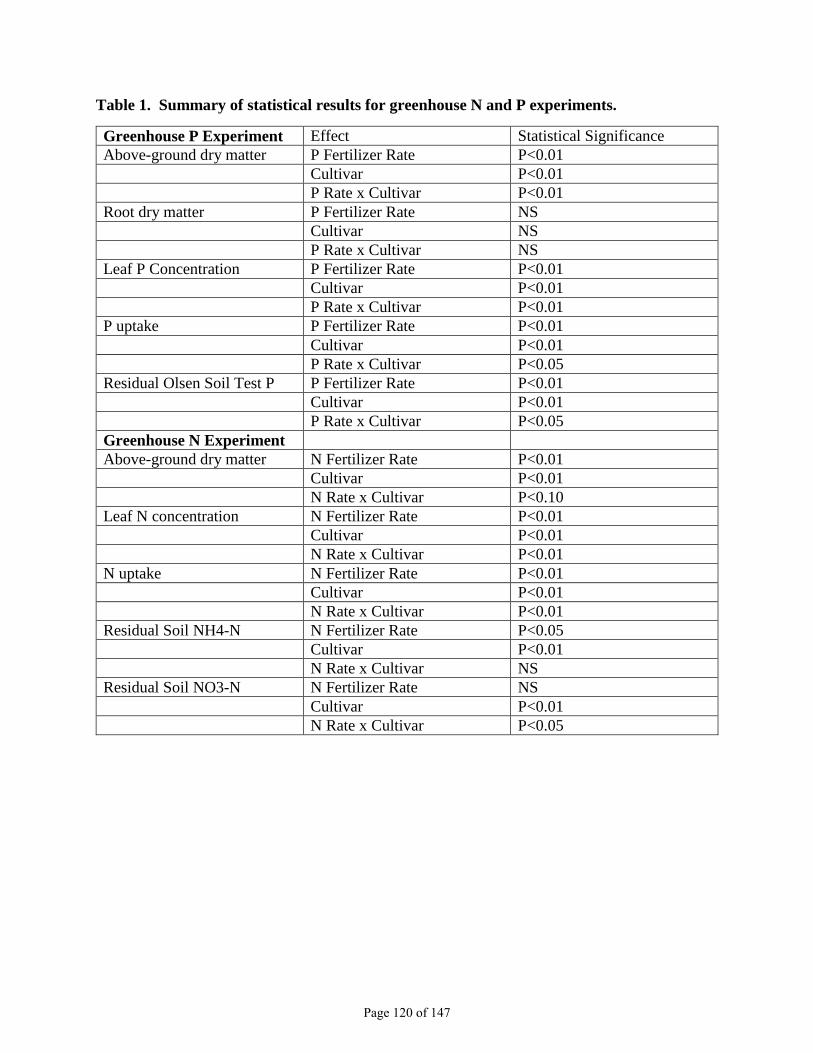
Table 1. Summary of statistical results for greenhouse N and P experiments.
Greenhouse P Experiment Effect Statistical Significance
Above-ground dry matter P Fertilizer Rate P<0.01
Cultivar P<0.01
P Rate x Cultivar P<0.01
Root dry matter P Fertilizer Rate NS
Cultivar NS
P Rate x Cultivar NS
Leaf P Concentration P Fertilizer Rate P<0.01
Cultivar P<0.01
P Rate x Cultivar P<0.01
P uptake P Fertilizer Rate P<0.01
Cultivar P<0.01
P Rate x Cultivar P<0.05
Residual Olsen Soil Test P P Fertilizer Rate P<0.01
Cultivar P<0.01
P Rate x Cultivar P<0.05
Greenhouse N Experiment
Above-ground dry matter N Fertilizer Rate P<0.01
Cultivar P<0.01
N Rate x Cultivar P<0.10
Leaf N concentration N Fertilizer Rate P<0.01
Cultivar P<0.01
N Rate x Cultivar P<0.01
N uptake N Fertilizer Rate P<0.01
Cultivar P<0.01
N Rate x Cultivar P<0.01
Residual Soil NH4-N N Fertilizer Rate P<0.05
Cultivar P<0.01
N Rate x Cultivar NS
Residual Soil NO3-N N Fertilizer Rate NS
Cultivar P<0.01
N Rate x Cultivar P<0.05
Page 120 of 147
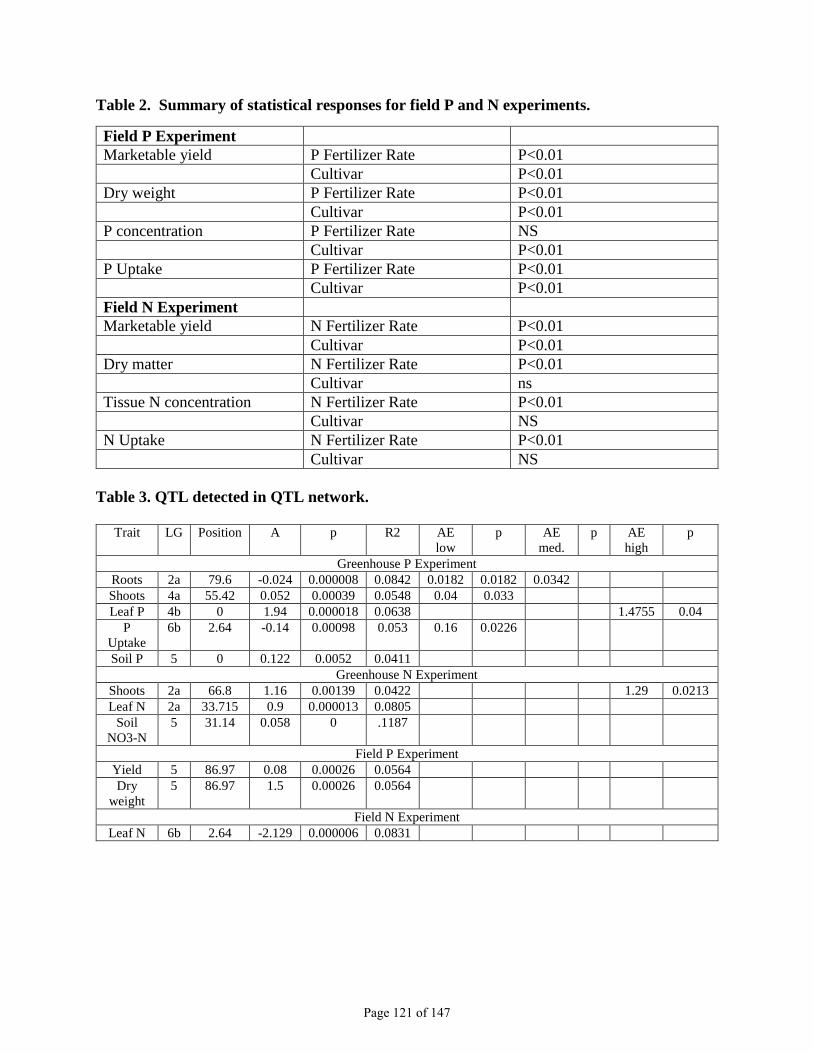
Table 2. Summary of statistical responses for field P and N experiments.
Field P Experiment
Marketable yield P Fertilizer Rate P<0.01
Cultivar P<0.01
Dry weight P Fertilizer Rate P<0.01
Cultivar P<0.01
P concentration P Fertilizer Rate NS
Cultivar P<0.01
P Uptake P Fertilizer Rate P<0.01
Cultivar P<0.01
Field N Experiment
Marketable yield N Fertilizer Rate P<0.01
Cultivar P<0.01
Dry matter N Fertilizer Rate P<0.01
Cultivar ns
Tissue N concentration N Fertilizer Rate P<0.01
Cultivar NS
N Uptake N Fertilizer Rate P<0.01
Cultivar NS
Table 3. QTL detected in QTL network.
Trait LG Position A p R2 AE
low
p AE
med.
p AE
high
p
Greenhouse P Experiment
Roots 2a 79.6 -0.024 0.000008 0.0842 0.0182 0.0182 0.0342
Shoots 4a 55.42 0.052 0.00039 0.0548 0.04 0.033
Leaf P 4b 0 1.94 0.000018 0.0638 1.4755 0.04
P
Uptake
6b 2.64 -0.14 0.00098 0.053 0.16 0.0226
Soil P 5 0 0.122 0.0052 0.0411
Greenhouse N Experiment
Shoots 2a 66.8 1.16 0.00139 0.0422 1.29 0.0213
Leaf N 2a 33.715 0.9 0.000013 0.0805
Soil
NO3-N
5 31.14 0.058 0 .1187
Field P Experiment
Yield 5 86.97 0.08 0.00026 0.0564
Dry
weight
5 86.97 1.5 0.00026 0.0564
Field N Experiment
Leaf N 6b 2.64 -2.129 0.000006 0.0831
Page 121 of 147
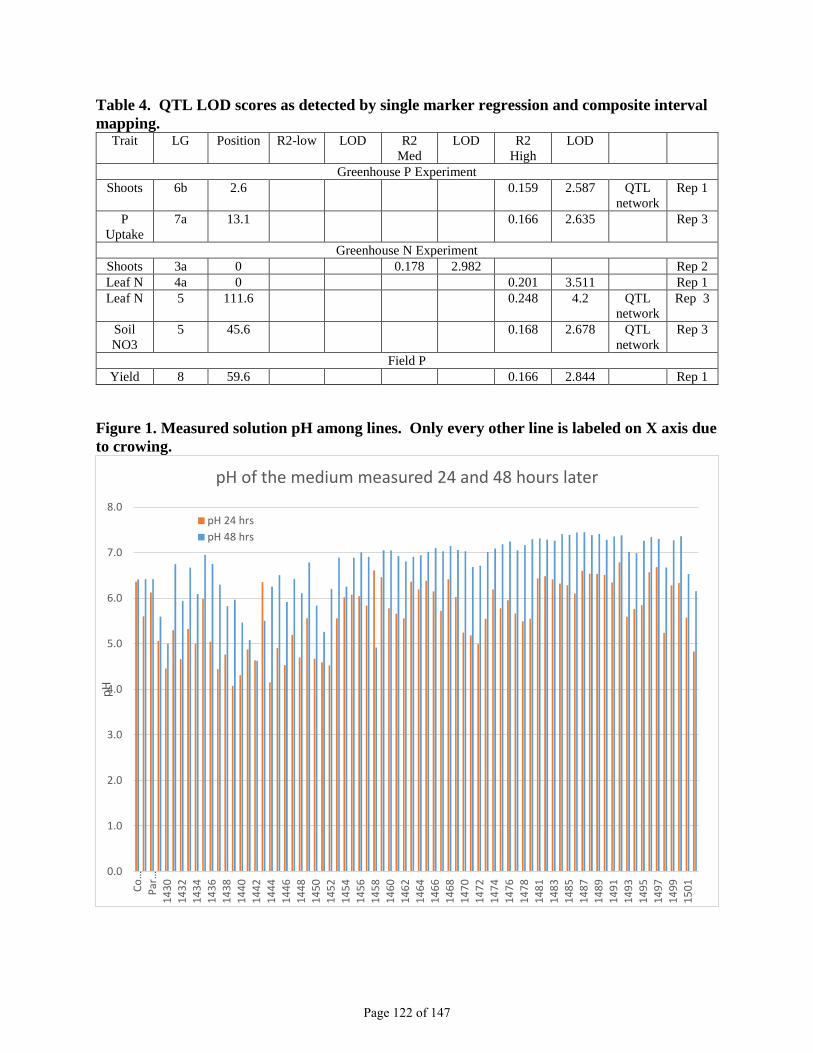
Table 4. QTL LOD scores as detected by single marker regression and composite interval
mapping. Trait LG Position R2-low LOD R2
Med
LOD R2
High
LOD
Greenhouse P Experiment
Shoots 6b 2.6 0.159 2.587 QTL
network
Rep 1
P
Uptake
7a 13.1 0.166 2.635 Rep 3
Greenhouse N Experiment
Shoots 3a 0 0.178 2.982 Rep 2
Leaf N 4a 0 0.201 3.511 Rep 1
Leaf N 5 111.6 0.248 4.2 QTL
network
Rep 3
Soil
NO3
5 45.6 0.168 2.678 QTL
network
Rep 3
Field P
Yield 8 59.6 0.166 2.844 Rep 1
Figure 1. Measured solution pH among lines. Only every other line is labeled on X axis due
to crowing.
0.0
1.0
2.0
3.0
4.0
5.0
6.0
7.0
8.0
Co…
Par…
14
30
14
32
14
34
14
36
14
38
14
40
14
42
14
44
14
46
14
48
14
50
14
52
14
54
14
56
14
58
14
60
14
62
14
64
14
66
14
68
14
70
14
72
14
74
14
76
14
78
14
81
14
83
14
85
14
87
14
89
14
91
14
93
14
95
14
97
14
99
15
01
pH
pH of the medium measured 24 and 48 hours later
pH 24 hrs
pH 48 hrs
Page 122 of 147
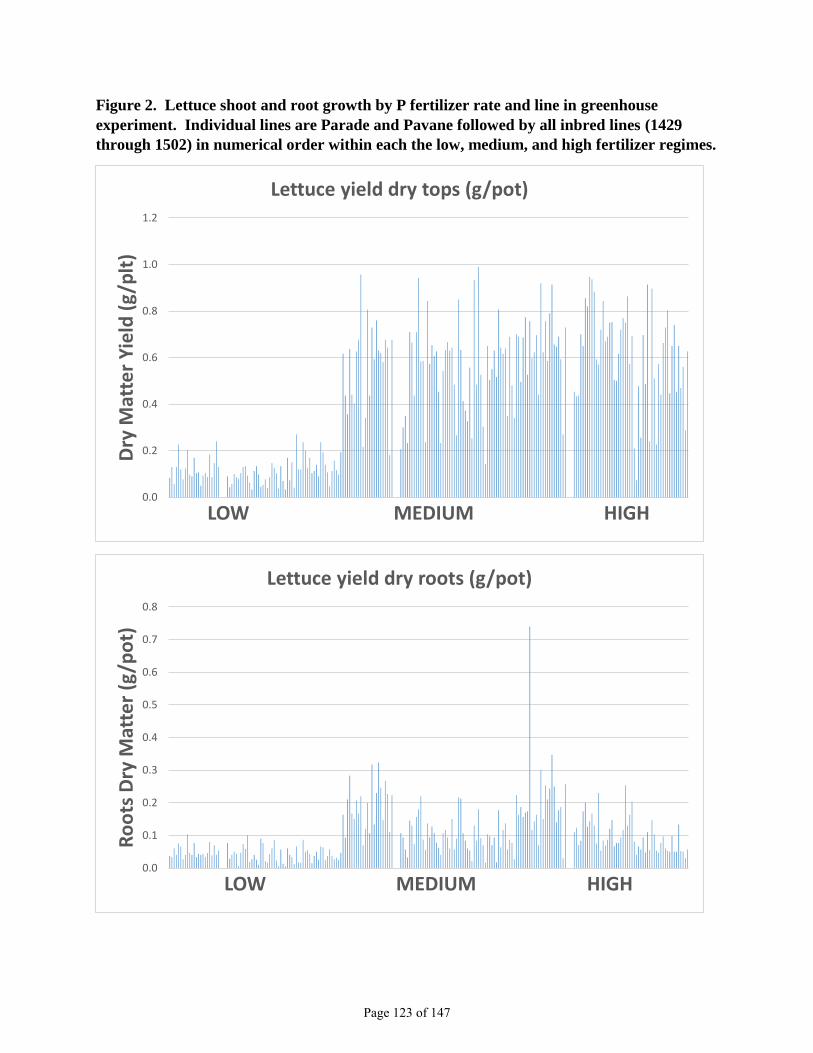
Figure 2. Lettuce shoot and root growth by P fertilizer rate and line in greenhouse
experiment. Individual lines are Parade and Pavane followed by all inbred lines (1429
through 1502) in numerical order within each the low, medium, and high fertilizer regimes.
0.0
0.2
0.4
0.6
0.8
1.0
1.2
Dry
Mat
ter
Yie
ld (
g/p
lt)
LOW MEDIUM HIGH
Lettuce yield dry tops (g/pot)
0.0
0.1
0.2
0.3
0.4
0.5
0.6
0.7
0.8
Ro
ots
Dry
Mat
ter
(g/p
ot)
LOW MEDIUM HIGH
Lettuce yield dry roots (g/pot)
Page 123 of 147
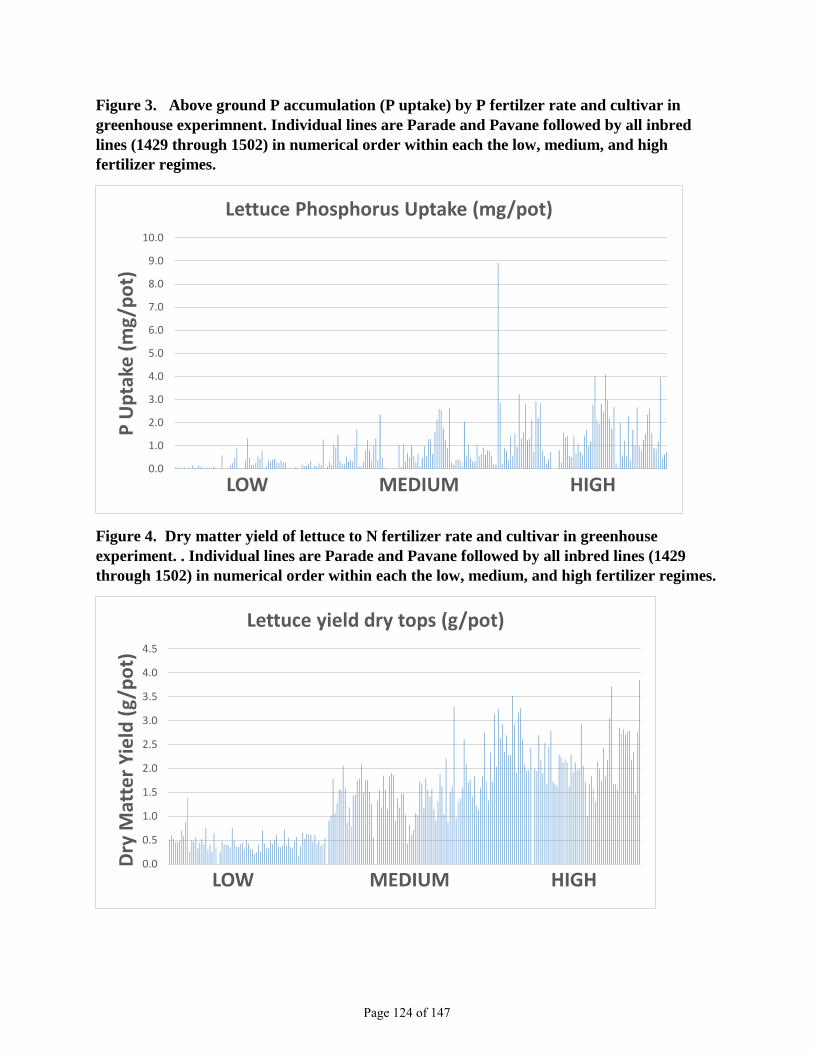
Figure 3. Above ground P accumulation (P uptake) by P fertilzer rate and cultivar in
greenhouse experimnent. Individual lines are Parade and Pavane followed by all inbred
lines (1429 through 1502) in numerical order within each the low, medium, and high
fertilizer regimes.
Figure 4. Dry matter yield of lettuce to N fertilizer rate and cultivar in greenhouse
experiment. . Individual lines are Parade and Pavane followed by all inbred lines (1429
through 1502) in numerical order within each the low, medium, and high fertilizer regimes.
0.0
1.0
2.0
3.0
4.0
5.0
6.0
7.0
8.0
9.0
10.0
P U
pta
ke (
mg
/po
t)
LOW MEDIUM HIGH
Lettuce Phosphorus Uptake (mg/pot)
0.0
0.5
1.0
1.5
2.0
2.5
3.0
3.5
4.0
4.5
Dry
Mat
ter
Yie
ld (
g/p
ot)
LOW MEDIUM HIGH
Lettuce yield dry tops (g/pot)
Page 124 of 147
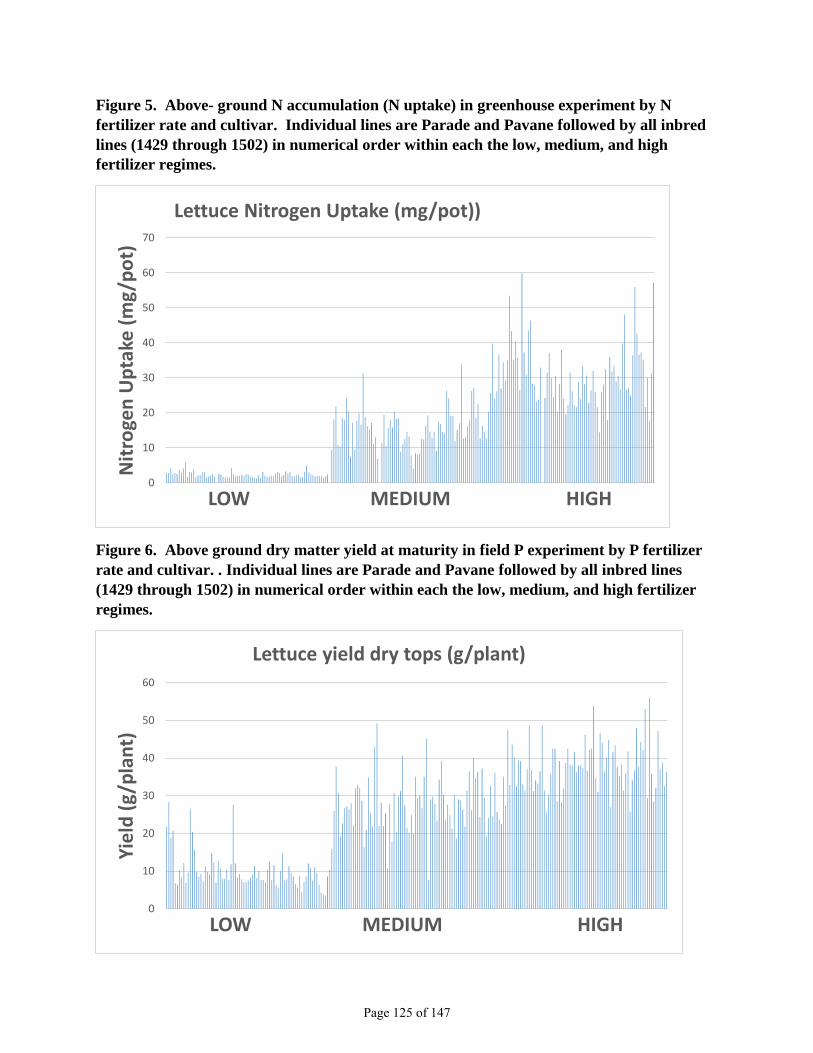
Figure 5. Above- ground N accumulation (N uptake) in greenhouse experiment by N
fertilizer rate and cultivar. Individual lines are Parade and Pavane followed by all inbred
lines (1429 through 1502) in numerical order within each the low, medium, and high
fertilizer regimes.
Figure 6. Above ground dry matter yield at maturity in field P experiment by P fertilizer
rate and cultivar. . Individual lines are Parade and Pavane followed by all inbred lines
(1429 through 1502) in numerical order within each the low, medium, and high fertilizer
regimes.
0
10
20
30
40
50
60
70
Nit
roge
n U
pta
ke (
mg
/po
t)
LOW MEDIUM HIGH
Lettuce Nitrogen Uptake (mg/pot))
0
10
20
30
40
50
60
Yie
ld (
g/p
lan
t)
LOW MEDIUM HIGH
Lettuce yield dry tops (g/plant)
Page 125 of 147
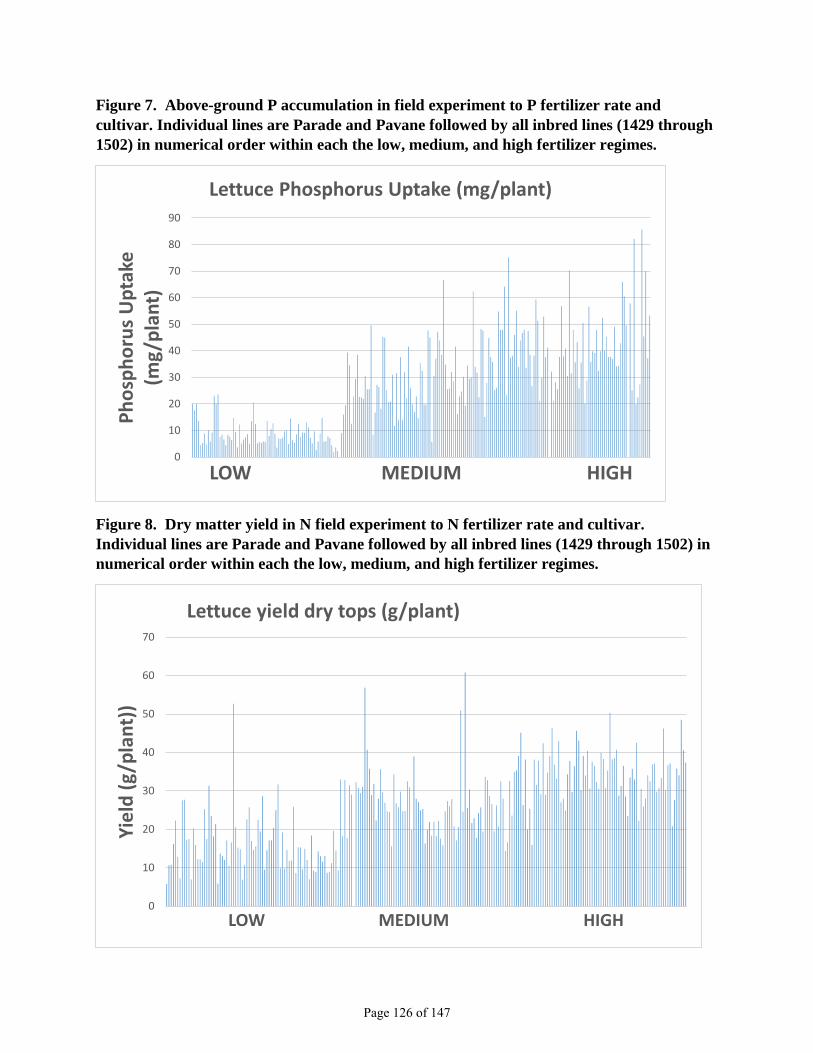
Figure 7. Above-ground P accumulation in field experiment to P fertilizer rate and
cultivar. Individual lines are Parade and Pavane followed by all inbred lines (1429 through
1502) in numerical order within each the low, medium, and high fertilizer regimes.
Figure 8. Dry matter yield in N field experiment to N fertilizer rate and cultivar.
Individual lines are Parade and Pavane followed by all inbred lines (1429 through 1502) in
numerical order within each the low, medium, and high fertilizer regimes.
0
10
20
30
40
50
60
70
80
90
Ph
osp
ho
rus
Up
take
(m
g/p
lan
t)
LOW MEDIUM HIGH
Lettuce Phosphorus Uptake (mg/plant)
0
10
20
30
40
50
60
70
Yie
ld (
g/p
lan
t))
LOW MEDIUM HIGH
Lettuce yield dry tops (g/plant)
Page 126 of 147
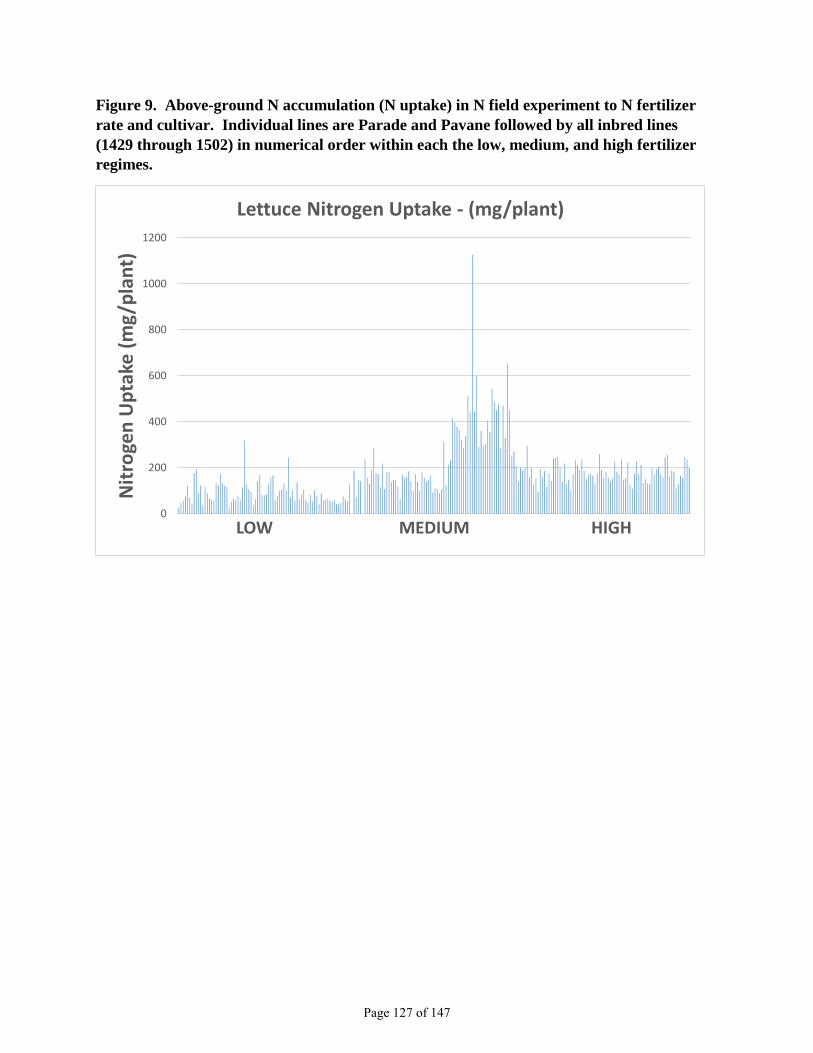
Figure 9. Above-ground N accumulation (N uptake) in N field experiment to N fertilizer
rate and cultivar. Individual lines are Parade and Pavane followed by all inbred lines
(1429 through 1502) in numerical order within each the low, medium, and high fertilizer
regimes.
0
200
400
600
800
1000
1200
Nit
roge
n U
pta
ke (
mg
/pla
nt)
LOW MEDIUM HIGH
Lettuce Nitrogen Uptake - (mg/plant)
Page 127 of 147
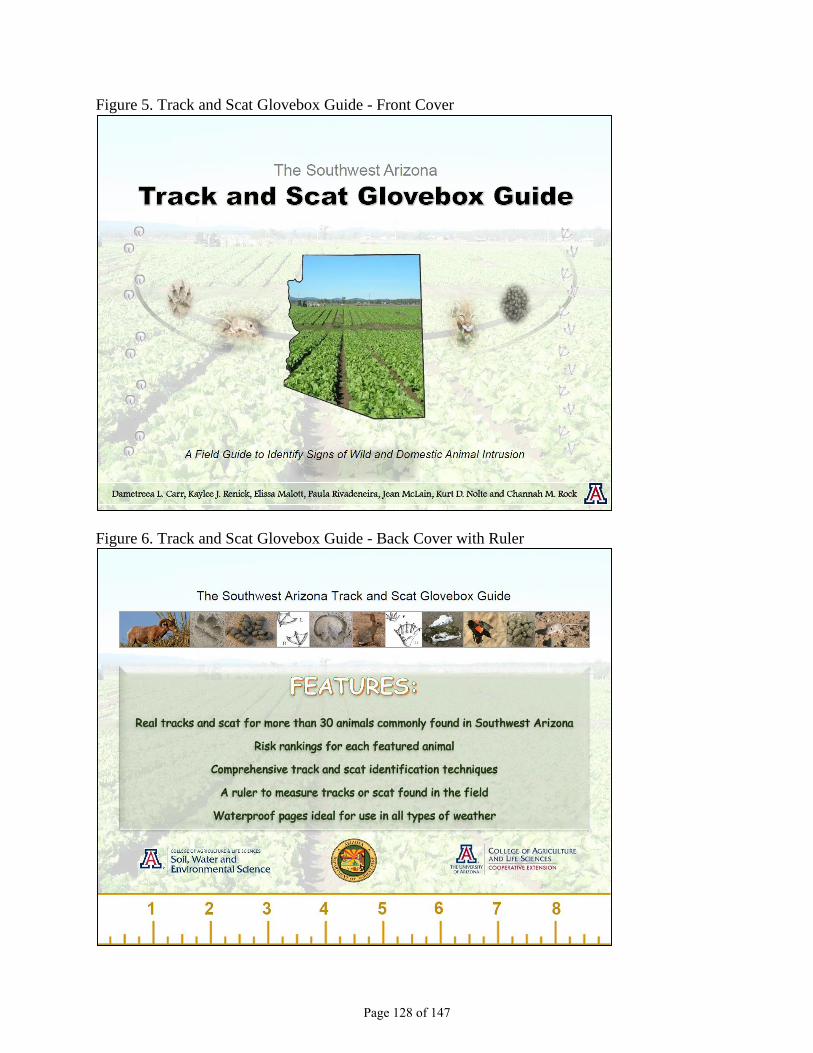
Figure 5. Track and Scat Glovebox Guide - Front Cover
Figure 6. Track and Scat Glovebox Guide - Back Cover with Ruler
Page 128 of 147
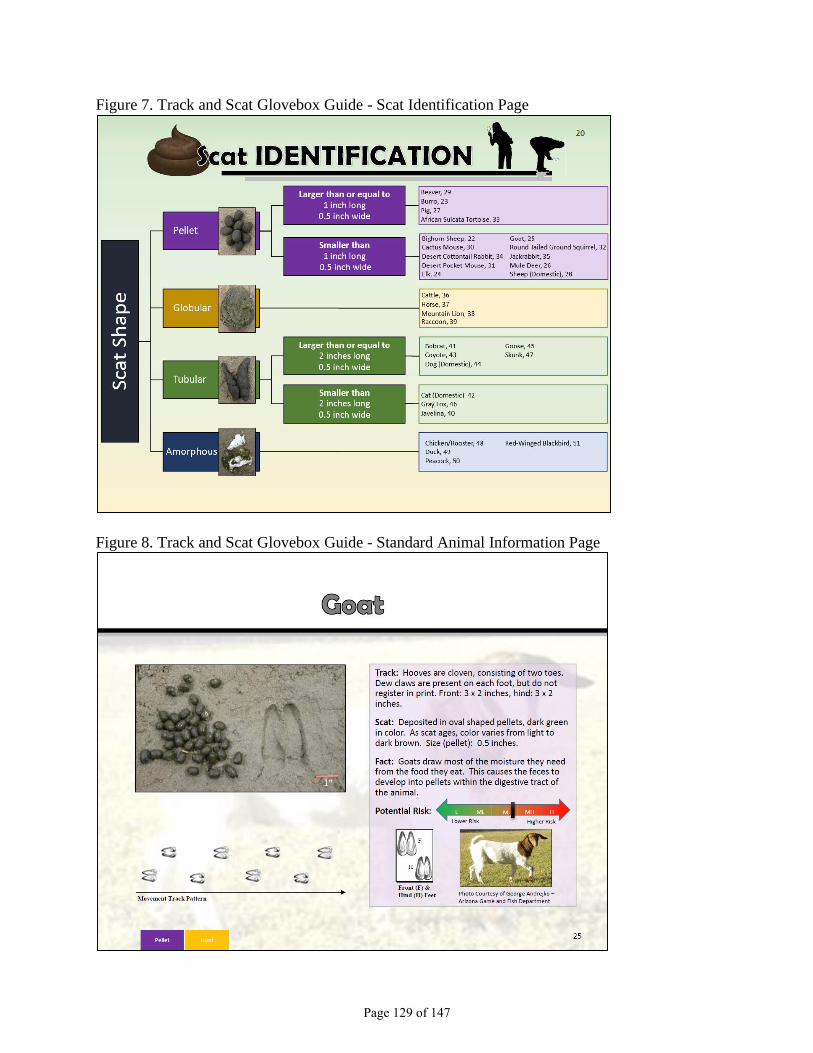
Figure 7. Track and Scat Glovebox Guide - Scat Identification Page
Figure 8. Track and Scat Glovebox Guide - Standard Animal Information Page
Page 129 of 147
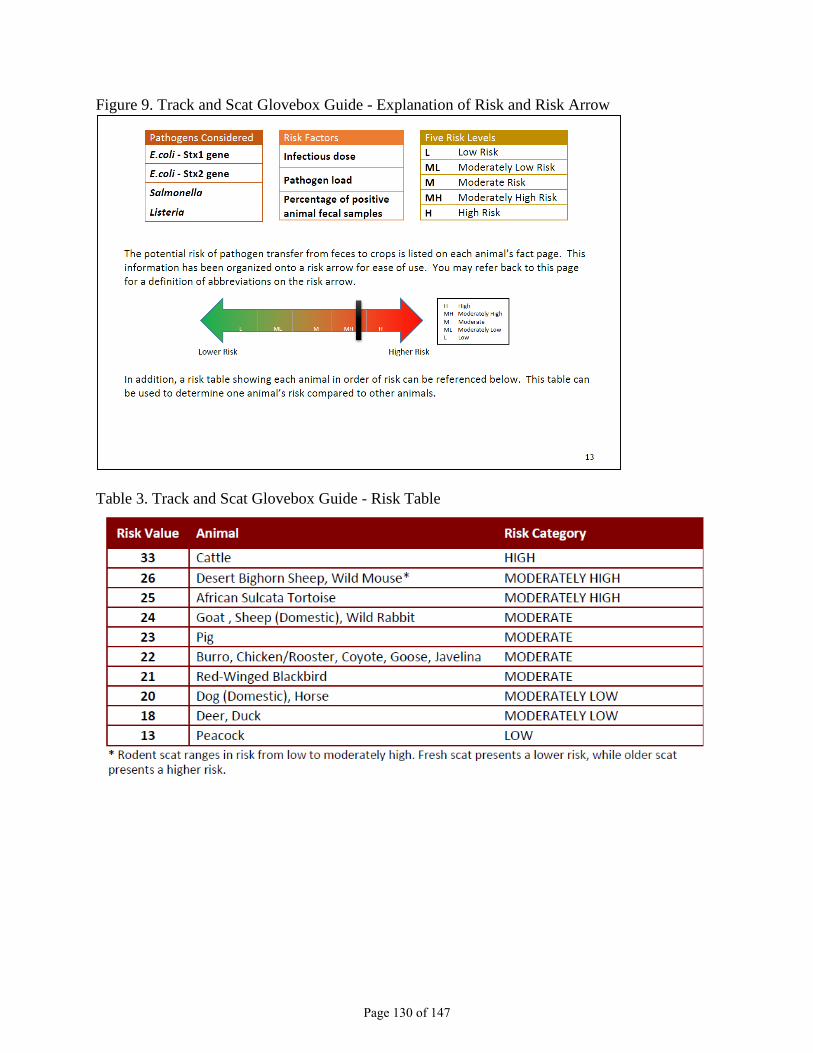
Figure 9. Track and Scat Glovebox Guide - Explanation of Risk and Risk Arrow
Table 3. Track and Scat Glovebox Guide - Risk Table
Page 130 of 147
Arizonaʼs Vineyard Industry - 2013
1
ARIZONA VINEYARD SURVEY - 2013
September 2014
Compiled by: USDA – National Agricultural Statistics Service Arizona Field Office Submitted to: Arizona Wine Growers Association
Page 131 of 147
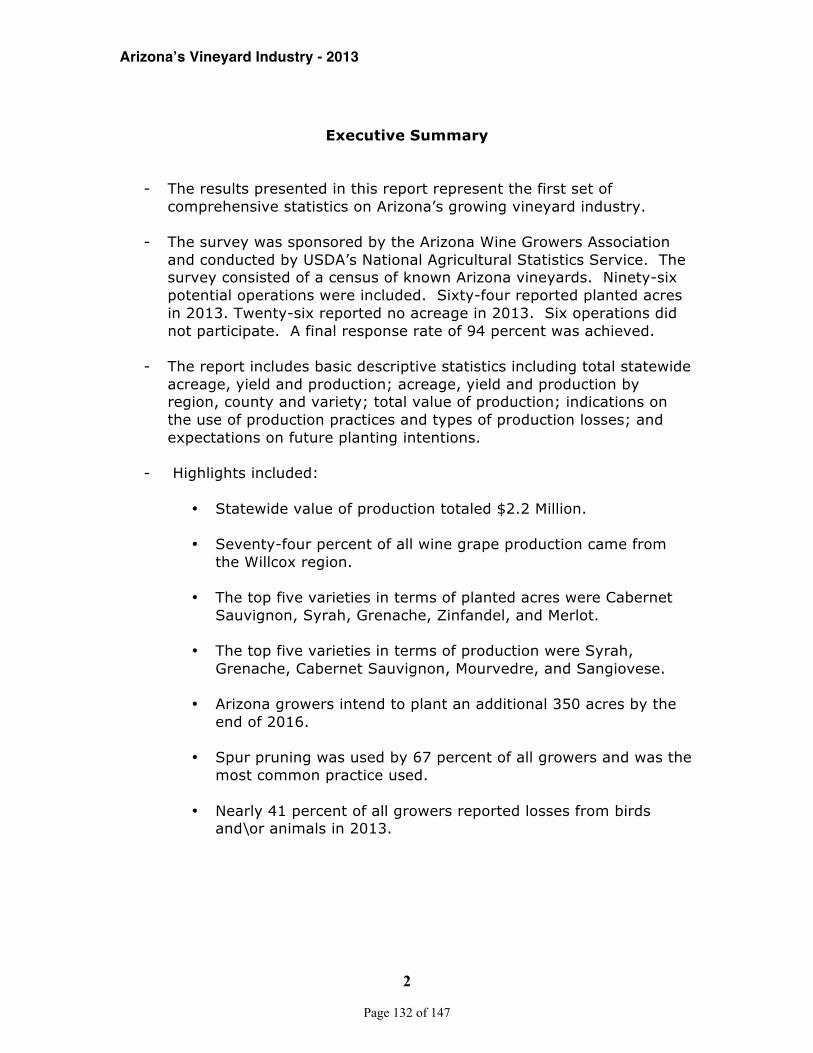
Arizonaʼs Vineyard Industry - 2013
2
Executive Summary
- The results presented in this report represent the first set of comprehensive statistics on Arizona’s growing vineyard industry.
- The survey was sponsored by the Arizona Wine Growers Association and conducted by USDA’s National Agricultural Statistics Service. The survey consisted of a census of known Arizona vineyards. Ninety-six potential operations were included. Sixty-four reported planted acres in 2013. Twenty-six reported no acreage in 2013. Six operations did not participate. A final response rate of 94 percent was achieved.
- The report includes basic descriptive statistics including total statewide acreage, yield and production; acreage, yield and production by region, county and variety; total value of production; indications on the use of production practices and types of production losses; and expectations on future planting intentions.
- Highlights included:
• Statewide value of production totaled $2.2 Million.
• Seventy-four percent of all wine grape production came from the Willcox region.
• The top five varieties in terms of planted acres were Cabernet
Sauvignon, Syrah, Grenache, Zinfandel, and Merlot.
• The top five varieties in terms of production were Syrah, Grenache, Cabernet Sauvignon, Mourvedre, and Sangiovese.
• Arizona growers intend to plant an additional 350 acres by the
end of 2016.
• Spur pruning was used by 67 percent of all growers and was the most common practice used.
• Nearly 41 percent of all growers reported losses from birds
and\or animals in 2013.
Page 132 of 147
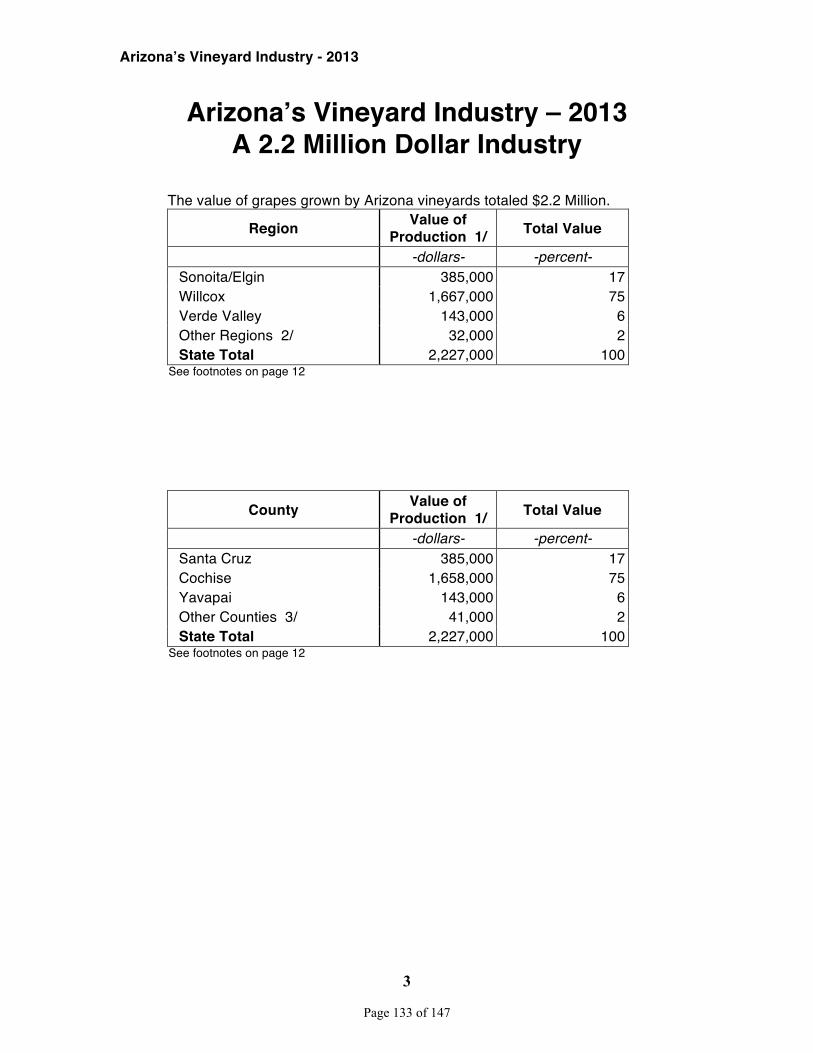
Arizonaʼs Vineyard Industry - 2013
3
Arizonaʼs Vineyard Industry – 2013 A 2.2 Million Dollar Industry
The value of grapes grown by Arizona vineyards totaled $2.2 Million.
Region Value of Production 1/ Total Value
-dollars- -percent- Sonoita/Elgin 385,000 17 Willcox 1,667,000 75 Verde Valley 143,000 6 Other Regions 2/ 32,000 2 State Total 2,227,000 100
See footnotes on page 12
County Value of Production 1/ Total Value
-dollars- -percent- Santa Cruz 385,000 17 Cochise 1,658,000 75 Yavapai 143,000 6 Other Counties 3/ 41,000 2 State Total 2,227,000 100
See footnotes on page 12
Page 133 of 147
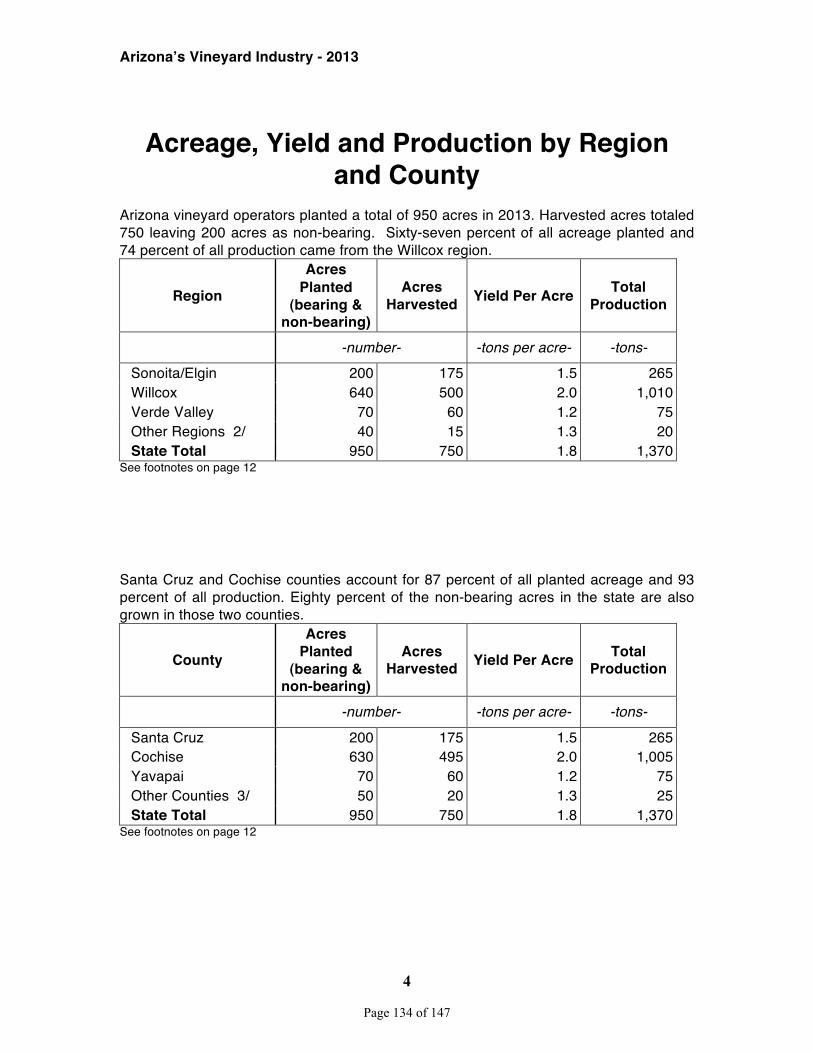
Arizonaʼs Vineyard Industry - 2013
4
Acreage, Yield and Production by Region
and County Arizona vineyard operators planted a total of 950 acres in 2013. Harvested acres totaled 750 leaving 200 acres as non-bearing. Sixty-seven percent of all acreage planted and 74 percent of all production came from the Willcox region.
Region
Acres Planted
(bearing & non-bearing)
Acres Harvested Yield Per Acre Total
Production
-number- -tons per acre- -tons- Sonoita/Elgin 200 175 1.5 265 Willcox 640 500 2.0 1,010 Verde Valley 70 60 1.2 75 Other Regions 2/ 40 15 1.3 20 State Total 950 750 1.8 1,370 See footnotes on page 12 Santa Cruz and Cochise counties account for 87 percent of all planted acreage and 93 percent of all production. Eighty percent of the non-bearing acres in the state are also grown in those two counties.
County
Acres Planted
(bearing & non-bearing)
Acres Harvested Yield Per Acre Total
Production
-number- -tons per acre- -tons-
Santa Cruz 200 175 1.5 265 Cochise 630 495 2.0 1,005 Yavapai 70 60 1.2 75 Other Counties 3/ 50 20 1.3 25 State Total 950 750 1.8 1,370 See footnotes on page 12
Page 134 of 147
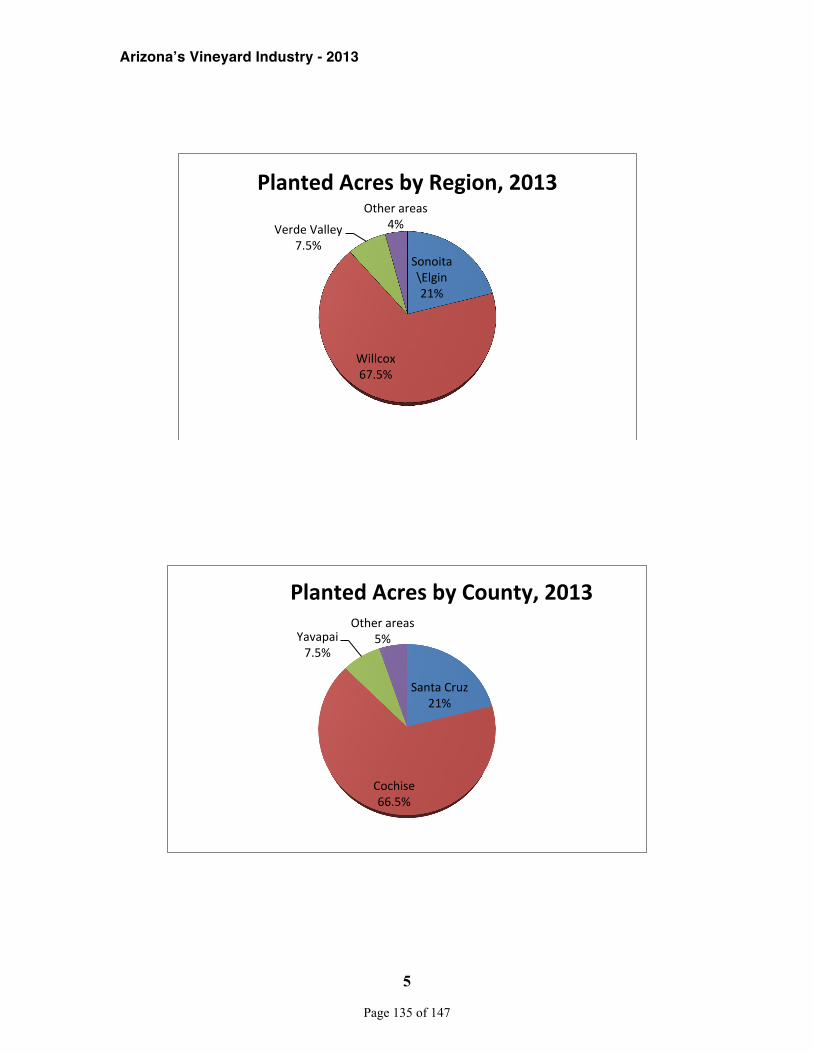
Arizonaʼs Vineyard Industry - 2013
5
Sonoita\Elgin 21%
Willcox 67.5%
Verde Valley 7.5%
Other areas 4%
Planted Acres by Region, 2013
Santa Cruz 21%
Cochise 66.5%
Yavapai 7.5%
Other areas 5%
Planted Acres by County, 2013
Page 135 of 147
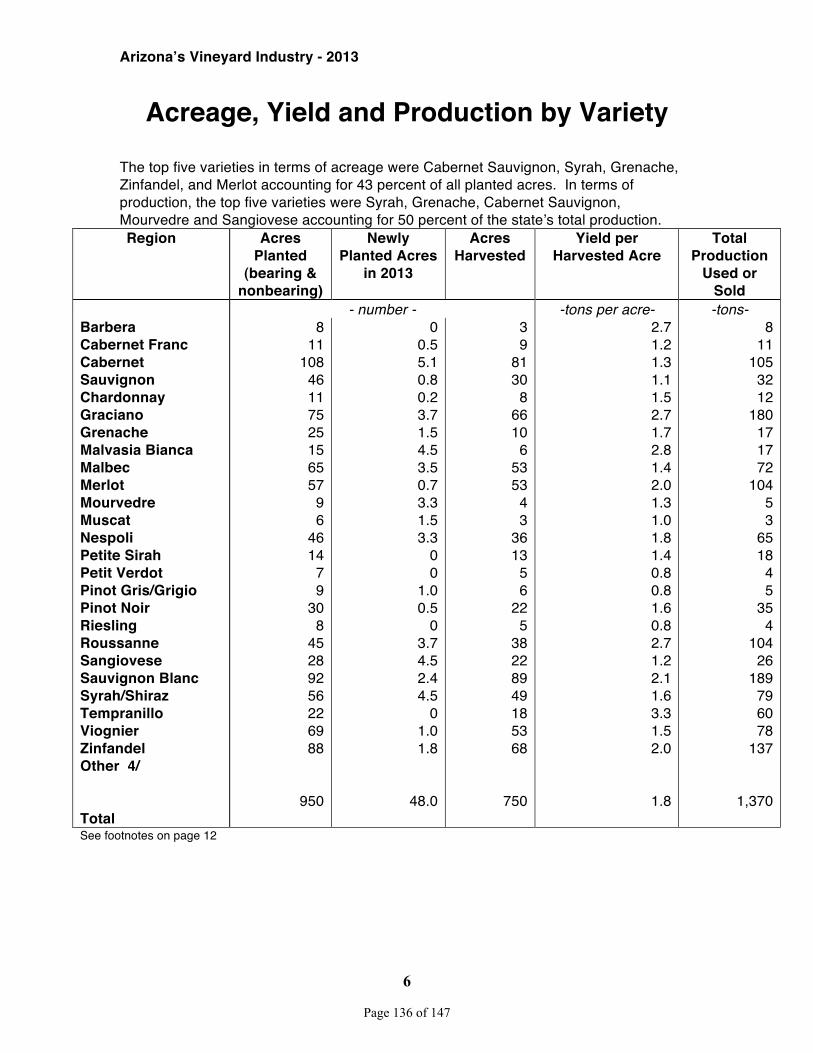
Arizonaʼs Vineyard Industry - 2013
6
Acreage, Yield and Production by Variety The top five varieties in terms of acreage were Cabernet Sauvignon, Syrah, Grenache, Zinfandel, and Merlot accounting for 43 percent of all planted acres. In terms of production, the top five varieties were Syrah, Grenache, Cabernet Sauvignon, Mourvedre and Sangiovese accounting for 50 percent of the stateʼs total production. Region Acres
Planted (bearing &
nonbearing)
Newly Planted Acres
in 2013
Acres Harvested
Yield per Harvested Acre
Total Production
Used or Sold
- number - -tons per acre- -tons- Barbera Cabernet Franc Cabernet Sauvignon Chardonnay Graciano Grenache Malvasia Bianca Malbec Merlot Mourvedre Muscat Nespoli Petite Sirah Petit Verdot Pinot Gris/Grigio Pinot Noir Riesling Roussanne Sangiovese Sauvignon Blanc Syrah/Shiraz Tempranillo Viognier Zinfandel Other 4/ Total
8 11
108 46 11 75 25 15 65 57
9 6
46 14
7 9
30 8
45 28 92 56 22 69 88
950
0 0.5 5.1 0.8 0.2 3.7 1.5 4.5 3.5 0.7 3.3 1.5 3.3
0 0
1.0 0.5
0 3.7 4.5 2.4 4.5
0 1.0 1.8
48.0
3 9
81 30
8 66 10
6 53 53
4 3
36 13
5 6
22 5
38 22 89 49 18 53 68
750
2.7 1.2 1.3 1.1 1.5 2.7 1.7 2.8 1.4 2.0 1.3 1.0 1.8 1.4 0.8 0.8 1.6 0.8 2.7 1.2 2.1 1.6 3.3 1.5 2.0
1.8
8 11
105 32 12
180 17 17 72
104 5 3
65 18
4 5
35 4
104 26
189 79 60 78
137
1,370
See footnotes on page 12
Page 136 of 147
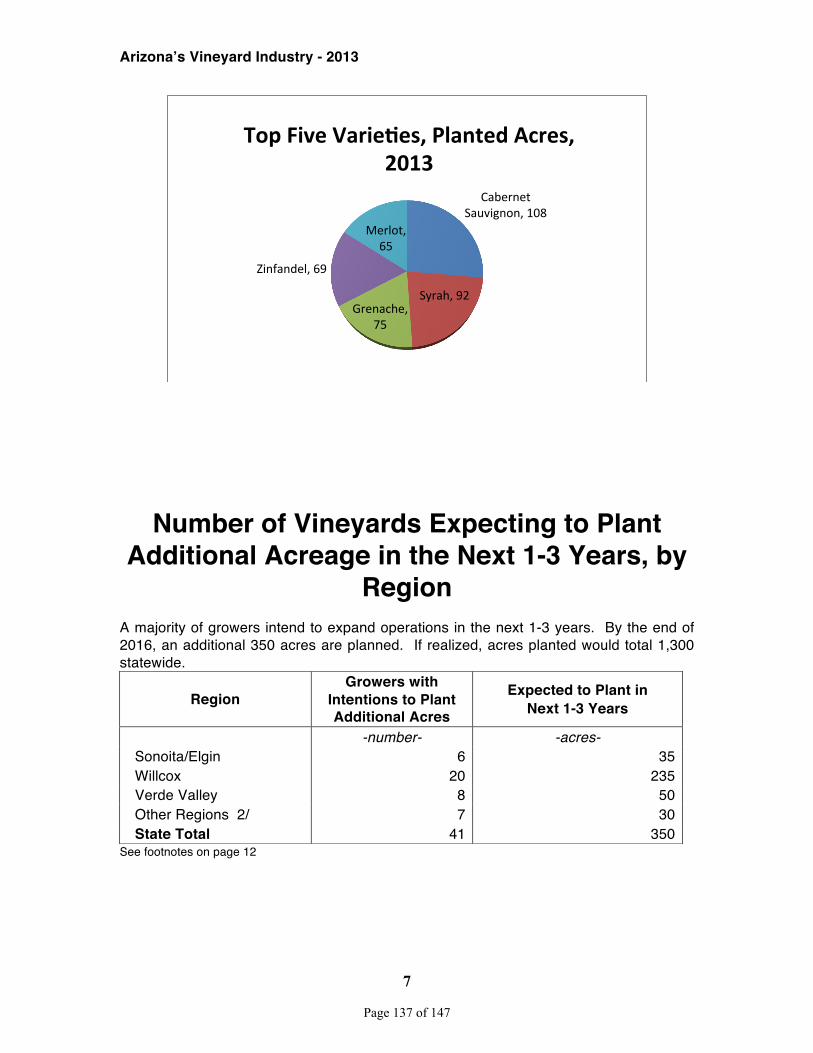
Arizonaʼs Vineyard Industry - 2013
7
Number of Vineyards Expecting to Plant
Additional Acreage in the Next 1-3 Years, by Region
A majority of growers intend to expand operations in the next 1-3 years. By the end of 2016, an additional 350 acres are planned. If realized, acres planted would total 1,300 statewide.
See footnotes on page 12
Cabernet Sauvignon, 108
Syrah, 92 Grenache,
75
Zinfandel, 69
Merlot, 65
Top Five Varie?es, Planted Acres, 2013
Region Growers with
Intentions to Plant Additional Acres
Expected to Plant in Next 1-3 Years
-number- -acres- Sonoita/Elgin 6 35 Willcox 20 235 Verde Valley 8 50 Other Regions 2/ 7 30 State Total 41 350
Page 137 of 147
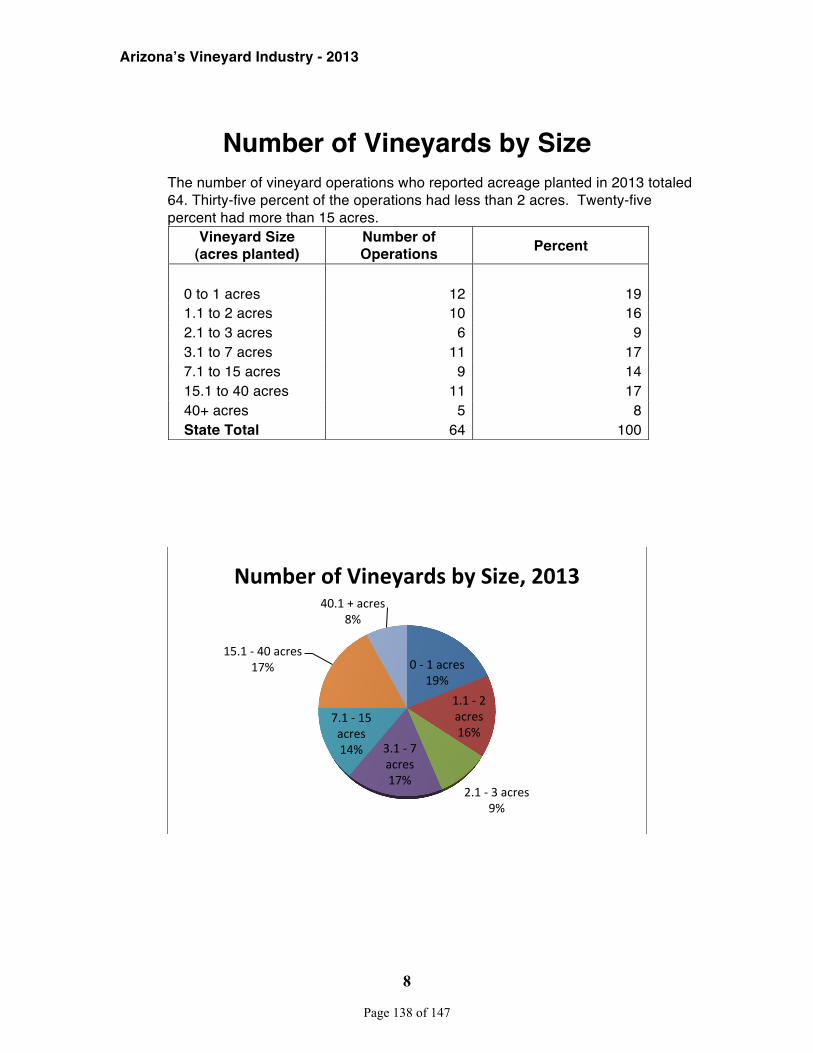
Arizonaʼs Vineyard Industry - 2013
8
Number of Vineyards by Size
The number of vineyard operations who reported acreage planted in 2013 totaled 64. Thirty-five percent of the operations had less than 2 acres. Twenty-five percent had more than 15 acres.
0 -‐ 1 acres 19%
1.1 -‐ 2 acres 16%
2.1 -‐ 3 acres 9%
3.1 -‐ 7 acres 17%
7.1 -‐ 15 acres 14%
15.1 -‐ 40 acres 17%
40.1 + acres 8%
Number of Vineyards by Size, 2013
Vineyard Size (acres planted)
Number of Operations Percent
0 to 1 acres 12 19 1.1 to 2 acres 10 16 2.1 to 3 acres 6 9 3.1 to 7 acres 11 17 7.1 to 15 acres 9 14 15.1 to 40 acres 11 17 40+ acres 5 8 State Total 64 100
Page 138 of 147
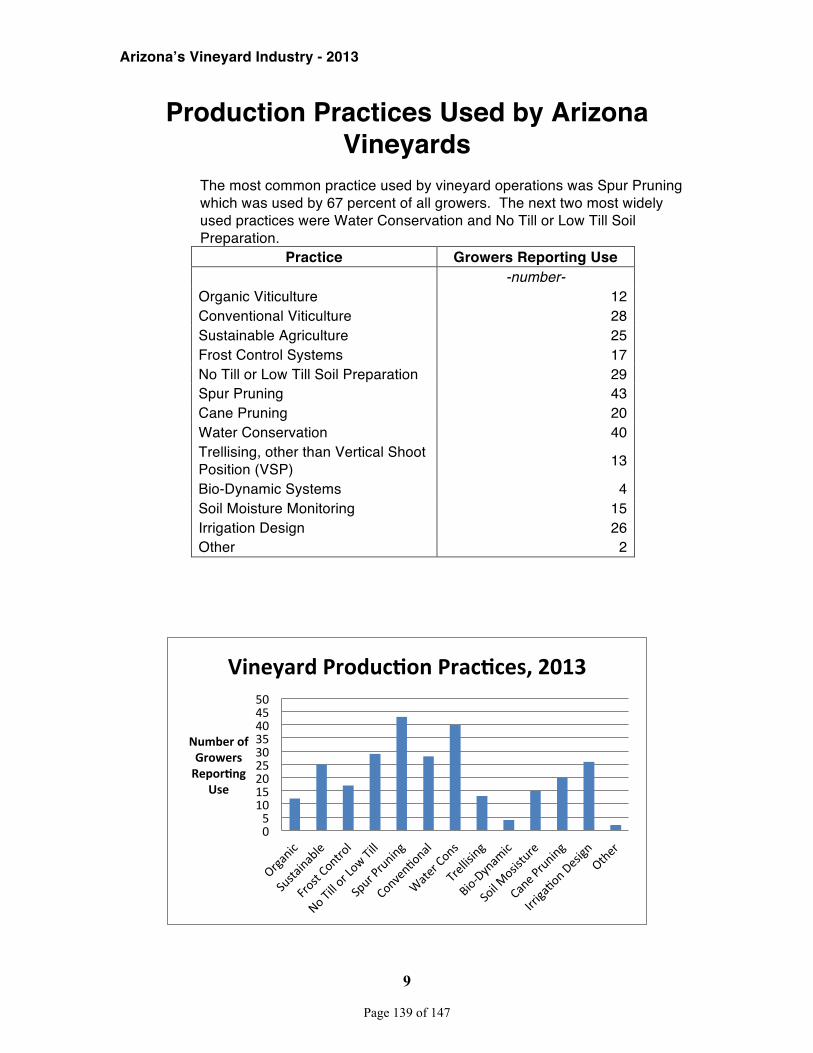
Arizonaʼs Vineyard Industry - 2013
9
Production Practices Used by Arizona Vineyards
The most common practice used by vineyard operations was Spur Pruning
which was used by 67 percent of all growers. The next two most widely used practices were Water Conservation and No Till or Low Till Soil Preparation.
Practice Growers Reporting Use -number- Organic Viticulture 12 Conventional Viticulture 28 Sustainable Agriculture 25 Frost Control Systems 17 No Till or Low Till Soil Preparation 29 Spur Pruning 43 Cane Pruning 20 Water Conservation 40 Trellising, other than Vertical Shoot Position (VSP) 13
Bio-Dynamic Systems 4 Soil Moisture Monitoring 15 Irrigation Design 26 Other 2
0 5 10 15 20 25 30 35 40 45 50
Number of Growers Repor?ng
Use
Vineyard Produc?on Prac?ces, 2013
Page 139 of 147
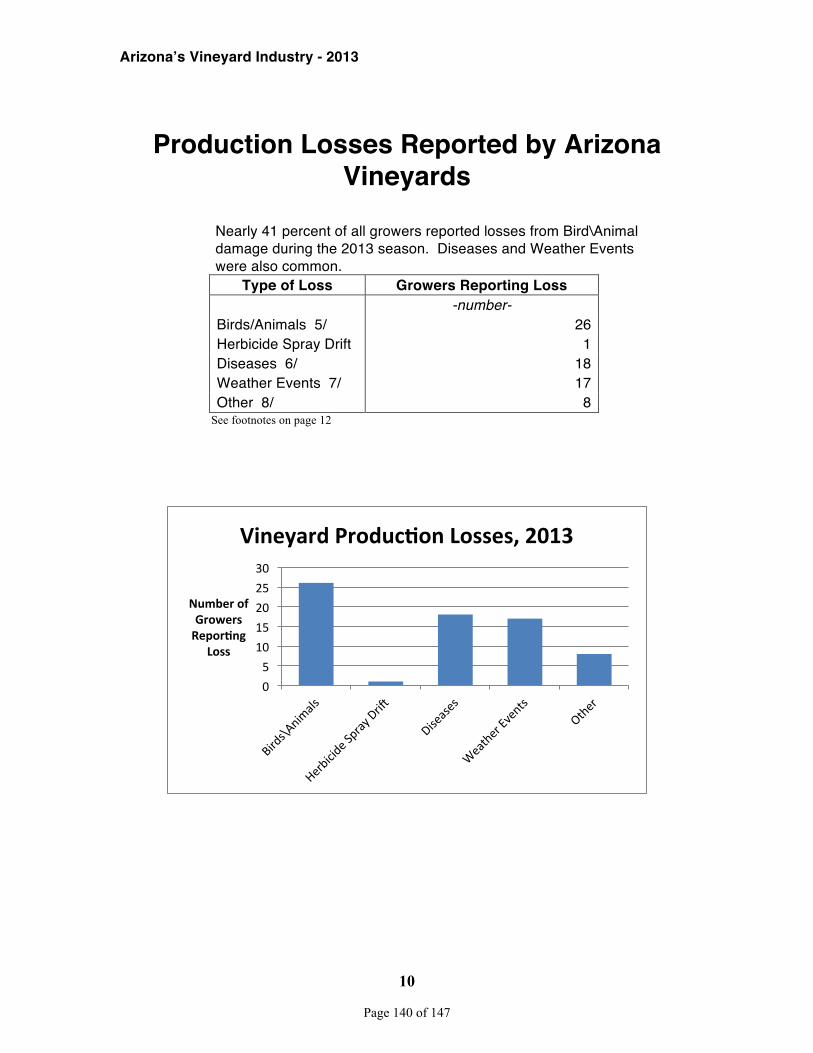
Arizonaʼs Vineyard Industry - 2013
10
Production Losses Reported by Arizona
Vineyards
Nearly 41 percent of all growers reported losses from Bird\Animal damage during the 2013 season. Diseases and Weather Events were also common.
Type of Loss Growers Reporting Loss -number- Birds/Animals 5/ 26 Herbicide Spray Drift 1 Diseases 6/ 18 Weather Events 7/ 17 Other 8/ 8
See footnotes on page 12
0 5 10 15 20 25 30
Number of Growers Repor?ng
Loss
Vineyard Produc?on Losses, 2013
Page 140 of 147
Arizonaʼs Vineyard Industry - 2013
11
SURVEY METHODOLOGY: This study was sponsored by the Arizona Wine Growers Association to provide basic baseline information about the size of the Arizona Vineyard industry. The report does not cover the winery side of the industry, just growers of wine grapes although many of the vineyards also have wine making operations. Statistical samples were drawn from lists provided by Arizona Wine Growers Association and lists of grape growers maintained by USDA’s National Agricultural Statistics Service (NASS). An un-stratified sample of 96 possible vineyard operations was selected to represent the entire universe of Arizona wine grape growers. The intent was to conduct a census of all growers to minimize the statistical effect of nonresponse. After an extensive data collection phase a final response rate of 94 percent was obtained. Sixty-four samples reported positive acres in 2013. Twenty-six samples reported no acreage in 2013. Six potential growers did not participate. NASS adjusted the data to account for the six nonresponse samples by using survey averages from those that did report. The size of the six nonresponse cases were known so averages from all like-sized operations were used to impute data for those six reports. Data collection started in early 2014 with the first survey mailing. A postcard reminder followed ten days after the initial mailing. After providing time to return the survey form, a second mailing took place. Telephone data collection followed along with a limited amount of face-to-face data collection. Staff from the Arizona Wine Growers Association also assisted by promoting survey participation. Data analysis started in May 2014 and the report was delivered to the survey sponsor in September 2014.
Page 141 of 147
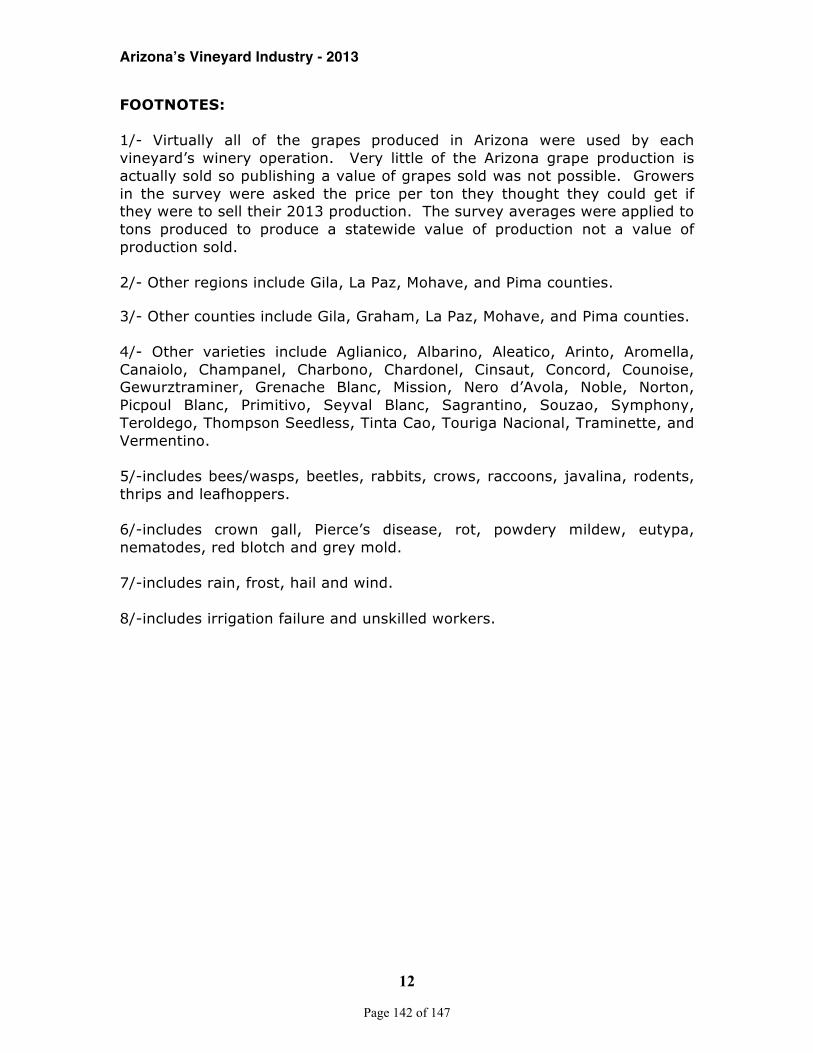
Arizonaʼs Vineyard Industry - 2013
12
FOOTNOTES: 1/- Virtually all of the grapes produced in Arizona were used by each vineyard’s winery operation. Very little of the Arizona grape production is actually sold so publishing a value of grapes sold was not possible. Growers in the survey were asked the price per ton they thought they could get if they were to sell their 2013 production. The survey averages were applied to tons produced to produce a statewide value of production not a value of production sold. 2/- Other regions include Gila, La Paz, Mohave, and Pima counties. 3/- Other counties include Gila, Graham, La Paz, Mohave, and Pima counties. 4/- Other varieties include Aglianico, Albarino, Aleatico, Arinto, Aromella, Canaiolo, Champanel, Charbono, Chardonel, Cinsaut, Concord, Counoise, Gewurztraminer, Grenache Blanc, Mission, Nero d’Avola, Noble, Norton, Picpoul Blanc, Primitivo, Seyval Blanc, Sagrantino, Souzao, Symphony, Teroldego, Thompson Seedless, Tinta Cao, Touriga Nacional, Traminette, and Vermentino. 5/-includes bees/wasps, beetles, rabbits, crows, raccoons, javalina, rodents, thrips and leafhoppers. 6/-includes crown gall, Pierce’s disease, rot, powdery mildew, eutypa, nematodes, red blotch and grey mold. 7/-includes rain, frost, hail and wind. 8/-includes irrigation failure and unskilled workers.
Page 142 of 147
Page 143 of 147
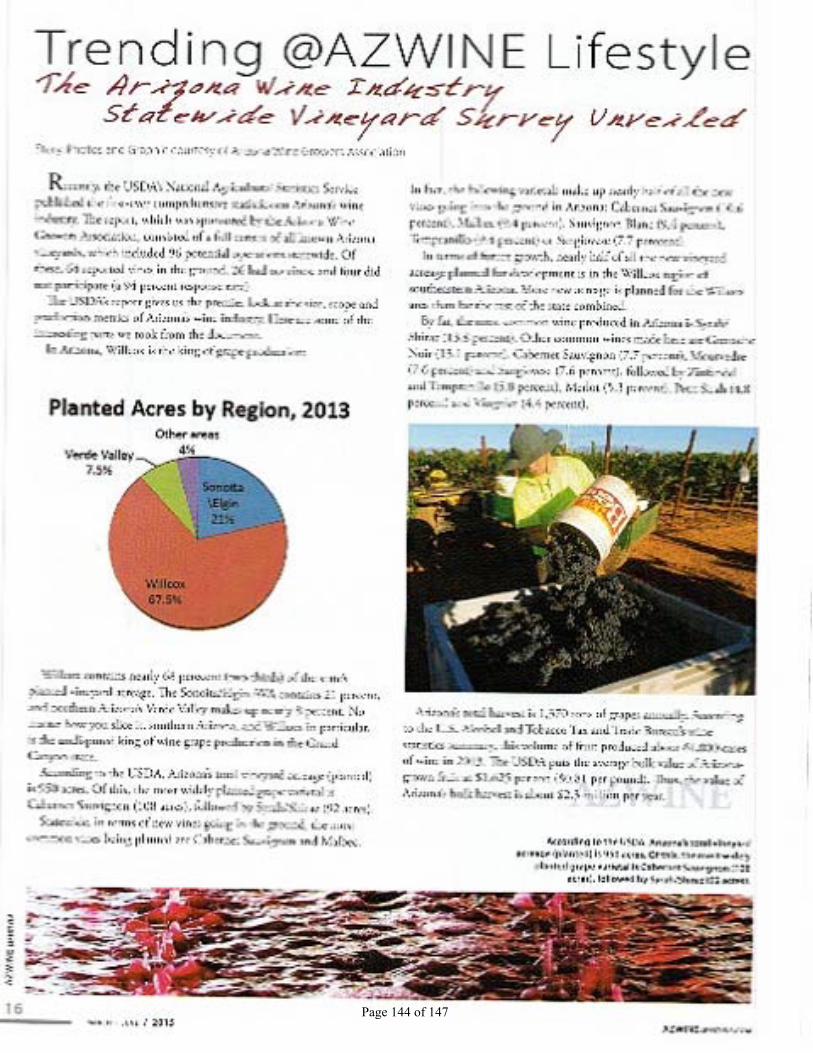
Page 144 of 147
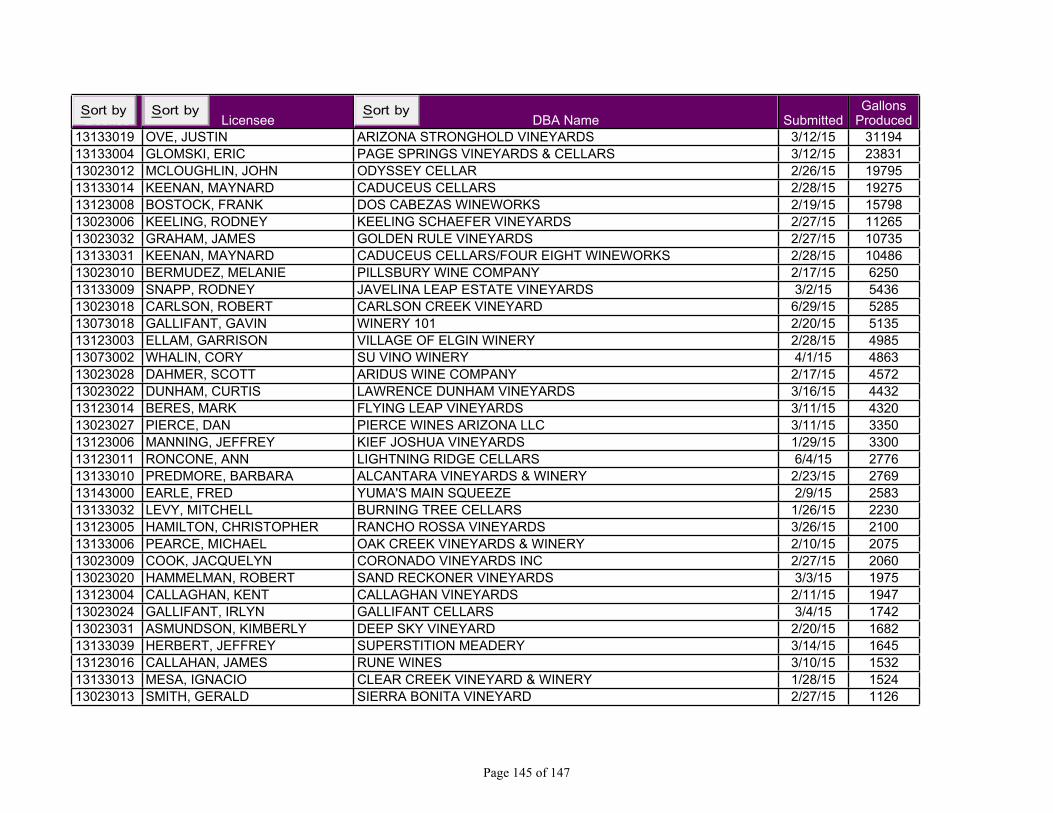
License Licensee DBA Name SubmittedGallons
Produced13133019 OVE, JUSTIN ARIZONA STRONGHOLD VINEYARDS 3/12/15 3119413133004 GLOMSKI, ERIC PAGE SPRINGS VINEYARDS & CELLARS 3/12/15 2383113023012 MCLOUGHLIN, JOHN ODYSSEY CELLAR 2/26/15 1979513133014 KEENAN, MAYNARD CADUCEUS CELLARS 2/28/15 1927513123008 BOSTOCK, FRANK DOS CABEZAS WINEWORKS 2/19/15 1579813023006 KEELING, RODNEY KEELING SCHAEFER VINEYARDS 2/27/15 1126513023032 GRAHAM, JAMES GOLDEN RULE VINEYARDS 2/27/15 1073513133031 KEENAN, MAYNARD CADUCEUS CELLARS/FOUR EIGHT WINEWORKS 2/28/15 1048613023010 BERMUDEZ, MELANIE PILLSBURY WINE COMPANY 2/17/15 625013133009 SNAPP, RODNEY JAVELINA LEAP ESTATE VINEYARDS 3/2/15 543613023018 CARLSON, ROBERT CARLSON CREEK VINEYARD 6/29/15 528513073018 GALLIFANT, GAVIN WINERY 101 2/20/15 513513123003 ELLAM, GARRISON VILLAGE OF ELGIN WINERY 2/28/15 498513073002 WHALIN, CORY SU VINO WINERY 4/1/15 486313023028 DAHMER, SCOTT ARIDUS WINE COMPANY 2/17/15 457213023022 DUNHAM, CURTIS LAWRENCE DUNHAM VINEYARDS 3/16/15 443213123014 BERES, MARK FLYING LEAP VINEYARDS 3/11/15 432013023027 PIERCE, DAN PIERCE WINES ARIZONA LLC 3/11/15 335013123006 MANNING, JEFFREY KIEF JOSHUA VINEYARDS 1/29/15 330013123011 RONCONE, ANN LIGHTNING RIDGE CELLARS 6/4/15 277613133010 PREDMORE, BARBARA ALCANTARA VINEYARDS & WINERY 2/23/15 276913143000 EARLE, FRED YUMA'S MAIN SQUEEZE 2/9/15 258313133032 LEVY, MITCHELL BURNING TREE CELLARS 1/26/15 223013123005 HAMILTON, CHRISTOPHER RANCHO ROSSA VINEYARDS 3/26/15 210013133006 PEARCE, MICHAEL OAK CREEK VINEYARDS & WINERY 2/10/15 207513023009 COOK, JACQUELYN CORONADO VINEYARDS INC 2/27/15 206013023020 HAMMELMAN, ROBERT SAND RECKONER VINEYARDS 3/3/15 197513123004 CALLAGHAN, KENT CALLAGHAN VINEYARDS 2/11/15 194713023024 GALLIFANT, IRLYN GALLIFANT CELLARS 3/4/15 174213023031 ASMUNDSON, KIMBERLY DEEP SKY VINEYARD 2/20/15 168213133039 HERBERT, JEFFREY SUPERSTITION MEADERY 3/14/15 164513123016 CALLAHAN, JAMES RUNE WINES 3/10/15 153213133013 MESA, IGNACIO CLEAR CREEK VINEYARD & WINERY 1/28/15 152413023013 SMITH, GERALD SIERRA BONITA VINEYARD 2/27/15 1126
Page 145 of 147
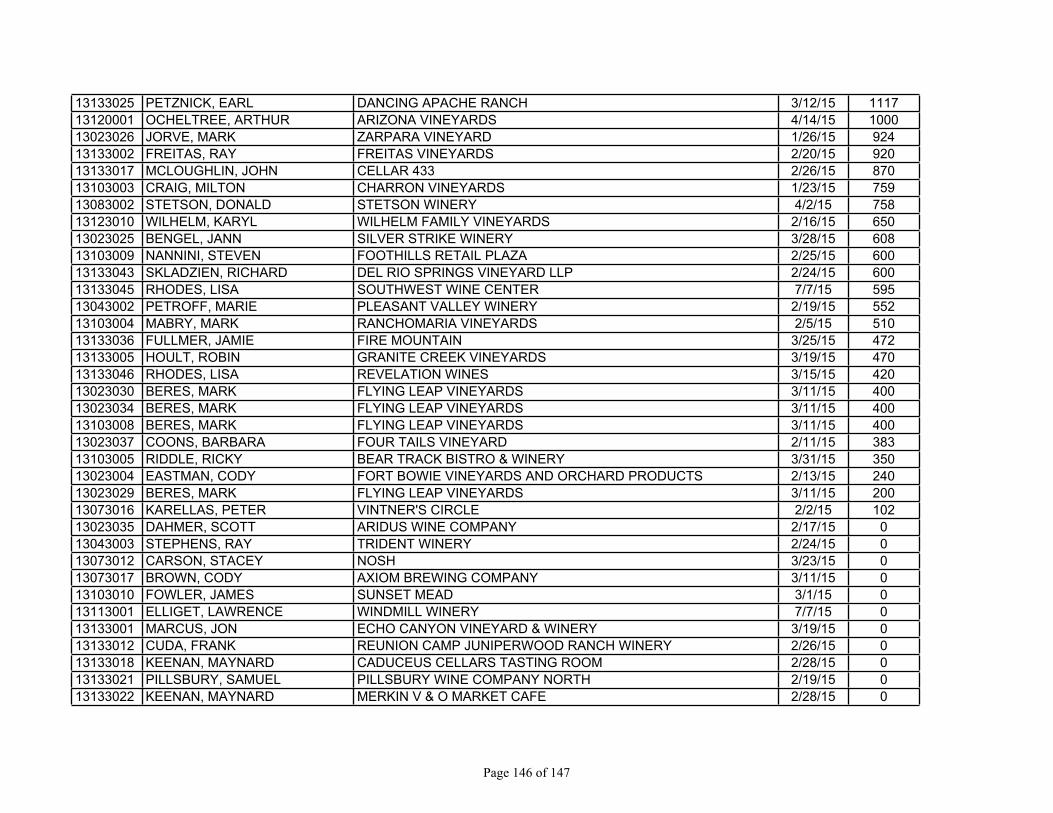
13133025 PETZNICK, EARL DANCING APACHE RANCH 3/12/15 111713120001 OCHELTREE, ARTHUR ARIZONA VINEYARDS 4/14/15 100013023026 JORVE, MARK ZARPARA VINEYARD 1/26/15 92413133002 FREITAS, RAY FREITAS VINEYARDS 2/20/15 92013133017 MCLOUGHLIN, JOHN CELLAR 433 2/26/15 87013103003 CRAIG, MILTON CHARRON VINEYARDS 1/23/15 75913083002 STETSON, DONALD STETSON WINERY 4/2/15 75813123010 WILHELM, KARYL WILHELM FAMILY VINEYARDS 2/16/15 65013023025 BENGEL, JANN SILVER STRIKE WINERY 3/28/15 60813103009 NANNINI, STEVEN FOOTHILLS RETAIL PLAZA 2/25/15 60013133043 SKLADZIEN, RICHARD DEL RIO SPRINGS VINEYARD LLP 2/24/15 60013133045 RHODES, LISA SOUTHWEST WINE CENTER 7/7/15 59513043002 PETROFF, MARIE PLEASANT VALLEY WINERY 2/19/15 55213103004 MABRY, MARK RANCHOMARIA VINEYARDS 2/5/15 51013133036 FULLMER, JAMIE FIRE MOUNTAIN 3/25/15 47213133005 HOULT, ROBIN GRANITE CREEK VINEYARDS 3/19/15 47013133046 RHODES, LISA REVELATION WINES 3/15/15 42013023030 BERES, MARK FLYING LEAP VINEYARDS 3/11/15 40013023034 BERES, MARK FLYING LEAP VINEYARDS 3/11/15 40013103008 BERES, MARK FLYING LEAP VINEYARDS 3/11/15 40013023037 COONS, BARBARA FOUR TAILS VINEYARD 2/11/15 38313103005 RIDDLE, RICKY BEAR TRACK BISTRO & WINERY 3/31/15 35013023004 EASTMAN, CODY FORT BOWIE VINEYARDS AND ORCHARD PRODUCTS 2/13/15 24013023029 BERES, MARK FLYING LEAP VINEYARDS 3/11/15 20013073016 KARELLAS, PETER VINTNER'S CIRCLE 2/2/15 10213023035 DAHMER, SCOTT ARIDUS WINE COMPANY 2/17/15 013043003 STEPHENS, RAY TRIDENT WINERY 2/24/15 013073012 CARSON, STACEY NOSH 3/23/15 013073017 BROWN, CODY AXIOM BREWING COMPANY 3/11/15 013103010 FOWLER, JAMES SUNSET MEAD 3/1/15 013113001 ELLIGET, LAWRENCE WINDMILL WINERY 7/7/15 013133001 MARCUS, JON ECHO CANYON VINEYARD & WINERY 3/19/15 013133012 CUDA, FRANK REUNION CAMP JUNIPERWOOD RANCH WINERY 2/26/15 013133018 KEENAN, MAYNARD CADUCEUS CELLARS TASTING ROOM 2/28/15 013133021 PILLSBURY, SAMUEL PILLSBURY WINE COMPANY NORTH 2/19/15 013133022 KEENAN, MAYNARD MERKIN V & O MARKET CAFE 2/28/15 0
Page 146 of 147

13133034 SMOOT, WILLIAM PRESCOTT WINERY 2/27/15 013133038 KEENAN, MAYNARD FOUR EIGHT WINEWORKS 2/28/15 013133044 NORTON, KEVIN SALT MINE VINEYARDS 2/25/15 013133047 BECHARD, JOSEPH CHATEAU TUMBLEWEED 2/27/15 0
238373
Page 147 of 147