Embed Size (px)
Citation preview
VALLOUREC
January 2018
INFORMATION
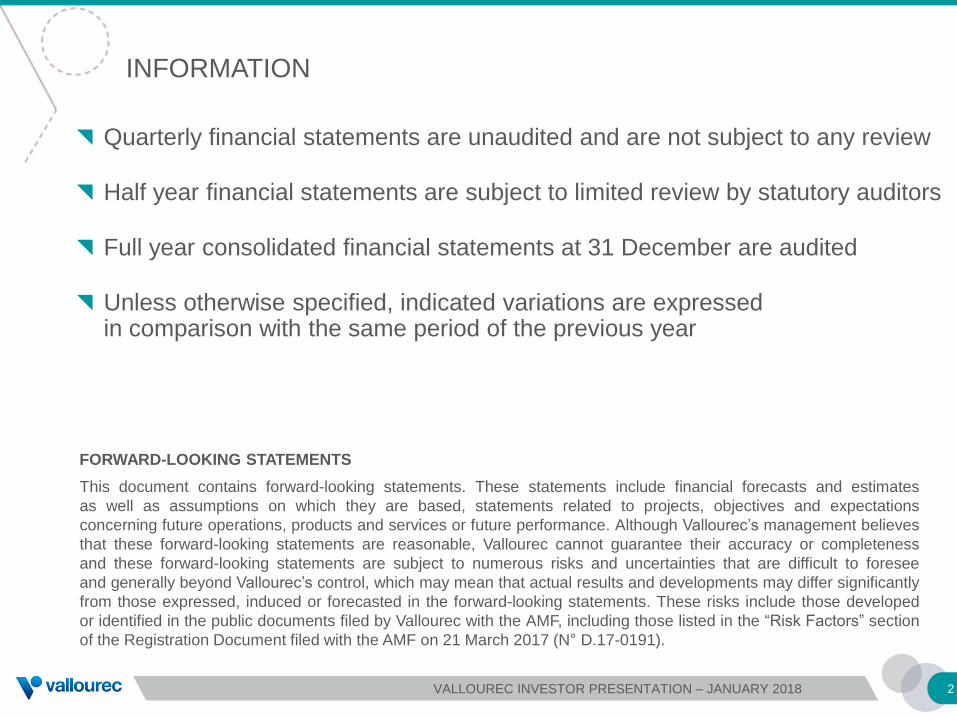
Quarterly financial statements are unaudited and are not subject to any review
Half year financial statements are subject to limited review by statutory auditors
Full year consolidated financial statements at 31 December are audited
Unless otherwise specified, indicated variations are expressed in comparison with the same period of the previous year
FORWARD-LOOKING STATEMENTS
This document contains forward-looking statements. These statements include financial forecasts and estimates
as well as assumptions on which they are based, statements related to projects, objectives and expectations
concerning future operations, products and services or future performance. Although Vallourec’s management believes
that these forward-looking statements are reasonable, Vallourec cannot guarantee their accuracy or completeness
and these forward-looking statements are subject to numerous risks and uncertainties that are difficult to foresee
and generally beyond Vallourec’s control, which may mean that actual results and developments may differ significantly
from those expressed, induced or forecasted in the forward-looking statements. These risks include those developed
or identified in the public documents filed by Vallourec with the AMF, including those listed in the “Risk Factors” section
of the Registration Document filed with the AMF on 21 March 2017 (N° D.17-0191).
2VALLOUREC INVESTOR PRESENTATION – JANUARY 2018
VALLOUREC RE-POSITIONED TO FULLY BENEFIT FROM THE RECOVERY THANKS TO ITS TRANSFORMATION PLAN
3
1 Favourable long-term trends
Extensive technological expertise and brand trust-recognition2
A reshaped industrial set up with highly competitive low-cost
export routes3
Strong focus on cost reduction4
A solid liquidity position and long term maturity5
Start of recovery in activity and financial performance6
VALLOUREC INVESTOR PRESENTATION – JANUARY 2018
-2,5
-1,5
-0,5
0,5
1,5
2,5
3,5
4,5
90
92
94
96
98
100
102
Q113
Q213
Q313
Q413
Q114
Q214
Q314
Q414
Q115
Q215
Q315
Q415
Q116
Q216
Q316
Q416
Q117
Q217
Q317
Q417
Q118
Q218
Q318
Q418
mb/dmb/d
Stock Change (R) World Oil Supply World Oil Demand
347
441
536
433484
587
651679 702
493
352378
412 432480
527
20
06
20
07
20
08
20
09
20
10
20
11
20
12
20
13
20
14
20
15
20
16
20
17
20
18
20
19
20
20
20
21
Africa Asia-Pacific Europe Middle East
North America Russia & Caspian Latin America Global Capex
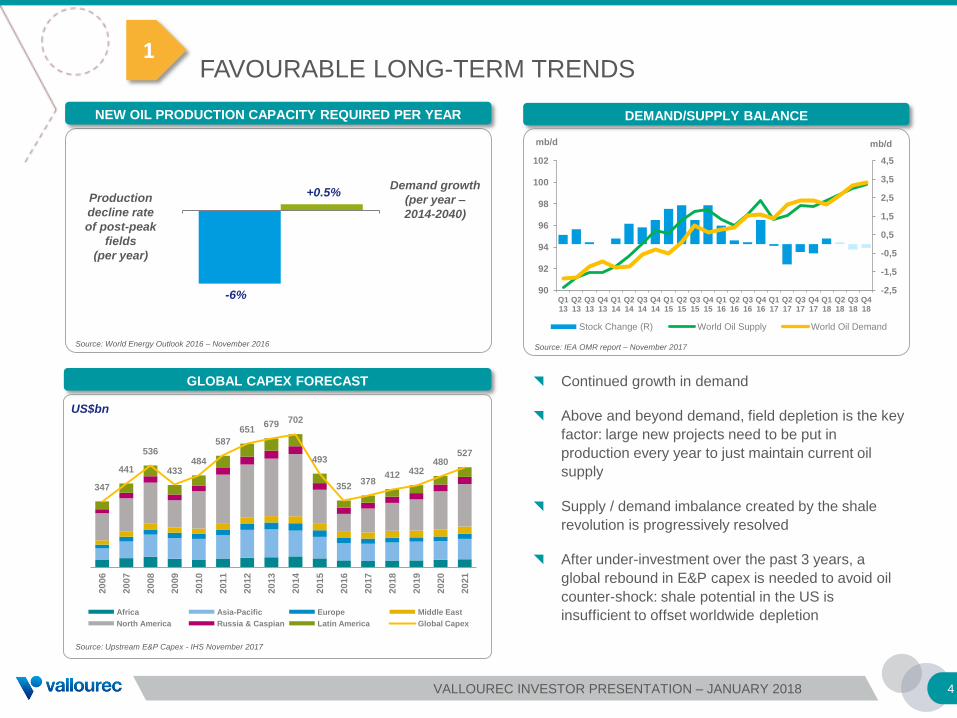
Continued growth in demand
Above and beyond demand, field depletion is the key
factor: large new projects need to be put in
production every year to just maintain current oil
supply
Supply / demand imbalance created by the shale
revolution is progressively resolved
After under-investment over the past 3 years, a
global rebound in E&P capex is needed to avoid oil
counter-shock: shale potential in the US is
insufficient to offset worldwide depletion
GLOBAL CAPEX FORECAST
US$bn
Source: Upstream E&P Capex - IHS November 2017
4
Demand growth
(per year –
2014-2040)
Production
decline rate
of post-peak
fields
(per year)
NEW OIL PRODUCTION CAPACITY REQUIRED PER YEAR
Source: World Energy Outlook 2016 – November 2016
+0.5%
-6%
Source: IEA OMR report – November 2017
DEMAND/SUPPLY BALANCE
1FAVOURABLE LONG-TERM TRENDS
VALLOUREC INVESTOR PRESENTATION – JANUARY 2018
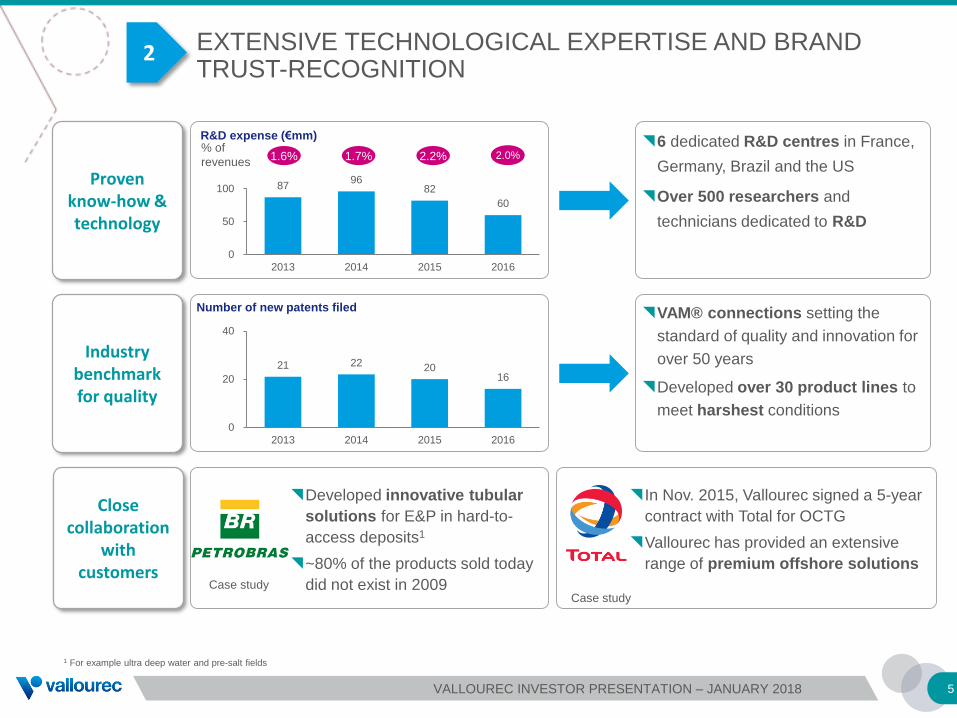
EXTENSIVE TECHNOLOGICAL EXPERTISE AND BRAND TRUST-RECOGNITION
5
Proven know-how & technology
Industry benchmark for quality
Close collaboration
with customers
2
VAM® connections setting the
standard of quality and innovation for
over 50 years
Developed over 30 product lines to
meet harshest conditions
6 dedicated R&D centres in France,
Germany, Brazil and the US
Over 500 researchers and
technicians dedicated to R&D
21 22 20 16
0
20
40
2013 2014 2015 2016
Number of new patents filed
1 For example ultra deep water and pre-salt fields
In Nov. 2015, Vallourec signed a 5-year
contract with Total for OCTG
Vallourec has provided an extensive
range of premium offshore solutions
Developed innovative tubular
solutions for E&P in hard-to-
access deposits1
~80% of the products sold today
did not exist in 2009Case studyCase study
% of
revenues1.6% 1.7% 2.2% 2.2%
R&D expense (€mm)
87 96
82
60
0
50
100
2013 2014 2015 2016
2.0%
VALLOUREC INVESTOR PRESENTATION – JANUARY 2018
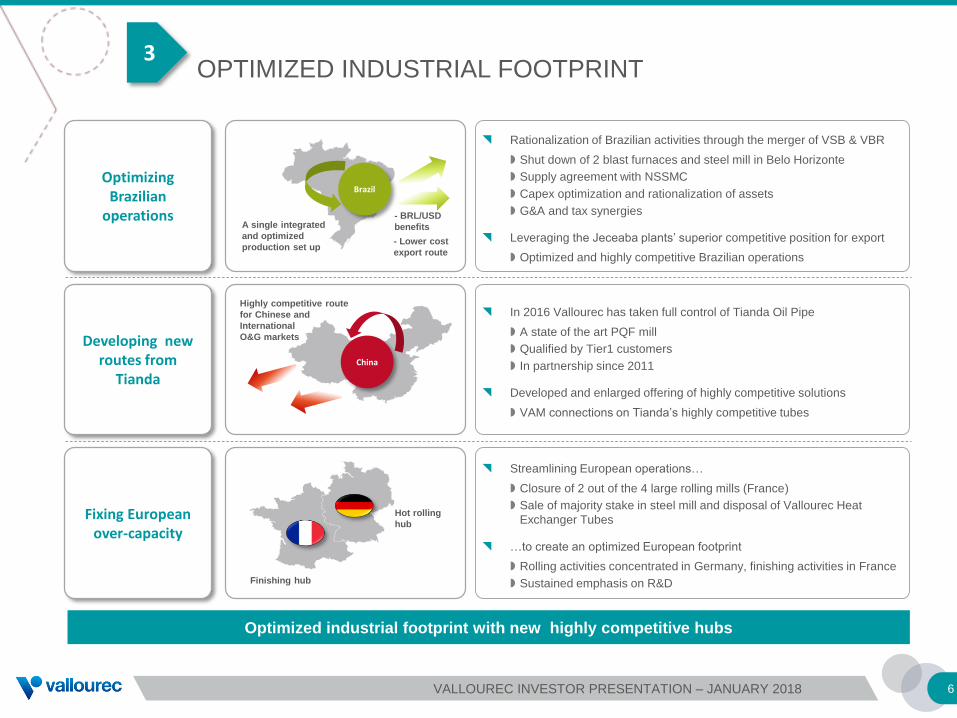
OPTIMIZED INDUSTRIAL FOOTPRINT
6
Optimizing Brazilian
operations
Developing new routes from
Tianda
Fixing European over-capacity
Optimized industrial footprint with new highly competitive hubs
Rationalization of Brazilian activities through the merger of VSB & VBR
Shut down of 2 blast furnaces and steel mill in Belo Horizonte
Supply agreement with NSSMC
Capex optimization and rationalization of assets
G&A and tax synergies
Leveraging the Jeceaba plants’ superior competitive position for export
Optimized and highly competitive Brazilian operations
In 2016 Vallourec has taken full control of Tianda Oil Pipe
A state of the art PQF mill
Qualified by Tier1 customers
In partnership since 2011
Developed and enlarged offering of highly competitive solutions
VAM connections on Tianda’s highly competitive tubes
Streamlining European operations…
Closure of 2 out of the 4 large rolling mills (France)
Sale of majority stake in steel mill and disposal of Vallourec Heat
Exchanger Tubes
…to create an optimized European footprint
Rolling activities concentrated in Germany, finishing activities in France
Sustained emphasis on R&DFinishing hub
Hot rolling
hub
Brazil
A single integrated
and optimized
production set up
- BRL/USD
benefits
China
Highly competitive route
for Chinese and
International
O&G markets
- Lower cost
export route
3
VALLOUREC INVESTOR PRESENTATION – JANUARY 2018
Steel mills
Tube mills
R&D
Finishing unit
Sales & Services office
Plantation and mine
NorthAmerica
Brazil
Europe
China
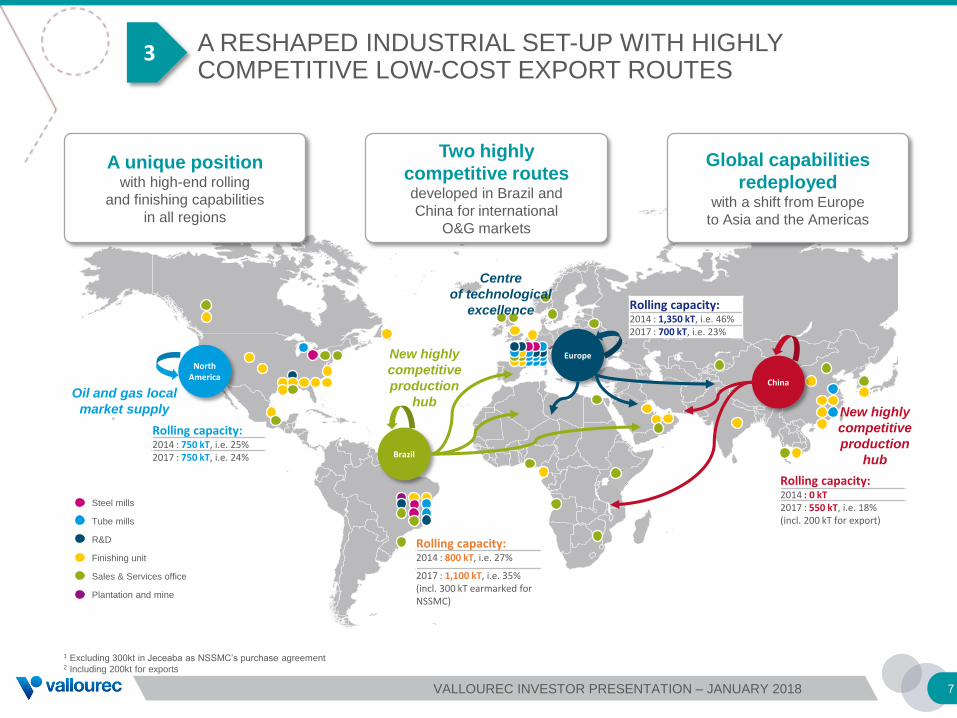
A RESHAPED INDUSTRIAL SET-UP WITH HIGHLY COMPETITIVE LOW-COST EXPORT ROUTES
7
3
A unique positionwith high-end rolling
and finishing capabilities
in all regions
Global capabilities
redeployedwith a shift from Europe
to Asia and the Americas
Two highly
competitive routesdeveloped in Brazil and
China for international
O&G markets
Oil and gas local
market supply
New highly
competitive
production
hubNew highly
competitive
production
hub
Centre
of technological
excellence
1 Excluding 300kt in Jeceaba as NSSMC’s purchase agreement2 Including 200kt for exports
Rolling capacity:2014 : 750 kT, i.e. 25%2017 : 750 kT, i.e. 24%
Rolling capacity:2014 : 800 kT, i.e. 27%
2017 : 1,100 kT, i.e. 35%(incl. 300 kT earmarked for NSSMC)
Rolling capacity:2014 : 1,350 kT, i.e. 46%2017 : 700 kT, i.e. 23%
Rolling capacity:2014 : 0 kT2017 : 550 kT, i.e. 18%(incl. 200 kT for export)
VALLOUREC INVESTOR PRESENTATION – JANUARY 2018
268
175
86
2015 2016 9M 2017
116109 106
117113
10810217%
14%15%
14% 14%
12%11%
8%
18%
Q1 2016 Q2 2016 Q3 2016 Q4 2016 Q1 2017 Q2 2017 Q3 2017
SG&A m€ % Sales
130 150
78
2015 2016 H1 2017
8
CAPEX,
in €m
SG&A,
in €m
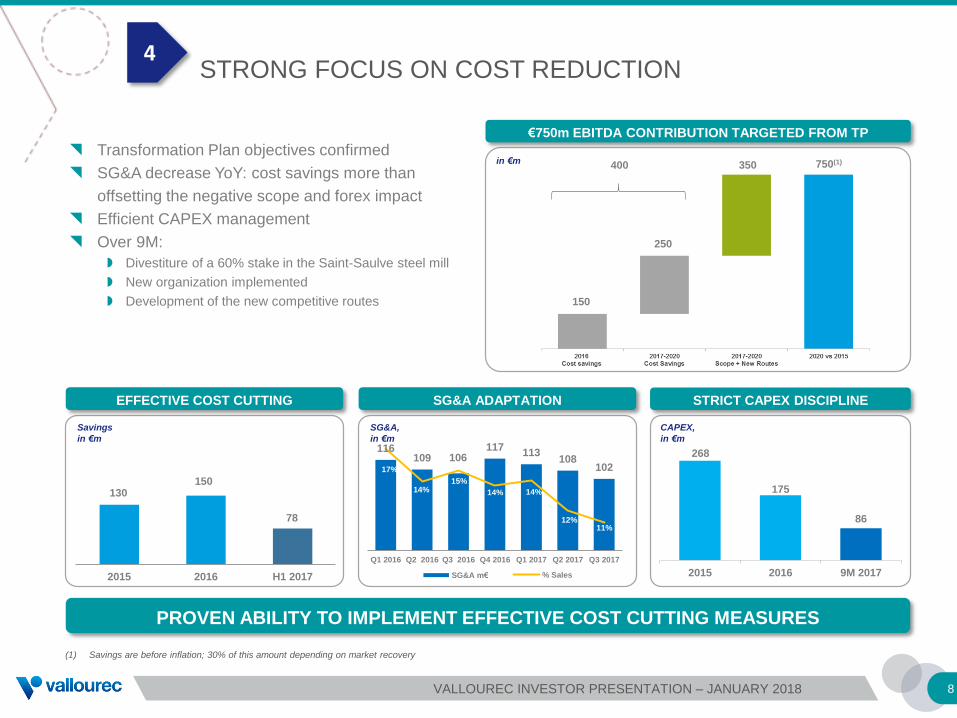
(1) Savings are before inflation; 30% of this amount depending on market recovery
Savings
in €m
150
250
350 750(1)400
€750m EBITDA CONTRIBUTION TARGETED FROM TP
EFFECTIVE COST CUTTING SG&A ADAPTATION STRICT CAPEX DISCIPLINE
PROVEN ABILITY TO IMPLEMENT EFFECTIVE COST CUTTING MEASURES
in €m Transformation Plan objectives confirmed
SG&A decrease YoY: cost savings more than
offsetting the negative scope and forex impact
Efficient CAPEX management
Over 9M:
Divestiture of a 60% stake in the Saint-Saulve steel mill
New organization implemented
Development of the new competitive routes
4STRONG FOCUS ON COST REDUCTION
VALLOUREC INVESTOR PRESENTATION – JANUARY 2018
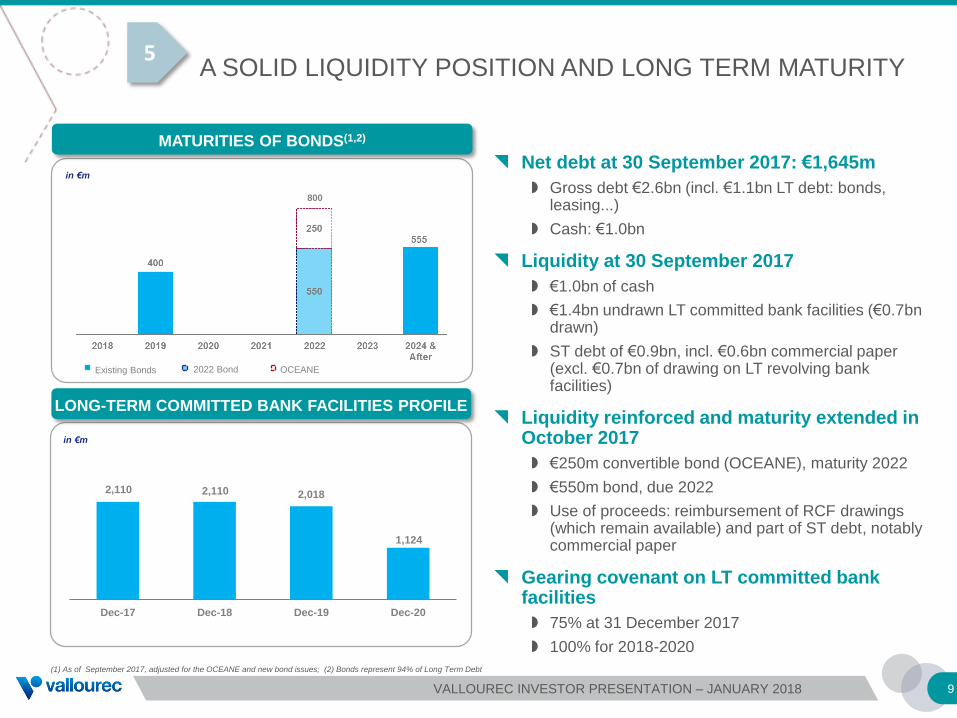
2,110 2,110 2,018
1,124
Dec-17 Dec-18 Dec-19 Dec-20
9
in €m
(1) As of September 2017, adjusted for the OCEANE and new bond issues; (2) Bonds represent 94% of Long Term Debt
LONG-TERM COMMITTED BANK FACILITIES PROFILE
Net debt at 30 September 2017: €1,645m
Gross debt €2.6bn (incl. €1.1bn LT debt: bonds, leasing...)
Cash: €1.0bn
Liquidity at 30 September 2017
€1.0bn of cash
€1.4bn undrawn LT committed bank facilities (€0.7bn drawn)
ST debt of €0.9bn, incl. €0.6bn commercial paper (excl. €0.7bn of drawing on LT revolving bank facilities)
Liquidity reinforced and maturity extended in October 2017
€250m convertible bond (OCEANE), maturity 2022
€550m bond, due 2022
Use of proceeds: reimbursement of RCF drawings (which remain available) and part of ST debt, notably commercial paper
Gearing covenant on LT committed bank facilities
75% at 31 December 2017
100% for 2018-2020
800
in €m
MATURITIES OF BONDS(1,2)
Existing Bonds OCEANE2022 Bond
5A SOLID LIQUIDITY POSITION AND LONG TERM MATURITY
VALLOUREC INVESTOR PRESENTATION – JANUARY 2018
10
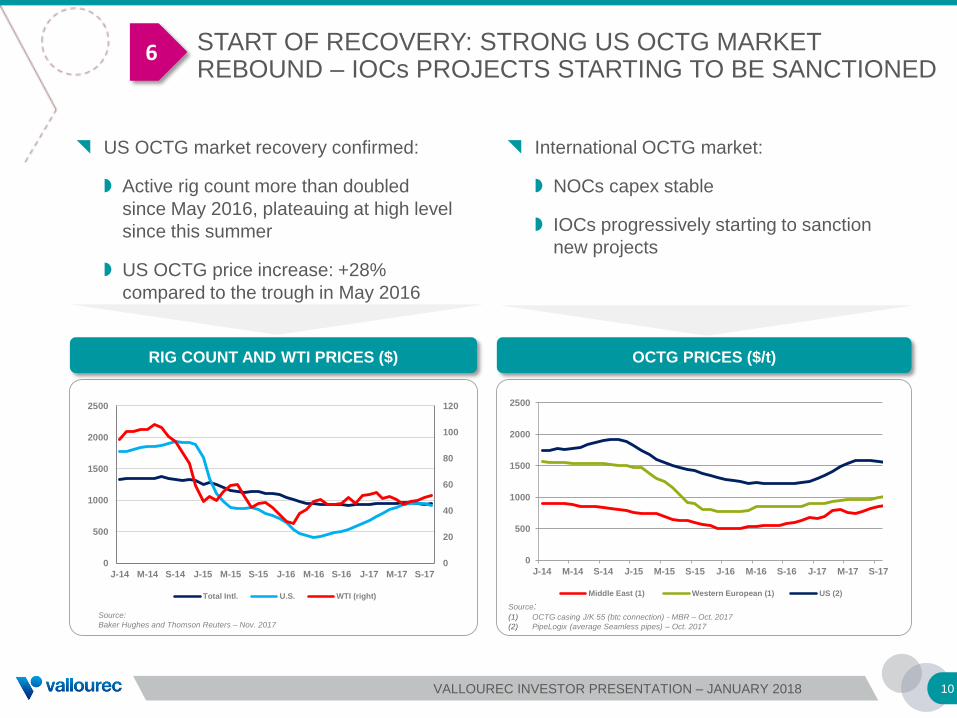
START OF RECOVERY: STRONG US OCTG MARKET REBOUND – IOCs PROJECTS STARTING TO BE SANCTIONED
6
OCTG PRICES ($/t)
Source: (1) OCTG casing J/K 55 (btc connection) - MBR – Oct. 2017
(2) PipeLogix (average Seamless pipes) – Oct. 2017
US OCTG market recovery confirmed:
Active rig count more than doubled
since May 2016, plateauing at high level
since this summer
US OCTG price increase: +28%
compared to the trough in May 2016
International OCTG market:
NOCs capex stable
IOCs progressively starting to sanction
new projects
Source:
Baker Hughes and Thomson Reuters – Nov. 2017
RIG COUNT AND WTI PRICES ($)
0
500
1000
1500
2000
2500
J-14 M-14 S-14 J-15 M-15 S-15 J-16 M-16 S-16 J-17 M-17 S-17
Middle East (1) Western European (1) US (2)
0
20
40
60
80
100
120
0
500
1000
1500
2000
2500
J-14 M-14 S-14 J-15 M-15 S-15 J-16 M-16 S-16 J-17 M-17 S-17
Total Intl. U.S. WTI (right)
VALLOUREC INVESTOR PRESENTATION – JANUARY 2018
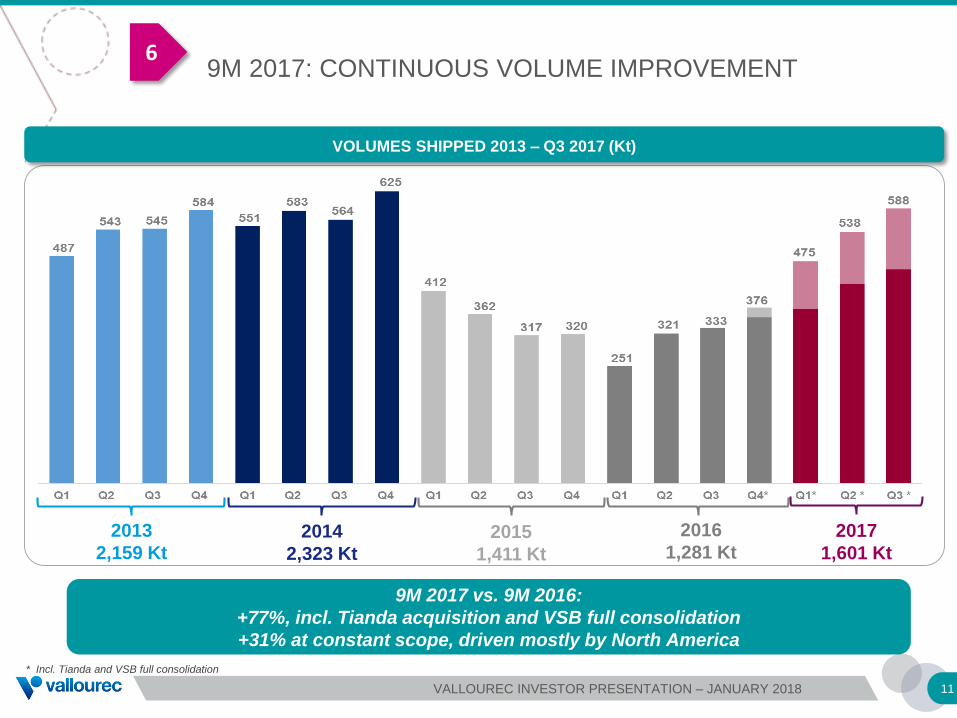
2013
2,159 Kt2014
2,323 Kt
2015
1,411 Kt
2016
1,281 Kt
* Incl. Tianda and VSB full consolidation
2017
1,601 Kt
11
VOLUMES SHIPPED 2013 – Q3 2017 (Kt)
9M 2017 vs. 9M 2016:
+77%, incl. Tianda acquisition and VSB full consolidation
+31% at constant scope, driven mostly by North America
69M 2017: CONTINUOUS VOLUME IMPROVEMENT
VALLOUREC INVESTOR PRESENTATION – JANUARY 2018
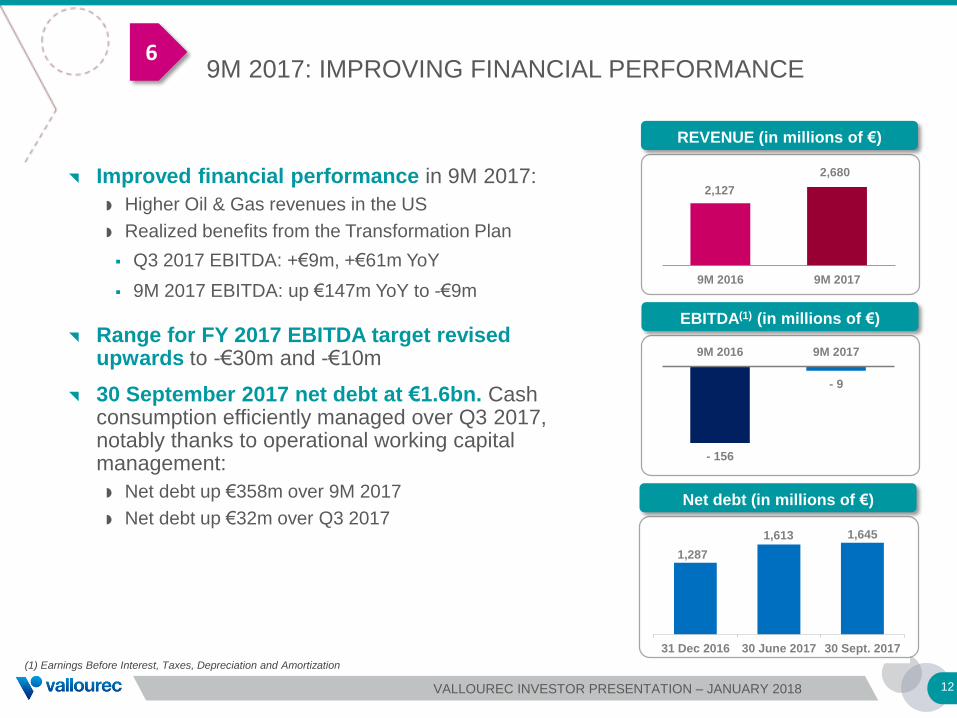
1,287
1,613 1,645
31 Dec 2016 30 June 2017 30 Sept. 2017
- 156
- 9
9M 2016 9M 2017
9M 2017: IMPROVING FINANCIAL PERFORMANCE
(1) Earnings Before Interest, Taxes, Depreciation and Amortization
Improved financial performance in 9M 2017:
Higher Oil & Gas revenues in the US
Realized benefits from the Transformation Plan
Q3 2017 EBITDA: +€9m, +€61m YoY
9M 2017 EBITDA: up €147m YoY to -€9m
Range for FY 2017 EBITDA target revised upwards to -€30m and -€10m
30 September 2017 net debt at €1.6bn. Cash consumption efficiently managed over Q3 2017, notably thanks to operational working capital management:
Net debt up €358m over 9M 2017
Net debt up €32m over Q3 2017
REVENUE (in millions of €)
6
2,127
2,680
9M 2016 9M 2017
EBITDA(1) (in millions of €)
Net debt (in millions of €)
12VALLOUREC INVESTOR PRESENTATION – JANUARY 2018
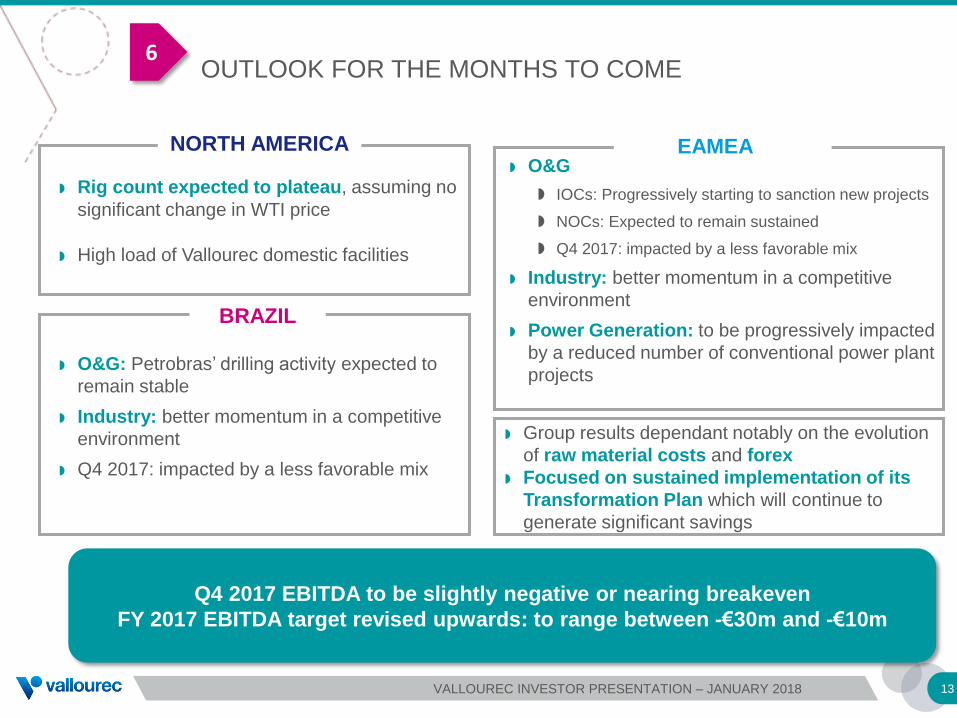
OUTLOOK FOR THE MONTHS TO COME
13
Q4 2017 EBITDA to be slightly negative or nearing breakeven
FY 2017 EBITDA target revised upwards: to range between -€30m and -€10m
BRAZIL
O&G: Petrobras’ drilling activity expected to
remain stable
Industry: better momentum in a competitive
environment
Q4 2017: impacted by a less favorable mix
NORTH AMERICA
Rig count expected to plateau, assuming no
significant change in WTI price
High load of Vallourec domestic facilities
EAMEA O&G
IOCs: Progressively starting to sanction new projects
NOCs: Expected to remain sustained
Q4 2017: impacted by a less favorable mix
Industry: better momentum in a competitive
environment
Power Generation: to be progressively impacted
by a reduced number of conventional power plant
projects
Group results dependant notably on the evolution
of raw material costs and forex
Focused on sustained implementation of its
Transformation Plan which will continue to
generate significant savings
EAMEA
6
VALLOUREC INVESTOR PRESENTATION – JANUARY 2018
Q&A
EXANE CEO CONFERENCE - JUNE 2017
APPENDIX
16
6MARKET TRENDS – US O&G MARKET
8 000
8 200
8 400
8 600
8 800
9 000
9 200
9 400
9 600
0
50
100
150
200
250
300
350
400
450
500
0
500
1 000
1 500
2 000
2 500
2011 2012 2013 2014 2015 2016 2017 Oct
US Rig Count (1) Consumption (t) / Rig/Month (rhs) (2)
Source: Baker Hughes (Nov. 2017)
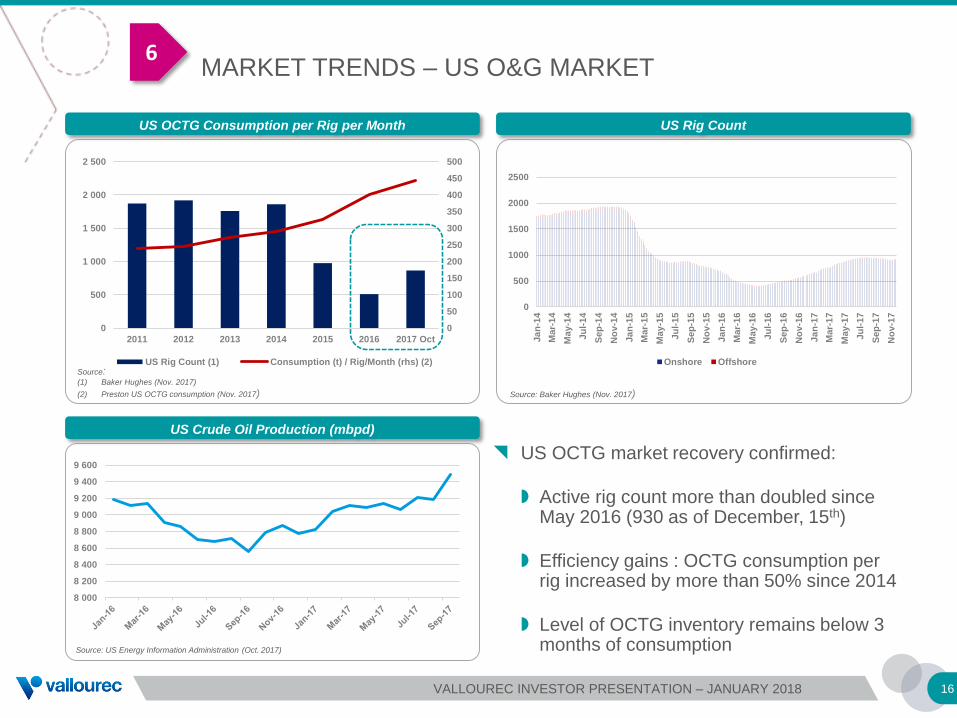
US OCTG market recovery confirmed:
Active rig count more than doubled since May 2016 (930 as of December, 15th)
Efficiency gains : OCTG consumption per rig increased by more than 50% since 2014
Level of OCTG inventory remains below 3 months of consumption
US Rig CountUS OCTG Consumption per Rig per Month
Source: (1) Baker Hughes (Nov. 2017)
(2) Preston US OCTG consumption (Nov. 2017)
Source: US Energy Information Administration (Oct. 2017)
US Crude Oil Production (mbpd)
0
500
1000
1500
2000
2500
Ja
n-1
4
Mar-
14
May
-14
Ju
l-14
Sep
-14
No
v-1
4
Ja
n-1
5
Mar-
15
May
-15
Ju
l-15
Sep
-15
No
v-1
5
Ja
n-1
6
Mar-
16
May
-16
Ju
l-16
Sep
-16
No
v-1
6
Ja
n-1
7
Mar-
17
May
-17
Ju
l-17
Sep
-17
No
v-1
7
Onshore Offshore
VALLOUREC INVESTOR PRESENTATION – JANUARY 2018
17
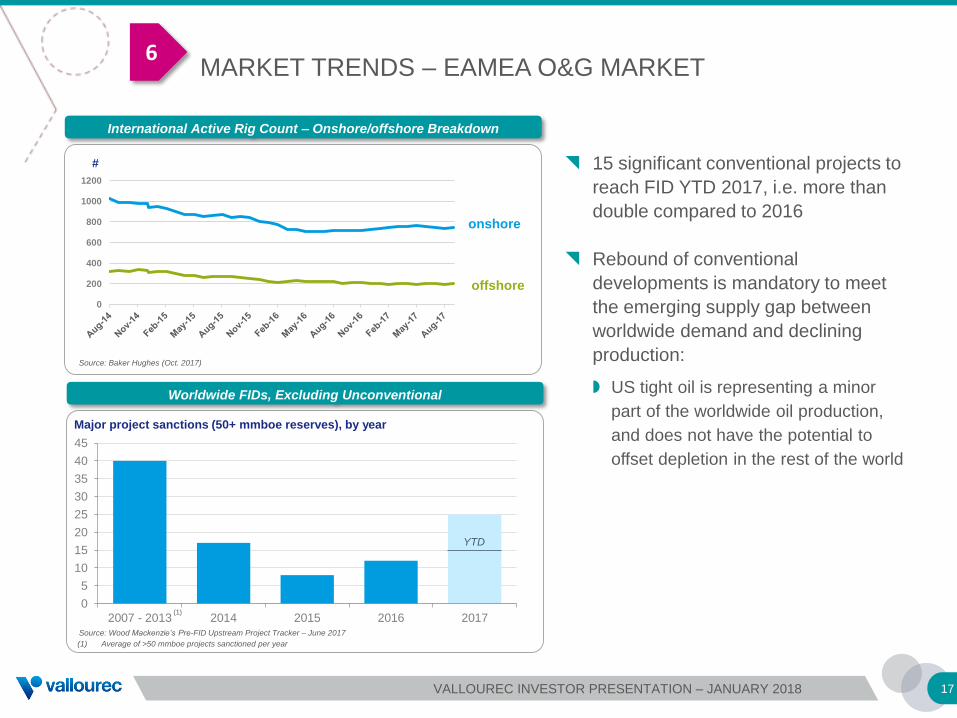
15 significant conventional projects to
reach FID YTD 2017, i.e. more than
double compared to 2016
Rebound of conventional
developments is mandatory to meet
the emerging supply gap between
worldwide demand and declining
production:
US tight oil is representing a minor
part of the worldwide oil production,
and does not have the potential to
offset depletion in the rest of the world
6MARKET TRENDS – EAMEA O&G MARKET
offshore
Worldwide FIDs, Excluding Unconventional
International Active Rig Count – Onshore/offshore Breakdown
Source: Baker Hughes (Oct. 2017)
Source: Wood Mackenzie’s Pre-FID Upstream Project Tracker – June 2017
onshore
#
0
5
10
15
20
25
30
35
40
45
2007 - 2013 2014 2015 2016 2017
Major project sanctions (50+ mmboe reserves), by year
(1) Average of >50 mmboe projects sanctioned per year
(1)
YTD
0
200
400
600
800
1000
1200
VALLOUREC INVESTOR PRESENTATION – JANUARY 2018
0,0
1,0
2,0
3,0
Dec-15 Mar-16 Jun-16 Sep-16 Dec-16 Mar-17 Jun-17 Sep-17
2016–17 for 2017 2017 for 2018
18
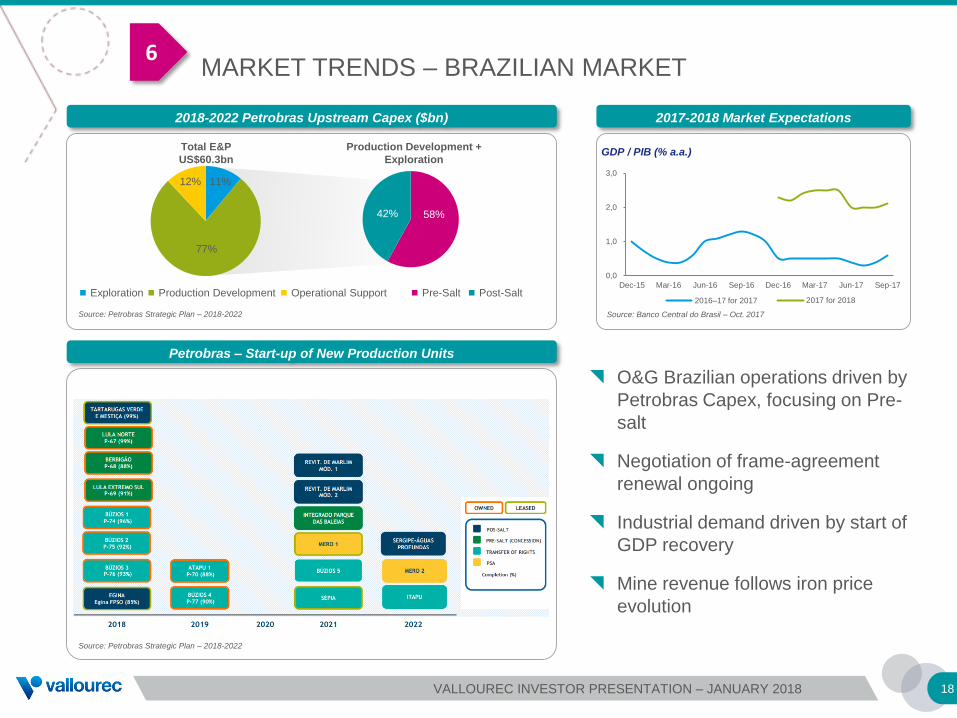
2018-2022 Petrobras Upstream Capex ($bn)
Petrobras – Start-up of New Production Units
2017-2018 Market Expectations
O&G Brazilian operations driven by
Petrobras Capex, focusing on Pre-
salt
Negotiation of frame-agreement
renewal ongoing
Industrial demand driven by start of
GDP recovery
Mine revenue follows iron price
evolution
Source: Petrobras Strategic Plan – 2018-2022
Source: Banco Central do Brasil – Oct. 2017
GDP / PIB (% a.a.)
Exploration Production Development Operational Support Post-SaltPre-Salt
Total E&P
US$60.3bn
Production Development +
Exploration
Concession
Transfer of Rights
Production Sharing
(Libra)
Source: Petrobras Strategic Plan – 2018-2022
11%
77%
12%
58%42%
6MARKET TRENDS – BRAZILIAN MARKET
VALLOUREC INVESTOR PRESENTATION – JANUARY 2018
19
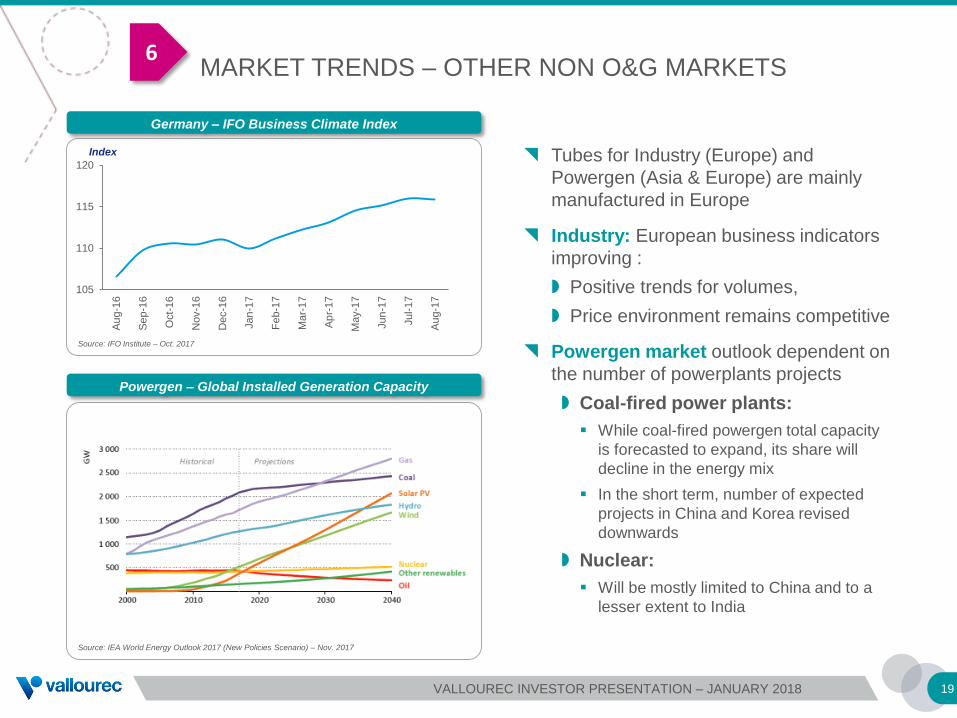
Tubes for Industry (Europe) and
Powergen (Asia & Europe) are mainly
manufactured in Europe
Industry: European business indicators
improving :
Positive trends for volumes,
Price environment remains competitive
Powergen market outlook dependent on
the number of powerplants projects
Coal-fired power plants:
While coal-fired powergen total capacity
is forecasted to expand, its share will
decline in the energy mix
In the short term, number of expected
projects in China and Korea revised
downwards
Nuclear:
Will be mostly limited to China and to a
lesser extent to India
Germany – IFO Business Climate Index
105
110
115
120
Au
g-1
6
Se
p-1
6
Oct-
16
Nov-1
6
Dec-1
6
Jan
-17
Fe
b-1
7
Ma
r-17
Ap
r-17
Ma
y-1
7
Jun
-17
Ju
l-1
7
Au
g-1
7
Index
Source: IFO Institute – Oct. 2017
6MARKET TRENDS – OTHER NON O&G MARKETS
Powergen – Global Installed Generation Capacity
Source: IEA World Energy Outlook 2017 (New Policies Scenario) – Nov. 2017
VALLOUREC INVESTOR PRESENTATION – JANUARY 2018
VALLOUREC AT A GLANCE
20
Key clients
Key segments
Revenue share
(FY 2016)
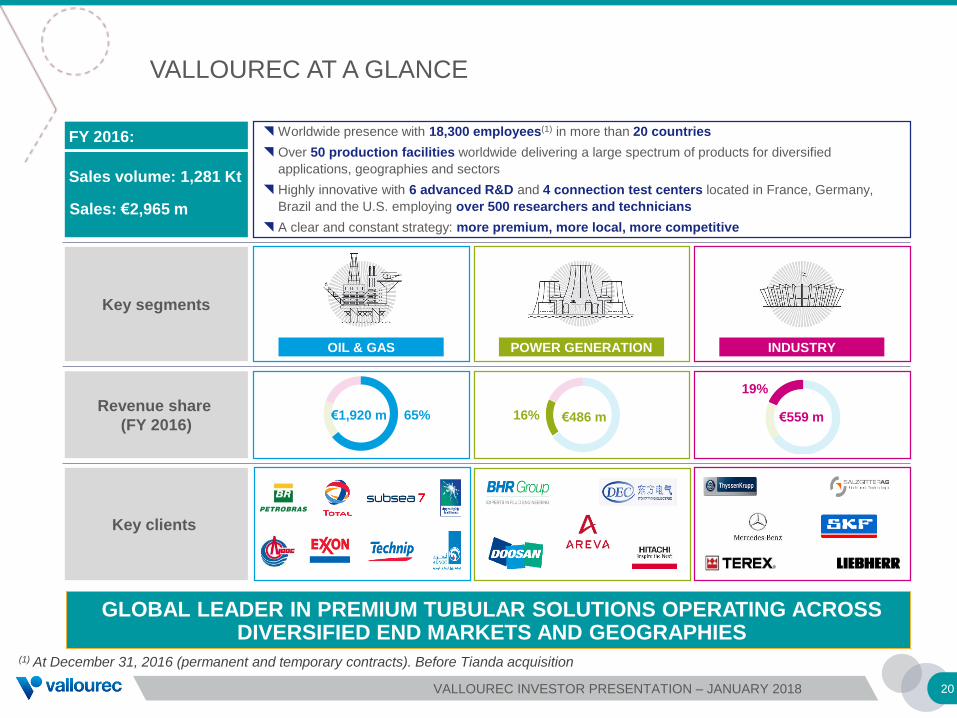
Worldwide presence with 18,300 employees(1) in more than 20 countries
Over 50 production facilities worldwide delivering a large spectrum of products for diversified
applications, geographies and sectors
Highly innovative with 6 advanced R&D and 4 connection test centers located in France, Germany,
Brazil and the U.S. employing over 500 researchers and technicians
A clear and constant strategy: more premium, more local, more competitive
FY 2016:
Sales volume: 1,281 Kt
Sales: €2,965 m
65% 16%
19%
€559 m€486 m€1,920 m
OIL & GAS POWER GENERATION INDUSTRY
(1) At December 31, 2016 (permanent and temporary contracts). Before Tianda acquisition
GLOBAL LEADER IN PREMIUM TUBULAR SOLUTIONS OPERATING ACROSS DIVERSIFIED END MARKETS AND GEOGRAPHIES
VALLOUREC INVESTOR PRESENTATION – JANUARY 2018
VALLOUREC PRODUCT OFFERING AND APPLICATIONS
21
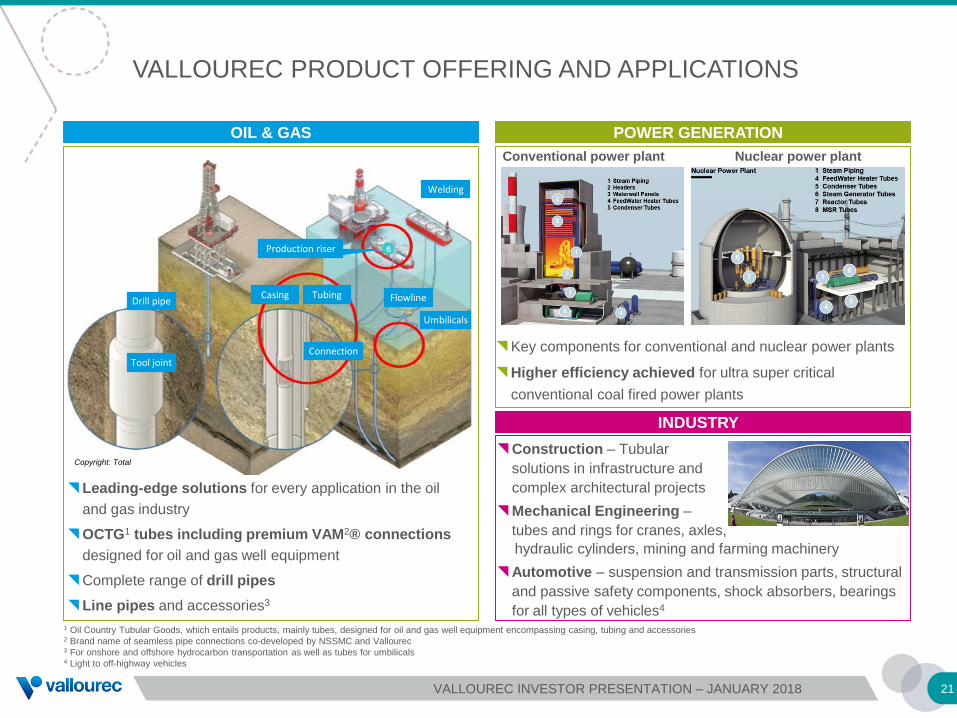
OIL & GAS POWER GENERATION
Key components for conventional and nuclear power plants
Higher efficiency achieved for ultra super critical
conventional coal fired power plants
Drill pipe
Tool joint
Casing Tubing
Connection
Production riser
Flowline
Umbilicals
Welding
Conventional power plant Nuclear power plant
Leading-edge solutions for every application in the oil
and gas industry
OCTG1 tubes including premium VAM2® connections
designed for oil and gas well equipment
Complete range of drill pipes
Line pipes and accessories3
INDUSTRY
Construction – Tubular
solutions in infrastructure and
complex architectural projects
Mechanical Engineering –
tubes and rings for cranes, axles,
• hydraulic cylinders, mining and farming machinery
Automotive – suspension and transmission parts, structural
and passive safety components, shock absorbers, bearings
for all types of vehicles4
Copyright: Total
1 Oil Country Tubular Goods, which entails products, mainly tubes, designed for oil and gas well equipment encompassing casing, tubing and accessories2 Brand name of seamless pipe connections co-developed by NSSMC and Vallourec 3 For onshore and offshore hydrocarbon transportation as well as tubes for umbilicals4 Light to off-highway vehicles
VALLOUREC INVESTOR PRESENTATION – JANUARY 2018
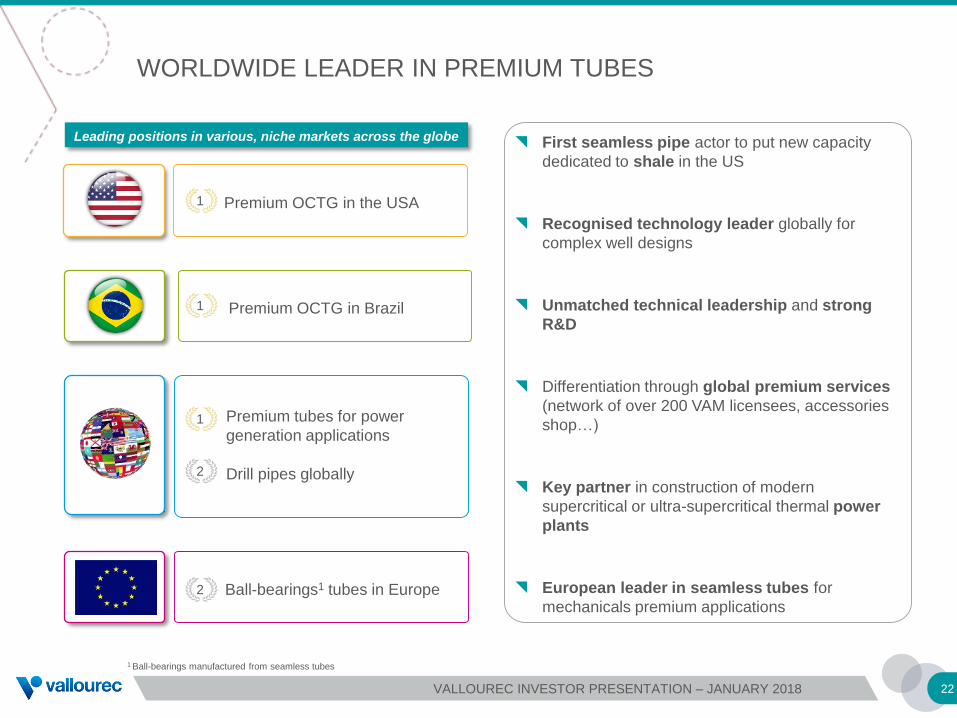
WORLDWIDE LEADER IN PREMIUM TUBES
22
First seamless pipe actor to put new capacity
dedicated to shale in the US
Recognised technology leader globally for
complex well designs
Unmatched technical leadership and strong
R&D
Differentiation through global premium services
(network of over 200 VAM licensees, accessories
shop…)
Key partner in construction of modern
supercritical or ultra-supercritical thermal power
plants
European leader in seamless tubes for
mechanicals premium applications
Leading positions in various, niche markets across the globe
1 Ball-bearings manufactured from seamless tubes
Premium OCTG in the USA1
Premium OCTG in Brazil1
Ball-bearings1 tubes in Europe2
Premium tubes for power
generation applications
Drill pipes globally2
1
VALLOUREC INVESTOR PRESENTATION – JANUARY 2018
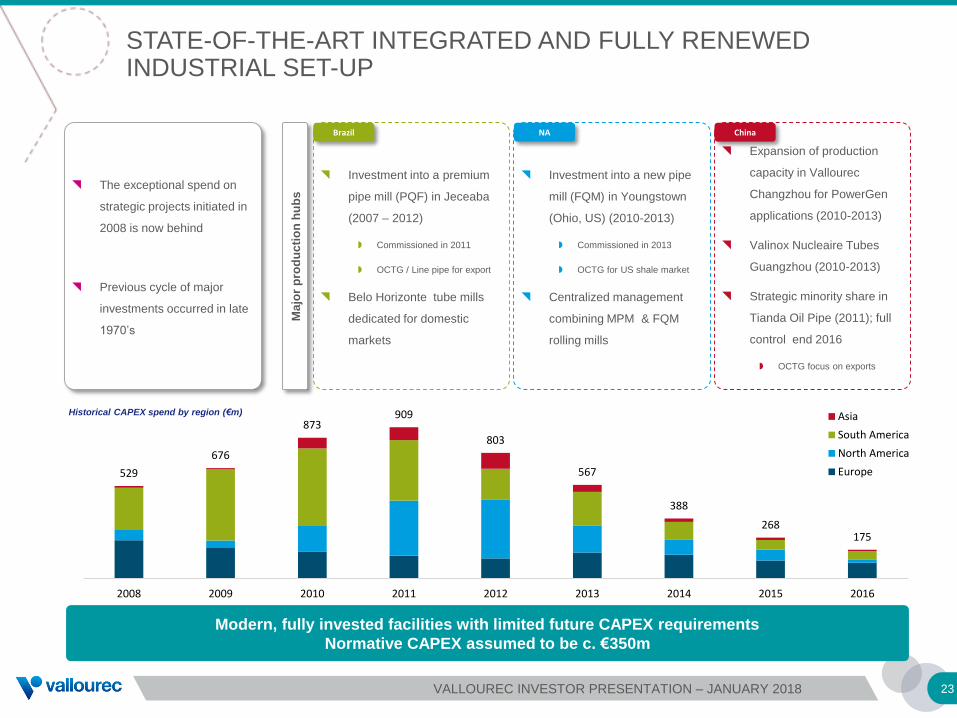
STATE-OF-THE-ART INTEGRATED AND FULLY RENEWED INDUSTRIAL SET-UP
23
529
676
873909
803
567
388
268175
2008 2009 2010 2011 2012 2013 2014 2015 2016
Asia
South America
North America
Europe
Modern, fully invested facilities with limited future CAPEX requirements
Normative CAPEX assumed to be c. €350m
Investment into a premium
pipe mill (PQF) in Jeceaba
(2007 – 2012)
Commissioned in 2011
OCTG / Line pipe for export
Belo Horizonte tube mills
dedicated for domestic
markets
The exceptional spend on
strategic projects initiated in
2008 is now behind
Previous cycle of major
investments occurred in late
1970’s
Investment into a new pipe
mill (FQM) in Youngstown
(Ohio, US) (2010-2013)
Commissioned in 2013
OCTG for US shale market
Centralized management
combining MPM & FQM
rolling mills
Expansion of production
capacity in Vallourec
Changzhou for PowerGen
applications (2010-2013)
Valinox Nucleaire Tubes
Guangzhou (2010-2013)
Strategic minority share in
Tianda Oil Pipe (2011); full
control end 2016
OCTG focus on exports
Ma
jor
pro
du
cti
on
hu
bs
Historical CAPEX spend by region (€m)
Brazil NA China
VALLOUREC INVESTOR PRESENTATION – JANUARY 2018
24
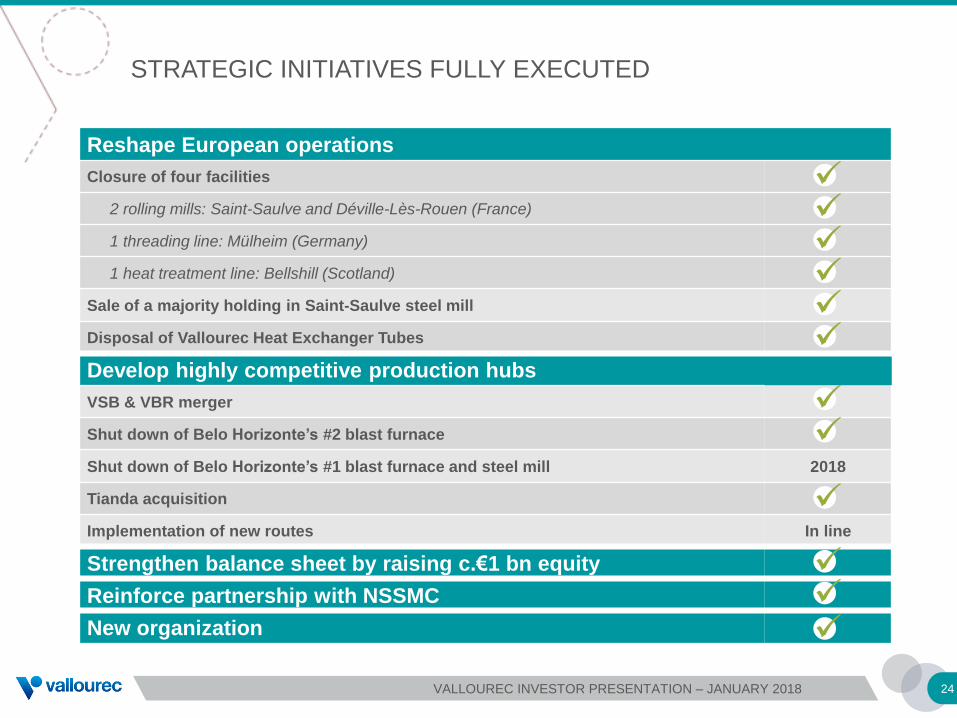
STRATEGIC INITIATIVES FULLY EXECUTED
Reshape European operations
Closure of four facilities
2 rolling mills: Saint-Saulve and Déville-Lès-Rouen (France)
1 threading line: Mülheim (Germany)
1 heat treatment line: Bellshill (Scotland)
Sale of a majority holding in Saint-Saulve steel mill
Disposal of Vallourec Heat Exchanger Tubes
Develop highly competitive production hubs
VSB & VBR merger
Shut down of Belo Horizonte’s #2 blast furnace
Shut down of Belo Horizonte’s #1 blast furnace and steel mill 2018
Tianda acquisition
Implementation of new routes In line
Strengthen balance sheet by raising c.€1 bn equity
Reinforce partnership with NSSMC
New organization
VALLOUREC INVESTOR PRESENTATION – JANUARY 2018
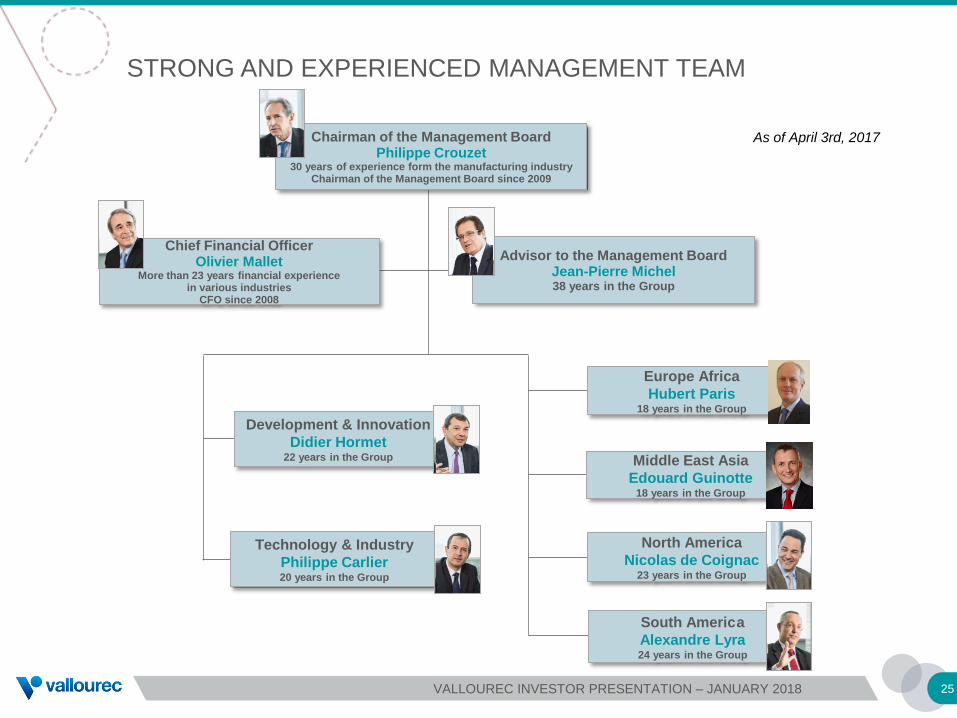
STRONG AND EXPERIENCED MANAGEMENT TEAM
Chairman of the Management BoardPhilippe Crouzet
30 years of experience form the manufacturing industryChairman of the Management Board since 2009
Chief Financial OfficerOlivier Mallet
More than 23 years financial experience in various industries
CFO since 2008
Advisor to the Management BoardJean-Pierre Michel38 years in the Group
Technology & Industry
Philippe Carlier20 years in the Group
Development & Innovation
Didier Hormet22 years in the Group
Europe Africa
Hubert Paris18 years in the Group
Middle East Asia
Edouard Guinotte18 years in the Group
South America
Alexandre Lyra24 years in the Group
North America
Nicolas de Coignac23 years in the Group
As of April 3rd, 2017
25VALLOUREC INVESTOR PRESENTATION – JANUARY 2018

Q3 / 9M 2017 RESULTS
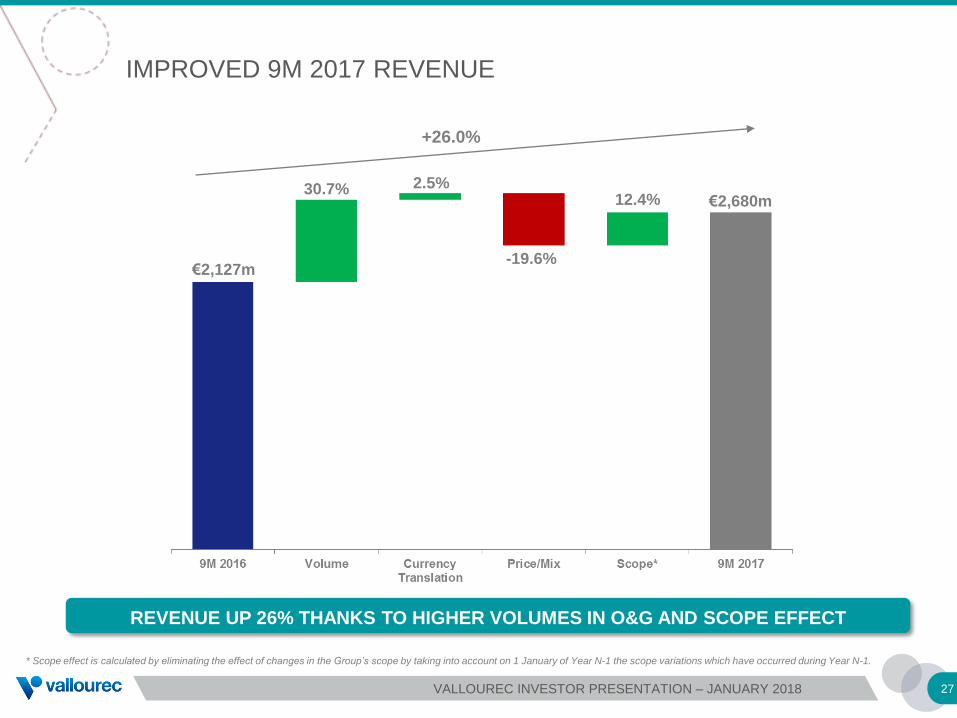
IMPROVED 9M 2017 REVENUE
€2,127m
30.7% 2.5%
-19.6%
12.4%
+26.0%
* Scope effect is calculated by eliminating the effect of changes in the Group’s scope by taking into account on 1 January of Year N-1 the scope variations which have occurred during Year N-1.
27
€2,680m
REVENUE UP 26% THANKS TO HIGHER VOLUMES IN O&G AND SCOPE EFFECT
VALLOUREC INVESTOR PRESENTATION – JANUARY 2018
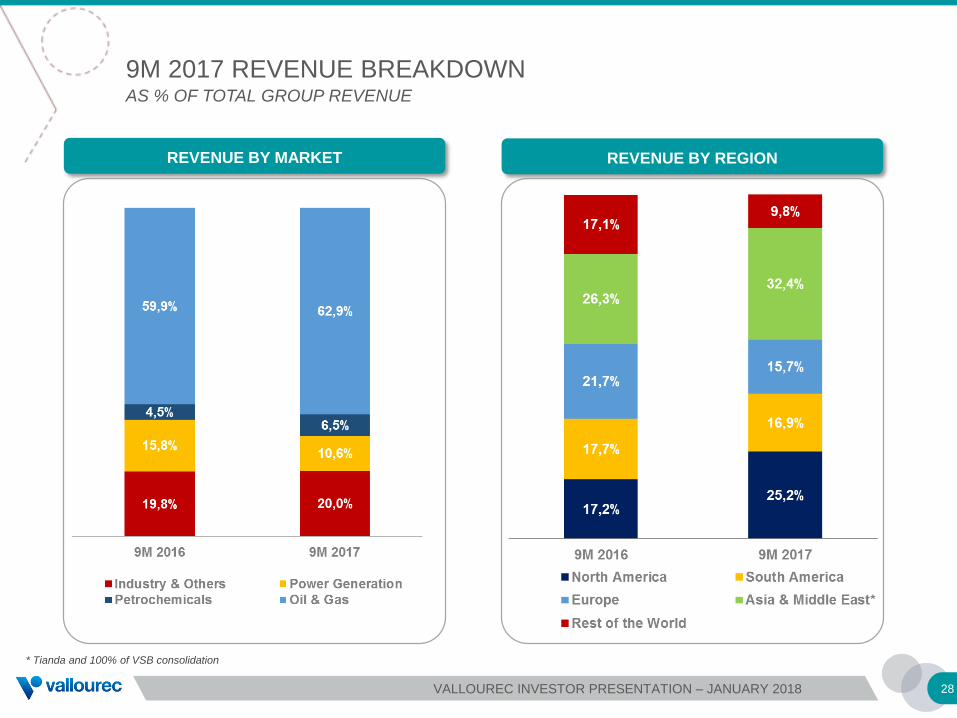
9M 2017 REVENUE BREAKDOWNAS % OF TOTAL GROUP REVENUE
* Tianda and 100% of VSB consolidation
28
REVENUE BY MARKET REVENUE BY REGION
VALLOUREC INVESTOR PRESENTATION – JANUARY 2018
* 9M 2017 versus 9M 2016
** at constant scope and exchange rates
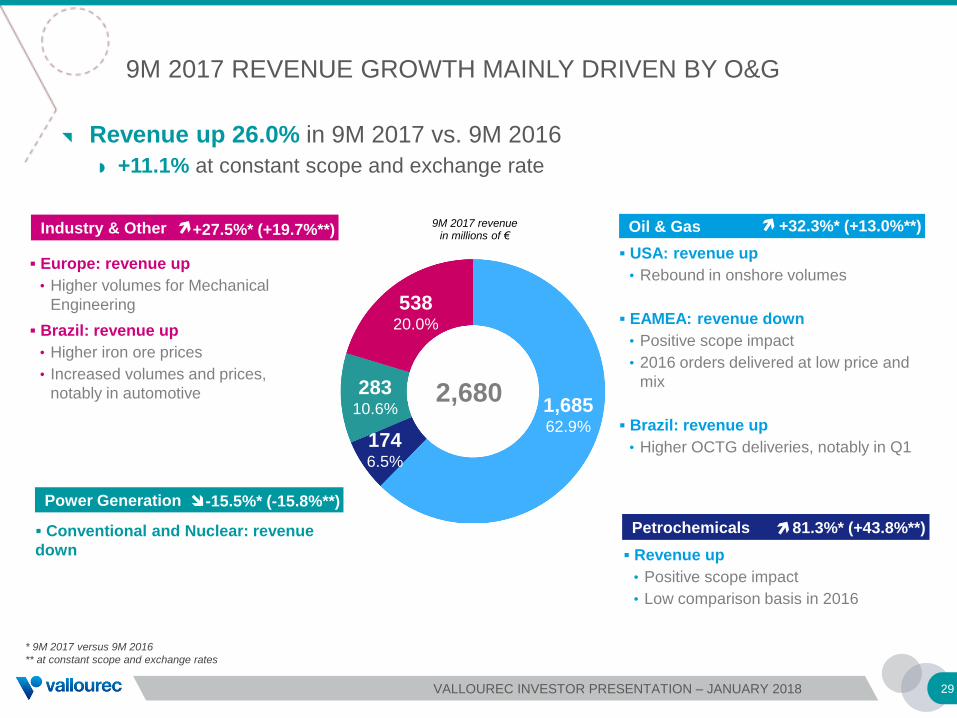
USA: revenue up
• Rebound in onshore volumes
EAMEA: revenue down
• Positive scope impact
• 2016 orders delivered at low price and
mix
Brazil: revenue up
• Higher OCTG deliveries, notably in Q1
Europe: revenue up
• Higher volumes for Mechanical
Engineering
Brazil: revenue up
• Higher iron ore prices
• Increased volumes and prices,
notably in automotive
Oil & GasIndustry & Other
Conventional and Nuclear: revenue
down
+27.5%* (+19.7%**)
Power Generation
Petrochemicals
+32.3%* (+13.0%**)
-15.5%* (-15.8%**)
81.3%* (+43.8%**)
53820.0%
28310.6%
1746.5%
1,68562.9%
2,680
9M 2017 REVENUE GROWTH MAINLY DRIVEN BY O&G
9M 2017 revenuein millions of €
Revenue up
• Positive scope impact
• Low comparison basis in 2016
Revenue up 26.0% in 9M 2017 vs. 9M 2016
+11.1% at constant scope and exchange rate
29VALLOUREC INVESTOR PRESENTATION – JANUARY 2018
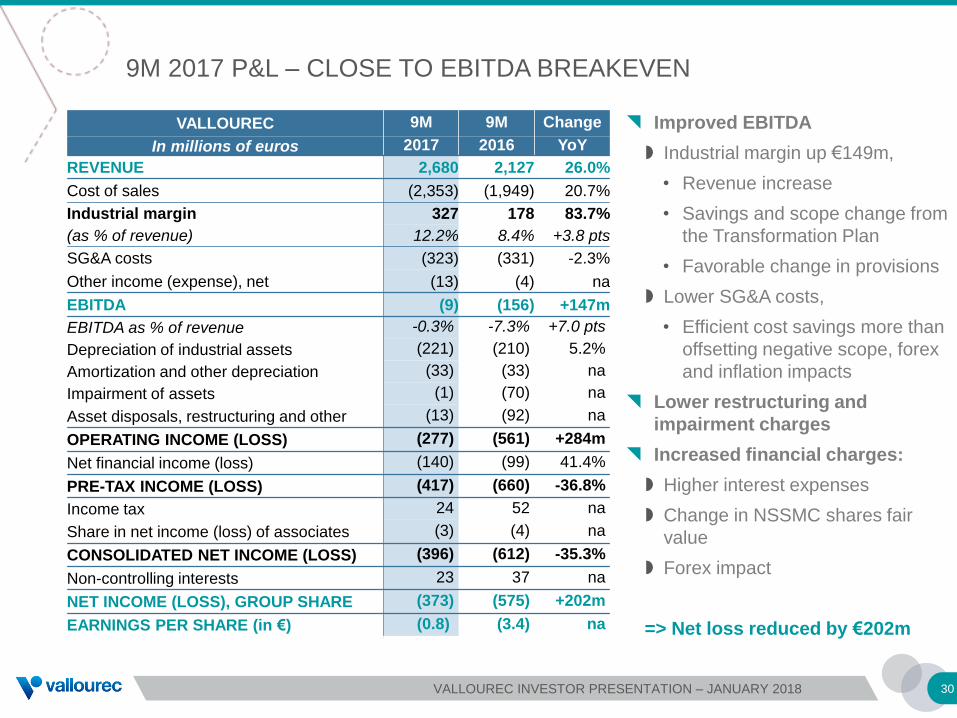
9M 2017 P&L – CLOSE TO EBITDA BREAKEVEN
VALLOUREC 9M 9M Change
In millions of euros 2017 2016 YoY
REVENUE 2,680 2,127 26.0%
Cost of sales (2,353) (1,949) 20.7%
Industrial margin 327 178 83.7%
(as % of revenue) 12.2% 8.4% +3.8 pts
SG&A costs (323) (331) -2.3%
Other income (expense), net (13) (4) na
EBITDA (9) (156) +147m
EBITDA as % of revenue -0.3% -7.3% +7.0 pts
Depreciation of industrial assets (221) (210) 5.2%
Amortization and other depreciation (33) (33) na
Impairment of assets (1) (70) na
Asset disposals, restructuring and other (13) (92) na
OPERATING INCOME (LOSS) (277) (561) +284m
Net financial income (loss) (140) (99) 41.4%
PRE-TAX INCOME (LOSS) (417) (660) -36.8%
Income tax 24 52 na
Share in net income (loss) of associates (3) (4) na
CONSOLIDATED NET INCOME (LOSS) (396) (612) -35.3%
Non-controlling interests 23 37 na
NET INCOME (LOSS), GROUP SHARE (373) (575) +202m
EARNINGS PER SHARE (in €) (0.8) (3.4) na
30
Improved EBITDA
Industrial margin up €149m,
• Revenue increase
• Savings and scope change from
the Transformation Plan
• Favorable change in provisions
Lower SG&A costs,
• Efficient cost savings more than
offsetting negative scope, forex
and inflation impacts
Lower restructuring and
impairment charges
Increased financial charges:
Higher interest expenses
Change in NSSMC shares fair
value
Forex impact
=> Net loss reduced by €202m
VALLOUREC INVESTOR PRESENTATION – JANUARY 2018
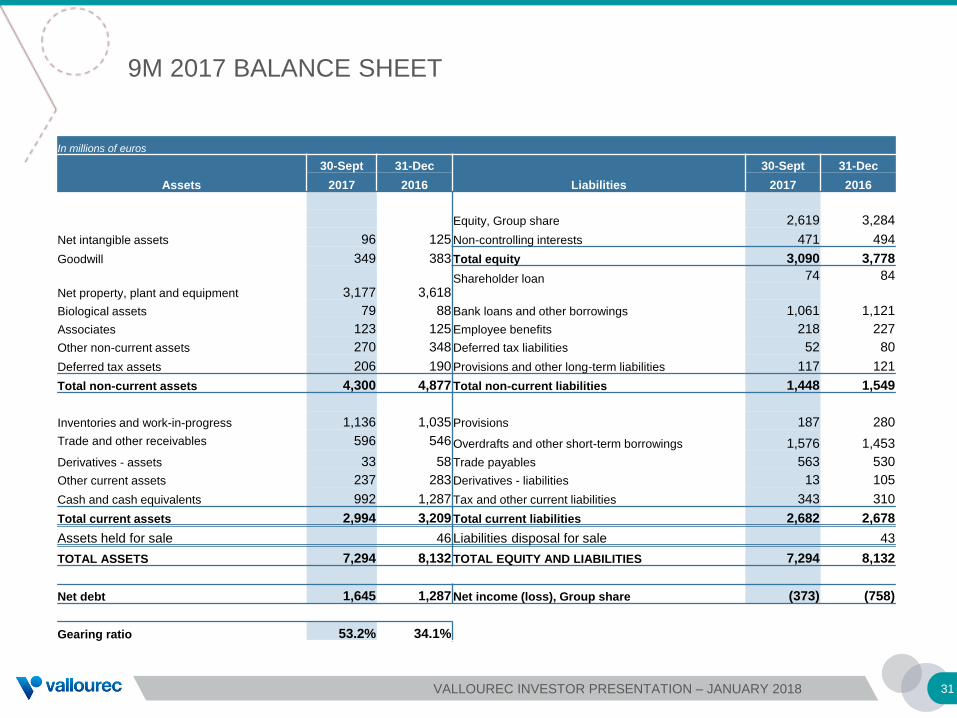
9M 2017 BALANCE SHEET
In millions of euros
Assets
30-Sept 31-Dec
Liabilities
30-Sept 31-Dec
2017 2016 2017 2016
Equity, Group share 2,619 3,284
Net intangible assets 96 125 Non-controlling interests 471 494
Goodwill 349 383 Total equity 3,090 3,778
Net property, plant and equipment 3,177 3,618Shareholder loan 74 84
Biological assets 79 88 Bank loans and other borrowings 1,061 1,121
Associates 123 125 Employee benefits 218 227
Other non-current assets 270 348 Deferred tax liabilities 52 80
Deferred tax assets 206 190 Provisions and other long-term liabilities 117 121
Total non-current assets 4,300 4,877 Total non-current liabilities 1,448 1,549
Inventories and work-in-progress 1,136 1,035 Provisions 187 280
Trade and other receivables 596 546 Overdrafts and other short-term borrowings 1,576 1,453
Derivatives - assets 33 58 Trade payables 563 530
Other current assets 237 283 Derivatives - liabilities 13 105
Cash and cash equivalents 992 1,287 Tax and other current liabilities 343 310
Total current assets 2,994 3,209 Total current liabilities 2,682 2,678
Assets held for sale 46 Liabilities disposal for sale 43
TOTAL ASSETS 7,294 8,132 TOTAL EQUITY AND LIABILITIES 7,294 8,132
Net debt 1,645 1,287 Net income (loss), Group share (373) (758)
Gearing ratio 53.2% 34.1%
31VALLOUREC INVESTOR PRESENTATION – JANUARY 2018
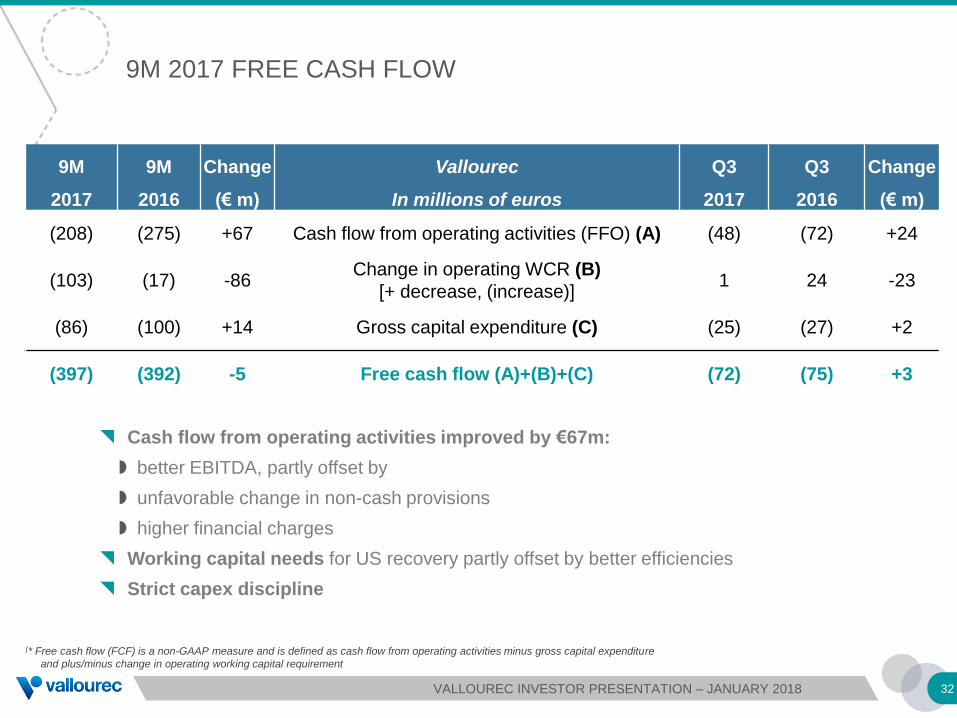
9M 2017 FREE CASH FLOW
(* Free cash flow (FCF) is a non-GAAP measure and is defined as cash flow from operating activities minus gross capital expenditure
and plus/minus change in operating working capital requirement
9M 9M Change Vallourec Q3 Q3 Change
2017 2016 (€ m) In millions of euros 2017 2016 (€ m)
(208) (275) +67 Cash flow from operating activities (FFO) (A) (48) (72) +24
(103) (17) -86Change in operating WCR (B)
[+ decrease, (increase)]1 24 -23
(86) (100) +14 Gross capital expenditure (C) (25) (27) +2
(397) (392) -5 Free cash flow (A)+(B)+(C) (72) (75) +3
32
Cash flow from operating activities improved by €67m:
better EBITDA, partly offset by
unfavorable change in non-cash provisions
higher financial charges
Working capital needs for US recovery partly offset by better efficiencies
Strict capex discipline
VALLOUREC INVESTOR PRESENTATION – JANUARY 2018
1 874 1 825 1 805 2 038
1 318 1 372 1 378
2011 2012 2013 2014 2015 2016 LTM Jun-17
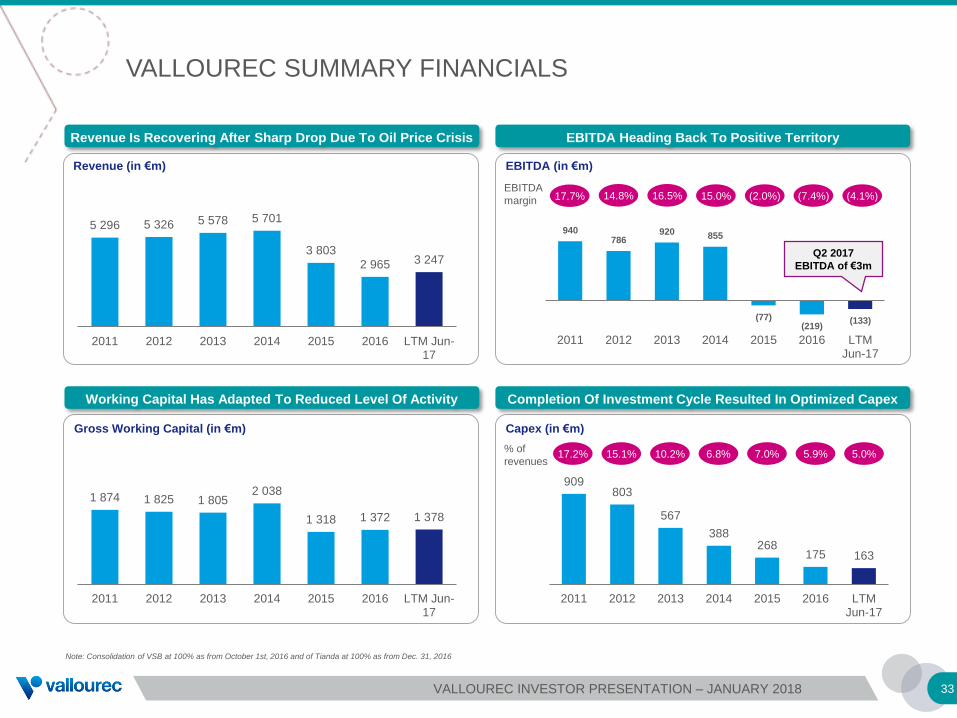
VALLOUREC SUMMARY FINANCIALS
33
909 803
567
388 268
175 163
2011 2012 2013 2014 2015 2016 LTMJun-17
% of
revenues 17.2% 15.1% 10.2% 6.8% 7.0% 5.9%
5 296 5 326 5 578 5 701
3 803
2 965 3 247
2011 2012 2013 2014 2015 2016 LTM Jun-17
940 786
920 855
(77)(219)
(133)
2011 2012 2013 2014 2015 2016 LTMJun-17
EBITDA
margin 17.7% 14.8% 16.5% 15.0% (2.0%) (7.4%)
Revenue (in €m) EBITDA (in €m)
Gross Working Capital (in €m) Capex (in €m)
Note: Consolidation of VSB at 100% as from October 1st, 2016 and of Tianda at 100% as from Dec. 31, 2016
(4.1%)
5.0%
Q2 2017
EBITDA of €3m
Revenue Is Recovering After Sharp Drop Due To Oil Price Crisis EBITDA Heading Back To Positive Territory
Working Capital Has Adapted To Reduced Level Of Activity Completion Of Investment Cycle Resulted In Optimized Capex
VALLOUREC INVESTOR PRESENTATION – JANUARY 2018
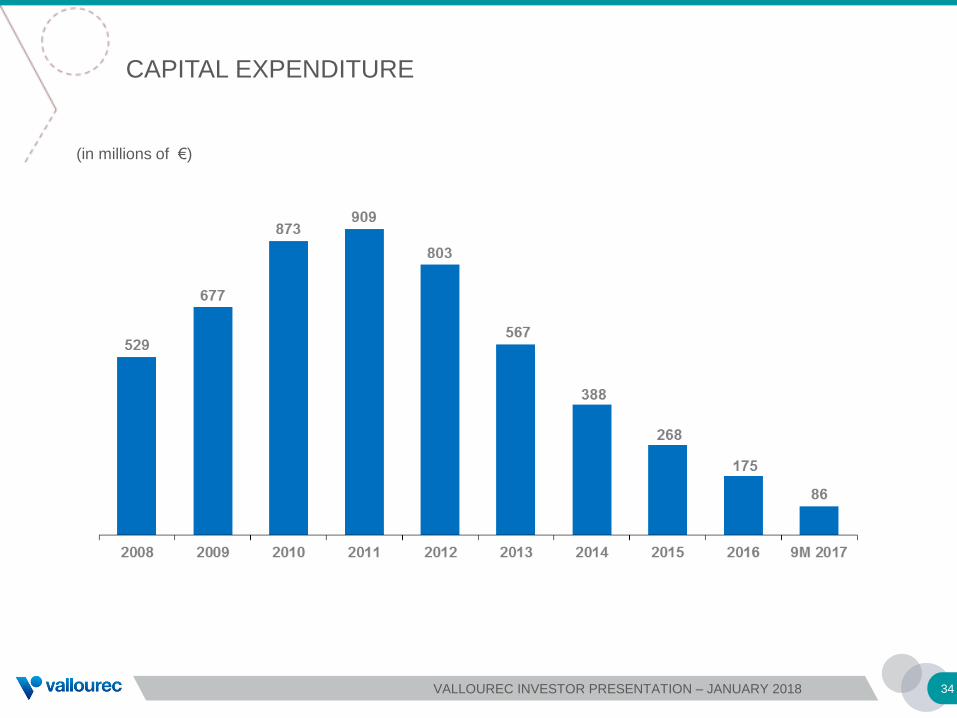
CAPITAL EXPENDITURE
(in millions of €)
34VALLOUREC INVESTOR PRESENTATION – JANUARY 2018
EURONEXT PARIS: ISIN CODE: FR0000120354, TICKER: VK
USA: AMERICAN DEPOSITARY RECEIPT (ADR) - ISIN CODE: US92023R2094, TICKER: VLOWY
Investor Relations Contact - Vallourec Group
Tel: +33 1 49 09 39 76
Email: [email protected]
www.vallourec.com