Embed Size (px)
Citation preview

AP
CC
a
ARRA
1
rlGd(OwsotAa
rAura
sre
(
0h
Nuclear Engineering and Design 248 (2012) 282– 292
Contents lists available at SciVerse ScienceDirect
Nuclear Engineering and Design
jo u r n al hom epage : www.elsev ier .com/ locate /nucengdes
RI3SG: Aerosol retention in the secondary side of a steam generator.art II: Model validation and uncertainty analysis
laudia Lopez ∗, Luis E. Herranz1
IEMAT, Unit of Nuclear Safety Research, Av. Complutense, 22, 28040 Madrid, Spain
r t i c l e i n f o
rticle history:eceived 7 June 2011eceived in revised form 16 March 2012
a b s t r a c t
A large body of data has been gathered in the last decade through the EU-SGTR, ARTIST and ARTIST2 projects for aerosol retention in the steam generator during SGTR severe accident sequences. At the
ccepted 23 March 2012same time the attempt to extend the analytical capability has resulted in models that need to be validated.The ARI3SG is one of such developments and it has been built to estimate the aerosol retention in thebreak stage of a “dry” steam generator. This paper assesses the ARI3SG predictability by comparing itsestimates to open data and by analyzing the effect of associated uncertainties. Datamodel comparisonhas been shown to be satisfactory and highlight the potential use of an ARI3SG-like formulation in systemcodes.
. Introduction
The EU-SGTR, ARTIST and ARTIST 2 investigation projects haveesulted in a sound and comprehensive database, in many regardsinked to the severe accident SGTR sequences (Auvinen et al., 2005;üntay et al., 2004; Lind et al., 2008). In addition, some theoreticalevelopments have also been conducted and reported elsewhereYasmine, 2008; Herranz et al., 2007; Herranz and Lopez, 2012).ne of such analytical achievements has been the ARI3SG model,hich addresses the aerosol retention in the break stage of a “dry”
team generator. A thorough description of its major features andf the verification conducted has been given in the first part ofhe present paper (Herranz and Lopez, 2012). Here the focus is onRI3SG validation, with particular attention to the effect of associ-ted uncertainties on the ARI3SG results.
The semi-empiric nature of ARI3SG makes it dependent on cor-elations affected by uncertainties. Likewise, the data required byRI3SG as input (i.e., particle density, velocity and size) are alsoncertain. This suggests conducting an uncertainty analysis as theight tool that, along with estimates–data comparison, will provide
sound assessment of the actual model predictability.As a part of the large body of data produced by SGTR and ARTIST,
ome experiments have specifically targeted to measure aerosoletention in the break stage of a dry steam generator (Herranzt al., 2006; Sánchez-Velasco et al., 2010). Even though limited
∗ Corresponding author. Tel.: +34 913466236; fax: +34 913466233.E-mail addresses: [email protected] (C. Lopez), [email protected]
L.E. Herranz).1 Tel.: +34 913466219; fax: +34 913466233.
029-5493/$ – see front matter © 2012 Elsevier B.V. All rights reserved.ttp://dx.doi.org/10.1016/j.nucengdes.2012.03.033
© 2012 Elsevier B.V. All rights reserved.
in the variable ranges covered in the experimental matrixes ofthe SGTR and ARTIST, a good number of data were obtained as afunction of the inlet gas flow rate and particle nature. All thosedata have been used in the work here described.
In short, this article describes the validation of the ARI3SG codeby comparing its estimates to the available databases and by tak-ing into account the effect of the embedded uncertainties in theinput data and the correlations used. Previous reading of the firstpart of this article is highly recommended for those who, besidesbeing interested in ARI3SG performance, want to dig in the modelapproach and equations.
2. The ARI3SG model
ARI3SG is a semi-empirical, Lagrangian model that estimates theaerosol retention efficiency (�TB) within the break stage of a water-empty steam generator (Herranz and Lopez, 2012). It is based onthe filter concept: a particle-laden gas flowing through a bundleof “obstacles” undergoing the action of several forces that tend toclean it up by removing particles on the obstacles’ surfaces. Thisapproach entails key assumptions and approximations eventuallydriving to an integral expression that essentially depends on gas jetpenetration (Nt), geometry (dt, s, ˛) and individual tube collectionefficiency (�ST):
�TB = 1 − exp
{−1
1 − ˛·[
1 −Nt∏(
1 − dt
s + dt· �ST(i)
)]}(1)
i=1
Herranz and Lopez (2012) thoroughly describe the model in thefirst part of this article. Nonetheless, in order to make this paperself-consistent, a short overview is given next.

C. Lopez, L.E. Herranz / Nuclear Engineerin
Nomenclature
A areaAMMD aerodynamic mass median diameterCI confidence intervald diameterF forceFBG fluidized bed generatorGSD geometric standard deviationL lengthLB lower boundm massN, n numberP pressureRe Reynolds numbers spacing between tubesStk Stokes numberT temperaturet timeU velocityu uncertaintyU* friction velocityUB upper bounduc combined uncertaintyY mass fraction
Greek symbols˛ tube-bundle packing density� efficiency� resuspension rate� relaxation time� density
gas mass flow rate
Subscript/superscript0 initial, inlet+ dimensionlessax axialcrs cross sectionaldp depositionin inletLB lower boundp particlerd radialref referencers resuspensionS samplingST single tubet tubeTB tube bundletbt turbulentUB upper bound
ilrAperie
of the bundle is considered large enough to reproduce most of
The main phenomena contributing to aerosol depletion arenertial ones: inertial impaction and turbulent deposition (thisatter being considered along normal and axial directions withespect to tube surface). Additionally, the earliest developments ofRI3SG showed that other phenomena responsible for hinderingarticle deposition should play a key role in the scenario (Herranzt al., 2007). Given the nature of the gas flows within the bundle,
esuspension seems to be a candidate and it has been consideredn the current ARI3SG version. Each phenomenon has been mod-led through empirical correlations found in the literature or byg and Design 248 (2012) 282– 292 283
developing ones with the experimental data available. They aregathered in terms of efficiencies in Table 1.
Table 1 shows that turbulent deposition distinguishes betweena radial or cross flow configuration and an axial one. 3D aerody-namic analyses showed that although at the breach exit most ofthe momentum is oriented perpendicularly to the axis of the tubes,the axial component increases as the jet penetrates in the bundleimpinging the tubes (coanda effect; Lopez del Prá et al., 2010a). Thisflow splitting means that particles might get deposited on surfacesby mechanisms acting in both directions (i.e., radial and axial). Inthe radial direction turbulent deposition and inertial impaction areeffective (�rd), whereas in the axial direction only turbulence iscapable of driving particles to tube surfaces (�ax). Assuming thatradial and axial mechanisms are independent from each other, thedeposition efficiency (�dp) results to be (Hinds, 1999; Chen and Yu,1993),
�dp = �rd + �ax − �rd · �ax (2)
where the last term prevents from double-counting particlesundergoing depletion.
Deposition and resuspension phenomena are coupled to yieldthe single tube collection efficiency,
�ST(t) = �dp(�t) · [1 − �rs(�t)] · 1 − [1 − �rs(�t)]n
n · �rs(�t)(3)
where n is the number of time steps.Finally, the model takes into account the particle size distribu-
tion splitting the size domain in Nbin sections, obtaining a weightedaverage of the individual collection efficiencies,
�ST(i) =Nbins∑k=1
� (i, k) · �ST(i, k) (4)
where Y is the mass fraction of the bin size k.
3. Validation of ARI3SG
Validation of ARI3SG has been performed by comparing model-ing predictions with the data of the SGTR and CAAT experimentalcampaigns (Herranz et al., 2006; Sánchez-Velasco et al., 2010). Theywere devoted to investigate the aerosol retention in the break stageof a steam generator under dry conditions. These data sets allowanalyzing the influence of the gas mass flow rates and the particlenature.
3.1. Experimental set-up
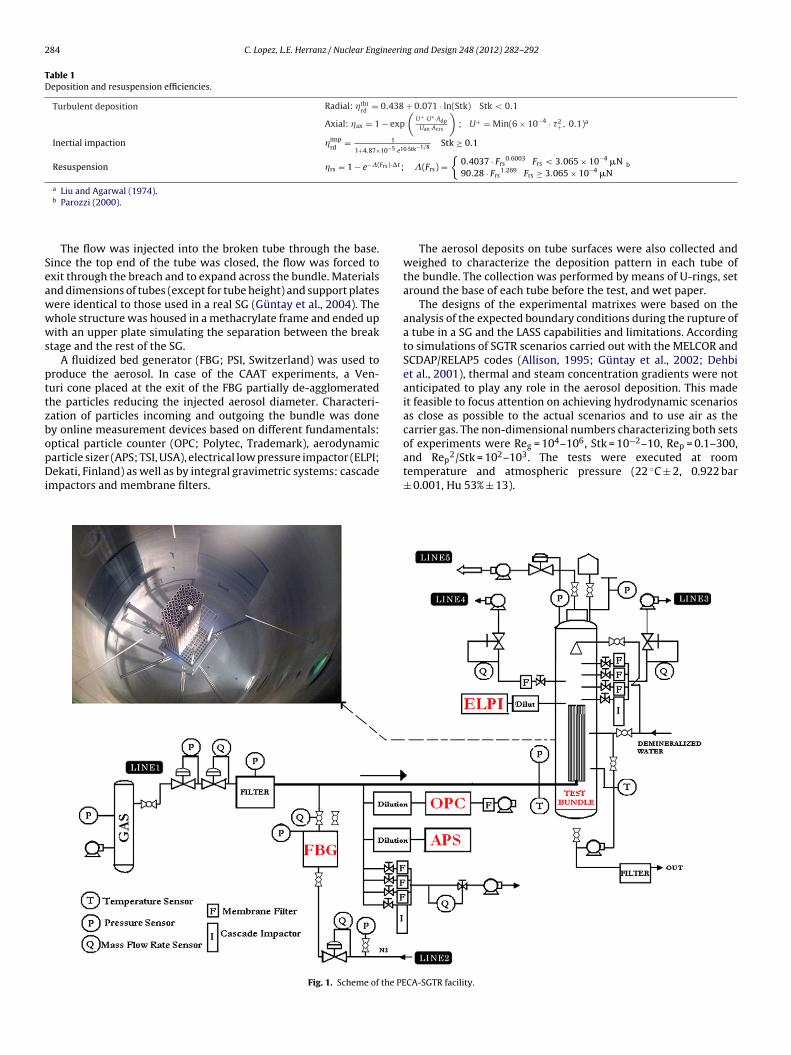
The experimental set-up basically consisted of a gas supplysystem, an aerosol generation device, a tube bundle and a mea-surement system (i.e., sampling and instrumentation). Fig. 1 showsa sketch of the facility and a top view of the tube bundle within the8.3 m3 vessel where it stood.
The bundle (330 mm × 300 mm) was a mock-up of the breakstage of the secondary side of a steam generator. The tubes were1.5 m high and 19.05 mm in diameter with a pitch to diameter ratioin the bundle of p/dt = 1.4. They were arranged in a squared assem-bly of 11 × 11 (121 tubes), where the broken one was placed atthe center or displaced two positions, depending on the breachconfiguration. Such configurations were based on CFD simulations(Quarini, 1999; Lopez del Prá et al., 2010a), which indicated thattubes beyond the fifth or seventh row from the breach should notaffect substantially aerosol deposition. In other words, the size
the momentum dissipation of the incoming gas jet when mov-ing through the system. The breach was placed at 0.24 m from thebase.
284 C. Lopez, L.E. Herranz / Nuclear Engineering and Design 248 (2012) 282– 292
Table 1Deposition and resuspension efficiencies.
Turbulent deposition Radial: �tbtrd
= 0.438 + 0.071 · ln(Stk) Stk < 0.1
Axial: �ax = 1 − exp
(U+·U∗ ·Adp
Uax ·Acrs
); U+ = Min(6 × 10⁻⁴ · �2
+, 0.1)a
Inertial impaction �imprd
= 1
1+4.87×10⁻⁵ ·e10·Stk−1/8 Stk ≥ 0.1
Resuspension �rs = 1 − e−�(Frs)·�t ; �(Frs) ={
0.4037 · Frs0.6003 Frs < 3.065 × 10⁻⁴ �N
90.28 · Frs1.269 Frs ≥ 3.065 × 10⁻⁴ �N
b
a
Seawwws
pttzbopDi
Liu and Agarwal (1974).b Parozzi (2000).
The flow was injected into the broken tube through the base.ince the top end of the tube was closed, the flow was forced toxit through the breach and to expand across the bundle. Materialsnd dimensions of tubes (except for tube height) and support platesere identical to those used in a real SG (Güntay et al., 2004). Thehole structure was housed in a methacrylate frame and ended upith an upper plate simulating the separation between the break
tage and the rest of the SG.A fluidized bed generator (FBG; PSI, Switzerland) was used to
roduce the aerosol. In case of the CAAT experiments, a Ven-uri cone placed at the exit of the FBG partially de-agglomeratedhe particles reducing the injected aerosol diameter. Characteri-ation of particles incoming and outgoing the bundle was doney online measurement devices based on different fundamentals:
ptical particle counter (OPC; Polytec, Trademark), aerodynamicarticle sizer (APS; TSI, USA), electrical low pressure impactor (ELPI;ekati, Finland) as well as by integral gravimetric systems: cascadempactors and membrane filters.
Fig. 1. Scheme of the PE
The aerosol deposits on tube surfaces were also collected andweighed to characterize the deposition pattern in each tube ofthe bundle. The collection was performed by means of U-rings, setaround the base of each tube before the test, and wet paper.
The designs of the experimental matrixes were based on theanalysis of the expected boundary conditions during the rupture ofa tube in a SG and the LASS capabilities and limitations. Accordingto simulations of SGTR scenarios carried out with the MELCOR andSCDAP/RELAP5 codes (Allison, 1995; Güntay et al., 2002; Dehbiet al., 2001), thermal and steam concentration gradients were notanticipated to play any role in the aerosol deposition. This madeit feasible to focus attention on achieving hydrodynamic scenariosas close as possible to the actual scenarios and to use air as thecarrier gas. The non-dimensional numbers characterizing both sets
of experiments were Reg = 104–106, Stk = 10−2–10, Rep = 0.1–300,and Rep2/Stk = 102–103. The tests were executed at roomtemperature and atmospheric pressure (22 ◦C ± 2, 0.922 bar± 0.001, Hu 53% ± 13).
CA-SGTR facility.

C. Lopez, L.E. Herranz / Nuclear Engineering and Design 248 (2012) 282– 292 285
Table 2SGTR experimental conditions and results (Herranz et al., 2006).
Test Material Time (s) (kg/h) U0a (m/s) MassIn (g) AMMD(�m) GSD � (%)
SGTR-1 TiO2 1860 249.7 252.24 96.61 7.42 1.8 3.96SGTR-2 TiO2 1740 100.4 116.38 108.55 – – 16SGTR-3 TiO2 1620 149.3 160.86 113.47 6.72 1.67 8.65SGTR-4 TiO2 1680 251.2 253.59 133.53 6.69 1.66 3.98SGTR-5 TiO2 1740 103.1 118.85 74.87 – – 18.8SGTR-6 TiO2 1800 78.6 96.53 62.12 – – 8.93SGTR-7 TiO2 1800 71.8 90.34 56.6 3.37 1.49 14.98SGTR-8 TiO2 1800 156.9 167.82 182.73 6.95 1.78 6.77SGTR-9 TiO2 1800 245.2 248.11 186.35 7.13 1.78 4.08SGTR-10 TiO2 1620 72.1 90.61 49.52 5.16 1.56 6.45SGTR-11 TiO2 1620 150.2 161.74 120.36 6.7 1.67 7.24SGTR-12 TiO2 1740 243.8 246.89 133.52 4.87 1.51 2.4
a Estimate (Section 3.3).
Table 3CAAT experimental conditions and results (Sánchez-Velasco et al., 2010).
Test Material Time (s) (kg/h) U0a (m/s) MassIn (g) AMMDb (�m) GSD � (%)
CAAT-1 TiO2 2208 93.4 109.99 20 3 2.9 27.48CAAT-2 TiO2 1980 223 227.93 10 1.8 2.9 13.5CAAT-3 TiO2 2760 99.7 115.73 128 1.1 4.8 15.8CAAT-4 TiO2 3180 169 178.79 92 0.9 4.8 13.6CAAT-5 TiO2 1860 125 138.75 55 1.1 3.8 15.8CAAT-12 TiO2 2220 147 158.77 28 1.3 2.8 14
CAAT-8 SiO2 3180 183 191.53 34.5 1.2 3.3 84.11CAAT-9 SiO2 3180 125 138.75 76.5 1.5 4.2 94.16CAAT-10 SiO2 2340 176 185.16 33.15 1.3 6.1 92.94CAAT-11 SiO2 3120 240 243.40 12.6 1.3 4.8 80.93CAAT-13 SiO 2820 81.4 99 41.3 1.3 2.8 81.24
3
bTgr
aeT2
3
a
•••
TM
2
a Estimate (Section 3.3).b Mark III impactor.
.2. Experimental data
The experimental boundary conditions and results ofoth databases used to validate ARI3SG are summarized inables 2 and 3. Note that no reference of the breach type isiven, as no major influence was found of this variable on aerosoletention (Herranz et al., 2006).
Experimentally, two seeding materials were used to gener-te aerosols: TiO2 and SiO2. The former was used in the SGTRxperiments, whereas both of them were used in the CAAT ones.able 4 collects their specifications (Degussa, 2005; Nanophase,002; Nagase, 2006).
.3. Hypotheses and approximations
The input variables describing the scenario in the ARI3SG modelre:
Geometrical variables: dt, s, Lt
Thermal and aerodynamic variables: P, T, U , t, �t
0Aerosol description: �p, number distribution (Nbins,{dp(i), np(i)}Nbinsi=1 )
able 4anufacturer aerosol specifications.
Experiment SGTR and CAAT CAAT
Material TiO2 SiO2
Aerosol size distribution Polydisperse MonodisperseAverage primary particle diameter (�m) 21.8 × 10⁻³ 1.02Material density (kg/m3) 3950 2000
Some of them were directly taken from the geometry conditionsor from Tables 2 and 3, but some others required further hypothesesand/or approximations.
The inlet gas velocity (U0) shown in Tables 2 and 3 was theoreti-cally estimated. It was derived from the 3D analyses of the scenario(Lopez del Prá et al., 2010b) that related the maximum velocity withthe inlet gas mass flow rate (Eq. (5)).
U0 = 0.91 · + 25 (5)
The count size distribution of SiO2 particles is straightforwardas they are spherical and monodisperse. On the contrary, the TiO2material enters the facility in the form of aggregates. It has beenassumed that the aggregates are spherical and lognormally dis-tributed with the AMMD and GSD obtained experimentally. It mustbe noted that there were no size measurements in tests SGTR-2, 5and 6 and their sizes have been approximated with those of theclosest gas mass flow rate tests (SGTR-3 and SGTR-10).
Regarding the TiO2 particles density, it is an experimentalunknown. However, the range of possible values was bounded the-oretically. The aerosol density has to be lower than the materialdensity due to the aggregate void fraction. The upper limit hasbeen obtained assuming that primary particles forming the aerosolare solid spheres randomly packed with the highest configura-tion. Some researchers (Scott and Kilgour, 1969; Jaeger et al., 1992;Torquato et al., 2000) found out that such an arrangement resultedin a maximum density that was 64% of the TiO2 nominal density:
�p, max = 0.64 · �TiO2(6)
Therefore, the upper bound of the aerosol density range has been
taken as 2528 kg/m3.Given the relevant role played by water density (1000 kg/m3) inthe characterization of aerodynamic aerosol motion (Hinds, 1999)it has been taken as the density reference in this study. As an

286 C. Lopez, L.E. Herranz / Nuclear Engineering and Design 248 (2012) 282– 292
abb
�
tf
a
ss
3
tt
•
•
Table 5Experimental outlet aerosol size (SGTR).
Outlet AMMD (�m) GSD
SGTR-1 2.43 2.76SGTR-2 2.31 2.68SGTR-3 3.62 2.47SGTR-4 3.62 2.20SGTR-5 2.51 2.4SGTR-6 3.14 2.55SGTR-7 3.04 2.51SGTR-8 3.85 2.22SGTR-9 3.89 2.27SGTR-10 3.11 2.59SGTR-11 3.34 3.09SGTR-12 2.48 2.65
Fig. 2. Inlet mass distributions of TiO2 simulations (1000 kg/m3).
pproximation, the density interval has been distributed evenly atoth sides of the reference density, so that the lower bound haseen defined as:
p, min = 10002528
· �water (7)
That results in a lower bound of 395.5 kg/m3, which agrees withhe experimental lowest bound obtained by Leskinen et al. (2010)or TiO2 aggregates.
In short, a reference density of 1000 kg/m3 has been adoptednd a density range has been estimated to be 400–2500 kg/m3.
Finally, the inlet aerosol mass distributions determine theource term to the bundle. The SGTR and TiO2-CAAT cases arehown in Fig. 2.
.4. TiO2 simulations
The comparison of SGTR data with ARI3SG estimates by usinghe reference and the minimum aerosol density indicate consis-ency (Fig. 3):
Data and predictions lay within the “low range” of collection effi-ciency (≤20%).ARI3SG results follow the experimental trend at gas mass flowrates higher than 100 kg/h: as gas mass flow rate increases, col-lection efficiency decreases. However, whereas the experimentaltrend decreases inversely proportional to the square of the inletmass flow rate for ≥ 100 kg/h (Herranz et al., 2006), predic-
tions seem to decrease linearly with the mass flow rate. That is,data decreased faster than estimates. Both trends are marked bydashed lines in Fig. 3.Fig. 3. TiO2 ARI3SG-SGTR efficiency vs. inlet gas mass flow rate (I).
Fig. 4. TiO2 ARI3SG–SGTR efficiency vs. inlet gas mass flow rate (II).
As observed, the ARI3SG reference case overestimates predic-tions. By adopting the lowest bound of the density range, newestimates resulted in a notably better agreement with data. So,according to ARI3SG predictions, SGTR-TiO2 aerosols might havedensities lower than 1000 kg/m3.
Experimental observations showed evidences of particle frag-mentation in the scenario (Herranz et al., 2006). By assuming theoutlet size distribution measured experimentally (Table 5) andimposing a lower aerosol density, the results are closer to the data(Fig. 4). As expected, the figure shows that the smaller the particles,the lower the integral collection efficiency.
Therefore, the above analyses show that most probably SGTRparticles were less dense than 1000 kg/m3 and could have had sizes
between inlet and outlet measurements.Consistently with TiO2-SGTR, both data and estimates lay at thelow range of collection efficiencies (Fig. 5). Further than the quan-titative agreement, it is also noticeable the fact that, neither data
Fig. 5. TiO2 ARI3SG–CAAT efficiency vs. inlet gas mass flow rate.

C. Lopez, L.E. Herranz / Nuclear Engineering and Design 248 (2012) 282– 292 287
Fig. 6. TiO2 SGTR, CAAT and ARI3SG efficiencies vs. inlet gas mass flow rate (( )SGTR, ( ) CAAT).
nTi
swlistcptitaMapm
tt(
tabowThtvbS
moor
�SiO2= �ARI3SG + 0.77 (8)
or ARI3SG predictions change with the inlet gas mass flow rate.he slight fluctuations of ARI3SG estimates respond to variationsn the initial and boundary conditions.
In addition to previous ARI3SG-data analysis, a cross compari-on between SGTR and CAAT sets has been performed. It shows thathereas experimentally the CAAT tests reached slightly higher col-
ection efficiencies than SGTR ones (Fig. 6(a)), the ARI3SG estimatesndicate the opposite trend (Fig. 6(b)). In order to understand theource of this discrepancy, a set of studies has been carried out onhe basis of the size and density uncertainties. As said above, parti-les density was not measured and there is no guarantee that TiO2articles in the SGTR and CAAT tests were equally dense, since evenheir generation was not fully equivalent (i.e., a Venturi pipe wasmplemented in the CAAT tests to split up TiO2 aggregates). In addi-ion, particle size is affected by uncertainties too. On one side, therere evidences of particle fragmentation; on the other, even thoughark-III measurements were given credit in the experimental CAAT
nalysis (Table 3), other measurements (APS) seemed to indicatearticle diameters bigger than those of Mark-III (although Mark-IIIeasures looked more reliable).Fig. 6(b)–(e) summarizes the results of the analyses carried out,
he reference case included (Fig. 6(b)). In short, the results indicatehat the CAAT particles might have been denser than the SGTR oneseven the water) and bigger than measured by Mark-III.
According to the reference case results (Fig. 6(b)): the smallerhe particle size (CAAT), the lower the collection efficiency. Byssuming a lower density for the SGTR particles, differencesetween both sets of predictions are diminished (Fig. 6(c)), but stillpposite to experimental results. This opposite trend is reversedhen assuming a higher density for the CAAT particles (Fig. 6(d)).
herefore, CAAT particles that had smaller sizes could have hadigher densities than SGTR ones. This seems consistent with the facthat larger agglomerates of the same material usually have largeroid fractions (Leskinen et al., 2010). In addition, the agreementetween Fig. 6(d) and (a) supports the experimental observation ofGTR particle fragmentation.
Finally, CAAT particles could have had bigger sizes than thoseeasured by the Mark-III impactor. By doubling the particle size
f the CAAT particles, which results in AMMDs around 2 �m, the
pposite trend between CAAT and SGTR predictions is almosteversed (Fig. 6(e)).Fig. 7. SiO2 ARI3SG–CAAT efficiency vs. inlet gas mass flow rate (I).
3.5. SiO2 simulations
In the case of the SiO2-CAAT tests, there was much lessuncertainty in the inlet particle characterization since they werespherical, nearly monodisperse and around 1 �m diameter. Never-theless, given that these tests were conducted after the TiO2 tests,some potential contamination is feasible, even once the injectionlines had been flushed. As a result, Table 3 shows that the Mark-III impactor measured sizes of around 1.2 �m of AMMD with a bigGSD (from 3 to 6).
Fig. 7 shows that ARI3SG estimates a 10% of collection efficiencywhereas retention was measured to be 80%. The discrepancy is out-standing. Even when only deposition mechanisms are taken intoaccount in the modeling (i.e., no resuspension effect), estimatesare still far from measurements. In addition, by neglecting resus-pension the predictions show a trend opposite to data.
Experimentally, it was found in the CAAT campaign that efficien-cies of SiO2 particles were much higher than those of TiO2 ones(Sánchez-Velasco et al., 2010). As suggested, the reason behindcould well have been the different electrostatic behavior of bothparticle types. If electrical effects had come into play, they wouldhave affected the deposition (since electrophoresis could havebecome a working mechanism for SiO2) and would have inhibitedresuspension to some extent (since electrical forces would haveadded to the attaching forces in the force balance).
Particles may become electrostatically charged by frictional con-tact with other materials. This phenomenon, called triboelectriccharging, seems to happen often when generating particles by FBG(Yeh et al., 1988). The reason postulated for this phenomenon toaffect more strongly SiO2 particles than TiO2 ones, lies in theirdifferent electronegativity, which is higher for SiO2 than for TiO2.Given the correlation between specific charging and electroneg-ativity (Matsusaka et al., 2010), it results that under the sameconditions the specific charging of SiO2 would nearly double thatof TiO2. This sensitivity to charging by contact is further enhancedowing to the postulated lower density of TiO2 agglomerates ratherthan that of SiO2 particles. In other words, if a SiO2/TiO2 densityratio around 2 is assumed (�TiO2
= 1000 kg/m3), SiO2 particleswould build up nearly 4 times more electrical charge than simi-lar size TiO2 particles. Lind et al. (2010) confirmed that fluidizationof SiO2 particles in a FBG increases their charge.
The analysis of the experimental results (Sánchez-Velasco et al.,2010) provided an ad hoc numerical factor accounting for the dif-ference in deposition of the SiO2 particles with respect to TiO2 ones.Accordingly, this factor was introduced into ARI3SG:
The result is shown in Fig. 8. As expected, data and the adjustedestimates are in the higher range of collection efficiency. In

288 C. Lopez, L.E. Herranz / Nuclear Engineering and Design 248 (2012) 282– 292
aa
4
sdtcvpneoaktenbB
beowtuuta
4
mtaatg1e
Table 6Combined uncertainties of ARI3SG formulation.a
Tube bundle efficiency
u2c (�TB) =
[dt
dt+s· (1−�TB)
1−˛
Nt∏i=1
(1 − dt ·�ST(i)
dt+s
)]2
·Nt∑
i=1
[(1 − dt ·�ST(i)
dt+s
)−1]2
· u2c (�ST(i))
�TB(�ST(1), . . . , �ST(Nt)) = 1 − exp
{−1
1−˛ ·
[1 −
Nt∏i=1
(1 − dt ·�ST(i)
dt+s
)]}Single tube efficiency
u2c (�ST) =
Nbins∑k=1
� 2(k) · u2c (�dp(k))
�ST = �ST(�dp(1), . . . , �dp(kbins)) =Nbins∑k=1
� (k) · �dp(k)
Tube-bin final efficiency
u2c (�dp) =
((1 − �rs) · 1−(1−�rs )n
n·�rs
)2· u2
c (�dp, 0) +(
�dp, 0 · (1−�rs )n ·(1+n·�rs )−1
n·(�rs )2
)2· u2
c (�rs)
�dp = �dp(�dp, 0, �rs) = �dp, 0 · (1 − �rs) · 1−(1−�rs )n
n·�rs
Tube-bin initial efficiencyu2
c (�dp, 0) = (1 − �ax)2 · u2(�rd) + (1 − �rd)2 · u2c (�ax)
�dp, 0(�rd, �ax) = �rd + �ax − �rd · �ax
Tube-bin axial efficiency
u2c (�ax) =
[U∗ ·Adp
Uax ·Acrs· (1 − �ax)
]2· u2(U+)
�ax(U+) = 1 − exp( −U∗ ·U+·Adp
Uax ·Acrs
)Tube-bin resuspension efficiency
u2c (�rs) = (�t · (1 − �rs))2 · u2(�)
�rs(�) = 1 − exp(− � · �t)
The correlation that provides a better agreement with data is theinertial impaction one with 19% relative deviation, and the most
Fig. 8. SiO2 ARI3SG–CAAT efficiency vs. inlet gas mass flow rate (II).
ddition, the experimental fluctuations of the collection efficiencyre maintained by ARI3SG.
. ARI3SG uncertainty analyses
The ARI3SG model provides the aerosol retention in the breaktage of a steam generator under “dry” SGTR severe accident con-itions. In the previous section its estimates have been comparedo data showing a reasonable consistency; even further, parametricalculations have explored potential reasons for the experimentalariations observed. Therefore ARI3SG has been used as an inter-retation tool. However, given the ARI3SG approach, the empiricalature of the equations embedded and the requested input param-ters, the ARI3SG estimates are forcefully affected by uncertaintiesf different kinds. Two categories are distinguished here: epistemicnd stochastic uncertainties. The former come from an incompletenowledge of the system, not from their nature but from the limi-ation of our ability to model it (i.e., wrong modeling, measurementrrors, etc.), therefore they can be reduced. The latter arise from theatural random variability inherent to the system itself, they cane more accurately characterized but not reduced (Chojnacki andaccou, 2009).
In the case of ARI3SG, the epistemic uncertainties includeoth the uncertainties linked to the equations used to assess theffect of each individual aerosol mechanism considered, and thewn filter approximation that the whole model relies on. In thisork, those uncertainties coming from the ARI3SG basic correla-
ions have been considered (model uncertainties). The stochasticncertainties have also been analyzed through the so-called inputncertainties. As a result, the single points shown in the figures ofhe previous sections under the ARI3SG heading will now turn into
band that encompasses the 95% of the confidence interval.
.1. Model uncertainty
Model uncertainty refers to those uncertainties associated to theodeling of deposition and resuspension mechanisms involved in
he scenario. Each phenomenon was described in ARI3SG (Herranznd Lopez, 2012) through experimental correlations, which entailn uncertainty due to the scattering of the experimental data. Oncehose uncertainties were estimated, they were analytically propa-ated according to the law of uncertainties propagation (ISO Norm,
995), leading to the combined standard uncertainty (uc(�)). Asach of the experimental correlations is independent because ita Note that indexes i (tube) and k (particle bin size) have been omitted for sim-plification.
comes from different experiments, this law can be expressed as(ISO Norm, 1995):
uc(�) =(
N∑i=1
(∂f
∂xi
)2
· u2(xi)
)1/2
(9)
where � = f(x1,. . ..,xN), xi is the independent variable and u(xi) itsstandard uncertainty.
Following this law, the combined standard uncertainty of eachof the fundamental equations of ARI3SG has been derived. They areshown in Table 6, where the last three rows displays the depen-dence with the uncertainties of the experimental correlations usedto model the radial deposition efficiency (u(�rd)), the axial deposi-tion velocity (u(U+)) and the resuspension rate (u(�)).
The standard uncertainties (u(f)) also called standard errorsof the experimental correlations have been derived as follows(Coleman and Steele, 2009):
u(f ) =[
1N − 2
∑N
(yi − f (xi))2
]1/2
(10)
where f is the correlation and yi and xi are the dependent andindependent experimental data, respectively.
The results are collected in Table 7, together with the averagesof the 95% confidence intervals (CI95%) and the deviations of thecorrelation from the experimental data (D). For comparison pur-poses, the last two terms have been expressed in relative termswith respect to the correlation results. As expected, the averagerelative deviations are lower than the average of the confidenceintervals, which extend the reach of predictions by more than 50%.
improvable one is the resuspension rate with the highest CI (472%).Table 7 also includes the correlation coefficient (R2).

C. Lopez, L.E. Herranz / Nuclear Engineering and Design 248 (2012) 282– 292 289
Table 7Standard uncertainties of basic correlations of ARI3SG.
u(f) CI95%(%) D(%) R2
Turbulent deposition efficiency�rd = 0.438 + 0.071 · ln(Stk) Stk < 0.1 0.0566 130 35 0.51Inertial impaction efficiency�rd = 1
1+4.87×10⁻⁵ ·e10·Stk−1/8 Stk ≥ 0.1 0.0739 68 19 0.91
Dimensionless axial deposition velocity (Liu and Agarwal, 1974)
U+ = Min(6 × 10⁻⁴ · �2+, 0.1) �+ < 13 0.437·U+ 87.4 30 0.96
�+ ≥ 13 0.03 60 25
l(ea
ata
iiaCe(
sdno
4
vtTtAirag
Resuspension rate (Parozzi, 2000):
�(F) ={
0.4037 · F0.6003
90.28 · F1.269
F < 3.065 × 10⁻⁴ �N
F ≥ 3.065 × 10⁻⁴ �N
It must be noted that standard uncertainties of the dimension-ess axial deposition velocity (U+, �+ < 13) and resuspension rate�) correlations, given in Table 7, have been derived from their lin-ar log-transformed functions through the first order Taylor seriespproximation.
Finally, 95% of the CI of the correlations given in Table 7nd those of the ARI3SG prediction (Table 6) are determinedhrough the standard and combined uncertainties by f(x) ± 2·u(f)nd �TB ± 2·uc(�TB), respectively.
Fig. 9 shows that consideration of the model uncertaintyn ARI3SG brings most predictions and data within the result-ng uncertainty band. These bands increase/decrease predictionsn average of 38% and 62% of the SGTR (Fig. 9(a)) and TiO2-AAT (Fig. 9(b)) predictions, respectively. They overlap half of thexperimental uncertainty range, whereas for the SiO2-CAAT caseFig. 9(c)) they envelop the experimental results completely.
The comparison of both TiO2 tests predictions (Fig. 9(a) and (b))hows different lengths in the uncertainty bands. This is due to theifferent weight that each phenomenon involved has on each sce-ario, which in turn is due to the slight differences of the modelingf the initial and boundary conditions.
.2. Input parameters uncertainty
The input deck parameters in ARI3SG are far from being exactalues. They come either from test measurements or from deriva-ions based on different kinds of hypotheses and approximations.herefore, each attributed input value has an associated uncer-ainty. The procedure to analyze the effect of these uncertainties onRI3SG was derived from the BEMUSE program (CSNI, 2007) and it
s summarized as follows. Each input parameter is considered as aandom variable with a probability density function, with a meannd a standard deviation. Then, a random vector composed by theathering of input variables is sampled NS times, through a simple
Fig. 9. Model uncertainty of SGTR and CAAT simulations.
1.725·� 344 290 0.62.367·� 472 57
random sampling method (SRS). It generates a set of input scenar-ios that are executed giving rise to range of results, in this case arange of collection efficiencies. According to the Wilks theory, therange corresponds to a confidence interval with a confidencelevel. NS, and are related through the following equations (CSNI,2007; Wilks, 1941, 1942):
ˇ = 1 − ˛NS − NS · (1 − ˛) · ˛NS−1 (11)
In the analysis of the predictions of the SGTR and CAAT exper-iments, a total of 93 input samples with their corresponding coderuns were performed. They provided the 95% CI with a 95% confi-dence level.
The input deck variables affected by uncertainties are:
• Gas velocity. Derived from experimental measurements. It hasbeen assumed that the probability should grow as it gets closer tothe measured mean value, being less probable near the intervalends, and a normal distribution provides a good description ofit. Mean values are given in Tables 2 and 3 and their uncertaintyranges are collected in Table 8.
• Aerosol mass median diameter (AMMD). Experimentally deter-mined, it has been assumed that the shape of the typical AMMDdistribution (lognormal) is a good way to characterize the uncer-tainties affecting this variable. AMMD and GSD are given inTables 2 and 3.
• Aerosol density. It was an experimental unknown, theoreticallybounded (400–2528 kg/m3, Section 3.3). In this case, there is noclue about the density function and a uniform distribution isassumed. The mean is assumed to be 1000 kg/m3.
As an example, Fig. 10 shows the histograms of the test SGTR-1 and SGTR-7 input samplings. In both cases, velocities follow a
normal distribution. The former test is executed at higher velocities(252 ± 17 m/s) than the second one (90 ± 12 m/s). The AMMDs arelognormally distributed with higher diameters in the SGTR-1 testthan in the SGTR-7 test (Table 2).Table 8Inlet SGTR and CAAT velocity uncertainty.
Test ı (kg/h) ıU0a (m/s) Test ı (kg/h) ıU0
a (m/s)
SGTR-1 18.72 17.04 CAAT-1 18 16.38SGTR-2 8.74 7.95 CAAT-2 4 3.64SGTR-3 20.24 18.42 CAAT-3 17 15.47SGTR-4 15.16 13.80 CAAT-4 62 56.42SGTR-5 11.89 10.82 CAAT-5 17 15.47SGTR-6 15.41 14.02 CAAT-12 3 2.73SGTR-7 13.62 12.39SGTR-8 22.01 20.03 CAAT-8 30 27.30SGTR-9 22.16 20.17 CAAT-9 4.2 3.82SGTR-10 10.22 9.30 CAAT-10 12 10.92SGTR-11 8.04 7.32 CAAT-11 4 3.64SGTR-12 20.59 18.74 CAAT-13 3 2.73
a Estimate (Section 3.3).

290 C. Lopez, L.E. Herranz / Nuclear Engineering and Design 248 (2012) 282– 292
-1 and SGTR-7 input samplings.
ccmimttfc9
gurp
u
u
Fig. 10. Histograms of SGTR
The combination of the different inputs gave rise to the efficien-ies estimated by ARI3SG given in Fig. 11. The former computationsould resemble a uniform distribution, whereas the latter looksore like a normal one. Therefore, in this case it seems that there
s no input variable common to all the tests determining a com-on output distribution. As expected in both cases, the mean of
he sample output (11.2% for SGTR-1; 16.4% for SGTR-7) is close tohe collection efficiency of the mean input around 11.0% and 15.33%or SGTR-1 and SGTR-7, respectively. According to Wilks, 95% of theollection efficiency lays within the range 3.1–18 (6.1–27) with a5% confidence level for the SGTR-1 test (SGTR-7).
Finally, the upper and lower limits of the collection efficienciesiven by the Wilks theory (�UB, �LB) determine the upper and lowerncertainty ranges. Their lengths (Eqs. (12) and (13)) are given withespect to the reference case (�ref), which is determined by therediction of the mean values of each probability density function.
UB(�ref) = �UB − �ref (12)
LB(�ref) = �ref − �LB (13)
Fig. 11. Histogram of SGTR-1 and SGTR-7 output computations.
Fig. 12. Input uncertainty analysis for SGTR simulations.
4.2.1. Input uncertainty resultsIn most cases the upper and lower uncertainty bounds of SGTR
simulations envelop the experimental results (Fig. 12). Therefore,uncertainty in the input parameters account for the discrepanciesbetween the reference prediction and data. The best estimate foundin Section 3.4 which assumed lower particle densities and sizes laywithin this confidence interval.
In the case of the TiO2-CAAT analysis, the upper bound obtainedthrough Wilks envelops 50% of the experimental data (Fig. 13).However, they overlap with the experimental uncertainty band.
Fig. 13. Input uncertainty analysis for TiO2-CAAT simulations.

C. Lopez, L.E. Herranz / Nuclear Engineering and Design 248 (2012) 282– 292 291
Apta
waict
4
iaSw
•
•
•
mt
4
ry
u
wua
ut
Fig. 15. Total uncertainty of ARI3SG SGTR and CAAT simulations.
Table 9Summary uncertainty ranges of ARI3SG SGTR and CAAT simulations.
D uUB,LB 2 · uc(�UB,LB) uT
TiO2-SGTR ±0.48·�ref ±0.53·�ref ±0.32·�ref ±0.85·�ref
TiO2-CAAT ±1.25·�ref +1.0·�ref +0.91·�ref +1.91·�ref
Fig. 14. Sensitivity results of SGTR-1 and SGTR-7 simulations.
s this bound takes into account variations of aerosol density andarticle size, it underlines the previous discussion in Section 3.4:he CAAT aerosols had either higher density than the SGTR onesnd/or were bigger than assumed.
The particles of the SiO2-CAAT experiments were monodisperseith a density of 2000 kg/m3. Therefore, velocity was the only vari-
ble submitted to uncertainty. The analysis performed, which is notncluded here, showed nearly no influence on the collection effi-iency, as both upper and lower bounds meant a difference of lesshan 1% of the prediction.
.2.2. Sensitivity analysisThe influence of the uncertainty of each input parameter (veloc-
ty, AMMD and density) on the output has been individuallynalyzed. These analyses were performed through the SGTR-1 andGTR-7 simulations by sampling the input parameter of interesthile keeping the remaining ones with the reference value.
Major observations are summarized as follows (Fig. 14):
Velocity variations (7–12%) have a low influence on the estimates.They imply between 1% and 6% of the prediction of the referencecase.The lower bound of the collection efficiency (full sensitivity col-umn) seems to be determined by the uncertainty of the inputAMMD, as sensitivity to AMMD is similar to the full one.The upper bound of the collection efficiency seems to result froma combination of the AMMD and the density variations. Thesejoint variations increase the collection efficiency as depositionphenomena within the model dependent on the particle inertia.
These sensitivity analyses indicate that ARI3SG estimates areuch less affected by gas velocity uncertainty than by those related
o the particle characterization (i.e., size and density).
.3. Total uncertainty
Finally, both model uncertainties (uc) and the uncertaintiesesulting from the input parameter ones (uUB,LB) are combined toield the total uncertainty (uT) for 95% of the CI:
T(�ref) ={
+[uUB(�ref) + 2 · uc(�UB)]−[uLB(�ref) + 2 · uc(�LB)]
(14)
here uUB and uLB are given by Eqs. (12) and (13), respectively;c(�UB) and uc(�LB) stand for the model uncertainties of the upper
nd lower collection efficiencies, respectively.Fig. 15 shows that in all of the cases except for one, the totalncertainties of predictions envelop data and they even overlaphe experimental uncertainties.
−0.85·�ref −0.16·�ref −1.0·�ref
SiO2-CAAT ±0.06·�ref ±0.001·�ref ±0.18·�ref ±0.18·�ref
Table 9 summarizes the uncertainty analysis in terms of aver-ages. The variables included are: deviation between data andpredictions, upper/lower bound uncertainties and model uncer-tainties. For comparison purposes, all of them are given in relativeterms with respect to predictions of the reference case.
It must be noticed that SiO2 uncertainties are given with respectto the modified ARI3SG model, which takes into account the depo-sition factor related to the particle charge (Eq. (8)).
The table shows the magnitude and scope of the uncertaintyanalysis. The deviations are in most cases smaller than the uncer-tainty band associated to ARI3SG estimates. In other words,data-predictions discrepancies are not so when one takes intoaccount input and modeling uncertainties. As for the effect of inputuncertainties, it is noticeable that whereas for SiO2 particles theyhave been found negligible, this is not the case for the TiO2 particles,particularly those of the CAAT tests. In most cases, input uncer-tainties introduce higher uncertainties in the results than those ofthe modeling itself. This discussion highlights the importance ofachieving a good particle characterization in terms of density andsize. Whenever those two parameters are highly uncertain, ARI3SGestimates should be given in terms of intervals rather than as asingle collection efficiency value.
5. Conclusions
The capability of the ARI3SG model to predict aerosol reten-tion in the break stage of a dry steam generator has been assessedagainst an “ad hoc” database. An analysis of uncertainties affect-ing ARI3SG input data and in-model equations allowed capturing asound insight of model performance.
As for validation, ARI3SG correctly predicts that even looseagglomerates would be partially retained in the break stage. Inaddition, the ARI3SG band ranges from 5% to 30% over the exploredinlet gas flow rate, which is also consistent with observations. Whenmodeling compact spherical particles, a numerical factor based onmeasurements bring estimates to the right level of retention; this
factor could be a consequence of the so called triboelectric effectthat enhances electrophoresis and hinders resuspension in SiO2scenarios.
2 ineerin
iat(
cscwog
A
ILBo
R
A
A
C
C
C
C
D
D
G
G
H
92 C. Lopez, L.E. Herranz / Nuclear Eng
The analysis of the uncertainties effect in input parameters andmplemented correlations highlights that data–estimate discrep-ncies are meaningless. Uncertainties of input data dominate overhe modeling ones, particularly those associated to size and densitythe latter being particularly the case for agglomerates).
Even though further validation of the ARI3SG model will beonducted when further data become available, the results shownuggest including the model in a correlation-like form in a systemode (i.e., MELCOR and ASTEC). SGTR severe accident simulationsith an “enabled” system code would provide a lower bound
f the potential retention in the secondary side of a dry steamenerator.
cknowledgments
The authors are indebted to partners of the ARTIST and ARTISTI projects for the insightful discussions held in so many occasions.ikewise, the authors acknowledge the Spanish Nuclear Regulatoryody (CSN) for their support and technical interest in all the phasesf this work.
eferences
llison C.M., 1995. SCDAP/RELAP5/MOD3.1 Code Manual. NUREG/CR-6150 (June1995).
uvinen, A., Jokiniemi, J.K., Lähde, A., Routamo, T., Lundström, P., Tuomisto, H., Dien-stbier, J., Güntay, S., Suckow, D., Dehbi, A., Slootman, M., Herranz, L.E., Peyres,V., Polo, J., 2005. Steam generator tube rupture (SGTR) scenarios. Nucl. Eng. Des.235, 457–472.
hen, Y.K., Yu, C.P., 1993. Particle deposition from duct flows by combined mecha-nisms. Aerosol Sci. Technol. 19, 389–395.
hojnacki, E., Baccou, J.E., 2009. Sunset V 2007 20: Theory Manual and User Guide.DPAM/SEMIC-2009-328 IRSN.
oleman, H.W., Steele, G., 2009. Experimentation, Validation, and Uncertainty Anal-ysis for Engineers, 3rd edition. John Wiley & Sons Inc.
SNI: Committee on the safety of nuclear installations (NEA, OECD), 2007. BEMUSEPhase III Report. NEA/CSNI R(2007)4.
egussa Inc., 2005. Aeroxide P25 Product Specifications Data Sheet. Degussa Inc.,Frankfurt, Germany.
ehbi, A., Güntay, S., Suckow, D., 2001. Test Matrix for the ARTIST Consortium Exper-iments, Draft, TM-42-01-01. Paul Scherrer Institut.
üntay, S., Dehbi, A., Suckow, D., Birchley, J., 2002. ARTIST: an international projectinvestigating aerosol retention in a ruptured steam generator. In: Presented atInternational Congress on Advanced Nuclear Power Plants (ICAPP), Hollywood,FL, USA.
üntay, S., Suckow, D., Dehbi, A., Kapulla, R., 2004. ARTIST: introduction and firstresults. Nucl. Eng. Des. 231, 109–120.
erranz, L.E., Del Prá, C.L., Dehbi, A., 2007. Major challenges to modeling aerosolretention near a tube breach during steam generator tube rupture sequences.Nucl. Technol. 158, 83–93.
g and Design 248 (2012) 282– 292
Herranz, L.E., Lopez, C., 2012. ARI3SG: aerosol retention in the secondary side of asteam generator. Part I: model essentials, verification and correlation. Nucl. Eng.Des., http://dx.doi.org/10.1016/j.nucengdes.2012.03.032.
Herranz, L.E., Velasco, F.J.S., Del Prá, C.L., 2006. Aerosol retention near the tubebreach during steam generator tube rupture sequences. Nucl. Technol. 154,85–94.
Hinds, W.C., 1999. Aerosol Technology: Properties, Behaviour, and Measurement ofAirborne Particles, 2nd ed. Wiley-Interscience.
ISO NORM, 1995. Guide to Expression of Uncertainty in Measurement. InternationalOrganization for Standardization, Geneva, Switzerland, ISBN 92-67-10188-9,Corrected and Reprinted.
Jaeger, H.M., Nagel, S.R., 1992. Physics of the granular state. Science 255 (5051),1523–1531.
Leskinen, J., Lyyränen, J., Ruusunen, J., Joutsensaari, J., Auvinen, A., Jokiniemi,J., 2010. Comparison of nanoparticle density measurements using APMand impactor-classifier. In: International Aerosol Conference 2010, Helsinki,Finland.
Lind, T., Danner, S., Güntay, S., 2010. Monodisperse fine aerosol generation usingfluidized bed. Powder Technol. 199, 232–237.
Lind, T., Suckow, D., Dehbi, A., 2008. Summary Report on ARTIST Phase II Tests forRetention in the Break Stage. Artist 72-08. TM-42-08-04. Paul Scherrer Institut,Switzerland.
Liu, H.Y.B., Agarwal, J.I.K., 1974. Experimental observation of aerosol deposition inturbulent flow. Aerosol Sci. 5, 145–155.
Lopez del Prá, C., Velasco, F.J.S., Herranz, L.E., 2010a. Simulation of a gas jet enteringthe secondary side of a steam generator during a SGTR sequence: validation ofa FLUENT 6.2 model. Nucl. Eng. Des. 240 (9), 2206–2214.
Lopez del Prá, C., Velasco, F.J.S., Herranz, L.E., 2010b. Aerodynamics of a gas enter-ing the secondary side of a vertical shell-and-tube heat exchanger: numericalanalysis of anticipated severe accident SGTR conditions. Eng. Appl. Comp. FluidMech. 4–1, 91–105.
Matsusaka, S., Maruyama, H., Matsuyama, T., Ghadiri, M., 2010. Triboelectric charg-ing of powders: a review. Chem. Eng. Sci. 65, 5781–5807.
Nagase Inc., 2006. Seahostar Product Specifications Data Sheet. Japan.Nanophase Inc., 2002. NANOTEK Product Specifications Data Sheet. Romeoville, IL,
USA.Parozzi, F., 2000. A fast-running model for physical aerosol resuspension account-
ing for STORM experimental results. In: Int. Mtg. “Best-Estimate” Methods inNuclear Installation Safety Analysis (BE-2000), Washington Dc, USA, November.
Quarini, J., 1999. CFD Model of the PSI Steam Generator. Report submitted to PaulScherrer Institut.
Sánchez-Velasco, F.J., López del Prá, C., Herranz, L.E., 2010. Aerosol retention in thevicinity of a breach in a tube bundle: an experimental investigation. Aerosol Sci.Technol. 44, 349–361.
Scott, G.D., Kilgour, D.M., 1969. The density of random close packing of spheres. Br.J. Appl. Phys. 2, 863–866.
Torquato, S., Truskett, T.M., Debenedetti, P.G., 2000. Is random close packing ofspheres well defined? Phys. Rev. Lett. 84 (10), 2064–2067.
Wilks, S.S., 1941. Determination of sample sizes for setting tolerance limits. Ann.Math. Stat. 12 (1), 91–96.
Wilks, S.S., 1942. Statistical prediction with special reference to the problem oftolerance limits. Ann. Math. Stat. 13 (4), 400–409.
Yasmine, A., 2008. Turbulent agglomeration and break-up of nuclear aerosols. PhDThesis. School of Mechanical and System Engineering, Newcastle University.
Yeh, H.C., Carpenter, R.L., Cheng, Y.S., 1988. Electrostatic charge of aerosol par-ticles from a fluidized bed aerosol generator. J. Aerosol Sci. 19 (1), 147–151.