Embed Size (px)
Citation preview

Enterprise Reporting Solution
Argos DataBlock Designers Guide Do cu men t Ver si o n 2.0
L a st Up d a t ed 10. 22. 20 10
www.evisions.com Argos - Argos DataBlock Designers Guide Page 2 of 112 Document Version 1.0 – Last Updated 10.22.2010
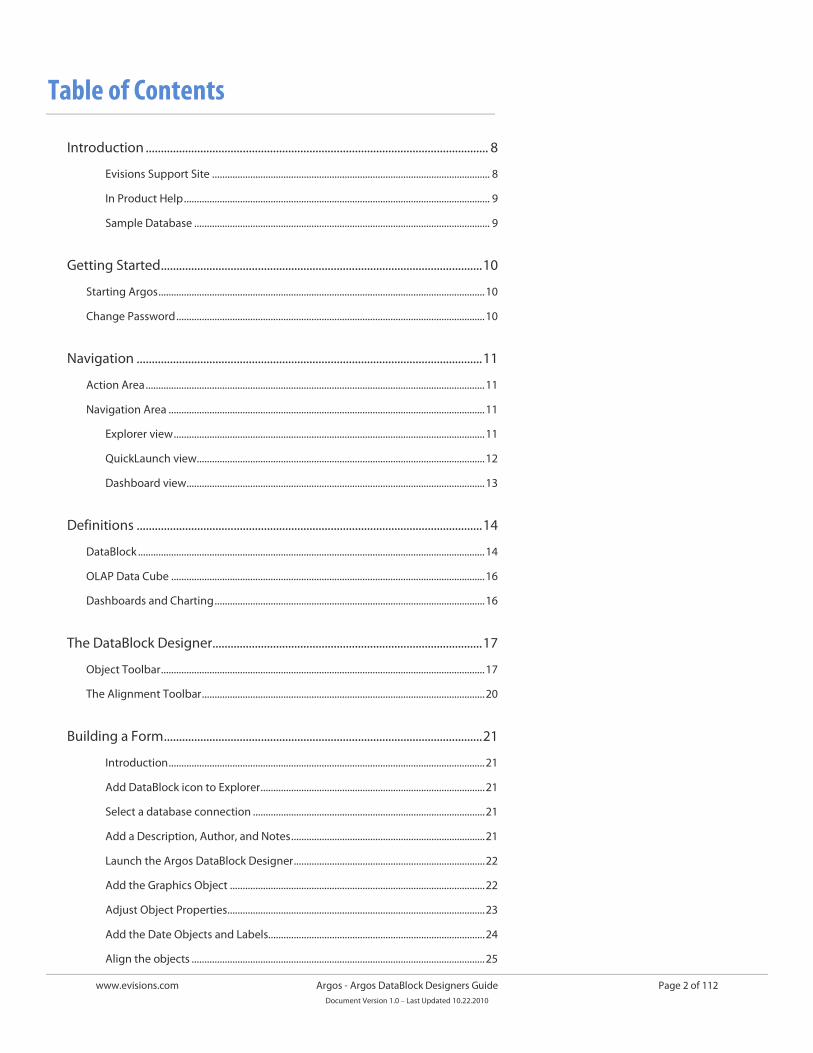
Table of Contents
Introduction ................................................................................................................. 8
Evisions Support Site ............................................................................................................. 8
In Product Help ........................................................................................................................ 9
Sample Database .................................................................................................................... 9
Getting Started.......................................................................................................... 10
Starting Argos ................................................................................................................................ 10
Change Password ......................................................................................................................... 10
Navigation .................................................................................................................. 11
Action Area ..................................................................................................................................... 11
Navigation Area ............................................................................................................................ 11
Explorer view .......................................................................................................................... 11
QuickLaunch view ................................................................................................................. 12
Dashboard view ..................................................................................................................... 13
Definitions .................................................................................................................. 14
DataBlock ........................................................................................................................................ 14
OLAP Data Cube ........................................................................................................................... 16
Dashboards and Charting .......................................................................................................... 16
The DataBlock Designer ......................................................................................... 17
Object Toolbar ............................................................................................................................... 17
The Alignment Toolbar ............................................................................................................... 20
Building a Form ......................................................................................................... 21
Introduction ............................................................................................................................ 21
Add DataBlock icon to Explorer ........................................................................................ 21
Select a database connection ........................................................................................... 21
Add a Description, Author, and Notes ............................................................................ 21
Launch the Argos DataBlock Designer ........................................................................... 22
Add the Graphics Object .................................................................................................... 22
Adjust Object Properties ..................................................................................................... 23
Add the Date Objects and Labels..................................................................................... 24
Align the objects ................................................................................................................... 25
www.evisions.com Argos - Argos DataBlock Designers Guide Page 3 of 112 Document Version 1.0 – Last Updated 10.22.2010
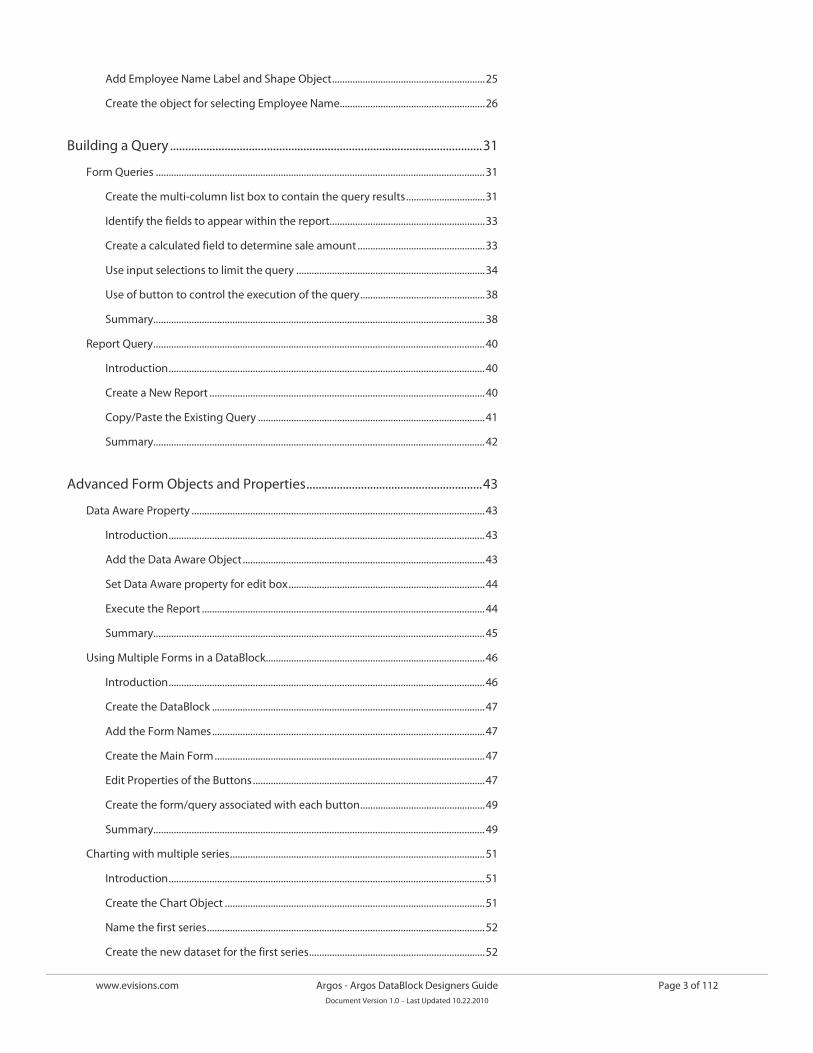
Add Employee Name Label and Shape Object ............................................................ 25
Create the object for selecting Employee Name......................................................... 26
Building a Query ....................................................................................................... 31
Form Queries ................................................................................................................................. 31
Create the multi-column list box to contain the query results ............................... 31
Identify the fields to appear within the report............................................................. 33
Create a calculated field to determine sale amount .................................................. 33
Use input selections to limit the query .......................................................................... 34
Use of button to control the execution of the query ................................................. 38
Summary .................................................................................................................................. 38
Report Query .................................................................................................................................. 40
Introduction ............................................................................................................................ 40
Create a New Report ............................................................................................................ 40
Copy/Paste the Existing Query ......................................................................................... 41
Summary .................................................................................................................................. 42
Advanced Form Objects and Properties .......................................................... 43
Data Aware Property ................................................................................................................... 43
Introduction ............................................................................................................................ 43
Add the Data Aware Object ............................................................................................... 43
Set Data Aware property for edit box ............................................................................. 44
Execute the Report ............................................................................................................... 44
Summary .................................................................................................................................. 45
Using Multiple Forms in a DataBlock...................................................................................... 46
Introduction ............................................................................................................................ 46
Create the DataBlock ........................................................................................................... 47
Add the Form Names ........................................................................................................... 47
Create the Main Form .......................................................................................................... 47
Edit Properties of the Buttons ........................................................................................... 47
Create the form/query associated with each button ................................................. 49
Summary .................................................................................................................................. 49
Charting with multiple series .................................................................................................... 51
Introduction ............................................................................................................................ 51
Create the Chart Object ...................................................................................................... 51
Name the first series ............................................................................................................. 52
Create the new dataset for the first series ..................................................................... 52
www.evisions.com Argos - Argos DataBlock Designers Guide Page 4 of 112 Document Version 1.0 – Last Updated 10.22.2010
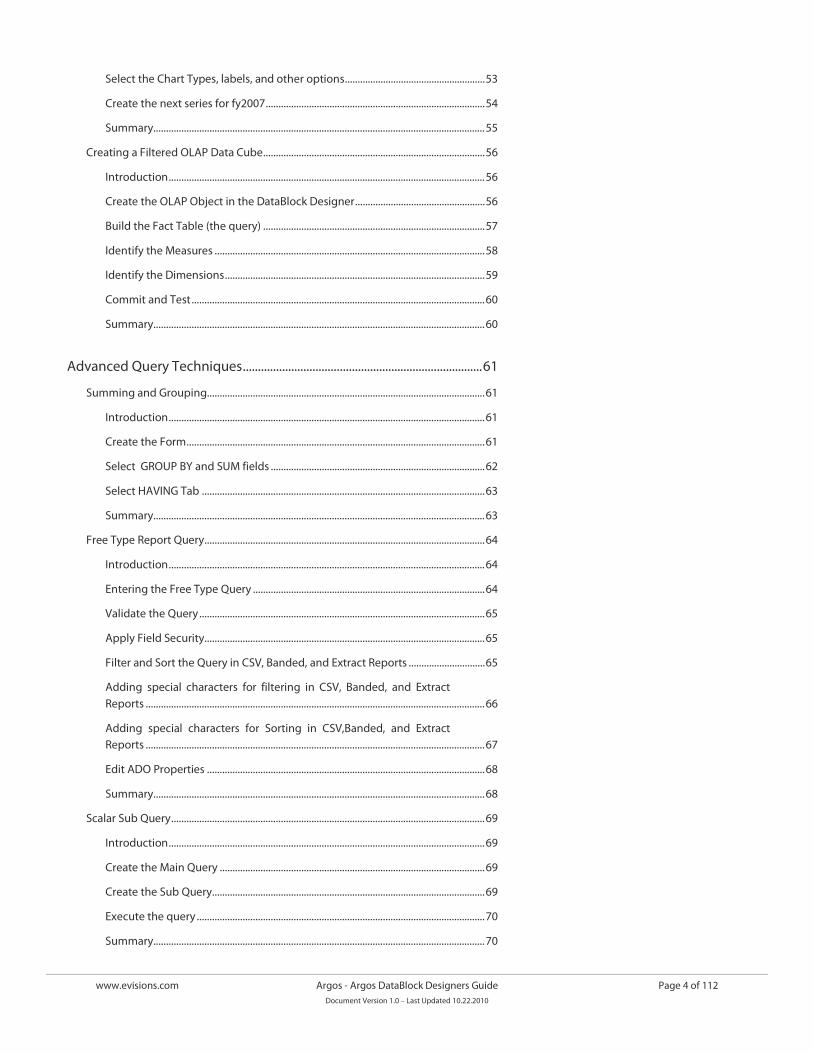
Select the Chart Types, labels, and other options ....................................................... 53
Create the next series for fy2007 ...................................................................................... 54
Summary .................................................................................................................................. 55
Creating a Filtered OLAP Data Cube ....................................................................................... 56
Introduction ............................................................................................................................ 56
Create the OLAP Object in the DataBlock Designer ................................................... 56
Build the Fact Table (the query) ....................................................................................... 57
Identify the Measures .......................................................................................................... 58
Identify the Dimensions ...................................................................................................... 59
Commit and Test ................................................................................................................... 60
Summary .................................................................................................................................. 60
Advanced Query Techniques ............................................................................... 61
Summing and Grouping............................................................................................................. 61
Introduction ............................................................................................................................ 61
Create the Form ..................................................................................................................... 61
Select GROUP BY and SUM fields .................................................................................... 62
Select HAVING Tab ............................................................................................................... 63
Summary .................................................................................................................................. 63
Free Type Report Query .............................................................................................................. 64
Introduction ............................................................................................................................ 64
Entering the Free Type Query ........................................................................................... 64
Validate the Query ................................................................................................................ 65
Apply Field Security .............................................................................................................. 65
Filter and Sort the Query in CSV, Banded, and Extract Reports .............................. 65
Adding special characters for filtering in CSV, Banded, and Extract Reports ..................................................................................................................................... 66
Adding special characters for Sorting in CSV,Banded, and Extract Reports ..................................................................................................................................... 67
Edit ADO Properties ............................................................................................................. 68
Summary .................................................................................................................................. 68
Scalar Sub Query ........................................................................................................................... 69
Introduction ............................................................................................................................ 69
Create the Main Query ........................................................................................................ 69
Create the Sub Query ........................................................................................................... 69
Execute the query ................................................................................................................. 70
Summary .................................................................................................................................. 70

www.evisions.com Argos - Argos DataBlock Designers Guide Page 5 of 112 Document Version 1.0 – Last Updated 10.22.2010
Correlated Sub Query .................................................................................................................. 71
Introduction ............................................................................................................................ 71
Create the Main Query ........................................................................................................ 71
Create the Sub Query ........................................................................................................... 72
Place the Sub Query into the Main Query ..................................................................... 75
Execute the query ................................................................................................................. 76
Non-Correlated Sub Query ........................................................................................................ 77
Introduction ............................................................................................................................ 77
Create the Main Query ........................................................................................................ 77
Create the Sub Query ........................................................................................................... 77
Place the Sub Query into the Main Query ..................................................................... 78
Execute the query ................................................................................................................. 79
Unions .............................................................................................................................................. 80
Introduction ............................................................................................................................ 80
Create the Main Query ........................................................................................................ 80
Create the Unions ................................................................................................................. 80
Summary .................................................................................................................................. 82
Report Scheduling ................................................................................................... 83
Introduction ............................................................................................................................ 83
The General Tab..................................................................................................................... 83
The Schedule Tab .................................................................................................................. 84
The Tasks Tab ......................................................................................................................... 84
The Events Tab ....................................................................................................................... 86
The API Tab ............................................................................................................................. 86
Execute the report Task....................................................................................................... 86
The Process and Save Task ................................................................................................. 87
The Saved States Task .......................................................................................................... 89
Executing the Saved State .................................................................................................. 89
Managing Saved States ....................................................................................................... 89
The Bursting Task .................................................................................................................. 90
Managing the Schedule ...................................................................................................... 91
Summary .................................................................................................................................. 92
Library of Objects ..................................................................................................... 93
Library Manager .................................................................................................................... 93
Types of Objects in the Library ......................................................................................... 94
www.evisions.com Argos - Argos DataBlock Designers Guide Page 6 of 112 Document Version 1.0 – Last Updated 10.22.2010
Using the Library ................................................................................................................... 94
Adding Styles to Banded Reports ............................................................................................ 95
Report Templates .................................................................................................................. 95
Styles ......................................................................................................................................... 95
Report Preview ....................................................................................................................... 95
Adding Styles to OLAP Data Cubes ......................................................................................... 96
Data Dictionary ......................................................................................................... 97
Introduction ................................................................................................................................... 97
Managing Data Dictionaries .............................................................................................. 97
Importing and Exporting Data Dictionaries .................................................................. 98
Using the Data Dictionary in Argos ......................................................................................... 98
Adding Aliases to the Dictionary from within Argos ................................................. 99
Adding Joins from within Argos ....................................................................................... 99
Alias and Join Info Applied to Query............................................................................ 100
Security ..................................................................................................................... 101
Object Level Security ................................................................................................................ 101
Adding Security .................................................................................................................. 101
Removing Security ............................................................................................................. 102
Group Security .................................................................................................................... 102
Field Level Security ................................................................................................................... 103
The CO-OP User Community Share ................................................................ 105
Publishing to the CO-OP .................................................................................................. 105
Complete the Upload Form ............................................................................................ 105
Argos Resources .................................................................................................... 107
The Support Site ........................................................................................................................ 107
The CO-OP User Community ................................................................................................. 108
Important Links .......................................................................................................................... 108
Table of Figures ...................................................................................................... 109

www.evisions.com Argos - Argos DataBlock Designers Guide Page 7 of 112 Document Version 1.0 – Last Updated 10.22.2010
Trademark, Publishing Statement and Copyright Notice
© 2010 Evisions, Inc. All rights reserved.
This software and related documentation are provided under a license agreement containing restrictions on use and disclosure and are protected by intellectual property laws. No part of this document may be reproduced, stored in or introduced into a retrieval system, or transmitted in any form or by any means (electronic, mechanical, photocopying, recording, or otherwise), or for any purpose, without the express written permission of Evisions, Inc.
The information contained herein is subject to change without notice and is not warranted to be error-free. Product features referenced herein for a period of time may not match product contents. Evisions, Inc. does not warrant that the functions contained in the software will meet your requirements or that the operation of the software will be uninterrupted or error free. Evisions, Inc. reserves the right to make changes and/or improvements in the software without notice at any time.
This software and documentation may provide access to or information on content, products, and services from third parties. Evisions, Inc. and its affiliates are not responsible for and expressly disclaim all warranties of any kind with respect to third-party content, products, and services. Evisions, Inc. and its affiliates will not be responsible for any loss, costs, or damages incurred due to your access to or use of third-party content, products, or services. Evisions, Inc. does not endorse the content or developer of any products or web sites mentioned.
All information in this guide is designed for instructional purposes only. Evisions, Inc. makes no guarantees regarding the accuracy or performance of any techniques used in this guide. Software configurations and environments may vary, and some techniques used in this guide may not operate efficiently under all configurations. This guide may contain examples of various technologies or products, which are the sole property and responsibility of their creators.
Trademarks are the property of the respective owners for any products mentioned herein.
www.evisions.com Argos - Argos DataBlock Designers Guide Page 8 of 112 Document Version 1.0 – Last Updated 10.22.2010
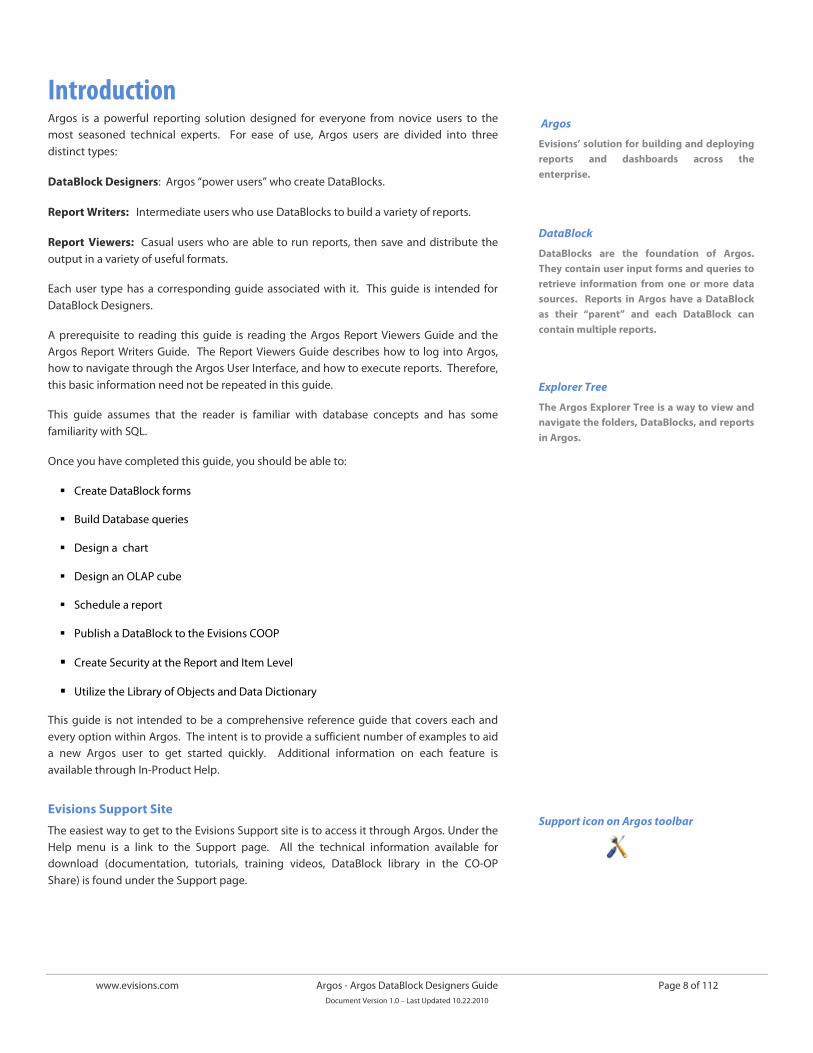
Introduction Argos is a powerful reporting solution designed for everyone from novice users to the most seasoned technical experts. For ease of use, Argos users are divided into three distinct types:
DataBlock Designers: Argos “power users” who create DataBlocks.
Report Writers: Intermediate users who use DataBlocks to build a variety of reports.
Report Viewers: Casual users who are able to run reports, then save and distribute the output in a variety of useful formats.
Each user type has a corresponding guide associated with it. This guide is intended for DataBlock Designers.
A prerequisite to reading this guide is reading the Argos Report Viewers Guide and the Argos Report Writers Guide. The Report Viewers Guide describes how to log into Argos, how to navigate through the Argos User Interface, and how to execute reports. Therefore, this basic information need not be repeated in this guide.
This guide assumes that the reader is familiar with database concepts and has some familiarity with SQL.
Once you have completed this guide, you should be able to:
Create DataBlock forms
Build Database queries
Design a chart
Design an OLAP cube
Schedule a report
Publish a DataBlock to the Evisions COOP
Create Security at the Report and Item Level
Utilize the Library of Objects and Data Dictionary
This guide is not intended to be a comprehensive reference guide that covers each and every option within Argos. The intent is to provide a sufficient number of examples to aid a new Argos user to get started quickly. Additional information on each feature is available through In-Product Help.
Evisions Support Site
The easiest way to get to the Evisions Support site is to access it through Argos. Under the Help menu is a link to the Support page. All the technical information available for download (documentation, tutorials, training videos, DataBlock library in the CO-OP Share) is found under the Support page.
Argos
Evisions’ solution for building and deploying reports and dashboards across the enterprise.
DataBlock
DataBlocks are the foundation of Argos. They contain user input forms and queries to retrieve information from one or more data sources. Reports in Argos have a DataBlock as their “parent” and each DataBlock can contain multiple reports.
Explorer Tree
The Argos Explorer Tree is a way to view and navigate the folders, DataBlocks, and reports in Argos.
Support icon on Argos toolbar
www.evisions.com Argos - Argos DataBlock Designers Guide Page 9 of 112 Document Version 1.0 – Last Updated 10.22.2010
Evisions can also provide more in-depth and even customized training via our Professional Services department. Visit the Consulting Services page on the Evisions web site at
http://www.evisions.com/Services/Overview.aspx.
In Product Help
In addition to the Support site is In-Product Help. You can access In-Product Help a few different ways. There is a link under the Help menu to Argos Help. There is a button on the toolbar, and you can also use your F1 key. Most screens within Argos also have a link to Argos Help as well.
Sample Database
The examples within this guide are based upon an MS Access database that was created to assist you with becoming familiar with Argos. You can download the database from the Evisions Web site at
http://www.evisions.com/Default.aspx?tabid=67&id=745.
The name of the file is “Sample.zip” and after unzipping the file name will be “Sample.accdb”. Six DataBlocks are included in the zip file that are used by the Argos Report Writers Guide.
You can use the database to follow along with the examples in this guide. A description of the database contents (.pdf file) can be downloaded from the Evisions web site and is named “Argos User Guides Sample Database Description” and is located at http://www.evisions.com/Default.aspx?tabid=67&id=746.
This document also describes how to create the ADO connection to the sample database.
Contact your MAPS Administrator to install the database and create the ADO connection
www.evisions.com Argos - Argos DataBlock Designers Guide Page 10 of 112 Document Version 1.0 – Last Updated 10.22.2010
Getting Started
Starting Argos
Argos is Windows PC software which is web-enabled, meaning it is accessible from your web browser via an Internet connection. Before launching Argos, you may need to disable any pop-up blockers running on your computer. To disable the pop-up blocker in Microsoft (MS) Internet Explorer, select Tools, Pop-up Blocker, Turn Off Pop-up Blocker. You should be able to re-enable the pop-up blocker once you have downloaded the software.
Connect to the Server
Type the web address provided from your system administrator into the address bar of your browser to access the Multiple Application Platform Server (MAPS) launch page. This webpage provides a central access point for all MAPS applications, including Argos, FormFusion, IntelleCheck and the MAP Server Configuration Tool.
Start Argos
Click Argos from the menu on the left.
Click the “Start Here” button to launch Argos.
NOTE: If this is the first time Argos has been launched from this PC, an information bar will appear at the top of the screen. Click the bar and choose “Install ActiveX Control” to install the “MAP Client Universal Launcher” from “Global Evisions Solutions, Inc.”
Enter your user name and password (obtained from your system administrator) in the Login box. The “Remember this user” and “Remember the password for this user” are check boxes (available as determined by the MAPS Administrator) that are optional and should not be used on shared computers. Check them as desired.
Click the Login button.
Change Password
To change your password, select Tools from the menu at the top of the screen and then select Change Password. You must know your current password in order to change it. The password strength indicator will help you determine if your password is secure enough. It is advisable to contact your system administrator before changing your password to verify that the change will not produce any undesirable results.
Browser support
Argos is designed to operate with MS Internet Explorer browser. You can also use other browsers, such as Firefox, but they may require some configuration first.
Multiple Application Platform Server
MAPS is the server that delivers the Argos software to users. Once Argos is installed, users connect to MAPS which fetches data and performs other tasks for them.
FormFusion
Evisions’ solution for enhancing documents and managing distribution via email, imaging software, print, etc. Users can rearrange and add data and images, change the layout, format fonts, etc.
IntelleCheck
Evisions solution for payment processing – AP, payroll and refund checks, Direct Deposit Advices and electronic refunds.
ActiveX Control
Browser software components that are needed to launch Argos.
Password Strategies
The following strategies will help you make a more secure password.
Increase password length Include letters and numbers. Use both upper and lower case. Include special characters [, {, !, ?, etc
www.evisions.com Argos - Argos DataBlock Designers Guide Page 11 of 112 Document Version 1.0 – Last Updated 10.22.2010
Navigation Argos has been designed with an intelligent interface that knows your user type and configures menus and buttons to show only those actions permitted.
Menus across the top allow you to take simple actions such as logging into the product, finding items in the Explorer, customizing your Argos toolbars and changing your password. You can also access the integrated Help system or visit the Evisions website that has many helpful resources available. The most common actions are replicated as buttons just beneath the menus.
At the very bottom of the screen, the status bar tells you what server you are logged into, your user name and user type.
Between the top and bottom toolbars is the Argos work area. The work area is broken into two halves. The left half contains the Navigation area while the right half contains the Action area.
Action Area
The right hand side of the screen will have buttons for any actions you can take on a selected object. The buttons that show will depend on the type of object you select in the Navigation area.
Navigation Area
This area contains the objects that you can perform actions on. There are three different views you can use for the Navigation area by clicking the desired tab (Explorer, QuickLaunch, Dashboards). Each of these views is described below.
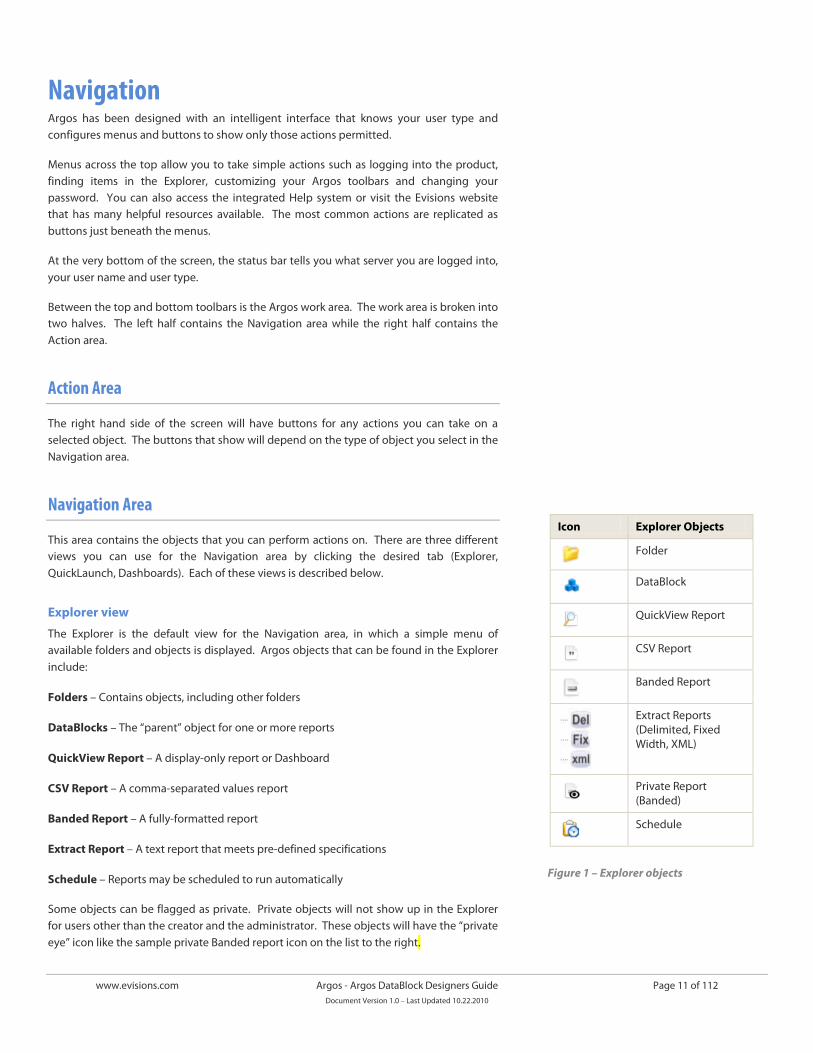
Explorer view
The Explorer is the default view for the Navigation area, in which a simple menu of available folders and objects is displayed. Argos objects that can be found in the Explorer include:
Folders – Contains objects, including other folders
DataBlocks – The “parent” object for one or more reports
QuickView Report – A display-only report or Dashboard
CSV Report – A comma-separated values report
Banded Report – A fully-formatted report
Extract Report – A text report that meets pre-defined specifications
Schedule – Reports may be scheduled to run automatically
Some objects can be flagged as private. Private objects will not show up in the Explorer for users other than the creator and the administrator. These objects will have the “private eye” icon like the sample private Banded report icon on the list to the right.
Icon Explorer Objects
Folder
DataBlock
QuickView Report
CSV Report
Banded Report
Extract Reports (Delimited, Fixed Width, XML)
Private Report (Banded)
Schedule
Figure 1 – Explorer objects
www.evisions.com Argos - Argos DataBlock Designers Guide Page 12 of 112 Document Version 1.0 – Last Updated 10.22.2010
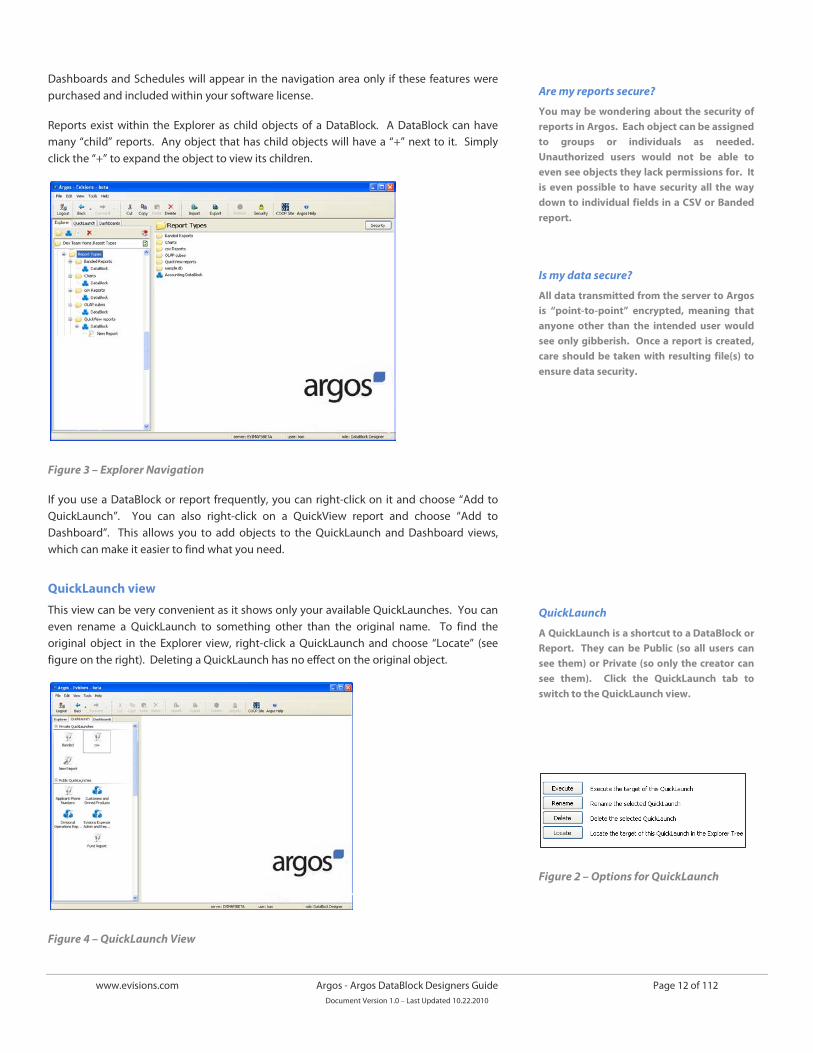
Dashboards and Schedules will appear in the navigation area only if these features were purchased and included within your software license.
Reports exist within the Explorer as child objects of a DataBlock. A DataBlock can have many “child” reports. Any object that has child objects will have a “+” next to it. Simply click the “+” to expand the object to view its children.
Figure 3 – Explorer Navigation
If you use a DataBlock or report frequently, you can right-click on it and choose “Add to QuickLaunch”. You can also right-click on a QuickView report and choose “Add to Dashboard”. This allows you to add objects to the QuickLaunch and Dashboard views, which can make it easier to find what you need.
QuickLaunch view
This view can be very convenient as it shows only your available QuickLaunches. You can even rename a QuickLaunch to something other than the original name. To find the original object in the Explorer view, right-click a QuickLaunch and choose “Locate” (see figure on the right). Deleting a QuickLaunch has no effect on the original object.
Figure 4 – QuickLaunch View
Are my reports secure?
You may be wondering about the security of reports in Argos. Each object can be assigned to groups or individuals as needed. Unauthorized users would not be able to even see objects they lack permissions for. It is even possible to have security all the way down to individual fields in a CSV or Banded report.
Is my data secure?
All data transmitted from the server to Argos is “point-to-point” encrypted, meaning that anyone other than the intended user would see only gibberish. Once a report is created, care should be taken with resulting file(s) to ensure data security.
QuickLaunch
A QuickLaunch is a shortcut to a DataBlock or Report. They can be Public (so all users can see them) or Private (so only the creator can see them). Click the QuickLaunch tab to switch to the QuickLaunch view.
Figure 2 – Options for QuickLaunch
www.evisions.com Argos - Argos DataBlock Designers Guide Page 13 of 112 Document Version 1.0 – Last Updated 10.22.2010
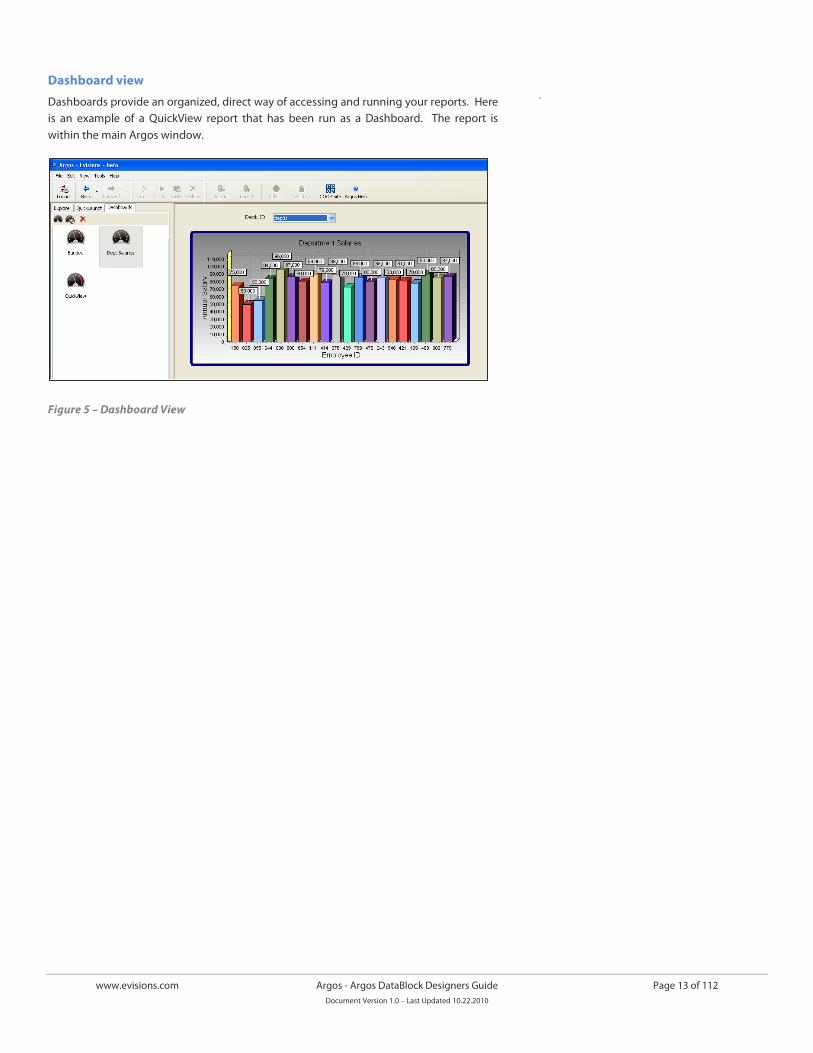
Dashboard view
Dashboards provide an organized, direct way of accessing and running your reports. Here is an example of a QuickView report that has been run as a Dashboard. The report is within the main Argos window.
Figure 5 – Dashboard View
.
www.evisions.com Argos - Argos DataBlock Designers Guide Page 14 of 112 Document Version 1.0 – Last Updated 10.22.2010
Definitions
DataBlock
The DataBlock is the foundation from which all reports are created and contains Forms and Queries. Only users with DataBlock Designer privileges can create DataBlocks.
The Queries obtain data from a database. When results of queries are displayed on a form as shown in the figure below, this is called a QuickView Report. In the case of CSV, Banded, and Extract Reports, the results of the queries become input to the report design with the results displayed or stored elsewhere. Within the Argos Explorer tree, reports exist as "child" objects of a DataBlock.
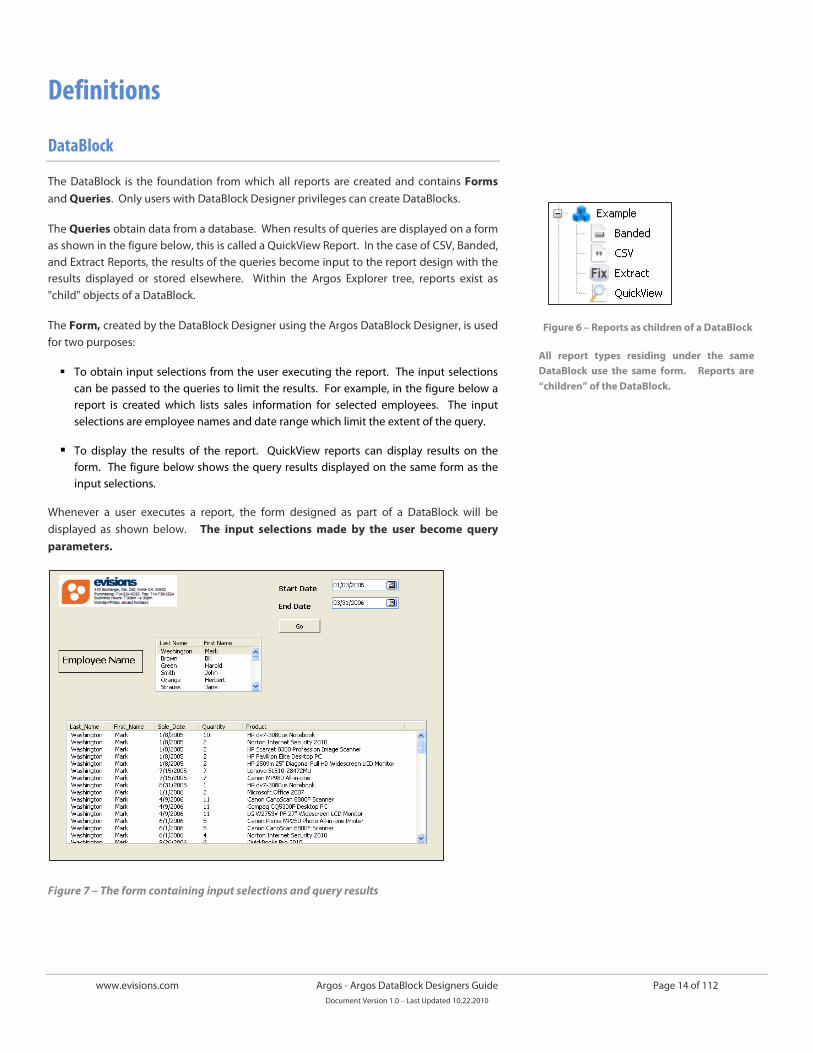
The Form, created by the DataBlock Designer using the Argos DataBlock Designer, is used for two purposes:
To obtain input selections from the user executing the report. The input selections can be passed to the queries to limit the results. For example, in the figure below a report is created which lists sales information for selected employees. The input selections are employee names and date range which limit the extent of the query.
To display the results of the report. QuickView reports can display results on the form. The figure below shows the query results displayed on the same form as the input selections.
Whenever a user executes a report, the form designed as part of a DataBlock will be displayed as shown below. The input selections made by the user become query parameters.
Figure 7 – The form containing input selections and query results
Figure 6 – Reports as children of a DataBlock
All report types residing under the same DataBlock use the same form. Reports are “children” of the DataBlock.
www.evisions.com Argos - Argos DataBlock Designers Guide Page 15 of 112 Document Version 1.0 – Last Updated 10.22.2010
A Form can contain various types of objects such as:
Edit boxes, list boxes, drop down boxes, scroll boxes - all of which can be used for data entry and display.
Static and dynamic labels.
Graphics images from a file or a database.
Buttons used to control navigation and query execution.
Shape objects
Date objects to enter/display dates with an intuitive calendar to ease selection.
A wide variety of charts and graphs (requires Dashboard option).
OLAP Data Cube objects for intuitively viewing and analyzing data (requires OLAP option).
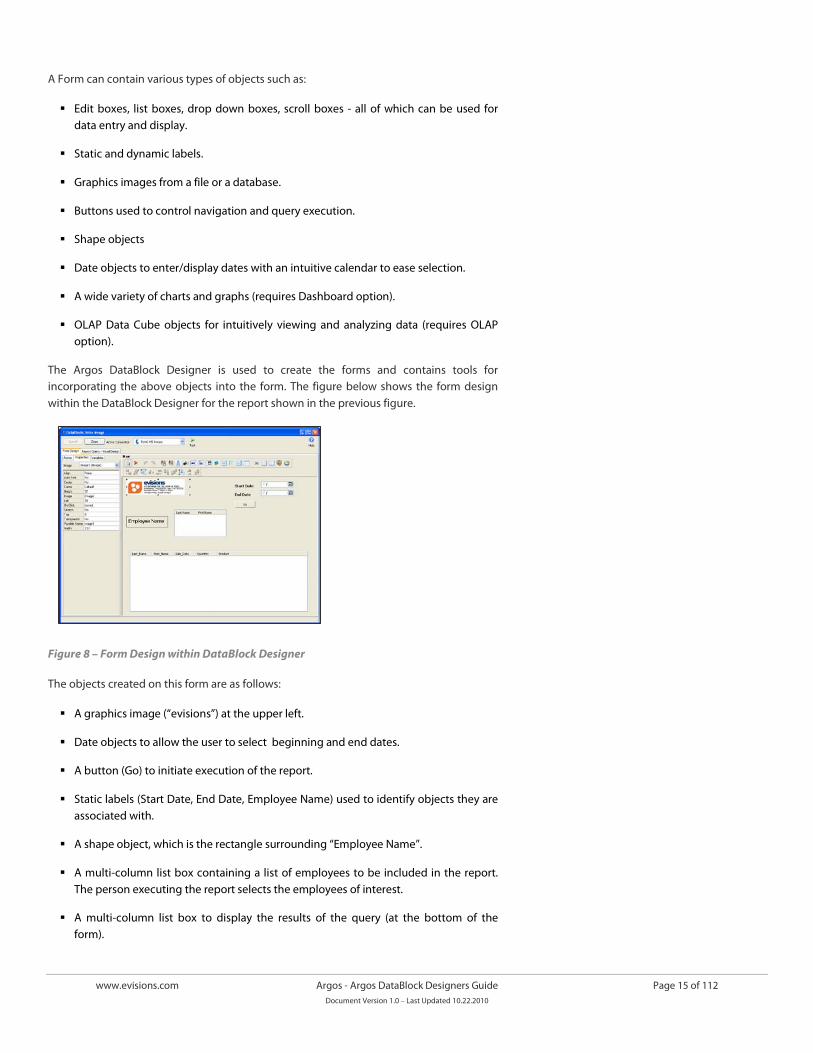
The Argos DataBlock Designer is used to create the forms and contains tools for incorporating the above objects into the form. The figure below shows the form design within the DataBlock Designer for the report shown in the previous figure.
Figure 8 – Form Design within DataBlock Designer
The objects created on this form are as follows:
A graphics image (“evisions”) at the upper left.
Date objects to allow the user to select beginning and end dates.
A button (Go) to initiate execution of the report.
Static labels (Start Date, End Date, Employee Name) used to identify objects they are associated with.
A shape object, which is the rectangle surrounding “Employee Name”.
A multi-column list box containing a list of employees to be included in the report. The person executing the report selects the employees of interest.
A multi-column list box to display the results of the query (at the bottom of the form).
www.evisions.com Argos - Argos DataBlock Designers Guide Page 16 of 112 Document Version 1.0 – Last Updated 10.22.2010
Other object types could have been included on the form. For example, a chart or OLAP cube could have been designed with its results displayed on the form. A description of available objects is included within the next section.
It is important to note that certain objects (such as edit boxes, list boxes, etc.) can be used to obtain input from the person executing the report and can also be used to display the results of the query. In this example, multi-column list boxes were used to select employee names and also to display the results of the query. Other types of objects can also be used which are able to obtain input and display results.
The advantage of having reports tied to DataBlocks is that you don't need to create separate input selections and separate queries for every report you create. Similar reports can share the same form, and the same query.
As mentioned earlier, CSV, Banded, and Reports use the same form as QuickView Reports within the DataBlock to gather input selections. However these reports do not display data on the form as is done with QuickView reports. Although CSV, Banded, and Extract reports share the same form within a DataBlock, they do not share the same query with a QuickView report (this will be explained further in the examples section of this document).
The components of a DataBlock described above mention that the DataBlock contains a form and query; however DataBlocks could contain multiple forms and queries. Creation of forms and queries (Form Queries) used for QuickView reports is done within the “Form Design Tab” within the DataBlock Designer. Creation of a query used by CSV, Banded, and Extract reports (Report Queries) is done within the “Report Query – Visual Design” tab. The creation and use of both types of queries will be explained in the examples that follow.
OLAP Data Cube
OLAP is a specific way to represent statistical data for executives, specialists and analysts. It is designed to aid in decision-making and better information understanding. The main idea is to answer the user’s questions, arising at the work time, on-the-fly, quickly. A popular definition is “A million spreadsheets in a box.” The key to OLAP is its ability to allow the end user to configure different views of the same data.
An OLAP system allows user to get into details or generalize, filter, sort and regroup data at the time of analysis. Intermediate and final totals are recalculated instantly.
The user is presented data in an electronic spreadsheet format. By moving rows and columns or clicking them, the user makes the system perform calculations and show data in different aspects. Thus, the user can produce many reports out of a single dataset on his own, without any assistance from IT-specialists.
Argos supports filtered OLAP cubes in which cubes can be built off of ANY data source – you are not dependent on a data warehouse.
Dashboards and Charting
This option provides display of data using charts, gauges, maps, and other graphical elements providing an at-a-glance understanding of information. Over 40 chart types (bar, line, gauge, 3D, and more) are provided. Charts can be included within QuickView and Banded Reports.
Form Queries and Report Queries
Within a DataBlock, the queries used by QuickView reports are called the Form Queries, and the query used by CSV and Banded Reports is called the Report Query.
There can only be one Report Query per DataBlock.
Within a DataBlock, multiple Form Queries can be created to populate list boxes and drop down boxes. Queries can also be used to assign values to Argos Variables.
All report types within a DataBlock share the same form.
www.evisions.com Argos - Argos DataBlock Designers Guide Page 17 of 112 Document Version 1.0 – Last Updated 10.22.2010
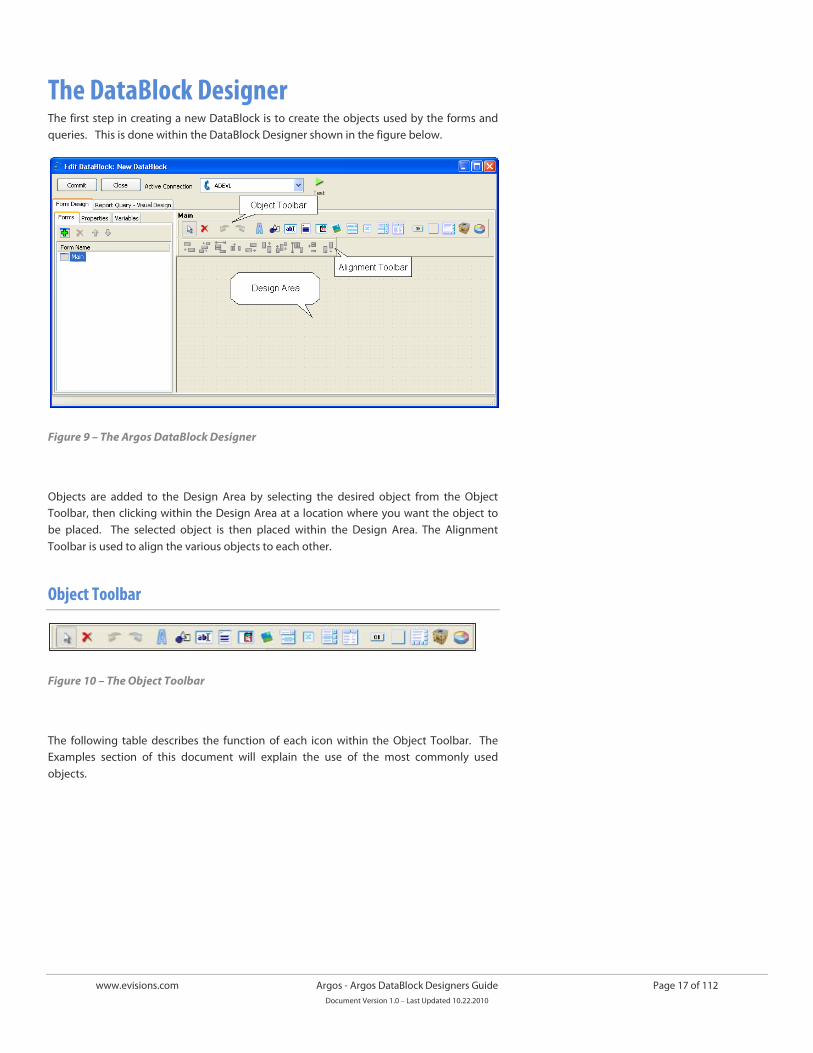
The DataBlock Designer The first step in creating a new DataBlock is to create the objects used by the forms and queries. This is done within the DataBlock Designer shown in the figure below.
Figure 9 – The Argos DataBlock Designer
Objects are added to the Design Area by selecting the desired object from the Object Toolbar, then clicking within the Design Area at a location where you want the object to be placed. The selected object is then placed within the Design Area. The Alignment Toolbar is used to align the various objects to each other.
Object Toolbar
Figure 10 – The Object Toolbar
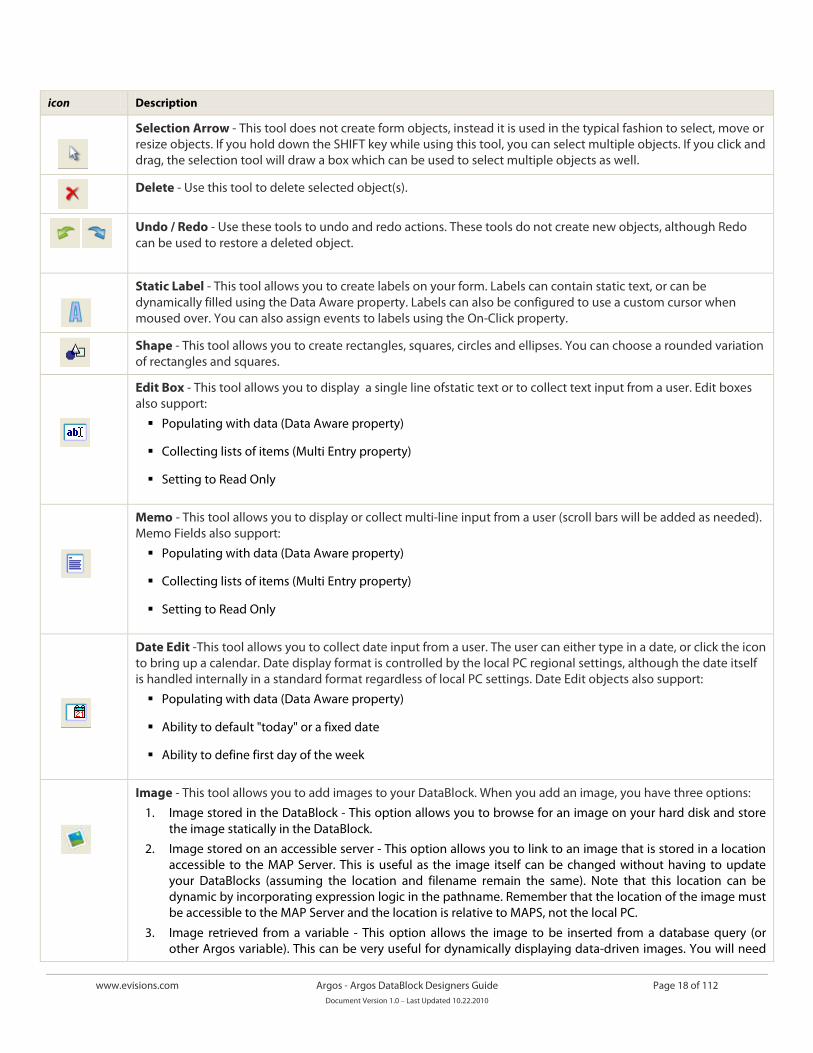
The following table describes the function of each icon within the Object Toolbar. The Examples section of this document will explain the use of the most commonly used objects.
www.evisions.com Argos - Argos DataBlock Designers Guide Page 18 of 112 Document Version 1.0 – Last Updated 10.22.2010
icon Description
Selection Arrow - This tool does not create form objects, instead it is used in the typical fashion to select, move or resize objects. If you hold down the SHIFT key while using this tool, you can select multiple objects. If you click and drag, the selection tool will draw a box which can be used to select multiple objects as well.
Delete - Use this tool to delete selected object(s).
Undo / Redo - Use these tools to undo and redo actions. These tools do not create new objects, although Redo can be used to restore a deleted object.
Static Label - This tool allows you to create labels on your form. Labels can contain static text, or can be dynamically filled using the Data Aware property. Labels can also be configured to use a custom cursor when moused over. You can also assign events to labels using the On-Click property.
Shape - This tool allows you to create rectangles, squares, circles and ellipses. You can choose a rounded variation of rectangles and squares.
Edit Box - This tool allows you to display a single line ofstatic text or to collect text input from a user. Edit boxes also support:
Populating with data (Data Aware property)
Collecting lists of items (Multi Entry property)
Setting to Read Only
Memo - This tool allows you to display or collect multi-line input from a user (scroll bars will be added as needed). Memo Fields also support:
Populating with data (Data Aware property)
Collecting lists of items (Multi Entry property)
Setting to Read Only
Date Edit -This tool allows you to collect date input from a user. The user can either type in a date, or click the icon to bring up a calendar. Date display format is controlled by the local PC regional settings, although the date itself is handled internally in a standard format regardless of local PC settings. Date Edit objects also support:
Populating with data (Data Aware property)
Ability to default "today" or a fixed date
Ability to define first day of the week
Image - This tool allows you to add images to your DataBlock. When you add an image, you have three options:
1. Image stored in the DataBlock - This option allows you to browse for an image on your hard disk and store the image statically in the DataBlock.
2. Image stored on an accessible server - This option allows you to link to an image that is stored in a location accessible to the MAP Server. This is useful as the image itself can be changed without having to update your DataBlocks (assuming the location and filename remain the same). Note that this location can be dynamic by incorporating expression logic in the pathname. Remember that the location of the image must be accessible to the MAP Server and the location is relative to MAPS, not the local PC.
3. Image retrieved from a variable - This option allows the image to be inserted from a database query (or other Argos variable). This can be very useful for dynamically displaying data-driven images. You will need
www.evisions.com Argos - Argos DataBlock Designers Guide Page 19 of 112 Document Version 1.0 – Last Updated 10.22.2010
to specify which variable holds the image and the MIME type of the stored image.
Image objects can be set to autosize (to match the exact size of the image) or you can turn that property off and enable stretch if you need to make the image larger or smaller.
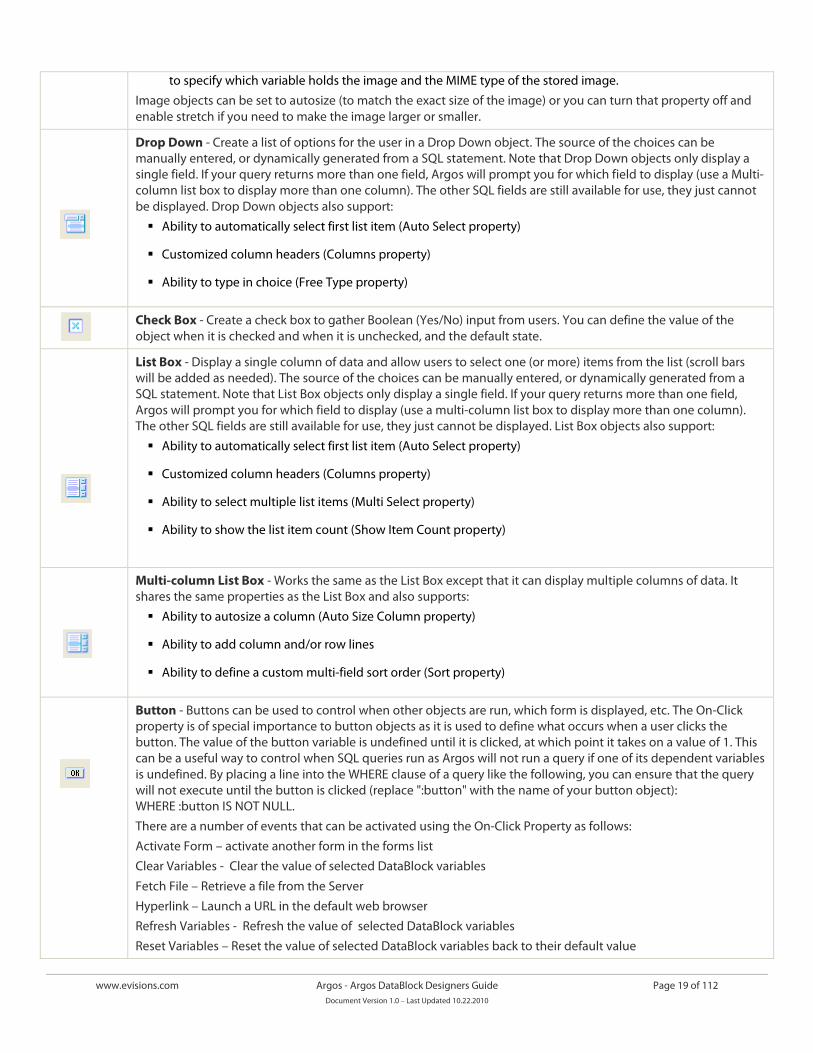
Drop Down - Create a list of options for the user in a Drop Down object. The source of the choices can be manually entered, or dynamically generated from a SQL statement. Note that Drop Down objects only display a single field. If your query returns more than one field, Argos will prompt you for which field to display (use a Multi-column list box to display more than one column). The other SQL fields are still available for use, they just cannot be displayed. Drop Down objects also support:
Ability to automatically select first list item (Auto Select property)
Customized column headers (Columns property)
Ability to type in choice (Free Type property)
Check Box - Create a check box to gather Boolean (Yes/No) input from users. You can define the value of the object when it is checked and when it is unchecked, and the default state.
List Box - Display a single column of data and allow users to select one (or more) items from the list (scroll bars will be added as needed). The source of the choices can be manually entered, or dynamically generated from a SQL statement. Note that List Box objects only display a single field. If your query returns more than one field, Argos will prompt you for which field to display (use a multi-column list box to display more than one column). The other SQL fields are still available for use, they just cannot be displayed. List Box objects also support:
Ability to automatically select first list item (Auto Select property)
Customized column headers (Columns property)
Ability to select multiple list items (Multi Select property)
Ability to show the list item count (Show Item Count property)
Multi-column List Box - Works the same as the List Box except that it can display multiple columns of data. It shares the same properties as the List Box and also supports:
Ability to autosize a column (Auto Size Column property)
Ability to add column and/or row lines
Ability to define a custom multi-field sort order (Sort property)
Button - Buttons can be used to control when other objects are run, which form is displayed, etc. The On-Click property is of special importance to button objects as it is used to define what occurs when a user clicks the button. The value of the button variable is undefined until it is clicked, at which point it takes on a value of 1. This can be a useful way to control when SQL queries run as Argos will not run a query if one of its dependent variables is undefined. By placing a line into the WHERE clause of a query like the following, you can ensure that the query will not execute until the button is clicked (replace ":button" with the name of your button object): WHERE :button IS NOT NULL.
There are a number of events that can be activated using the On-Click Property as follows:
Activate Form – activate another form in the forms list
Clear Variables - Clear the value of selected DataBlock variables
Fetch File – Retrieve a file from the Server
Hyperlink – Launch a URL in the default web browser
Refresh Variables - Refresh the value of selected DataBlock variables
Reset Variables – Reset the value of selected DataBlock variables back to their default value
www.evisions.com Argos - Argos DataBlock Designers Guide Page 20 of 112 Document Version 1.0 – Last Updated 10.22.2010
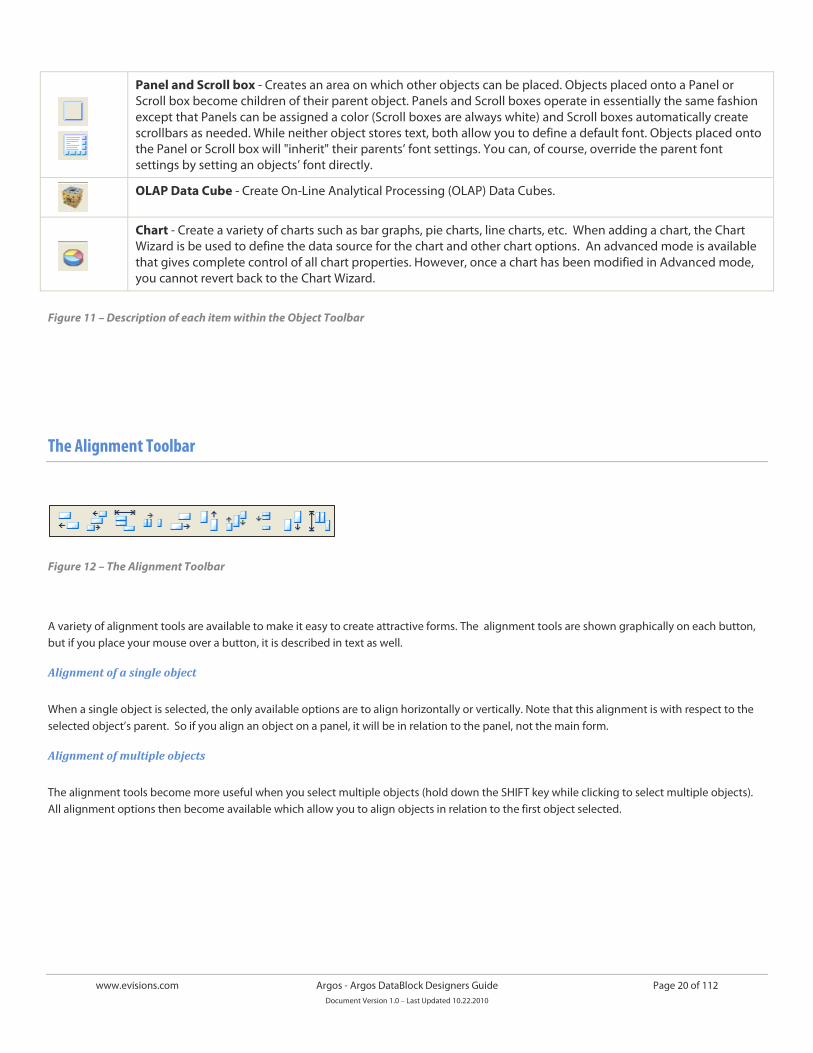
Panel and Scroll box - Creates an area on which other objects can be placed. Objects placed onto a Panel or Scroll box become children of their parent object. Panels and Scroll boxes operate in essentially the same fashion except that Panels can be assigned a color (Scroll boxes are always white) and Scroll boxes automatically create scrollbars as needed. While neither object stores text, both allow you to define a default font. Objects placed onto the Panel or Scroll box will "inherit" their parents’ font settings. You can, of course, override the parent font settings by setting an objects’ font directly.
OLAP Data Cube - Create On-Line Analytical Processing (OLAP) Data Cubes.
Chart - Create a variety of charts such as bar graphs, pie charts, line charts, etc. When adding a chart, the Chart Wizard is be used to define the data source for the chart and other chart options. An advanced mode is available that gives complete control of all chart properties. However, once a chart has been modified in Advanced mode, you cannot revert back to the Chart Wizard.
Figure 11 – Description of each item within the Object Toolbar
The Alignment Toolbar
Figure 12 – The Alignment Toolbar
A variety of alignment tools are available to make it easy to create attractive forms. The alignment tools are shown graphically on each button, but if you place your mouse over a button, it is described in text as well.
Alignment of a single object
When a single object is selected, the only available options are to align horizontally or vertically. Note that this alignment is with respect to the selected object’s parent. So if you align an object on a panel, it will be in relation to the panel, not the main form.
Alignment of multiple objects
The alignment tools become more useful when you select multiple objects (hold down the SHIFT key while clicking to select multiple objects). All alignment options then become available which allow you to align objects in relation to the first object selected.
www.evisions.com Argos - Argos DataBlock Designers Guide Page 21 of 112 Document Version 1.0 – Last Updated 10.22.2010
Building a Form Example 1
Introduction
This example will demonstrate how to create a DataBlock (consisting of a form and a QuickView Report) for the Employee Sales report shown earlier in this document. The report contains sales information for selected employees within a specified date range. The user executing the report selects employees of interest from a list-box and enters a date range into date objects.
The DataBlock uses the Employees, Orders, Order_Details, and Products tables within the Sample MS Access Database. The steps for creating the DataBlock are as follows:
Add DataBlock icon to Explorer
Log into Argos, select the location within the Explorer (typically under a folder) where you would like to add the DataBlock, right-click then select New/DataBlock. A DataBlock icon will be created within the Explorer with a default name of “New DataBlock”. Right-click on the icon and rename the DataBlock.
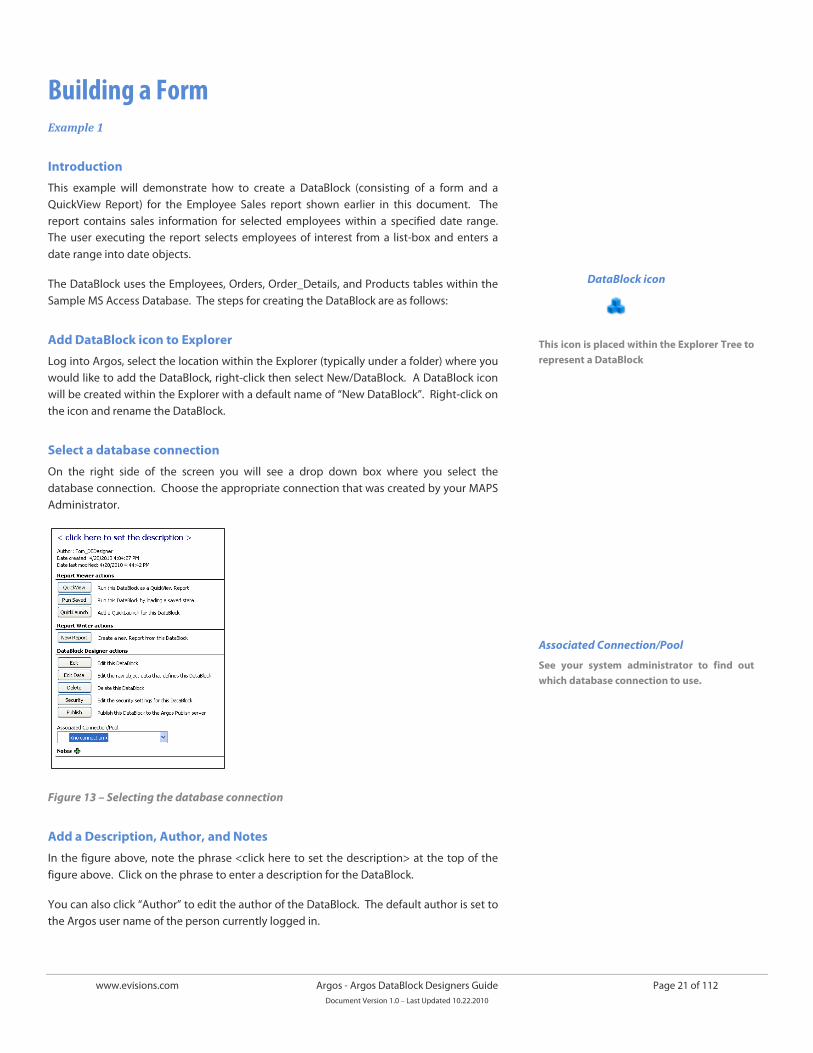
Select a database connection
On the right side of the screen you will see a drop down box where you select the database connection. Choose the appropriate connection that was created by your MAPS Administrator.
Figure 13 – Selecting the database connection
Add a Description, Author, and Notes
In the figure above, note the phrase <click here to set the description> at the top of the figure above. Click on the phrase to enter a description for the DataBlock.
You can also click “Author” to edit the author of the DataBlock. The default author is set to the Argos user name of the person currently logged in.
DataBlock icon
This icon is placed within the Explorer Tree to represent a DataBlock
Associated Connection/Pool
See your system administrator to find out which database connection to use.
www.evisions.com Argos - Argos DataBlock Designers Guide Page 22 of 112 Document Version 1.0 – Last Updated 10.22.2010
You can also click the green plus sign next to “Notes” at the bottom of the figure to add any number of notes.
Launch the Argos DataBlock Designer
On the right side of the screen, click “Edit” to edit the DataBlock. This launches the Argos DataBlock Designer where you will create the DataBlock.
Before adding any objects, click the “Form Design” tab on the upper left of the dialog box which displays the following screen.
Figure 14 – The Argos DataBlock Designer
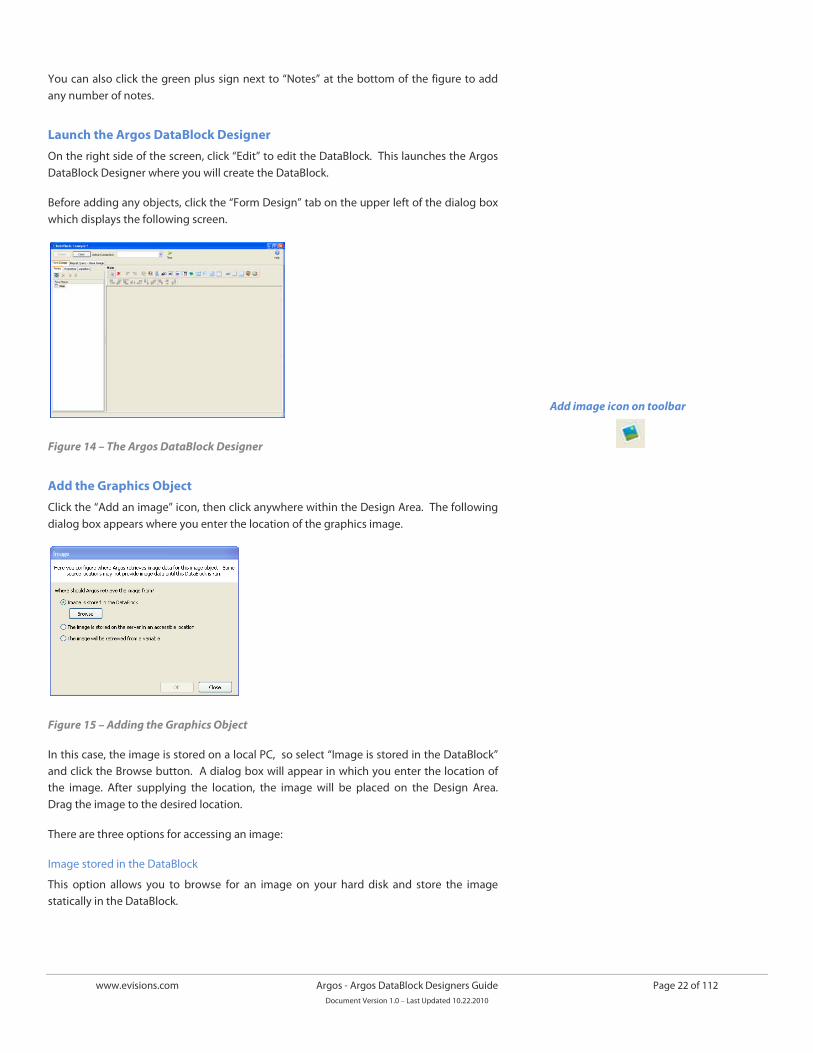
Add the Graphics Object
Click the “Add an image” icon, then click anywhere within the Design Area. The following dialog box appears where you enter the location of the graphics image.
Figure 15 – Adding the Graphics Object
In this case, the image is stored on a local PC, so select “Image is stored in the DataBlock” and click the Browse button. A dialog box will appear in which you enter the location of the image. After supplying the location, the image will be placed on the Design Area. Drag the image to the desired location.
There are three options for accessing an image:
Image stored in the DataBlock
This option allows you to browse for an image on your hard disk and store the image statically in the DataBlock.
Add image icon on toolbar
www.evisions.com Argos - Argos DataBlock Designers Guide Page 23 of 112 Document Version 1.0 – Last Updated 10.22.2010
Image stored on an accessible server
This option allows you to link to an image that is stored in a location accessible to the MAP Server. This is useful as the image itself can be changed without having to update your DataBlocks (assuming the location and filename remain the same).
Image retrieved from a variable
This option allows the image to be inserted from a database query (or other Argos variable). This can be very useful for dynamically displaying data-driven images. You will need to specify which variable holds the image and the MIME type of the stored image.
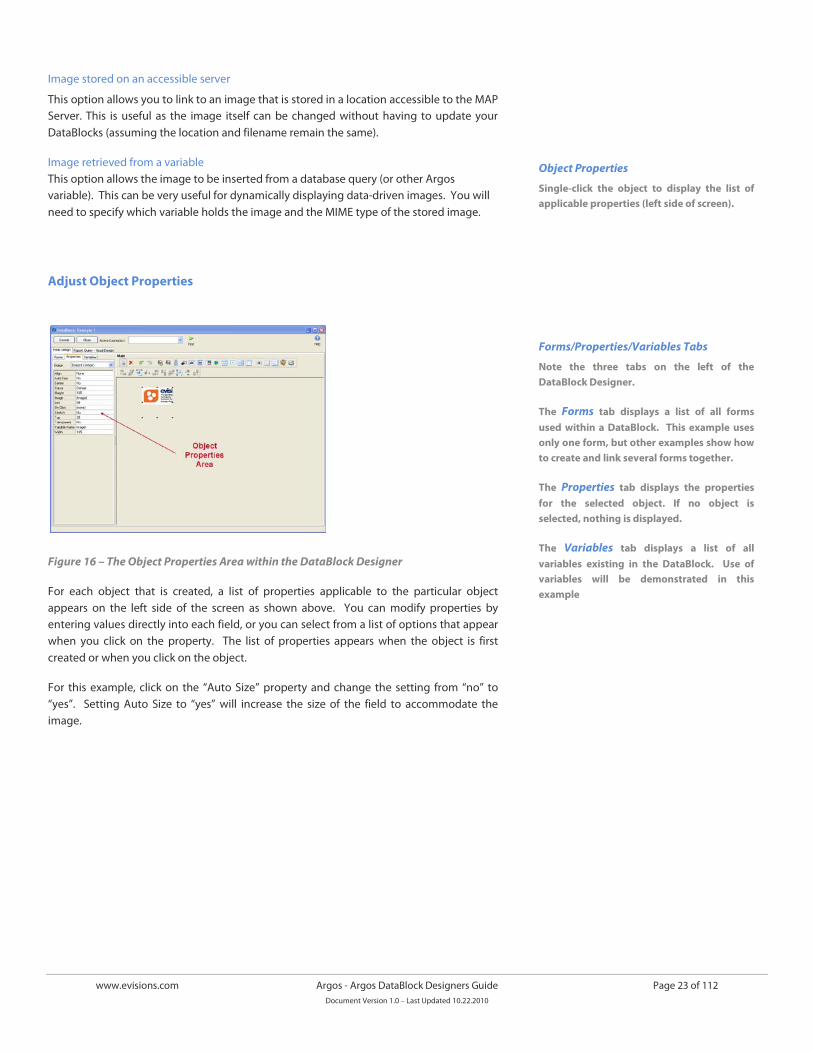
Adjust Object Properties
Figure 16 – The Object Properties Area within the DataBlock Designer
For each object that is created, a list of properties applicable to the particular object appears on the left side of the screen as shown above. You can modify properties by entering values directly into each field, or you can select from a list of options that appear when you click on the property. The list of properties appears when the object is first created or when you click on the object.
For this example, click on the “Auto Size” property and change the setting from “no” to “yes”. Setting Auto Size to “yes” will increase the size of the field to accommodate the image.
Object Properties
Single-click the object to display the list of applicable properties (left side of screen).
Forms/Properties/Variables Tabs
Note the three tabs on the left of the DataBlock Designer.
The Forms tab displays a list of all forms used within a DataBlock. This example uses only one form, but other examples show how to create and link several forms together.
The Properties tab displays the properties for the selected object. If no object is selected, nothing is displayed.
The Variables tab displays a list of all variables existing in the DataBlock. Use of variables will be demonstrated in this example
www.evisions.com Argos - Argos DataBlock Designers Guide Page 24 of 112 Document Version 1.0 – Last Updated 10.22.2010
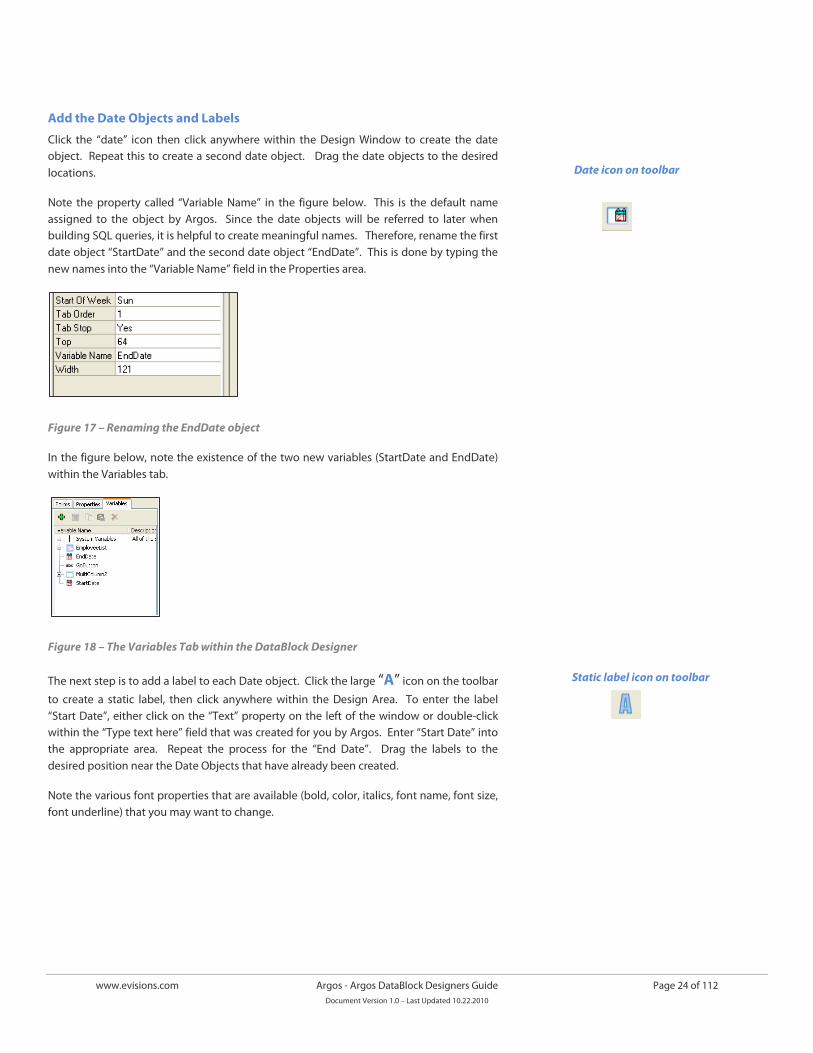
Add the Date Objects and Labels
Click the “date” icon then click anywhere within the Design Window to create the date object. Repeat this to create a second date object. Drag the date objects to the desired locations.
Note the property called “Variable Name” in the figure below. This is the default name assigned to the object by Argos. Since the date objects will be referred to later when building SQL queries, it is helpful to create meaningful names. Therefore, rename the first date object “StartDate” and the second date object “EndDate”. This is done by typing the new names into the “Variable Name” field in the Properties area.
Figure 17 – Renaming the EndDate object
In the figure below, note the existence of the two new variables (StartDate and EndDate) within the Variables tab.
Figure 18 – The Variables Tab within the DataBlock Designer
The next step is to add a label to each Date object. Click the large “A” icon on the toolbar
to create a static label, then click anywhere within the Design Area. To enter the label “Start Date”, either click on the “Text” property on the left of the window or double-click within the “Type text here” field that was created for you by Argos. Enter “Start Date” into the appropriate area. Repeat the process for the “End Date”. Drag the labels to the desired position near the Date Objects that have already been created.
Note the various font properties that are available (bold, color, italics, font name, font size, font underline) that you may want to change.
Date icon on toolbar
Static label icon on toolbar
www.evisions.com Argos - Argos DataBlock Designers Guide Page 25 of 112 Document Version 1.0 – Last Updated 10.22.2010
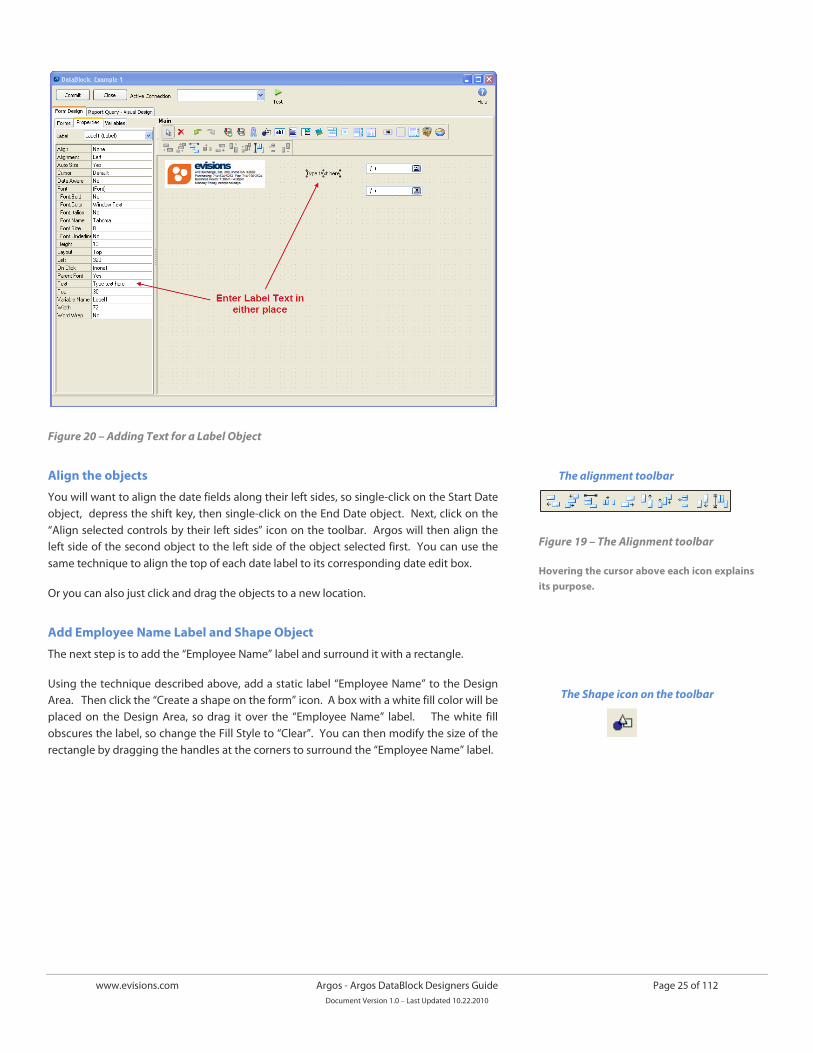
Figure 20 – Adding Text for a Label Object
Align the objects
You will want to align the date fields along their left sides, so single-click on the Start Date object, depress the shift key, then single-click on the End Date object. Next, click on the “Align selected controls by their left sides” icon on the toolbar. Argos will then align the left side of the second object to the left side of the object selected first. You can use the same technique to align the top of each date label to its corresponding date edit box.
Or you can also just click and drag the objects to a new location.
Add Employee Name Label and Shape Object
The next step is to add the “Employee Name” label and surround it with a rectangle.
Using the technique described above, add a static label “Employee Name” to the Design Area. Then click the “Create a shape on the form” icon. A box with a white fill color will be placed on the Design Area, so drag it over the “Employee Name” label. The white fill obscures the label, so change the Fill Style to “Clear”. You can then modify the size of the rectangle by dragging the handles at the corners to surround the “Employee Name” label.
The alignment toolbar
Figure 19 – The Alignment toolbar
Hovering the cursor above each icon explains its purpose.
The Shape icon on the toolbar
www.evisions.com Argos - Argos DataBlock Designers Guide Page 26 of 112 Document Version 1.0 – Last Updated 10.22.2010
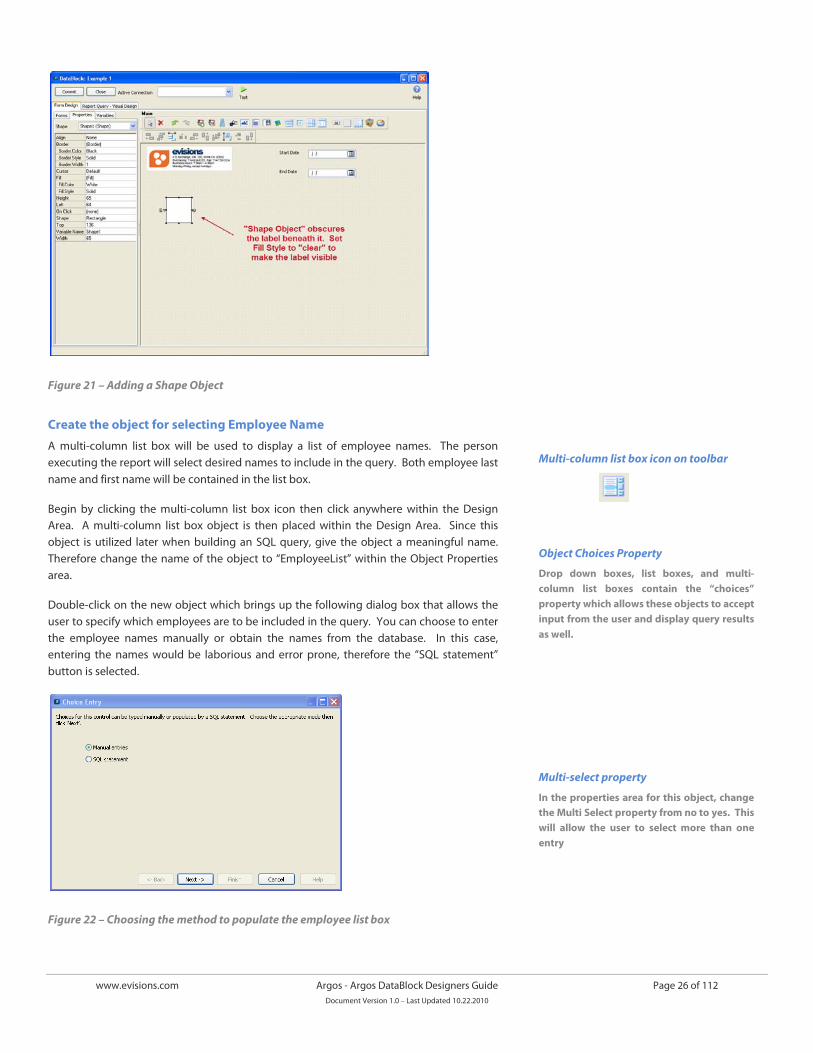
Figure 21 – Adding a Shape Object
Create the object for selecting Employee Name
A multi-column list box will be used to display a list of employee names. The person executing the report will select desired names to include in the query. Both employee last name and first name will be contained in the list box.
Begin by clicking the multi-column list box icon then click anywhere within the Design Area. A multi-column list box object is then placed within the Design Area. Since this object is utilized later when building an SQL query, give the object a meaningful name. Therefore change the name of the object to “EmployeeList” within the Object Properties area.
Double-click on the new object which brings up the following dialog box that allows the user to specify which employees are to be included in the query. You can choose to enter the employee names manually or obtain the names from the database. In this case, entering the names would be laborious and error prone, therefore the “SQL statement” button is selected.
Figure 22 – Choosing the method to populate the employee list box
Multi-column list box icon on toolbar
Object Choices Property
Drop down boxes, list boxes, and multi-column list boxes contain the “choices” property which allows these objects to accept input from the user and display query results as well.
Multi-select property
In the properties area for this object, change the Multi Select property from no to yes. This will allow the user to select more than one entry
www.evisions.com Argos - Argos DataBlock Designers Guide Page 27 of 112 Document Version 1.0 – Last Updated 10.22.2010
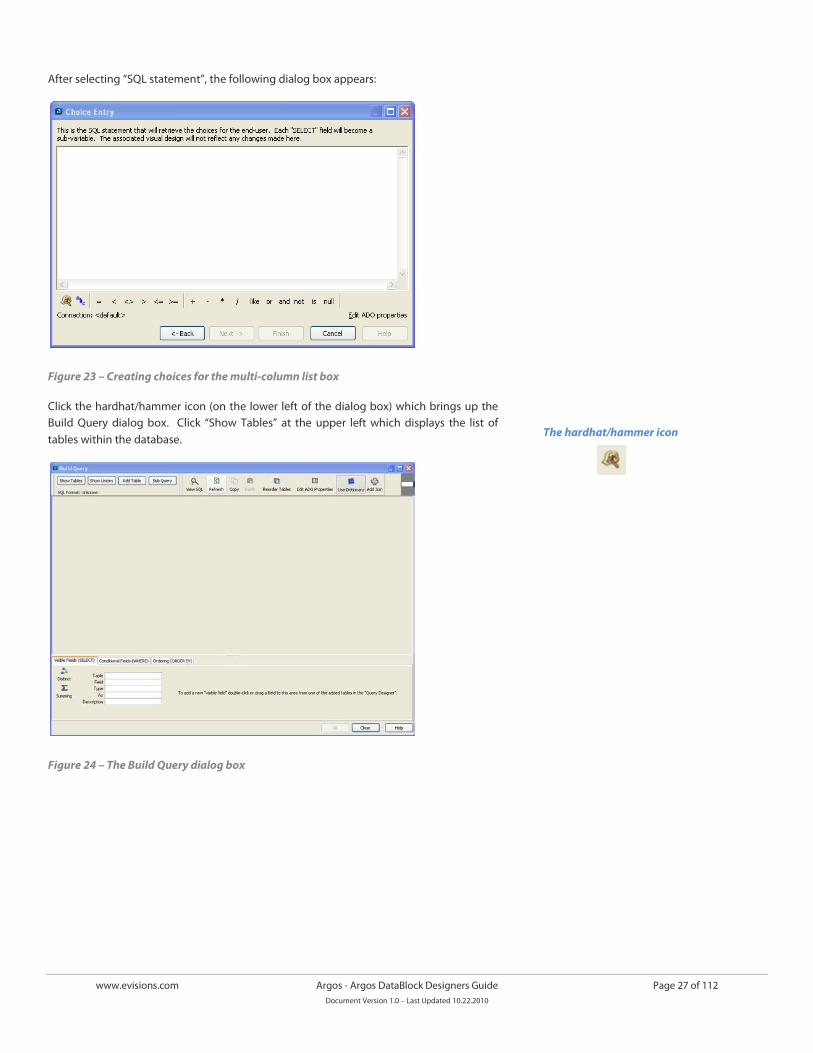
After selecting “SQL statement”, the following dialog box appears:
Figure 23 – Creating choices for the multi-column list box
Click the hardhat/hammer icon (on the lower left of the dialog box) which brings up the Build Query dialog box. Click “Show Tables” at the upper left which displays the list of tables within the database.
Figure 24 – The Build Query dialog box
The hardhat/hammer icon
www.evisions.com Argos - Argos DataBlock Designers Guide Page 28 of 112 Document Version 1.0 – Last Updated 10.22.2010
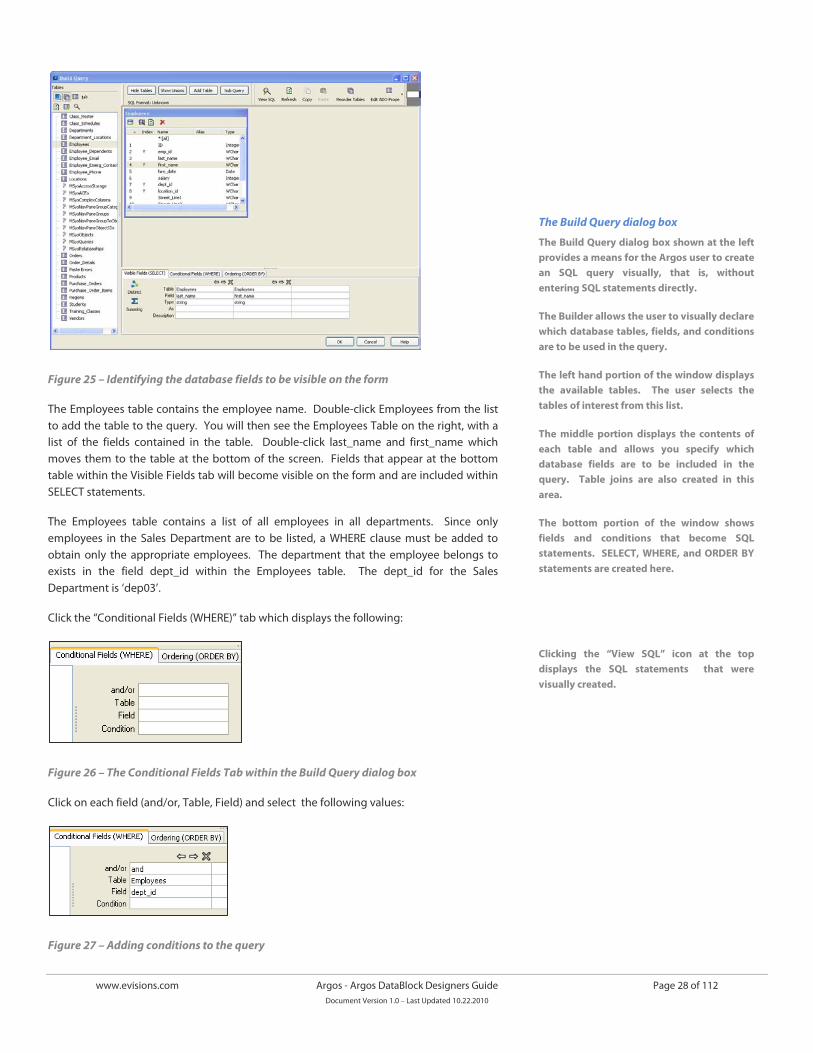
Figure 25 – Identifying the database fields to be visible on the form
The Employees table contains the employee name. Double-click Employees from the list to add the table to the query. You will then see the Employees Table on the right, with a list of the fields contained in the table. Double-click last_name and first_name which moves them to the table at the bottom of the screen. Fields that appear at the bottom table within the Visible Fields tab will become visible on the form and are included within SELECT statements.
The Employees table contains a list of all employees in all departments. Since only employees in the Sales Department are to be listed, a WHERE clause must be added to obtain only the appropriate employees. The department that the employee belongs to exists in the field dept_id within the Employees table. The dept_id for the Sales Department is ‘dep03’.
Click the “Conditional Fields (WHERE)” tab which displays the following:
Figure 26 – The Conditional Fields Tab within the Build Query dialog box
Click on each field (and/or, Table, Field) and select the following values:
Figure 27 – Adding conditions to the query
The Build Query dialog box
The Build Query dialog box shown at the left provides a means for the Argos user to create an SQL query visually, that is, without entering SQL statements directly.
The Builder allows the user to visually declare which database tables, fields, and conditions are to be used in the query.
The left hand portion of the window displays the available tables. The user selects the tables of interest from this list.
The middle portion displays the contents of each table and allows you specify which database fields are to be included in the query. Table joins are also created in this area.
The bottom portion of the window shows fields and conditions that become SQL statements. SELECT, WHERE, and ORDER BY statements are created here.
Clicking the “View SQL” icon at the top displays the SQL statements that were visually created.
www.evisions.com Argos - Argos DataBlock Designers Guide Page 29 of 112 Document Version 1.0 – Last Updated 10.22.2010
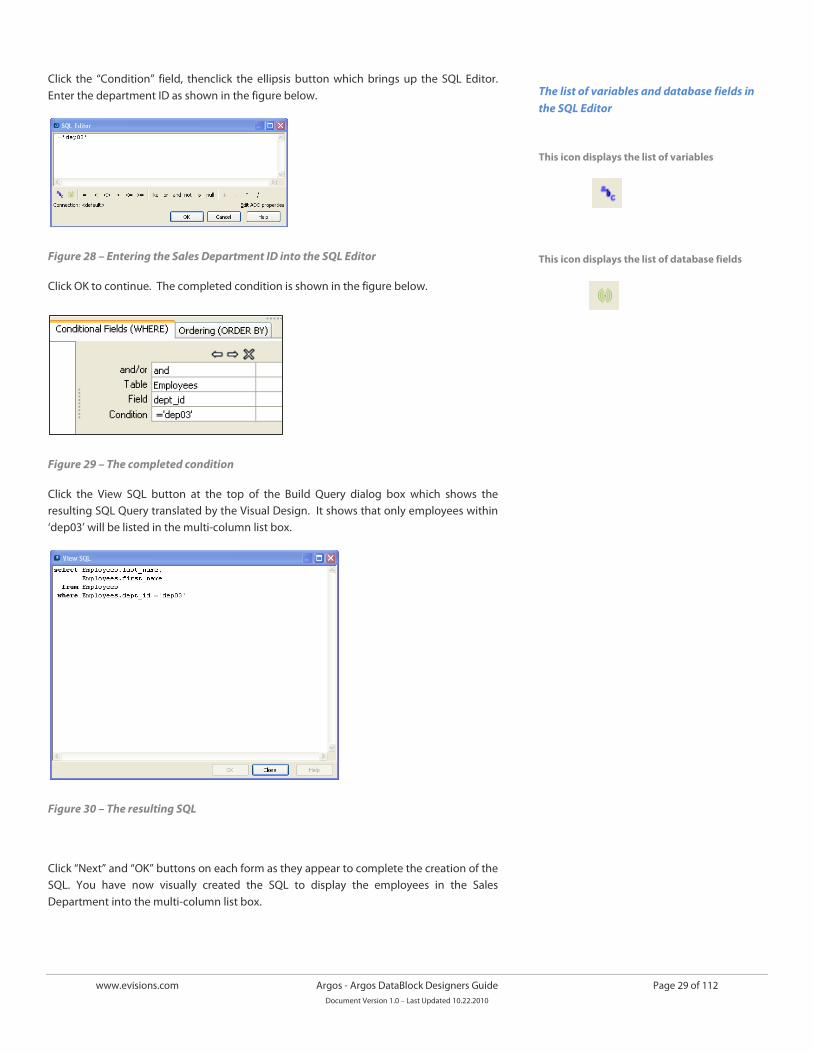
Click the “Condition” field, thenclick the ellipsis button which brings up the SQL Editor. Enter the department ID as shown in the figure below.
Figure 28 – Entering the Sales Department ID into the SQL Editor
Click OK to continue. The completed condition is shown in the figure below.
Figure 29 – The completed condition
Click the View SQL button at the top of the Build Query dialog box which shows the resulting SQL Query translated by the Visual Design. It shows that only employees within ‘dep03’ will be listed in the multi-column list box.
Figure 30 – The resulting SQL
Click “Next” and “OK” buttons on each form as they appear to complete the creation of the SQL. You have now visually created the SQL to display the employees in the Sales Department into the multi-column list box.
The list of variables and database fields in the SQL Editor
This icon displays the list of variables
This icon displays the list of database fields
www.evisions.com Argos - Argos DataBlock Designers Guide Page 30 of 112 Document Version 1.0 – Last Updated 10.22.2010
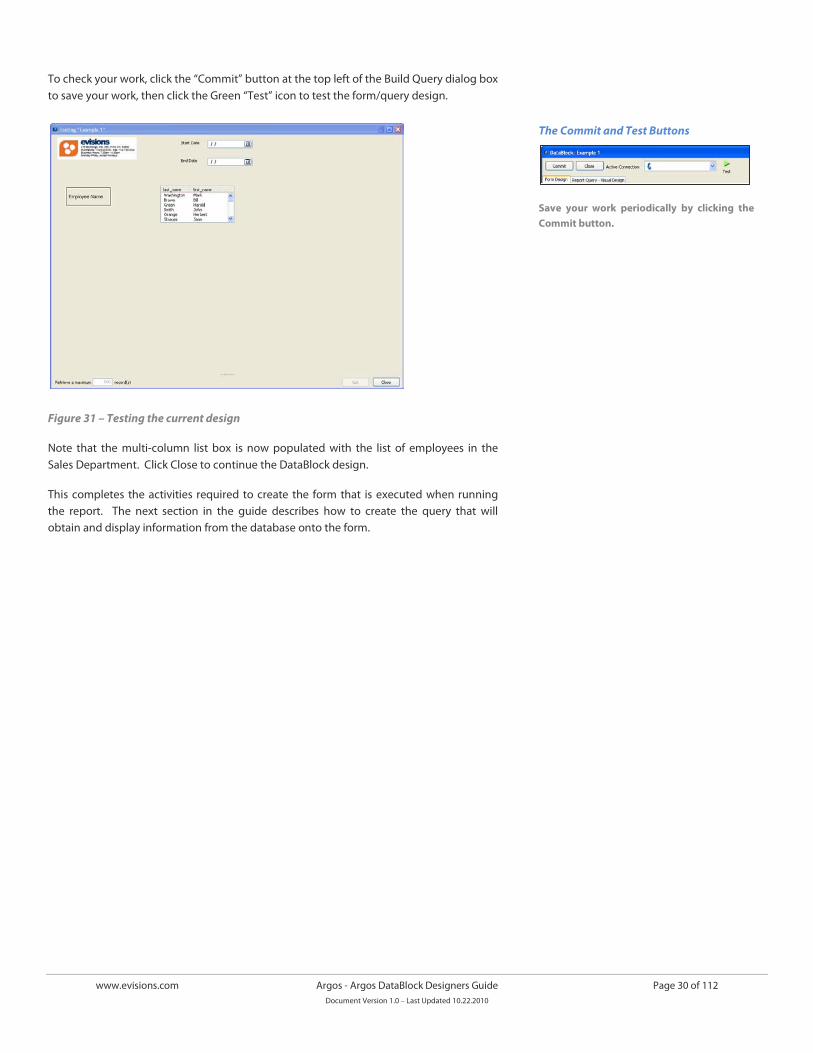
To check your work, click the “Commit” button at the top left of the Build Query dialog box to save your work, then click the Green “Test” icon to test the form/query design.
Figure 31 – Testing the current design
Note that the multi-column list box is now populated with the list of employees in the Sales Department. Click Close to continue the DataBlock design.
This completes the activities required to create the form that is executed when running the report. The next section in the guide describes how to create the query that will obtain and display information from the database onto the form.
The Commit and Test Buttons
Save your work periodically by clicking the Commit button.
www.evisions.com Argos - Argos DataBlock Designers Guide Page 31 of 112 Document Version 1.0 – Last Updated 10.22.2010
Building a Query
Form Queries
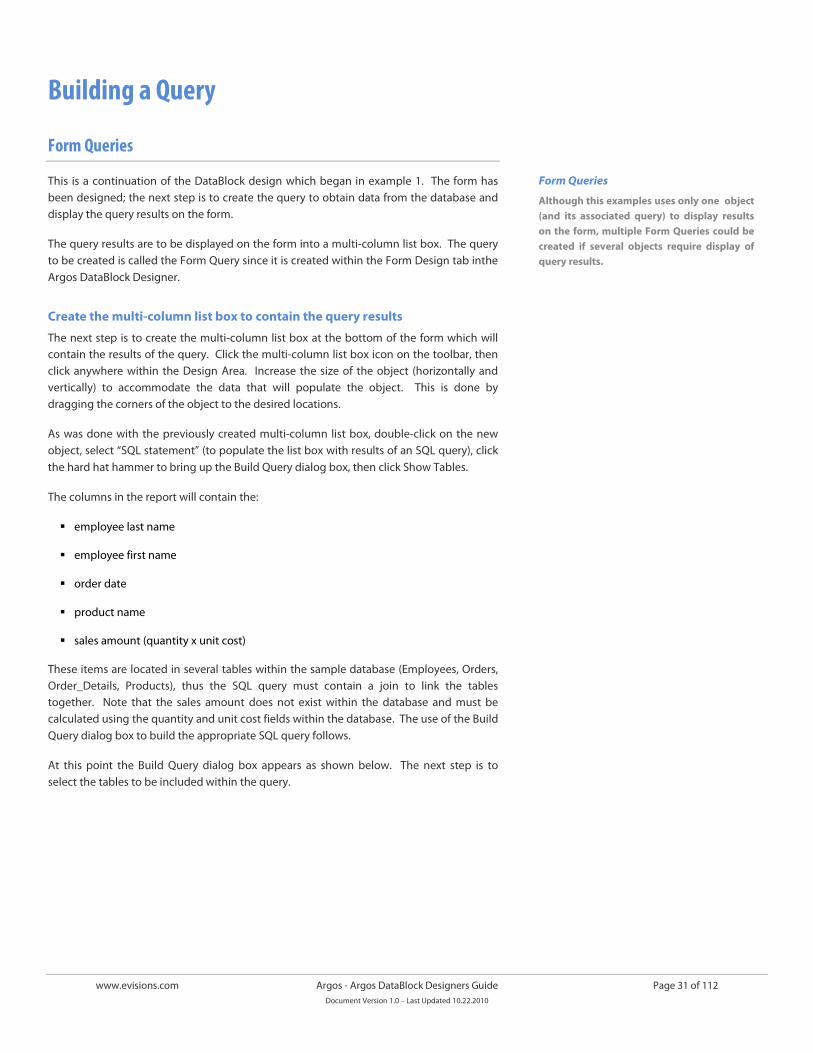
This is a continuation of the DataBlock design which began in example 1. The form has been designed; the next step is to create the query to obtain data from the database and display the query results on the form.
The query results are to be displayed on the form into a multi-column list box. The query to be created is called the Form Query since it is created within the Form Design tab inthe Argos DataBlock Designer.
Create the multi-column list box to contain the query results
The next step is to create the multi-column list box at the bottom of the form which will contain the results of the query. Click the multi-column list box icon on the toolbar, then click anywhere within the Design Area. Increase the size of the object (horizontally and vertically) to accommodate the data that will populate the object. This is done by dragging the corners of the object to the desired locations.
As was done with the previously created multi-column list box, double-click on the new object, select “SQL statement” (to populate the list box with results of an SQL query), click the hard hat hammer to bring up the Build Query dialog box, then click Show Tables.
The columns in the report will contain the:
employee last name
employee first name
order date
product name
sales amount (quantity x unit cost)
These items are located in several tables within the sample database (Employees, Orders, Order_Details, Products), thus the SQL query must contain a join to link the tables together. Note that the sales amount does not exist within the database and must be calculated using the quantity and unit cost fields within the database. The use of the Build Query dialog box to build the appropriate SQL query follows.
At this point the Build Query dialog box appears as shown below. The next step is to select the tables to be included within the query.
Form Queries
Although this examples uses only one object (and its associated query) to display results on the form, multiple Form Queries could be created if several objects require display of query results.
www.evisions.com Argos - Argos DataBlock Designers Guide Page 32 of 112 Document Version 1.0 – Last Updated 10.22.2010
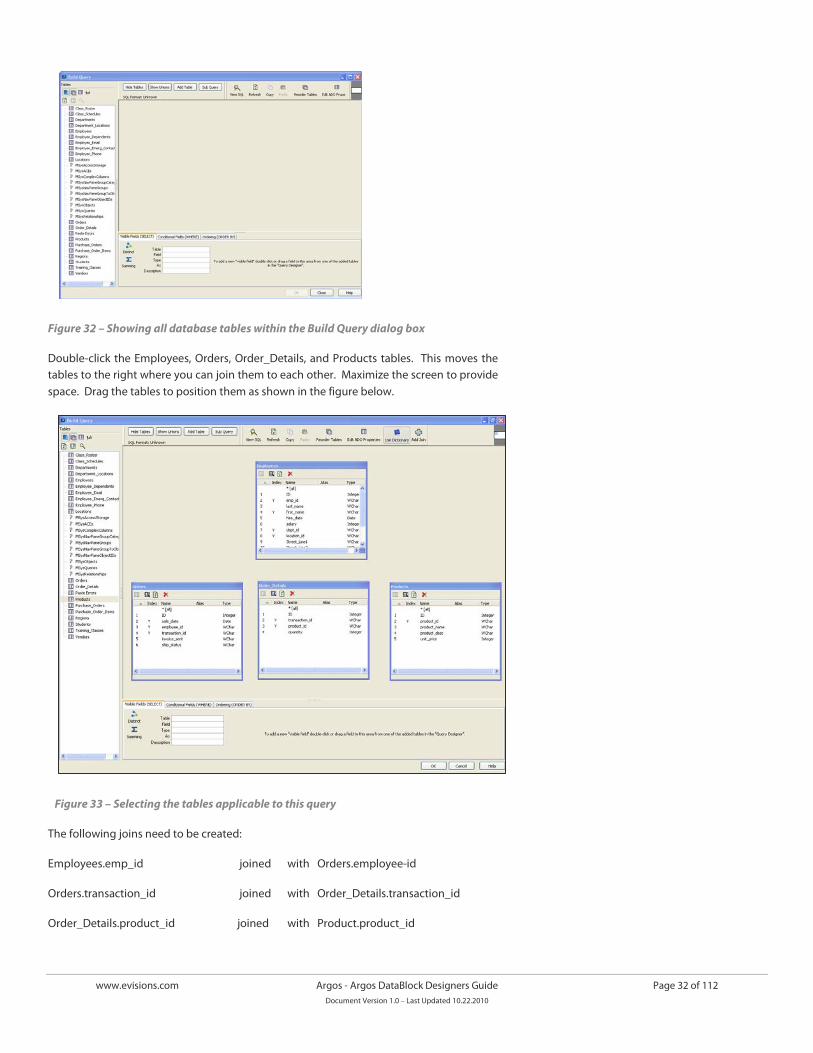
Figure 32 – Showing all database tables within the Build Query dialog box
Double-click the Employees, Orders, Order_Details, and Products tables. This moves the tables to the right where you can join them to each other. Maximize the screen to provide space. Drag the tables to position them as shown in the figure below.
Figure 33 – Selecting the tables applicable to this query
The following joins need to be created:
Employees.emp_id joined with Orders.employee-id
Orders.transaction_id joined with Order_Details.transaction_id
Order_Details.product_id joined with Product.product_id
www.evisions.com Argos - Argos DataBlock Designers Guide Page 33 of 112 Document Version 1.0 – Last Updated 10.22.2010
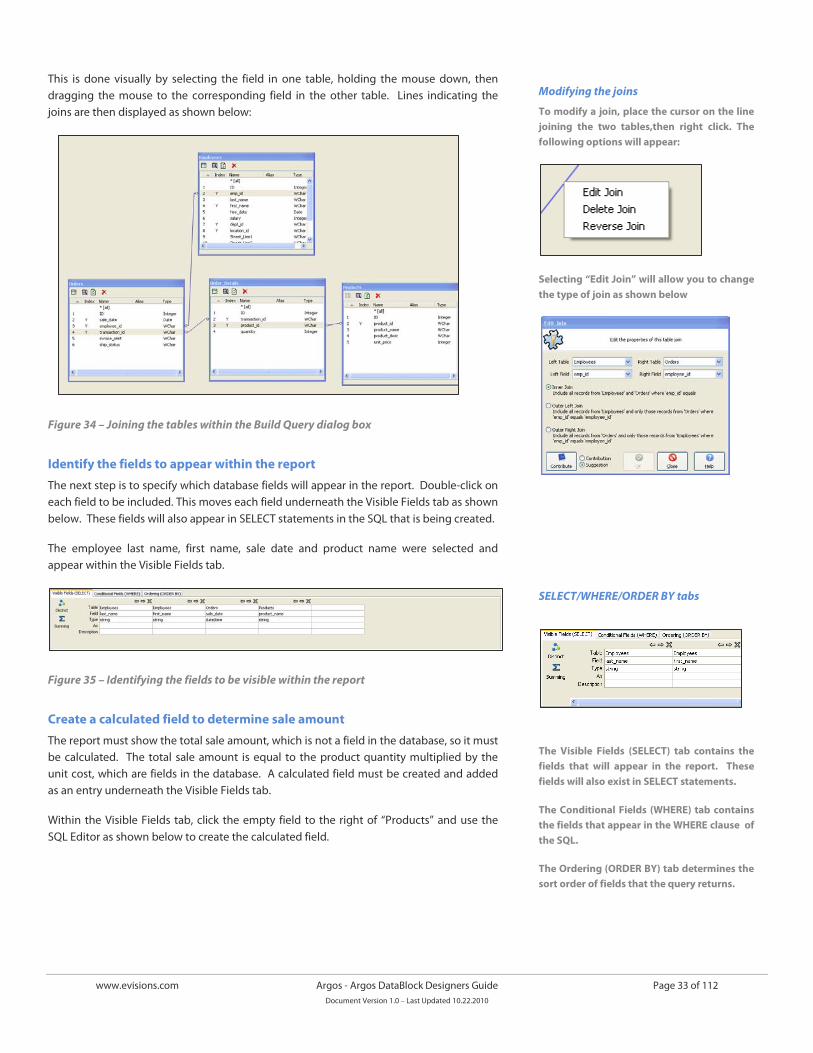
This is done visually by selecting the field in one table, holding the mouse down, then dragging the mouse to the corresponding field in the other table. Lines indicating the joins are then displayed as shown below:
Figure 34 – Joining the tables within the Build Query dialog box
Identify the fields to appear within the report
The next step is to specify which database fields will appear in the report. Double-click on each field to be included. This moves each field underneath the Visible Fields tab as shown below. These fields will also appear in SELECT statements in the SQL that is being created.
The employee last name, first name, sale date and product name were selected and appear within the Visible Fields tab.
Figure 35 – Identifying the fields to be visible within the report
Create a calculated field to determine sale amount
The report must show the total sale amount, which is not a field in the database, so it must be calculated. The total sale amount is equal to the product quantity multiplied by the unit cost, which are fields in the database. A calculated field must be created and added as an entry underneath the Visible Fields tab.
Within the Visible Fields tab, click the empty field to the right of “Products” and use the SQL Editor as shown below to create the calculated field.
Modifying the joins
To modify a join, place the cursor on the line joining the two tables,then right click. The following options will appear:
Selecting “Edit Join” will allow you to change the type of join as shown below
SELECT/WHERE/ORDER BY tabs
The Visible Fields (SELECT) tab contains the fields that will appear in the report. These fields will also exist in SELECT statements.
The Conditional Fields (WHERE) tab contains the fields that appear in the WHERE clause of the SQL.
The Ordering (ORDER BY) tab determines the sort order of fields that the query returns.
www.evisions.com Argos - Argos DataBlock Designers Guide Page 34 of 112 Document Version 1.0 – Last Updated 10.22.2010
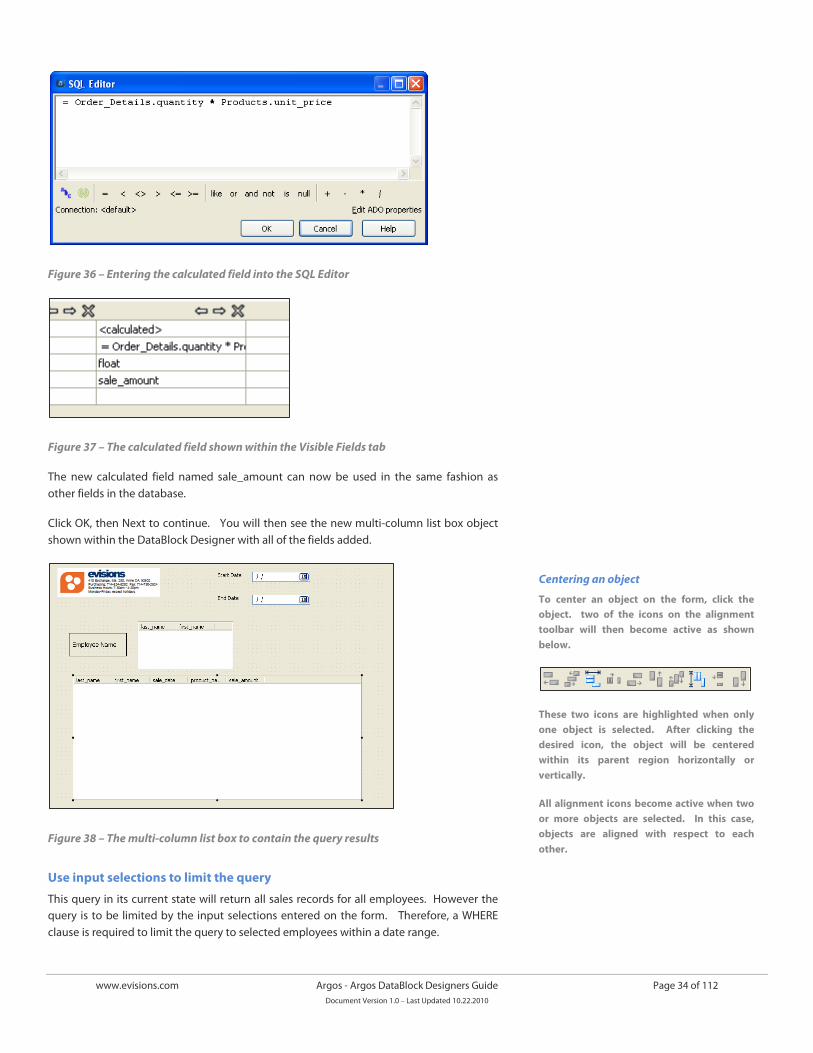
Figure 36 – Entering the calculated field into the SQL Editor
Figure 37 – The calculated field shown within the Visible Fields tab
The new calculated field named sale_amount can now be used in the same fashion as other fields in the database.
Click OK, then Next to continue. You will then see the new multi-column list box object shown within the DataBlock Designer with all of the fields added.
Figure 38 – The multi-column list box to contain the query results
Use input selections to limit the query
This query in its current state will return all sales records for all employees. However the query is to be limited by the input selections entered on the form. Therefore, a WHERE clause is required to limit the query to selected employees within a date range.
Centering an object
To center an object on the form, click the object. two of the icons on the alignment toolbar will then become active as shown below.
These two icons are highlighted when only one object is selected. After clicking the desired icon, the object will be centered within its parent region horizontally or vertically.
All alignment icons become active when two or more objects are selected. In this case, objects are aligned with respect to each other.
www.evisions.com Argos - Argos DataBlock Designers Guide Page 35 of 112 Document Version 1.0 – Last Updated 10.22.2010
Within the DataBlock Designer, double-click on the object that was just created which contains the results of the query. Then click the hardhat/hammer (Edit Visual Design) icon to bring up the Build Query dialog box. Click the “Conditional Fields (WHERE) tab where you can create the required WHERE clause.
The WHERE clause should only obtain records where:
The employee last name selected = the employee last name in the database and,
The employee first name selected = the employee first name in the database and,
The sale date is greater than or equal to the start date selected and,
The sale date is less than or equal to the end date selected
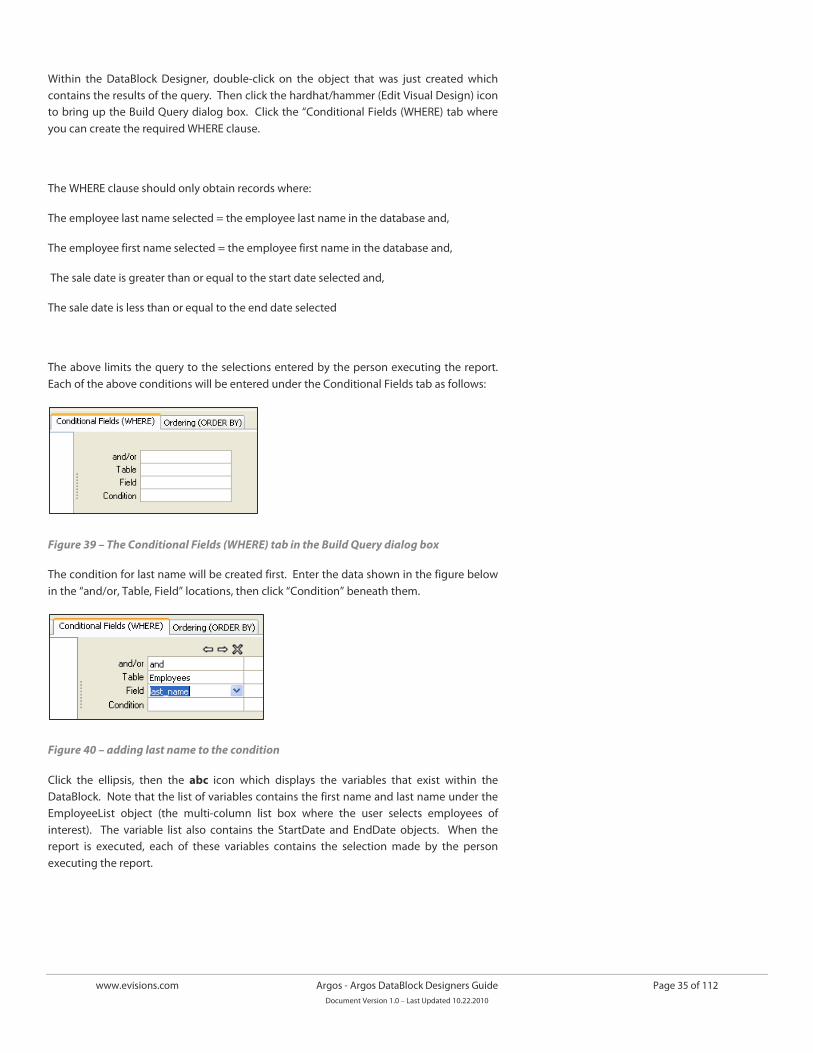
The above limits the query to the selections entered by the person executing the report. Each of the above conditions will be entered under the Conditional Fields tab as follows:
Figure 39 – The Conditional Fields (WHERE) tab in the Build Query dialog box
The condition for last name will be created first. Enter the data shown in the figure below in the “and/or, Table, Field” locations, then click “Condition” beneath them.
Figure 40 – adding last name to the condition
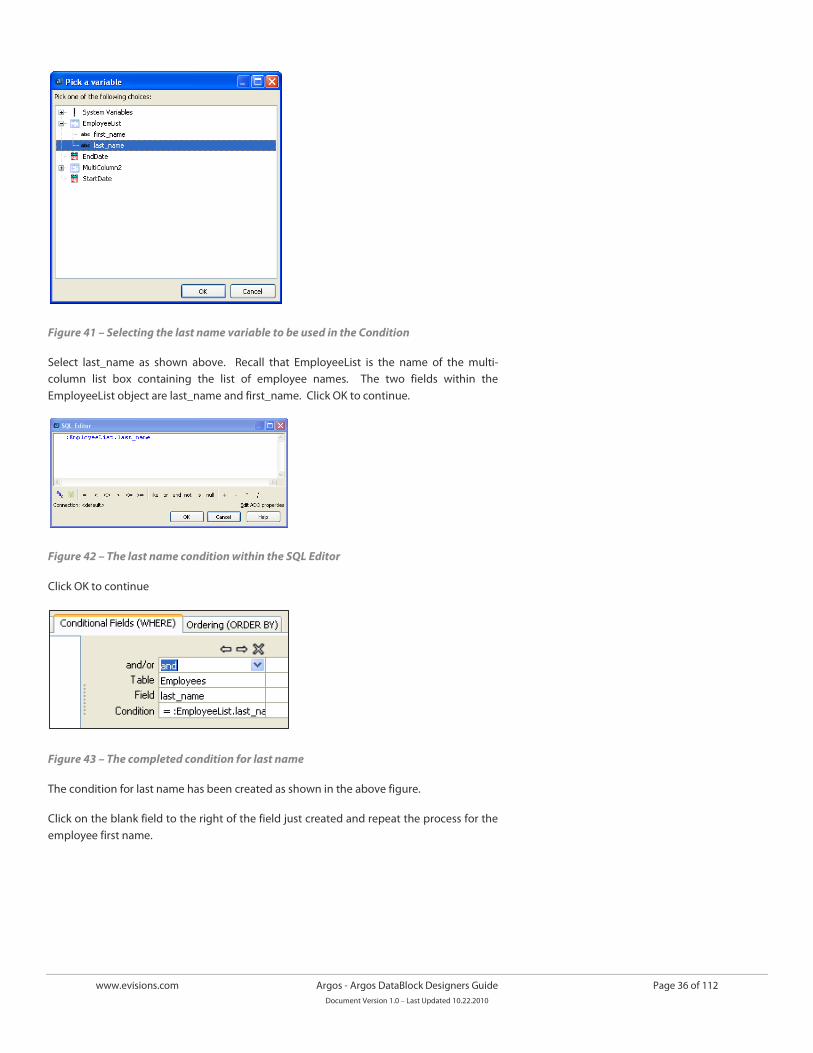
Click the ellipsis, then the abc icon which displays the variables that exist within the DataBlock. Note that the list of variables contains the first name and last name under the EmployeeList object (the multi-column list box where the user selects employees of interest). The variable list also contains the StartDate and EndDate objects. When the report is executed, each of these variables contains the selection made by the person executing the report.
www.evisions.com Argos - Argos DataBlock Designers Guide Page 36 of 112 Document Version 1.0 – Last Updated 10.22.2010
Figure 41 – Selecting the last name variable to be used in the Condition
Select last_name as shown above. Recall that EmployeeList is the name of the multi-column list box containing the list of employee names. The two fields within the EmployeeList object are last_name and first_name. Click OK to continue.
Figure 42 – The last name condition within the SQL Editor
Click OK to continue
Figure 43 – The completed condition for last name
The condition for last name has been created as shown in the above figure.
Click on the blank field to the right of the field just created and repeat the process for the employee first name.
www.evisions.com Argos - Argos DataBlock Designers Guide Page 37 of 112 Document Version 1.0 – Last Updated 10.22.2010
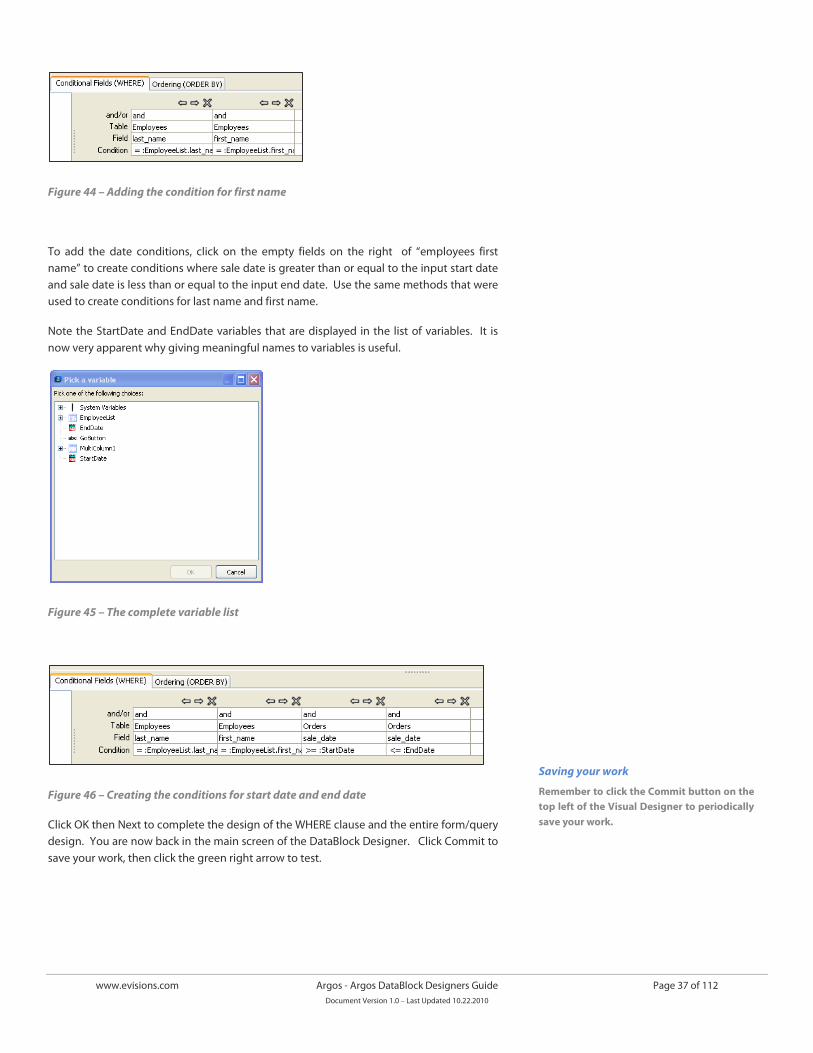
Figure 44 – Adding the condition for first name
To add the date conditions, click on the empty fields on the right of “employees first name” to create conditions where sale date is greater than or equal to the input start date and sale date is less than or equal to the input end date. Use the same methods that were used to create conditions for last name and first name.
Note the StartDate and EndDate variables that are displayed in the list of variables. It is now very apparent why giving meaningful names to variables is useful.
Figure 45 – The complete variable list
Figure 46 – Creating the conditions for start date and end date
Click OK then Next to complete the design of the WHERE clause and the entire form/query design. You are now back in the main screen of the DataBlock Designer. Click Commit to save your work, then click the green right arrow to test.
Saving your work
Remember to click the Commit button on the top left of the Visual Designer to periodically save your work.
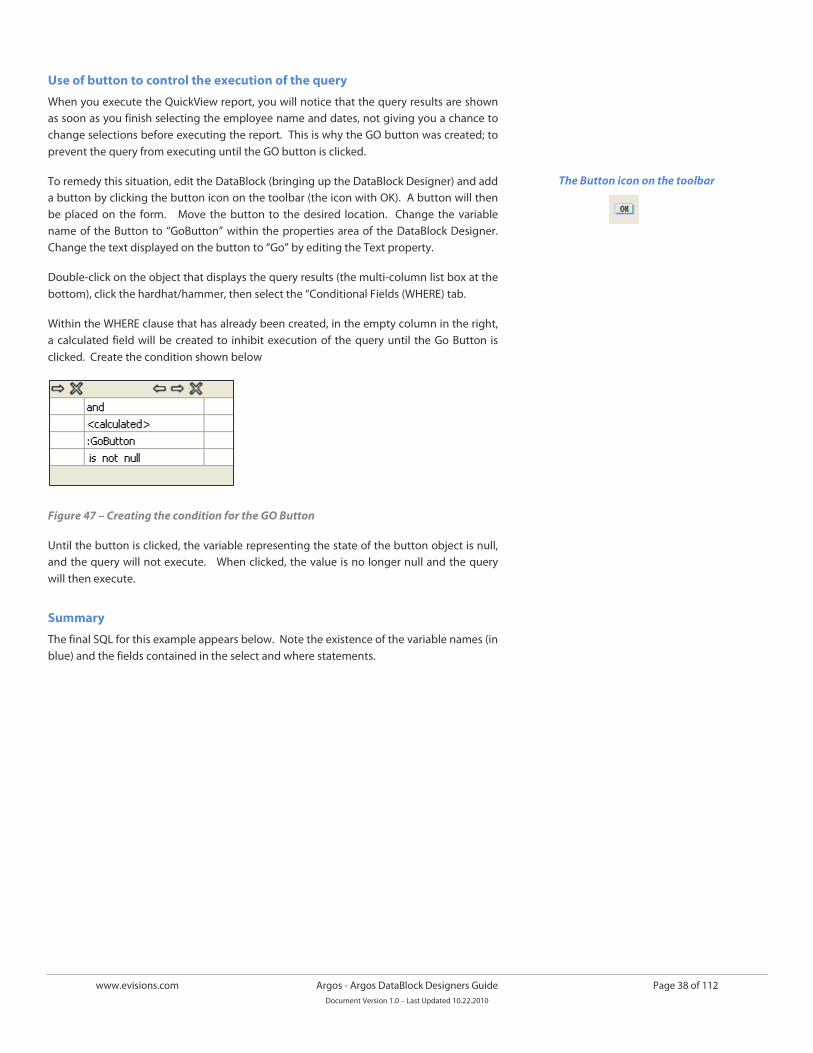
www.evisions.com Argos - Argos DataBlock Designers Guide Page 38 of 112 Document Version 1.0 – Last Updated 10.22.2010
Use of button to control the execution of the query
When you execute the QuickView report, you will notice that the query results are shown as soon as you finish selecting the employee name and dates, not giving you a chance to change selections before executing the report. This is why the GO button was created; to prevent the query from executing until the GO button is clicked.
To remedy this situation, edit the DataBlock (bringing up the DataBlock Designer) and add a button by clicking the button icon on the toolbar (the icon with OK). A button will then be placed on the form. Move the button to the desired location. Change the variable name of the Button to “GoButton” within the properties area of the DataBlock Designer. Change the text displayed on the button to “Go” by editing the Text property.
Double-click on the object that displays the query results (the multi-column list box at the bottom), click the hardhat/hammer, then select the “Conditional Fields (WHERE) tab.
Within the WHERE clause that has already been created, in the empty column in the right, a calculated field will be created to inhibit execution of the query until the Go Button is clicked. Create the condition shown below
Figure 47 – Creating the condition for the GO Button
Until the button is clicked, the variable representing the state of the button object is null, and the query will not execute. When clicked, the value is no longer null and the query will then execute.
Summary
The final SQL for this example appears below. Note the existence of the variable names (in blue) and the fields contained in the select and where statements.
The Button icon on the toolbar
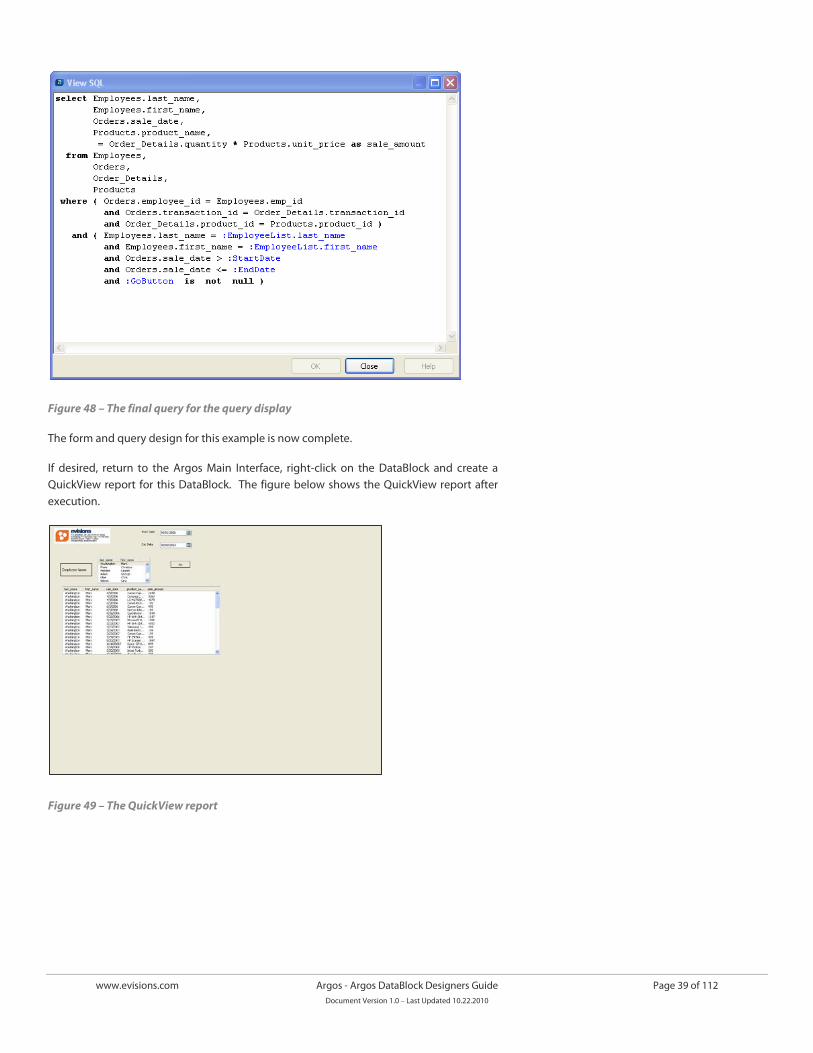
www.evisions.com Argos - Argos DataBlock Designers Guide Page 39 of 112 Document Version 1.0 – Last Updated 10.22.2010
Figure 48 – The final query for the query display
The form and query design for this example is now complete.
If desired, return to the Argos Main Interface, right-click on the DataBlock and create a QuickView report for this DataBlock. The figure below shows the QuickView report after execution.
Figure 49 – The QuickView report
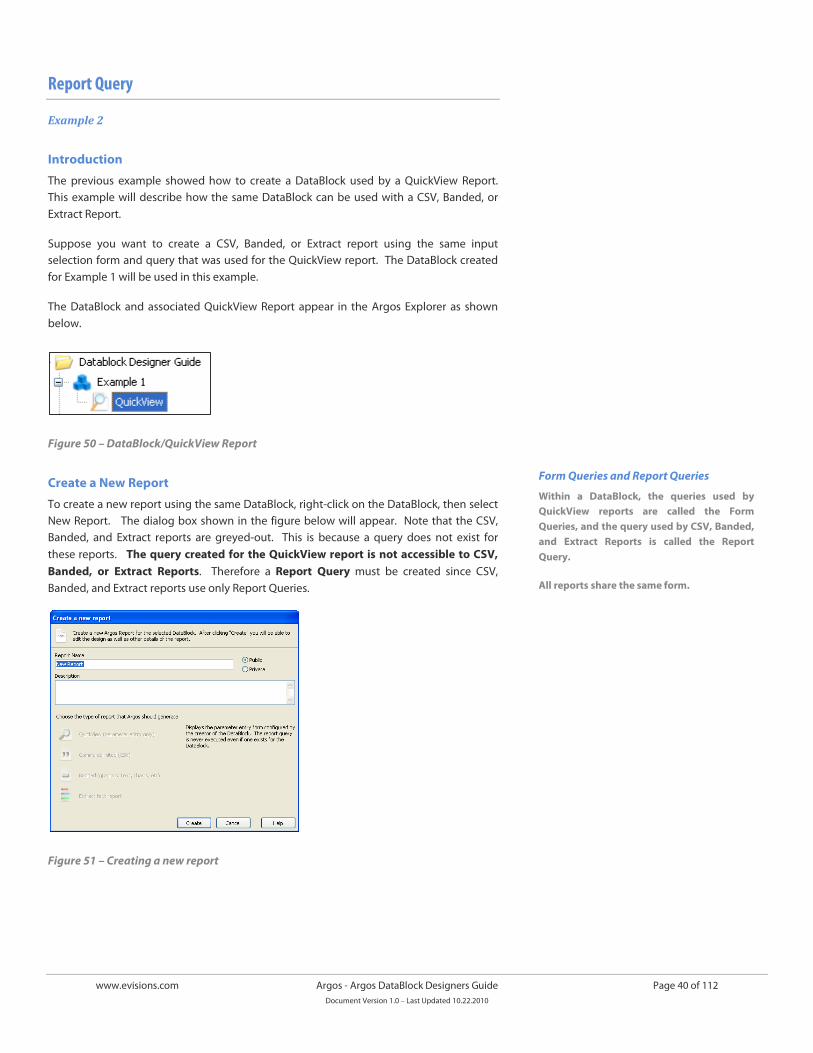
www.evisions.com Argos - Argos DataBlock Designers Guide Page 40 of 112 Document Version 1.0 – Last Updated 10.22.2010
Report Query
Example 2
Introduction
The previous example showed how to create a DataBlock used by a QuickView Report. This example will describe how the same DataBlock can be used with a CSV, Banded, or Extract Report.
Suppose you want to create a CSV, Banded, or Extract report using the same input selection form and query that was used for the QuickView report. The DataBlock created for Example 1 will be used in this example.
The DataBlock and associated QuickView Report appear in the Argos Explorer as shown below.
Figure 50 – DataBlock/QuickView Report
Create a New Report
To create a new report using the same DataBlock, right-click on the DataBlock, then select New Report. The dialog box shown in the figure below will appear. Note that the CSV, Banded, and Extract reports are greyed-out. This is because a query does not exist for these reports. The query created for the QuickView report is not accessible to CSV, Banded, or Extract Reports. Therefore a Report Query must be created since CSV, Banded, and Extract reports use only Report Queries.
Figure 51 – Creating a new report
Form Queries and Report Queries
Within a DataBlock, the queries used by QuickView reports are called the Form Queries, and the query used by CSV, Banded, and Extract Reports is called the Report Query.
All reports share the same form.
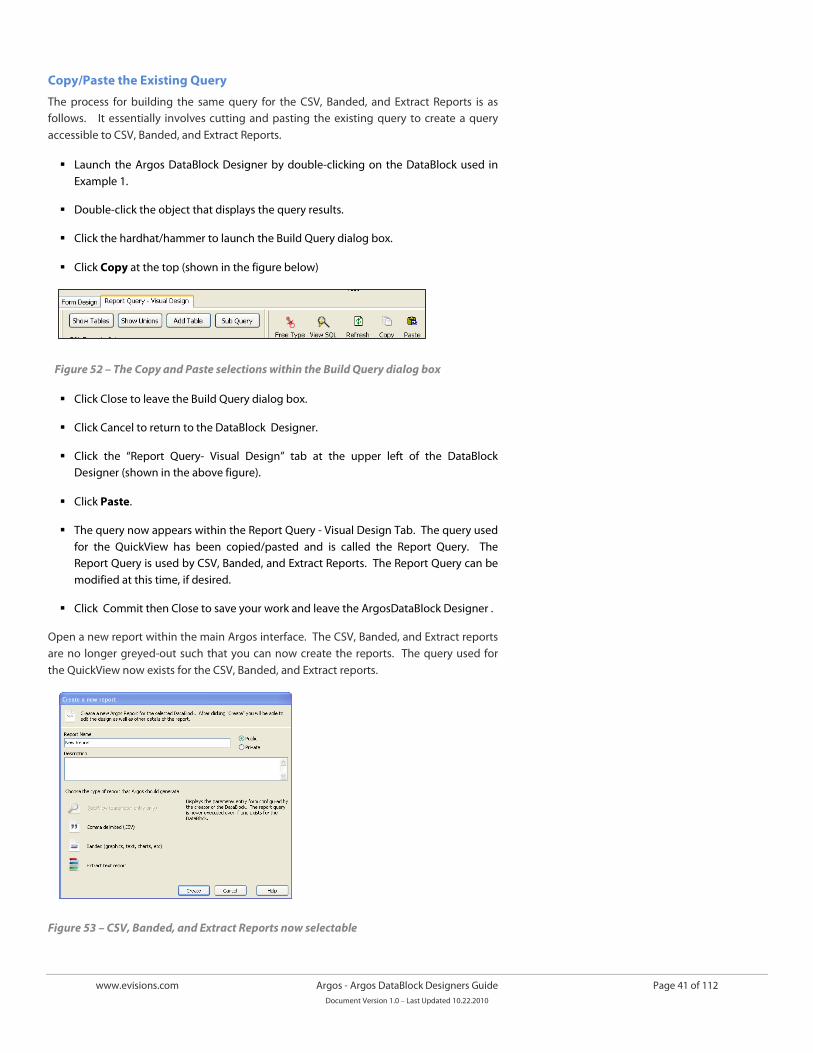
www.evisions.com Argos - Argos DataBlock Designers Guide Page 41 of 112 Document Version 1.0 – Last Updated 10.22.2010
Copy/Paste the Existing Query
The process for building the same query for the CSV, Banded, and Extract Reports is as follows. It essentially involves cutting and pasting the existing query to create a query accessible to CSV, Banded, and Extract Reports.
Launch the Argos DataBlock Designer by double-clicking on the DataBlock used in Example 1.
Double-click the object that displays the query results.
Click the hardhat/hammer to launch the Build Query dialog box.
Click Copy at the top (shown in the figure below)
Figure 52 – The Copy and Paste selections within the Build Query dialog box
Click Close to leave the Build Query dialog box.
Click Cancel to return to the DataBlock Designer.
Click the “Report Query- Visual Design” tab at the upper left of the DataBlock Designer (shown in the above figure).
Click Paste.
The query now appears within the Report Query - Visual Design Tab. The query used for the QuickView has been copied/pasted and is called the Report Query. The Report Query is used by CSV, Banded, and Extract Reports. The Report Query can be modified at this time, if desired.
Click Commit then Close to save your work and leave the ArgosDataBlock Designer .
Open a new report within the main Argos interface. The CSV, Banded, and Extract reports are no longer greyed-out such that you can now create the reports. The query used for the QuickView now exists for the CSV, Banded, and Extract reports.
Figure 53 – CSV, Banded, and Extract Reports now selectable
www.evisions.com Argos - Argos DataBlock Designers Guide Page 42 of 112 Document Version 1.0 – Last Updated 10.22.2010
Creation of a report query can be done directly without the need to copy the query from the Form Query. If, for example, you only require a CSV, Banded, or Extract Report (and not a QuickView report), create the form to accept input parameters, then click the “Report Query – Visual Design” tab within the DataBlock Designer. You can then create your Report Query visually in the same manner used to create a Form Query. The Report Query is then used by the CSV, Banded, and Extract Reports.
Summary
To summarize, for a given DataBlock the same input selection form is used by all child report types, however QuickView Reports use a different query than CSV/Banded/Extract Reports. The query used for CSV/Banded/Extract reports is called the Report Query. The query used for QuickView reports is called the Form Query.
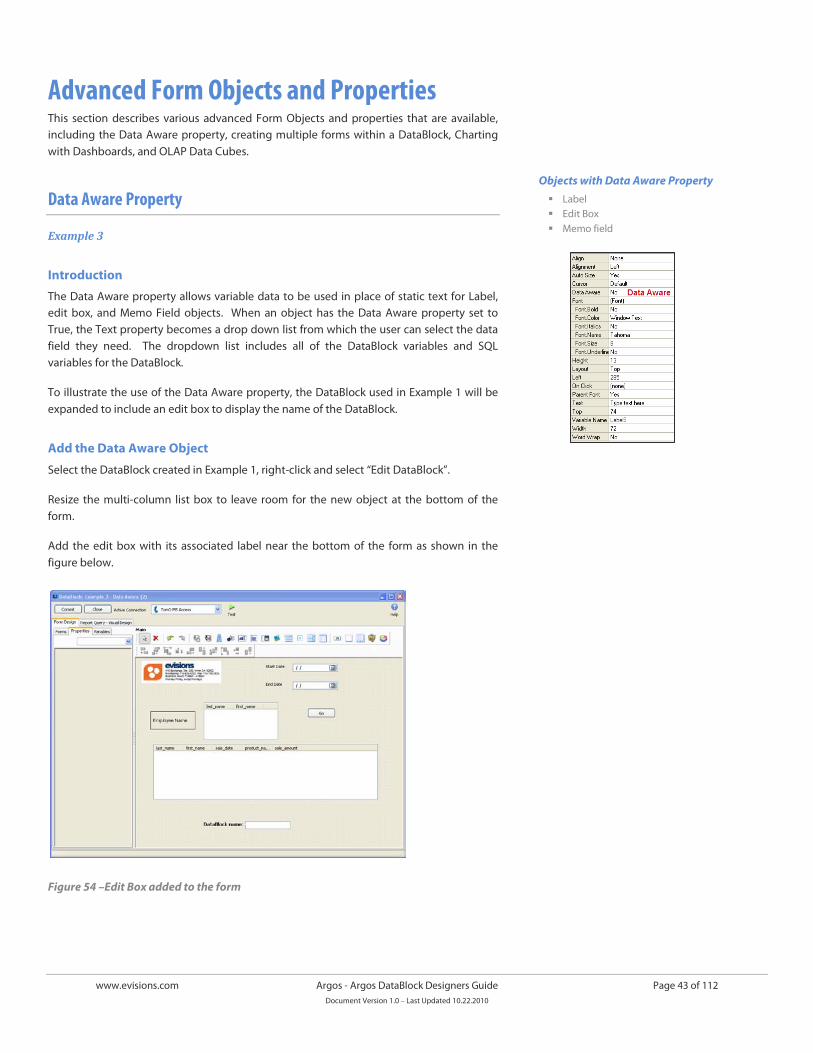
www.evisions.com Argos - Argos DataBlock Designers Guide Page 43 of 112 Document Version 1.0 – Last Updated 10.22.2010
Advanced Form Objects and Properties This section describes various advanced Form Objects and properties that are available, including the Data Aware property, creating multiple forms within a DataBlock, Charting with Dashboards, and OLAP Data Cubes.
Data Aware Property
Example 3
Introduction
The Data Aware property allows variable data to be used in place of static text for Label, edit box, and Memo Field objects. When an object has the Data Aware property set to True, the Text property becomes a drop down list from which the user can select the data field they need. The dropdown list includes all of the DataBlock variables and SQL variables for the DataBlock.
To illustrate the use of the Data Aware property, the DataBlock used in Example 1 will be expanded to include an edit box to display the name of the DataBlock.
Add the Data Aware Object
Select the DataBlock created in Example 1, right-click and select “Edit DataBlock”.
Resize the multi-column list box to leave room for the new object at the bottom of the form.
Add the edit box with its associated label near the bottom of the form as shown in the figure below.
Figure 54 –Edit Box added to the form
Objects with Data Aware Property Label Edit Box Memo field
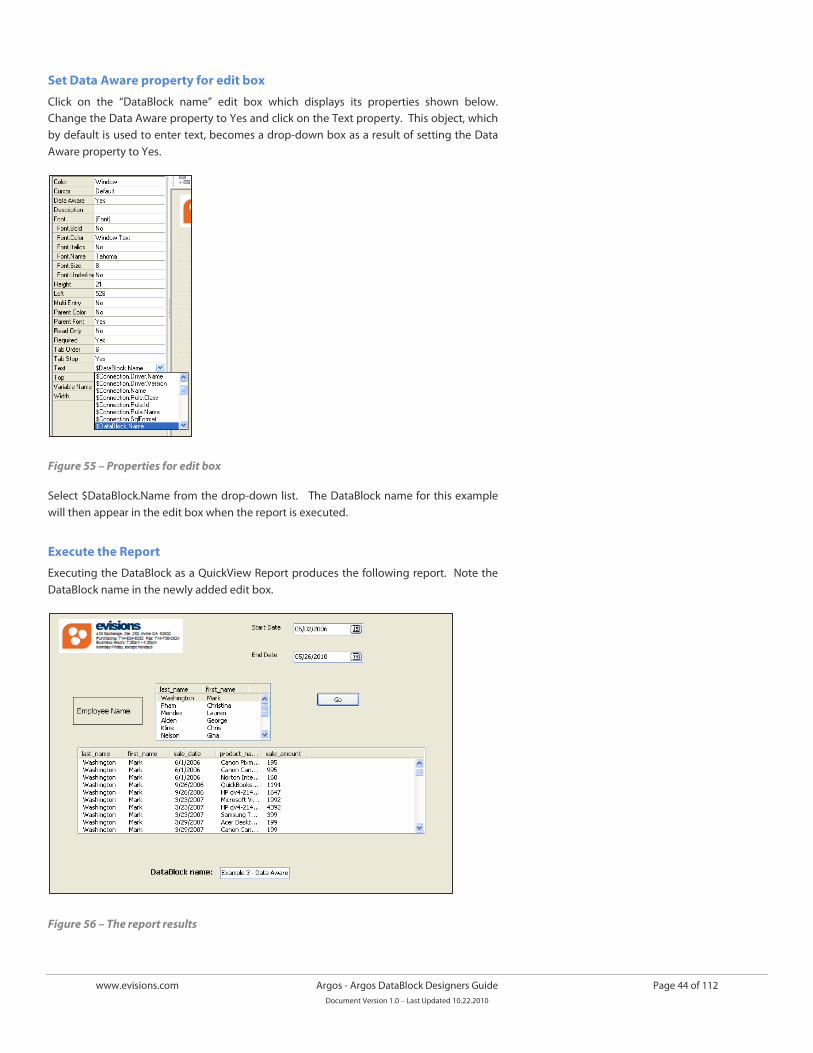
www.evisions.com Argos - Argos DataBlock Designers Guide Page 44 of 112 Document Version 1.0 – Last Updated 10.22.2010
Set Data Aware property for edit box
Click on the “DataBlock name” edit box which displays its properties shown below. Change the Data Aware property to Yes and click on the Text property. This object, which by default is used to enter text, becomes a drop-down box as a result of setting the Data Aware property to Yes.
Figure 55 – Properties for edit box
Select $DataBlock.Name from the drop-down list. The DataBlock name for this example will then appear in the edit box when the report is executed.
Execute the Report
Executing the DataBlock as a QuickView Report produces the following report. Note the DataBlock name in the newly added edit box.
Figure 56 – The report results
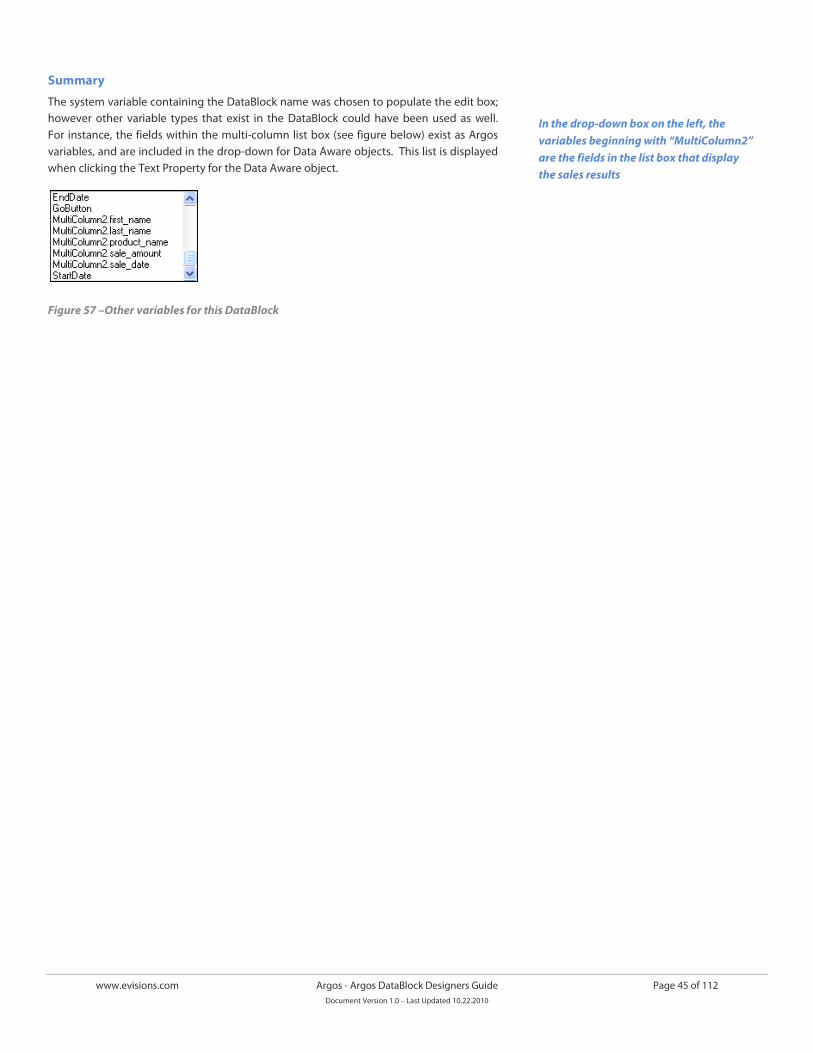
www.evisions.com Argos - Argos DataBlock Designers Guide Page 45 of 112 Document Version 1.0 – Last Updated 10.22.2010
Summary
The system variable containing the DataBlock name was chosen to populate the edit box; however other variable types that exist in the DataBlock could have been used as well. For instance, the fields within the multi-column list box (see figure below) exist as Argos variables, and are included in the drop-down for Data Aware objects. This list is displayed when clicking the Text Property for the Data Aware object.
Figure 57 –Other variables for this DataBlock
In the drop-down box on the left, the variables beginning with “MultiColumn2” are the fields in the list box that display the sales results
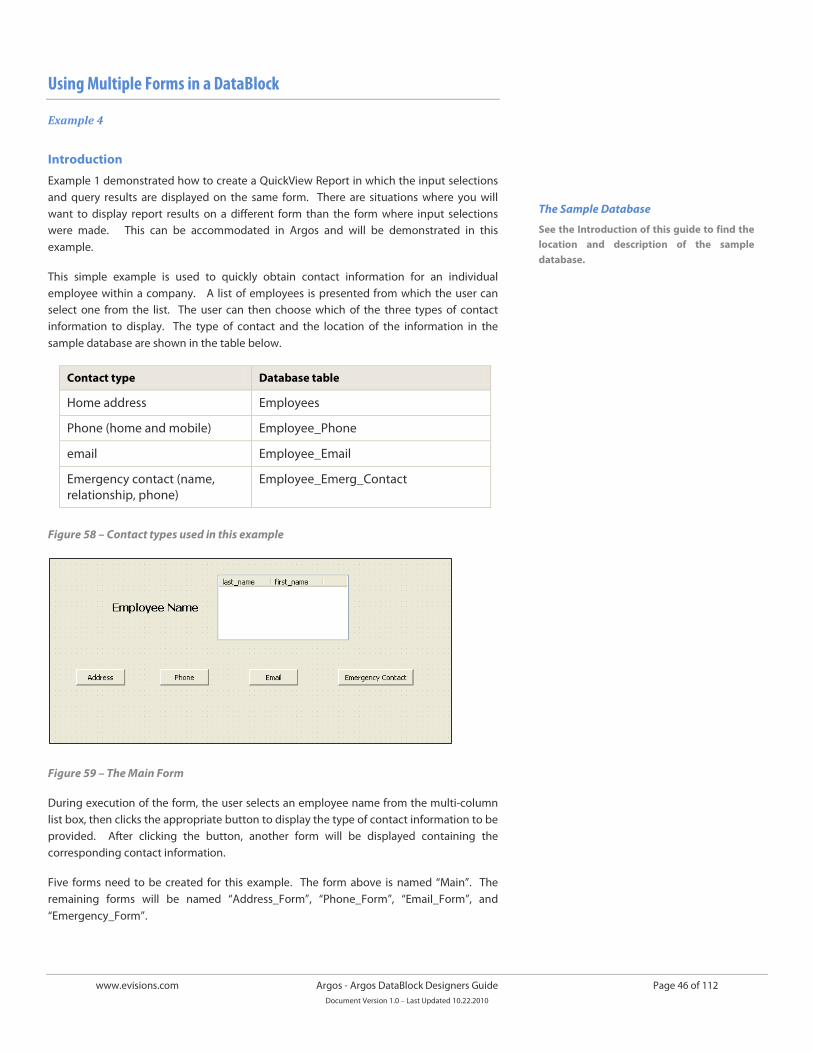
www.evisions.com Argos - Argos DataBlock Designers Guide Page 46 of 112 Document Version 1.0 – Last Updated 10.22.2010
Using Multiple Forms in a DataBlock
Example 4
Introduction
Example 1 demonstrated how to create a QuickView Report in which the input selections and query results are displayed on the same form. There are situations where you will want to display report results on a different form than the form where input selections were made. This can be accommodated in Argos and will be demonstrated in this example.
This simple example is used to quickly obtain contact information for an individual employee within a company. A list of employees is presented from which the user can select one from the list. The user can then choose which of the three types of contact information to display. The type of contact and the location of the information in the sample database are shown in the table below.
Contact type Database table
Home address Employees
Phone (home and mobile) Employee_Phone
email Employee_Email
Emergency contact (name, relationship, phone)
Employee_Emerg_Contact
Figure 58 – Contact types used in this example
Figure 59 – The Main Form
During execution of the form, the user selects an employee name from the multi-column list box, then clicks the appropriate button to display the type of contact information to be provided. After clicking the button, another form will be displayed containing the corresponding contact information.
Five forms need to be created for this example. The form above is named “Main”. The remaining forms will be named “Address_Form”, “Phone_Form”, “Email_Form”, and “Emergency_Form”.
The Sample Database
See the Introduction of this guide to find the location and description of the sample database.
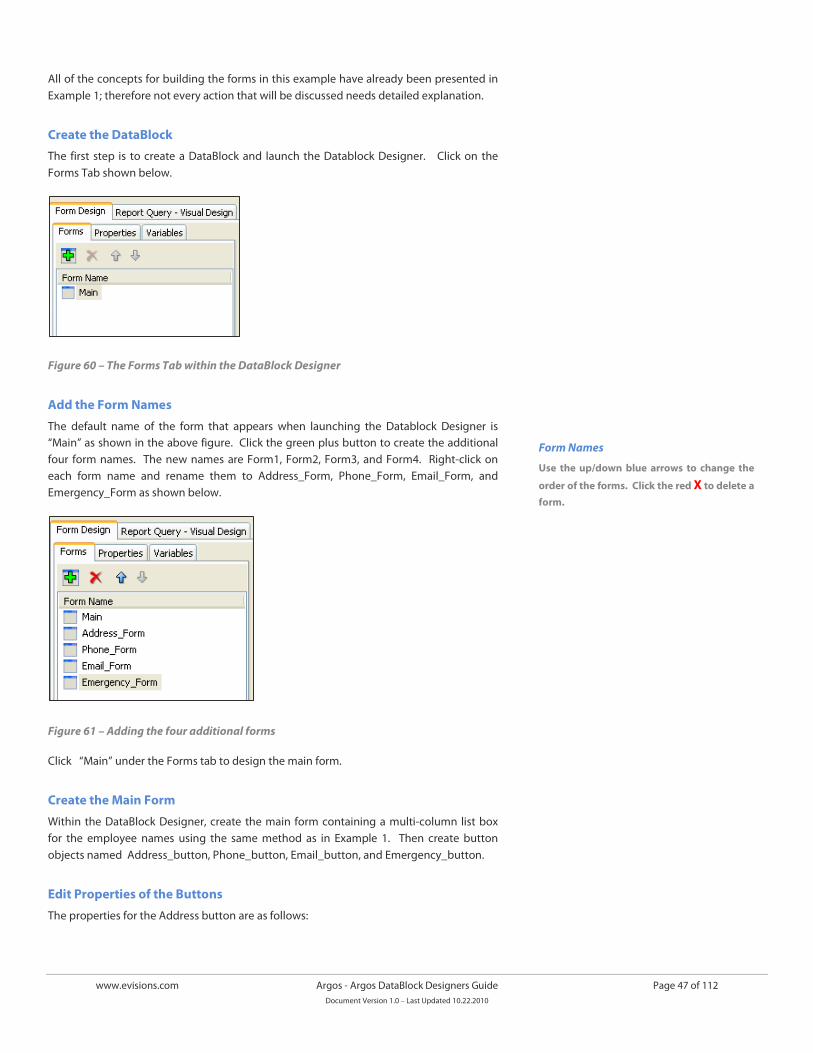
www.evisions.com Argos - Argos DataBlock Designers Guide Page 47 of 112 Document Version 1.0 – Last Updated 10.22.2010
All of the concepts for building the forms in this example have already been presented in Example 1; therefore not every action that will be discussed needs detailed explanation.
Create the DataBlock
The first step is to create a DataBlock and launch the Datablock Designer. Click on the Forms Tab shown below.
Figure 60 – The Forms Tab within the DataBlock Designer
Add the Form Names
The default name of the form that appears when launching the Datablock Designer is “Main” as shown in the above figure. Click the green plus button to create the additional four form names. The new names are Form1, Form2, Form3, and Form4. Right-click on each form name and rename them to Address_Form, Phone_Form, Email_Form, and Emergency_Form as shown below.
Figure 61 – Adding the four additional forms
Click “Main” under the Forms tab to design the main form.
Create the Main Form
Within the DataBlock Designer, create the main form containing a multi-column list box for the employee names using the same method as in Example 1. Then create button objects named Address_button, Phone_button, Email_button, and Emergency_button.
Edit Properties of the Buttons
The properties for the Address button are as follows:
Form Names
Use the up/down blue arrows to change the
order of the forms. Click the red X to delete a form.
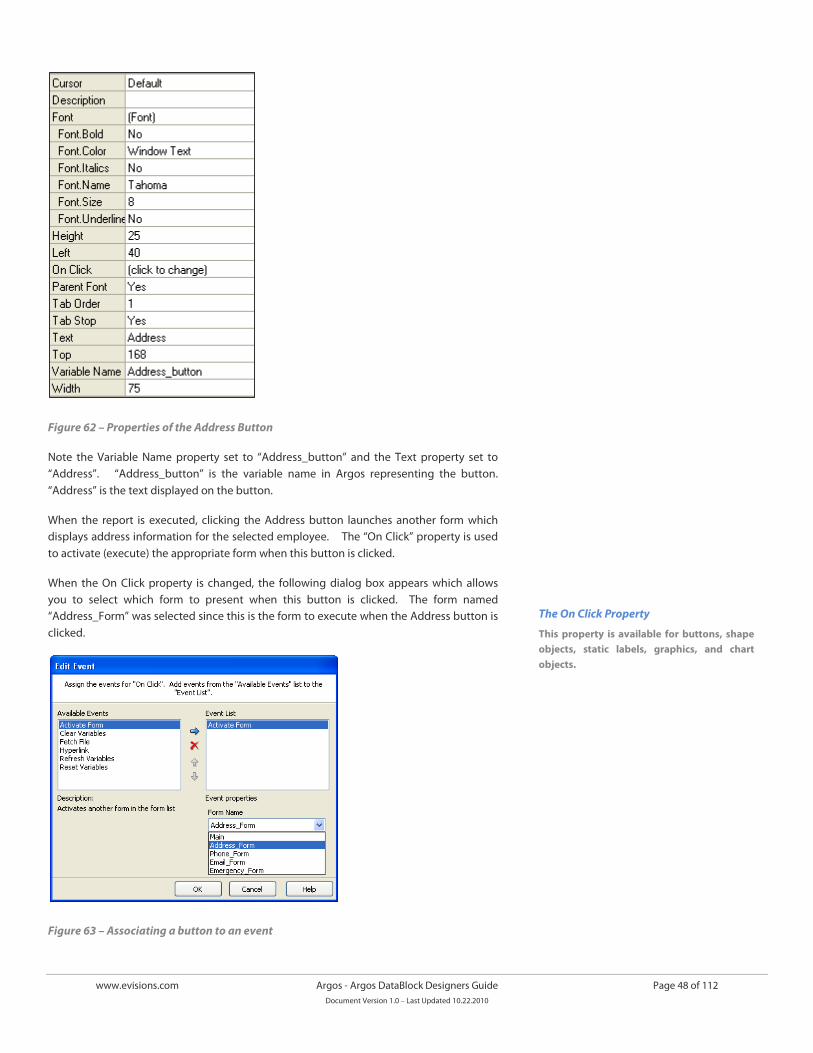
www.evisions.com Argos - Argos DataBlock Designers Guide Page 48 of 112 Document Version 1.0 – Last Updated 10.22.2010
Figure 62 – Properties of the Address Button
Note the Variable Name property set to “Address_button” and the Text property set to “Address”. “Address_button” is the variable name in Argos representing the button. “Address” is the text displayed on the button.
When the report is executed, clicking the Address button launches another form which displays address information for the selected employee. The “On Click” property is used to activate (execute) the appropriate form when this button is clicked.
When the On Click property is changed, the following dialog box appears which allows you to select which form to present when this button is clicked. The form named “Address_Form” was selected since this is the form to execute when the Address button is clicked.
Figure 63 – Associating a button to an event
The On Click Property
This property is available for buttons, shape objects, static labels, graphics, and chart objects.
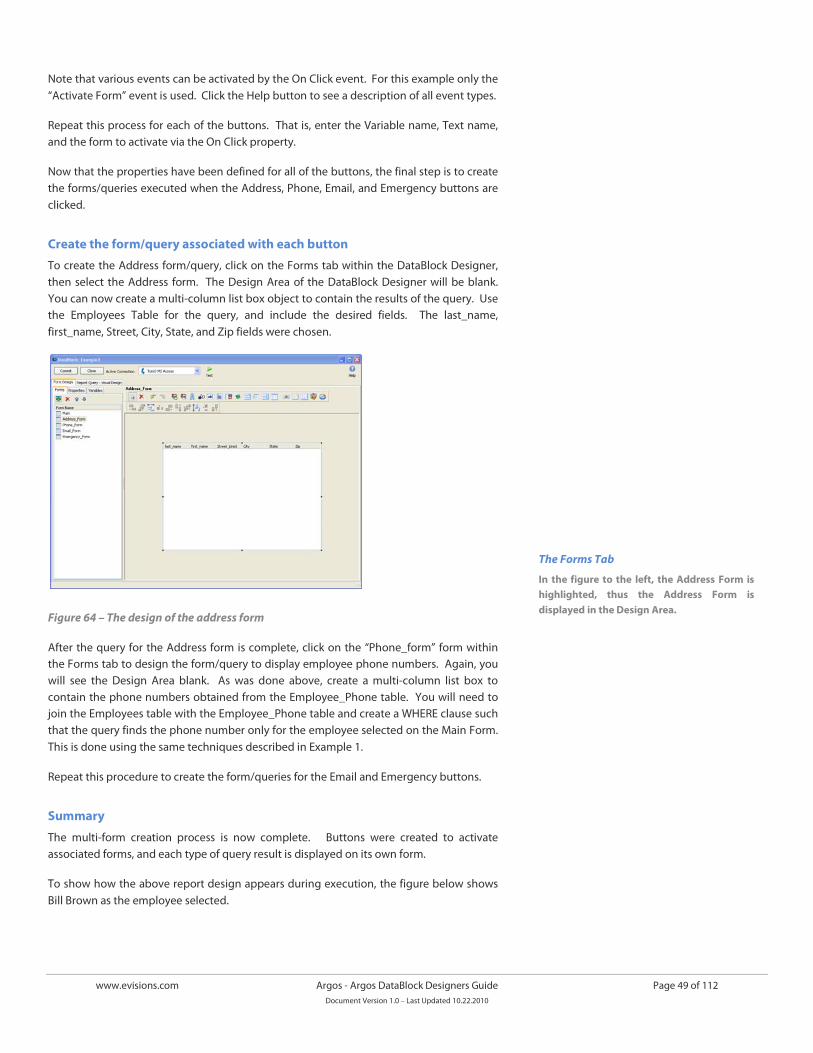
www.evisions.com Argos - Argos DataBlock Designers Guide Page 49 of 112 Document Version 1.0 – Last Updated 10.22.2010
Note that various events can be activated by the On Click event. For this example only the “Activate Form” event is used. Click the Help button to see a description of all event types.
Repeat this process for each of the buttons. That is, enter the Variable name, Text name, and the form to activate via the On Click property.
Now that the properties have been defined for all of the buttons, the final step is to create the forms/queries executed when the Address, Phone, Email, and Emergency buttons are clicked.
Create the form/query associated with each button
To create the Address form/query, click on the Forms tab within the DataBlock Designer, then select the Address form. The Design Area of the DataBlock Designer will be blank. You can now create a multi-column list box object to contain the results of the query. Use the Employees Table for the query, and include the desired fields. The last_name, first_name, Street, City, State, and Zip fields were chosen.
Figure 64 – The design of the address form
After the query for the Address form is complete, click on the “Phone_form” form within the Forms tab to design the form/query to display employee phone numbers. Again, you will see the Design Area blank. As was done above, create a multi-column list box to contain the phone numbers obtained from the Employee_Phone table. You will need to join the Employees table with the Employee_Phone table and create a WHERE clause such that the query finds the phone number only for the employee selected on the Main Form. This is done using the same techniques described in Example 1.
Repeat this procedure to create the form/queries for the Email and Emergency buttons.
Summary
The multi-form creation process is now complete. Buttons were created to activate associated forms, and each type of query result is displayed on its own form.
To show how the above report design appears during execution, the figure below shows Bill Brown as the employee selected.
The Forms Tab
In the figure to the left, the Address Form is highlighted, thus the Address Form is displayed in the Design Area.
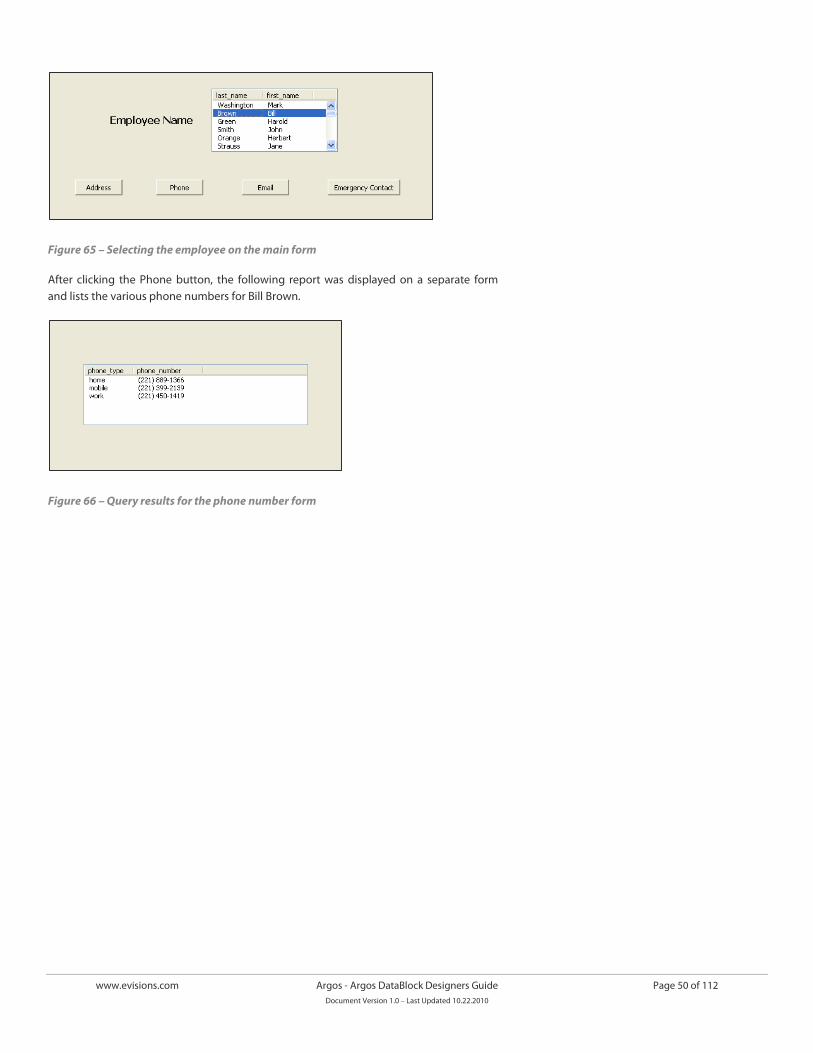
www.evisions.com Argos - Argos DataBlock Designers Guide Page 50 of 112 Document Version 1.0 – Last Updated 10.22.2010
Figure 65 – Selecting the employee on the main form
After clicking the Phone button, the following report was displayed on a separate form and lists the various phone numbers for Bill Brown.
Figure 66 – Query results for the phone number form
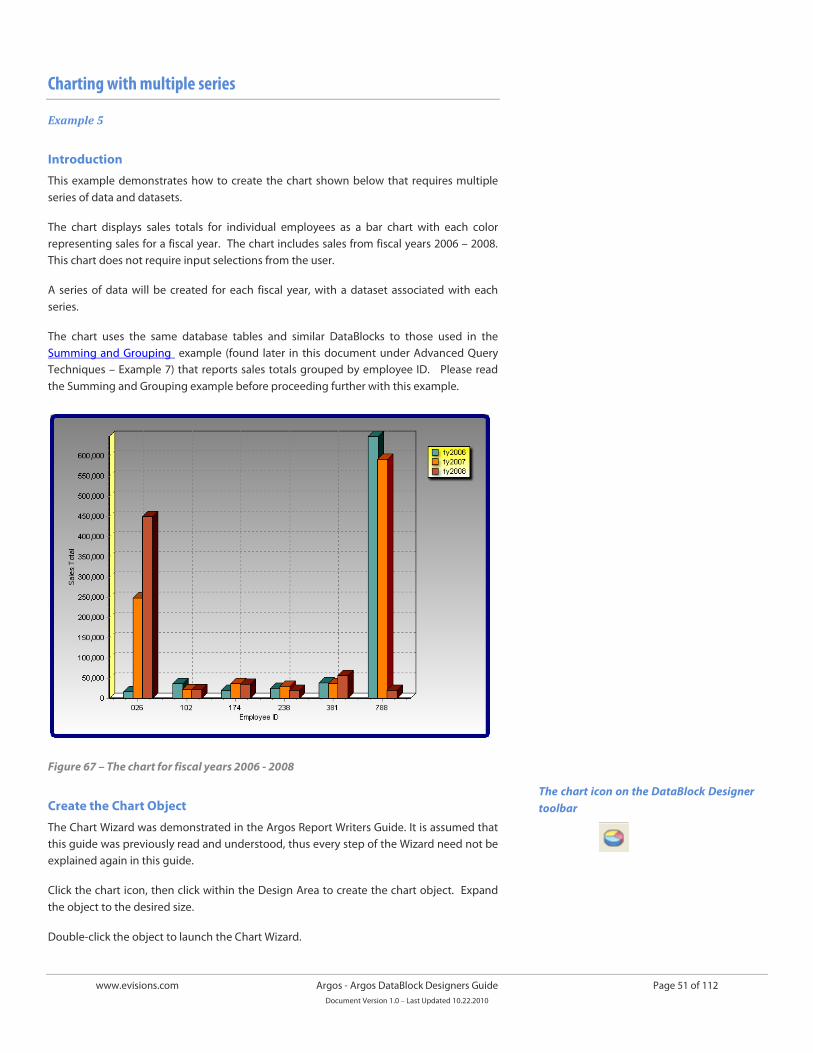
www.evisions.com Argos - Argos DataBlock Designers Guide Page 51 of 112 Document Version 1.0 – Last Updated 10.22.2010
Charting with multiple series
Example 5
Introduction
This example demonstrates how to create the chart shown below that requires multiple series of data and datasets.
The chart displays sales totals for individual employees as a bar chart with each color representing sales for a fiscal year. The chart includes sales from fiscal years 2006 – 2008. This chart does not require input selections from the user.
A series of data will be created for each fiscal year, with a dataset associated with each series.
The chart uses the same database tables and similar DataBlocks to those used in the Summing and Grouping example (found later in this document under Advanced Query Techniques – Example 7) that reports sales totals grouped by employee ID. Please read the Summing and Grouping example before proceeding further with this example.
Figure 67 – The chart for fiscal years 2006 - 2008
Create the Chart Object
The Chart Wizard was demonstrated in the Argos Report Writers Guide. It is assumed that this guide was previously read and understood, thus every step of the Wizard need not be explained again in this guide.
Click the chart icon, then click within the Design Area to create the chart object. Expand the object to the desired size.
Double-click the object to launch the Chart Wizard.
The chart icon on the DataBlock Designer toolbar
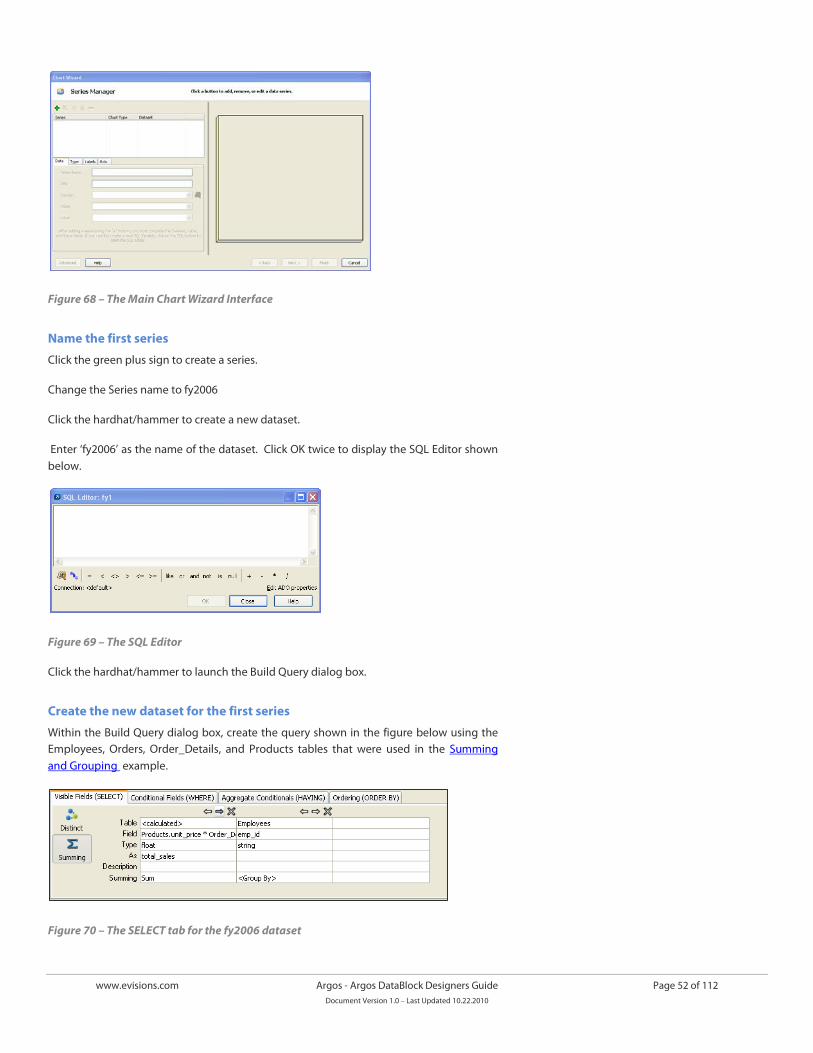
www.evisions.com Argos - Argos DataBlock Designers Guide Page 52 of 112 Document Version 1.0 – Last Updated 10.22.2010
Figure 68 – The Main Chart Wizard Interface
Name the first series
Click the green plus sign to create a series.
Change the Series name to fy2006
Click the hardhat/hammer to create a new dataset.
Enter ‘fy2006’ as the name of the dataset. Click OK twice to display the SQL Editor shown below.
Figure 69 – The SQL Editor
Click the hardhat/hammer to launch the Build Query dialog box.
Create the new dataset for the first series
Within the Build Query dialog box, create the query shown in the figure below using the Employees, Orders, Order_Details, and Products tables that were used in the Summing and Grouping example.
Figure 70 – The SELECT tab for the fy2006 dataset
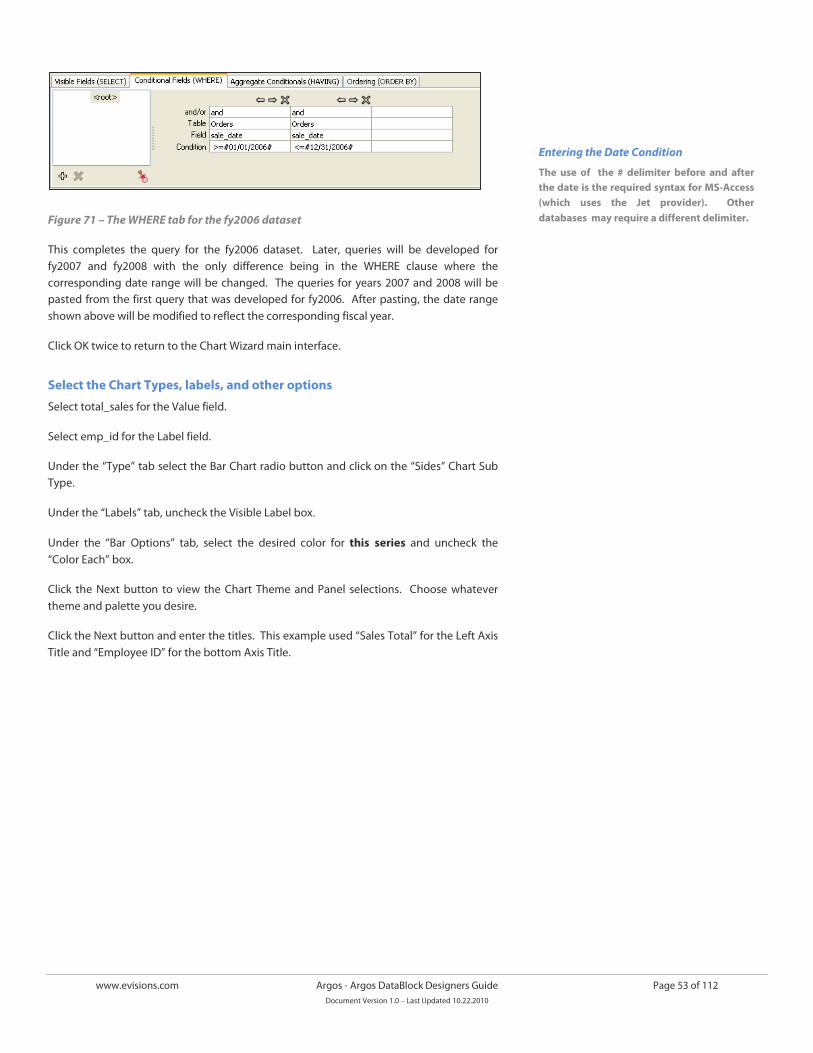
www.evisions.com Argos - Argos DataBlock Designers Guide Page 53 of 112 Document Version 1.0 – Last Updated 10.22.2010
Figure 71 – The WHERE tab for the fy2006 dataset
This completes the query for the fy2006 dataset. Later, queries will be developed for fy2007 and fy2008 with the only difference being in the WHERE clause where the corresponding date range will be changed. The queries for years 2007 and 2008 will be pasted from the first query that was developed for fy2006. After pasting, the date range shown above will be modified to reflect the corresponding fiscal year.
Click OK twice to return to the Chart Wizard main interface.
Select the Chart Types, labels, and other options
Select total_sales for the Value field.
Select emp_id for the Label field.
Under the “Type” tab select the Bar Chart radio button and click on the “Sides” Chart Sub Type.
Under the “Labels” tab, uncheck the Visible Label box.
Under the “Bar Options” tab, select the desired color for this series and uncheck the “Color Each” box.
Click the Next button to view the Chart Theme and Panel selections. Choose whatever theme and palette you desire.
Click the Next button and enter the titles. This example used “Sales Total” for the Left Axis Title and “Employee ID” for the bottom Axis Title.
Entering the Date Condition
The use of the # delimiter before and after the date is the required syntax for MS-Access (which uses the Jet provider). Other databases may require a different delimiter.
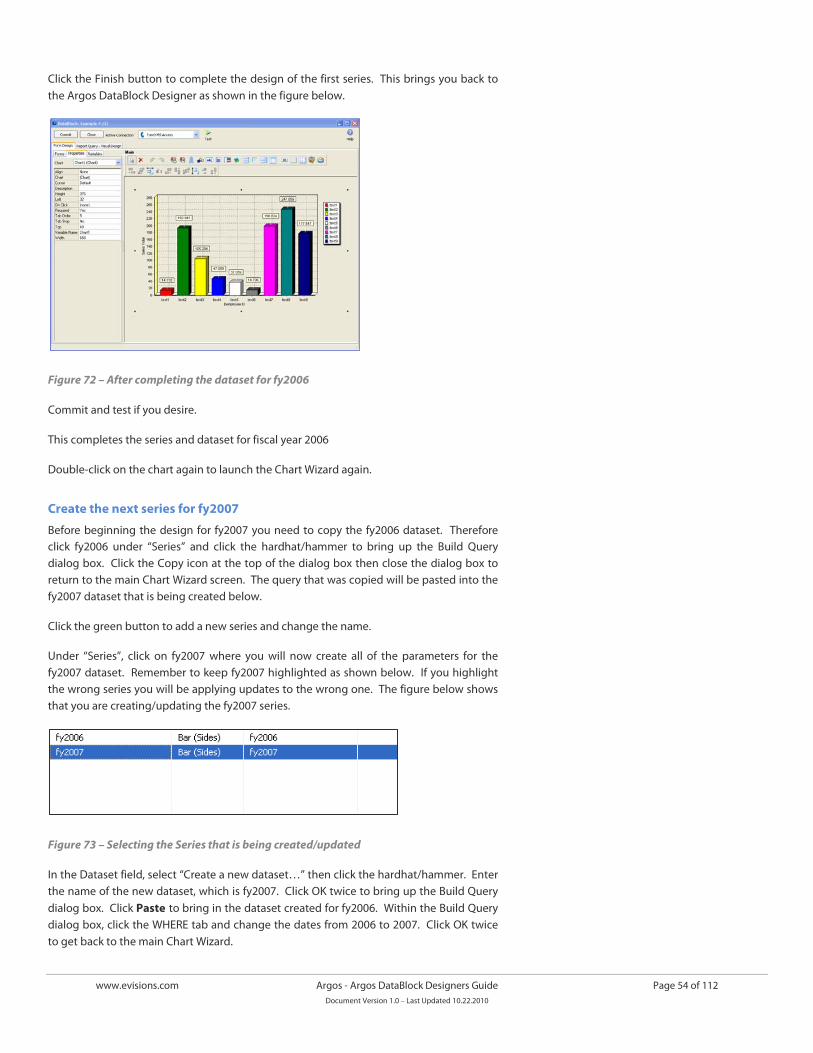
www.evisions.com Argos - Argos DataBlock Designers Guide Page 54 of 112 Document Version 1.0 – Last Updated 10.22.2010
Click the Finish button to complete the design of the first series. This brings you back to the Argos DataBlock Designer as shown in the figure below.
Figure 72 – After completing the dataset for fy2006
Commit and test if you desire.
This completes the series and dataset for fiscal year 2006
Double-click on the chart again to launch the Chart Wizard again.
Create the next series for fy2007
Before beginning the design for fy2007 you need to copy the fy2006 dataset. Therefore click fy2006 under “Series” and click the hardhat/hammer to bring up the Build Query dialog box. Click the Copy icon at the top of the dialog box then close the dialog box to return to the main Chart Wizard screen. The query that was copied will be pasted into the fy2007 dataset that is being created below.
Click the green button to add a new series and change the name.
Under “Series”, click on fy2007 where you will now create all of the parameters for the fy2007 dataset. Remember to keep fy2007 highlighted as shown below. If you highlight the wrong series you will be applying updates to the wrong one. The figure below shows that you are creating/updating the fy2007 series.
Figure 73 – Selecting the Series that is being created/updated
In the Dataset field, select “Create a new dataset…” then click the hardhat/hammer. Enter the name of the new dataset, which is fy2007. Click OK twice to bring up the Build Query dialog box. Click Paste to bring in the dataset created for fy2006. Within the Build Query dialog box, click the WHERE tab and change the dates from 2006 to 2007. Click OK twice to get back to the main Chart Wizard.
www.evisions.com Argos - Argos DataBlock Designers Guide Page 55 of 112 Document Version 1.0 – Last Updated 10.22.2010
Select the same values for the Value and Label fields as was done for fy2006.
Choose the same selections for the Type, Labels, Axis, and Bar Options as was done for fy2006, except for this series select a different color for the bar under the Bar Options tab.
The dataset for fy2007 is now complete. Repeat the process for fy2008.
Summary
This example illustrated how to create several data series to be displayed on one chart and how to associate datasets with each series.
It is imperative that for each series the appropriate selections (Bar Options, labels, axis) are the same for each series. Otherwise you will mix options on the same chart, producing undesired results. For example, you wouldn’t necessarily want one series producing a bar chart, and another series producing a line chart.
Also, be sure that the correct Series is highlighted when editing otherwise you may be unintentionally changing a Series that you didn’t want to change.
Save this as a QuickView Report. You can then add the chart to a QuickLaunch or Dashboard.
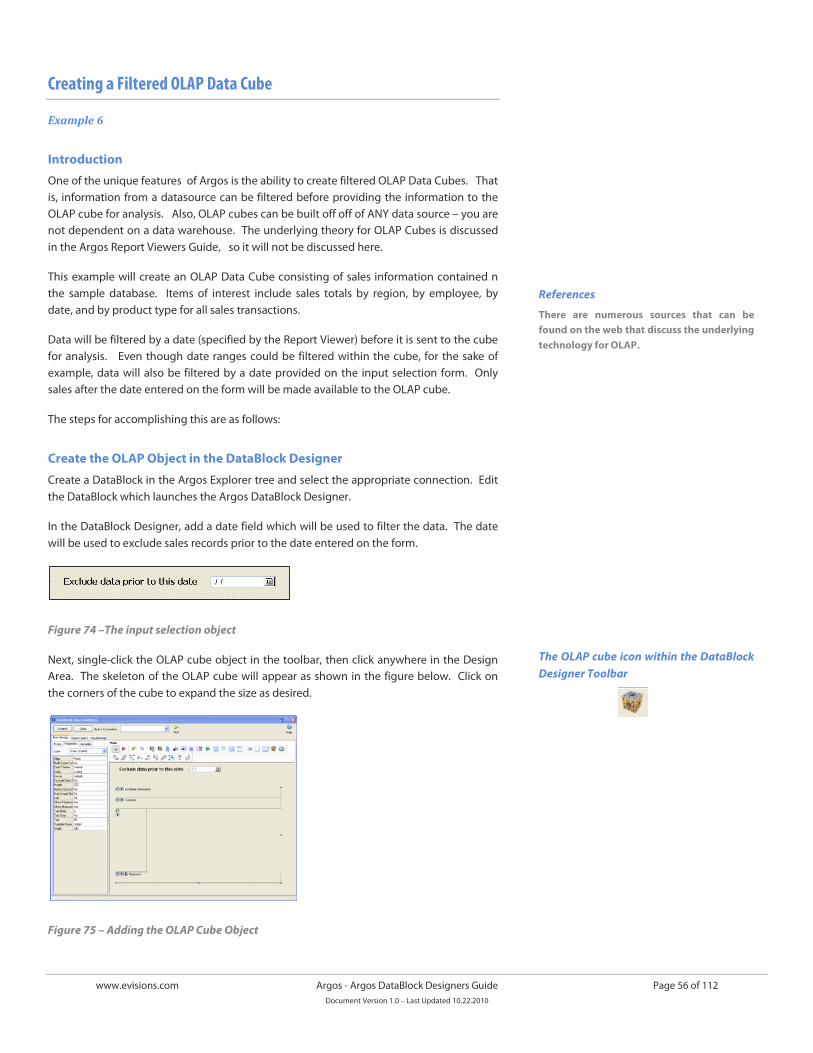
www.evisions.com Argos - Argos DataBlock Designers Guide Page 56 of 112 Document Version 1.0 – Last Updated 10.22.2010
Creating a Filtered OLAP Data Cube
Example 6
Introduction
One of the unique features of Argos is the ability to create filtered OLAP Data Cubes. That is, information from a datasource can be filtered before providing the information to the OLAP cube for analysis. Also, OLAP cubes can be built off off of ANY data source – you are not dependent on a data warehouse. The underlying theory for OLAP Cubes is discussed in the Argos Report Viewers Guide, so it will not be discussed here.
This example will create an OLAP Data Cube consisting of sales information contained n the sample database. Items of interest include sales totals by region, by employee, by date, and by product type for all sales transactions.
Data will be filtered by a date (specified by the Report Viewer) before it is sent to the cube for analysis. Even though date ranges could be filtered within the cube, for the sake of example, data will also be filtered by a date provided on the input selection form. Only sales after the date entered on the form will be made available to the OLAP cube.
The steps for accomplishing this are as follows:
Create the OLAP Object in the DataBlock Designer
Create a DataBlock in the Argos Explorer tree and select the appropriate connection. Edit the DataBlock which launches the Argos DataBlock Designer.
In the DataBlock Designer, add a date field which will be used to filter the data. The date will be used to exclude sales records prior to the date entered on the form.
Figure 74 –The input selection object
Next, single-click the OLAP cube object in the toolbar, then click anywhere in the Design Area. The skeleton of the OLAP cube will appear as shown in the figure below. Click on the corners of the cube to expand the size as desired.
Figure 75 – Adding the OLAP Cube Object
References
There are numerous sources that can be found on the web that discuss the underlying technology for OLAP.
The OLAP cube icon within the DataBlock Designer Toolbar
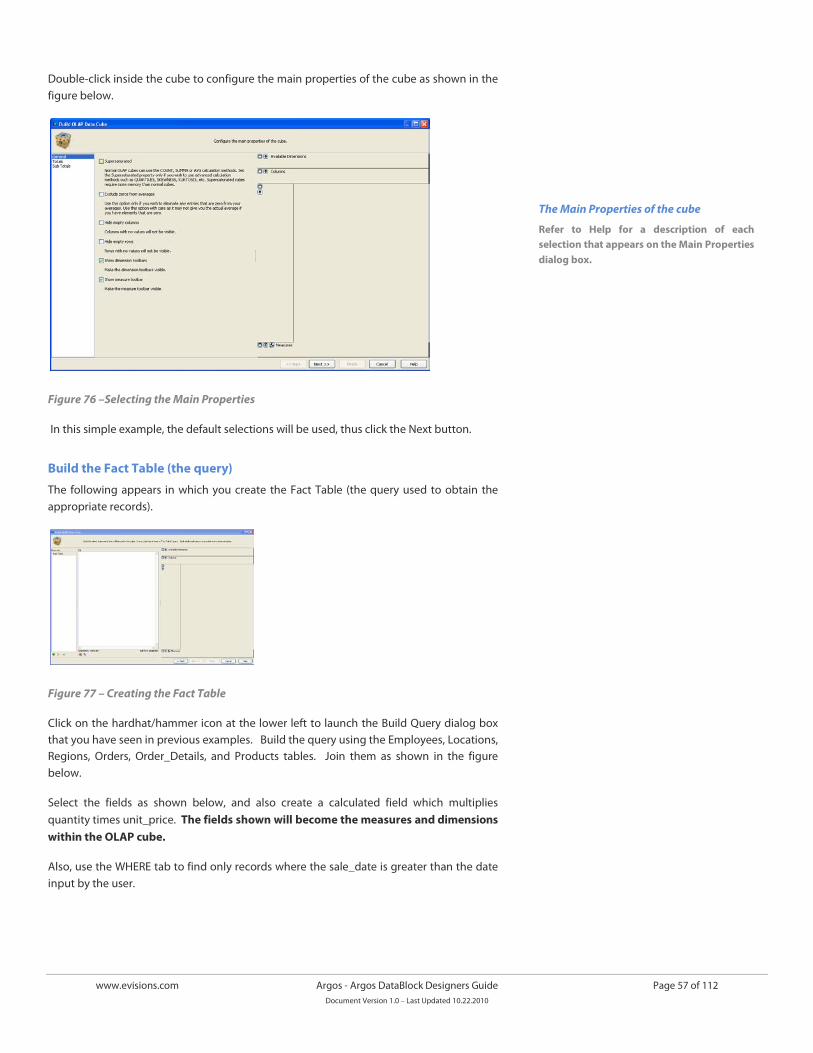
www.evisions.com Argos - Argos DataBlock Designers Guide Page 57 of 112 Document Version 1.0 – Last Updated 10.22.2010
Double-click inside the cube to configure the main properties of the cube as shown in the figure below.
Figure 76 –Selecting the Main Properties
In this simple example, the default selections will be used, thus click the Next button.
Build the Fact Table (the query)
The following appears in which you create the Fact Table (the query used to obtain the appropriate records).
Figure 77 – Creating the Fact Table
Click on the hardhat/hammer icon at the lower left to launch the Build Query dialog box that you have seen in previous examples. Build the query using the Employees, Locations, Regions, Orders, Order_Details, and Products tables. Join them as shown in the figure below.
Select the fields as shown below, and also create a calculated field which multiplies quantity times unit_price. The fields shown will become the measures and dimensions within the OLAP cube.
Also, use the WHERE tab to find only records where the sale_date is greater than the date input by the user.
The Main Properties of the cube
Refer to Help for a description of each selection that appears on the Main Properties dialog box.
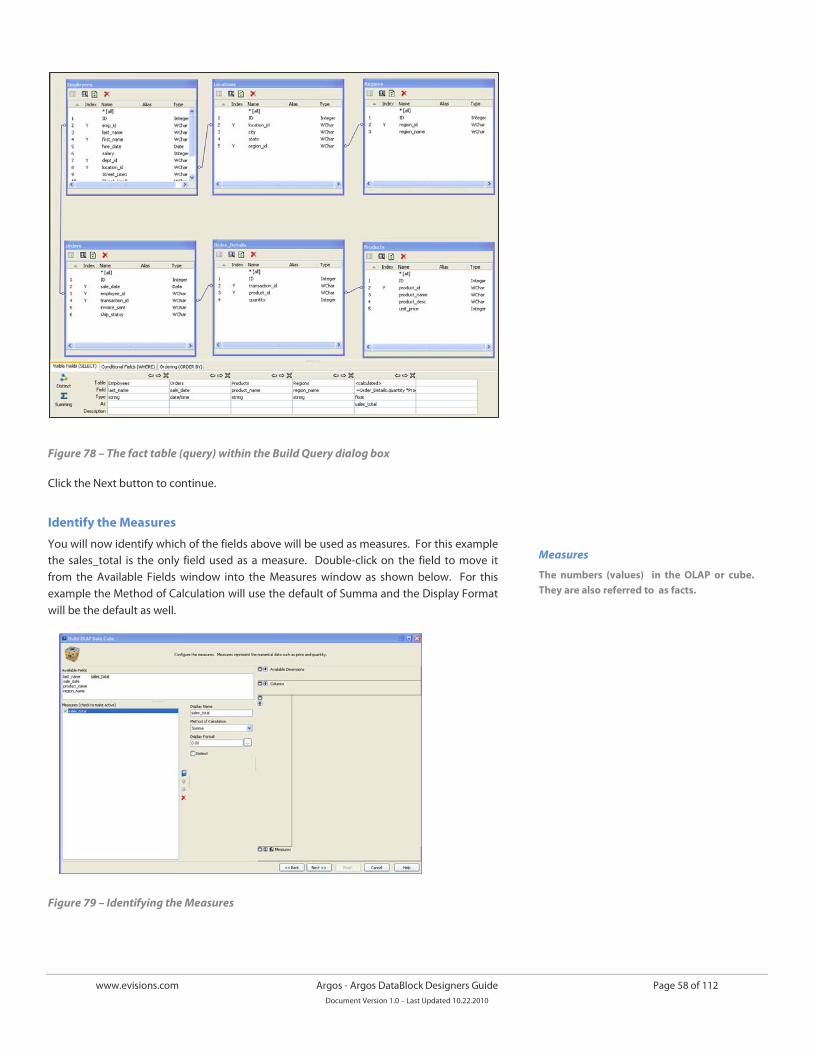
www.evisions.com Argos - Argos DataBlock Designers Guide Page 58 of 112 Document Version 1.0 – Last Updated 10.22.2010
Figure 78 – The fact table (query) within the Build Query dialog box
Click the Next button to continue.
Identify the Measures
You will now identify which of the fields above will be used as measures. For this example the sales_total is the only field used as a measure. Double-click on the field to move it from the Available Fields window into the Measures window as shown below. For this example the Method of Calculation will use the default of Summa and the Display Format will be the default as well.
Figure 79 – Identifying the Measures
Measures
The numbers (values) in the OLAP or cube. They are also referred to as facts.
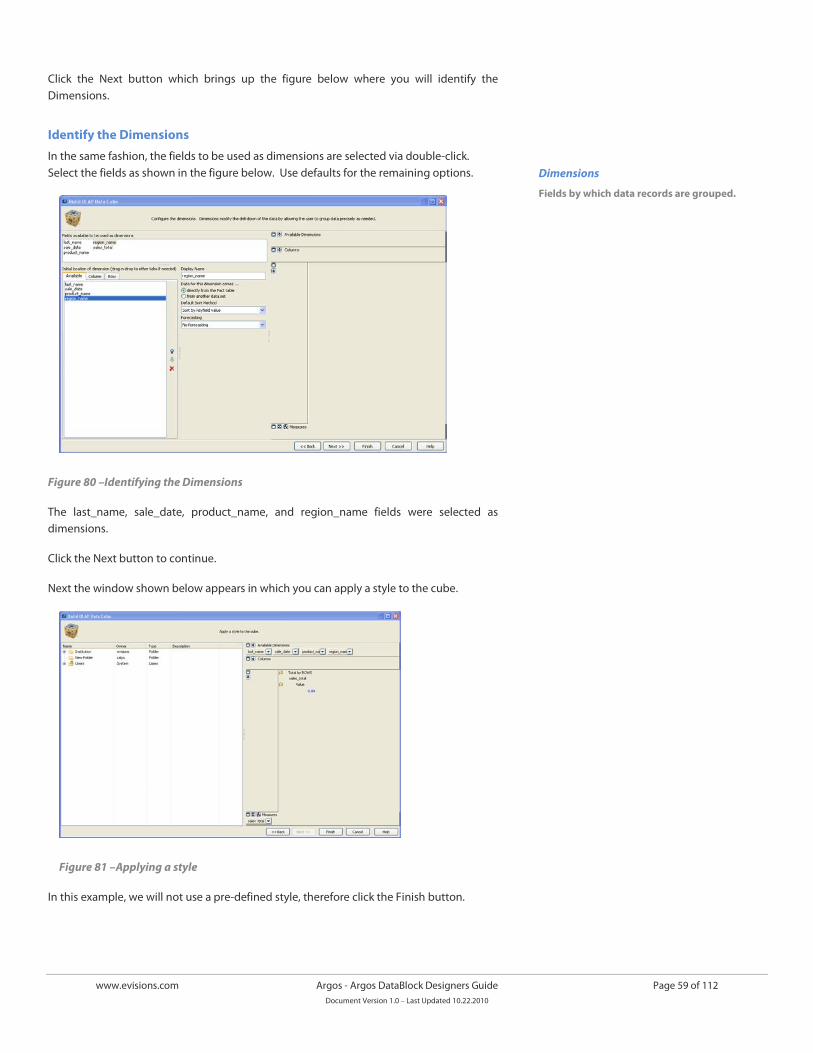
www.evisions.com Argos - Argos DataBlock Designers Guide Page 59 of 112 Document Version 1.0 – Last Updated 10.22.2010
Click the Next button which brings up the figure below where you will identify the Dimensions.
Identify the Dimensions
In the same fashion, the fields to be used as dimensions are selected via double-click. Select the fields as shown in the figure below. Use defaults for the remaining options.
Figure 80 –Identifying the Dimensions
The last_name, sale_date, product_name, and region_name fields were selected as dimensions.
Click the Next button to continue.
Next the window shown below appears in which you can apply a style to the cube.
Figure 81 –Applying a style
In this example, we will not use a pre-defined style, therefore click the Finish button.
Dimensions
Fields by which data records are grouped.
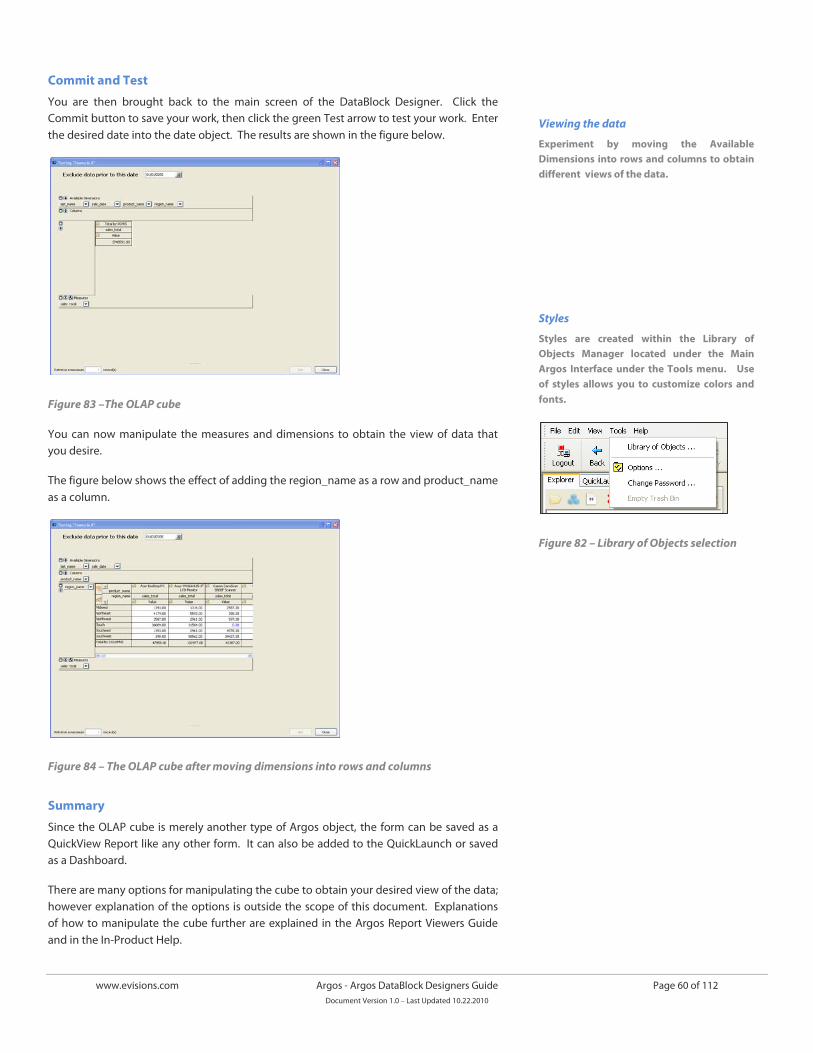
www.evisions.com Argos - Argos DataBlock Designers Guide Page 60 of 112 Document Version 1.0 – Last Updated 10.22.2010
Commit and Test
You are then brought back to the main screen of the DataBlock Designer. Click the Commit button to save your work, then click the green Test arrow to test your work. Enter the desired date into the date object. The results are shown in the figure below.
Figure 83 –The OLAP cube
You can now manipulate the measures and dimensions to obtain the view of data that you desire.
The figure below shows the effect of adding the region_name as a row and product_name as a column.
Figure 84 – The OLAP cube after moving dimensions into rows and columns
Summary
Since the OLAP cube is merely another type of Argos object, the form can be saved as a QuickView Report like any other form. It can also be added to the QuickLaunch or saved as a Dashboard.
There are many options for manipulating the cube to obtain your desired view of the data; however explanation of the options is outside the scope of this document. Explanations of how to manipulate the cube further are explained in the Argos Report Viewers Guide and in the In-Product Help.
Viewing the data
Experiment by moving the Available Dimensions into rows and columns to obtain different views of the data.
Styles
Styles are created within the Library of Objects Manager located under the Main Argos Interface under the Tools menu. Use of styles allows you to customize colors and fonts.
Figure 82 – Library of Objects selection
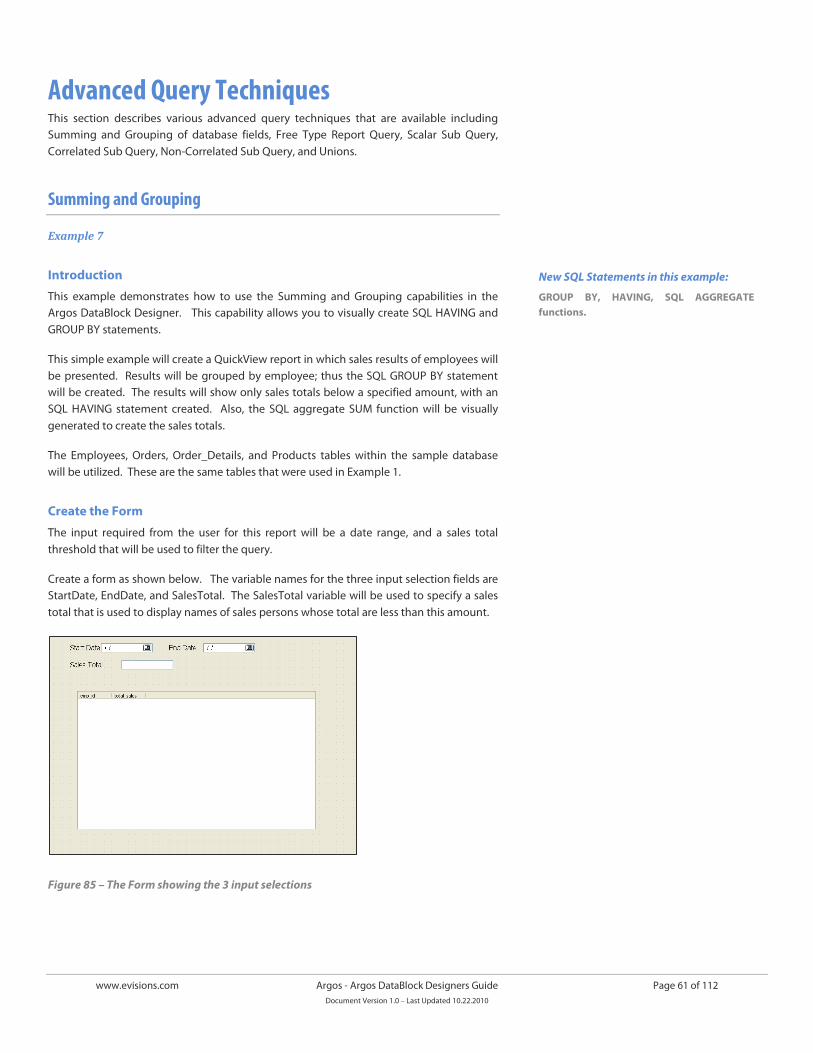
www.evisions.com Argos - Argos DataBlock Designers Guide Page 61 of 112 Document Version 1.0 – Last Updated 10.22.2010
Advanced Query Techniques This section describes various advanced query techniques that are available including Summing and Grouping of database fields, Free Type Report Query, Scalar Sub Query, Correlated Sub Query, Non-Correlated Sub Query, and Unions.
Summing and Grouping
Example 7
Introduction
This example demonstrates how to use the Summing and Grouping capabilities in the Argos DataBlock Designer. This capability allows you to visually create SQL HAVING and GROUP BY statements.
This simple example will create a QuickView report in which sales results of employees will be presented. Results will be grouped by employee; thus the SQL GROUP BY statement will be created. The results will show only sales totals below a specified amount, with an SQL HAVING statement created. Also, the SQL aggregate SUM function will be visually generated to create the sales totals.
The Employees, Orders, Order_Details, and Products tables within the sample database will be utilized. These are the same tables that were used in Example 1.
Create the Form
The input required from the user for this report will be a date range, and a sales total threshold that will be used to filter the query.
Create a form as shown below. The variable names for the three input selection fields are StartDate, EndDate, and SalesTotal. The SalesTotal variable will be used to specify a sales total that is used to display names of sales persons whose total are less than this amount.
Figure 85 – The Form showing the 3 input selections
New SQL Statements in this example:
GROUP BY, HAVING, SQL AGGREGATE functions.
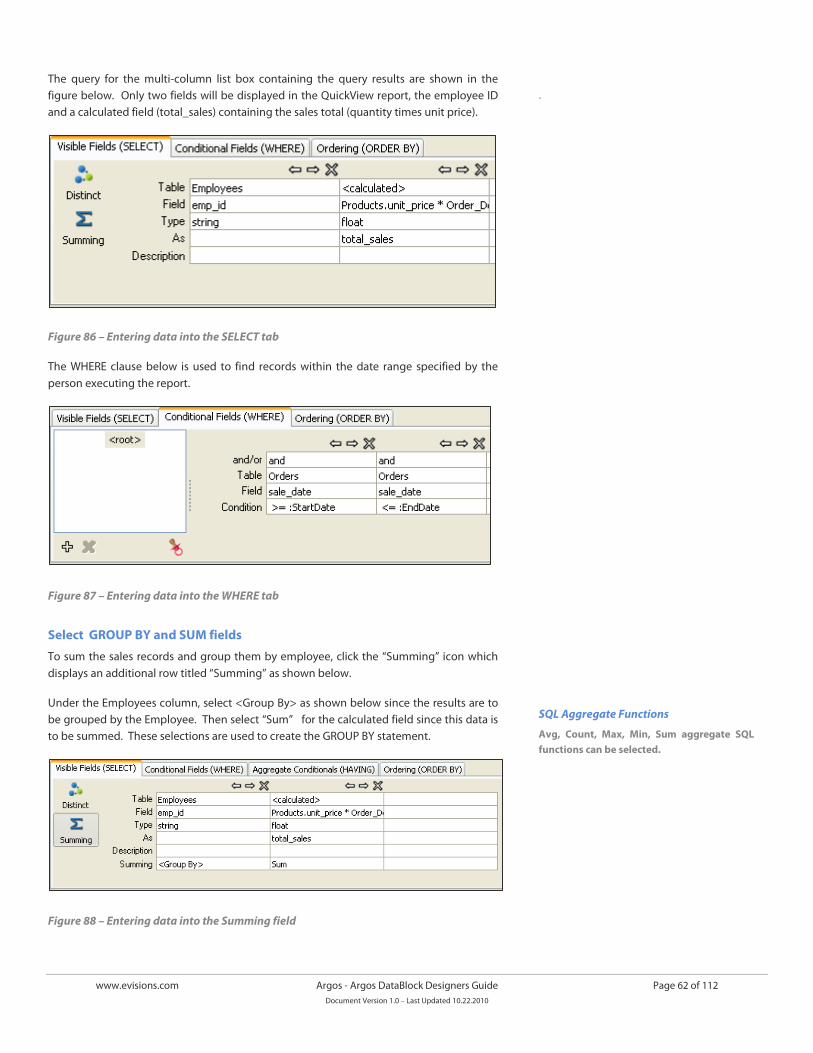
www.evisions.com Argos - Argos DataBlock Designers Guide Page 62 of 112 Document Version 1.0 – Last Updated 10.22.2010
The query for the multi-column list box containing the query results are shown in the figure below. Only two fields will be displayed in the QuickView report, the employee ID and a calculated field (total_sales) containing the sales total (quantity times unit price).
Figure 86 – Entering data into the SELECT tab
The WHERE clause below is used to find records within the date range specified by the person executing the report.
Figure 87 – Entering data into the WHERE tab
Select GROUP BY and SUM fields
To sum the sales records and group them by employee, click the “Summing” icon which displays an additional row titled “Summing” as shown below.
Under the Employees column, select <Group By> as shown below since the results are to be grouped by the Employee. Then select “Sum” for the calculated field since this data is to be summed. These selections are used to create the GROUP BY statement.
Figure 88 – Entering data into the Summing field
.
SQL Aggregate Functions
Avg, Count, Max, Min, Sum aggregate SQL functions can be selected.
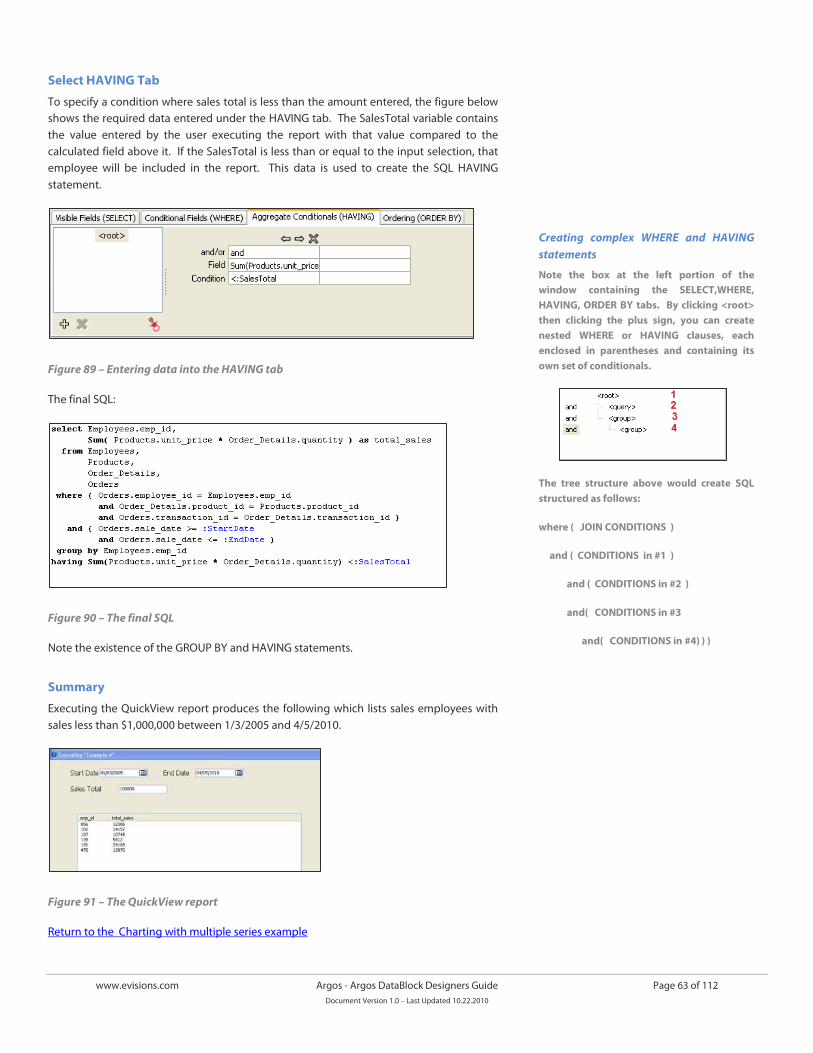
www.evisions.com Argos - Argos DataBlock Designers Guide Page 63 of 112 Document Version 1.0 – Last Updated 10.22.2010
Select HAVING Tab
To specify a condition where sales total is less than the amount entered, the figure below shows the required data entered under the HAVING tab. The SalesTotal variable contains the value entered by the user executing the report with that value compared to the calculated field above it. If the SalesTotal is less than or equal to the input selection, that employee will be included in the report. This data is used to create the SQL HAVING statement.
Figure 89 – Entering data into the HAVING tab
The final SQL:
Figure 90 – The final SQL
Note the existence of the GROUP BY and HAVING statements.
Summary
Executing the QuickView report produces the following which lists sales employees with sales less than $1,000,000 between 1/3/2005 and 4/5/2010.
Figure 91 – The QuickView report
Return to the Charting with multiple series example
Creating complex WHERE and HAVING statements
Note the box at the left portion of the window containing the SELECT,WHERE, HAVING, ORDER BY tabs. By clicking <root> then clicking the plus sign, you can create nested WHERE or HAVING clauses, each enclosed in parentheses and containing its own set of conditionals.
The tree structure above would create SQL structured as follows:
where ( JOIN CONDITIONS )
and ( CONDITIONS in #1 )
and ( CONDITIONS in #2 )
and( CONDITIONS in #3
and( CONDITIONS in #4) ) )
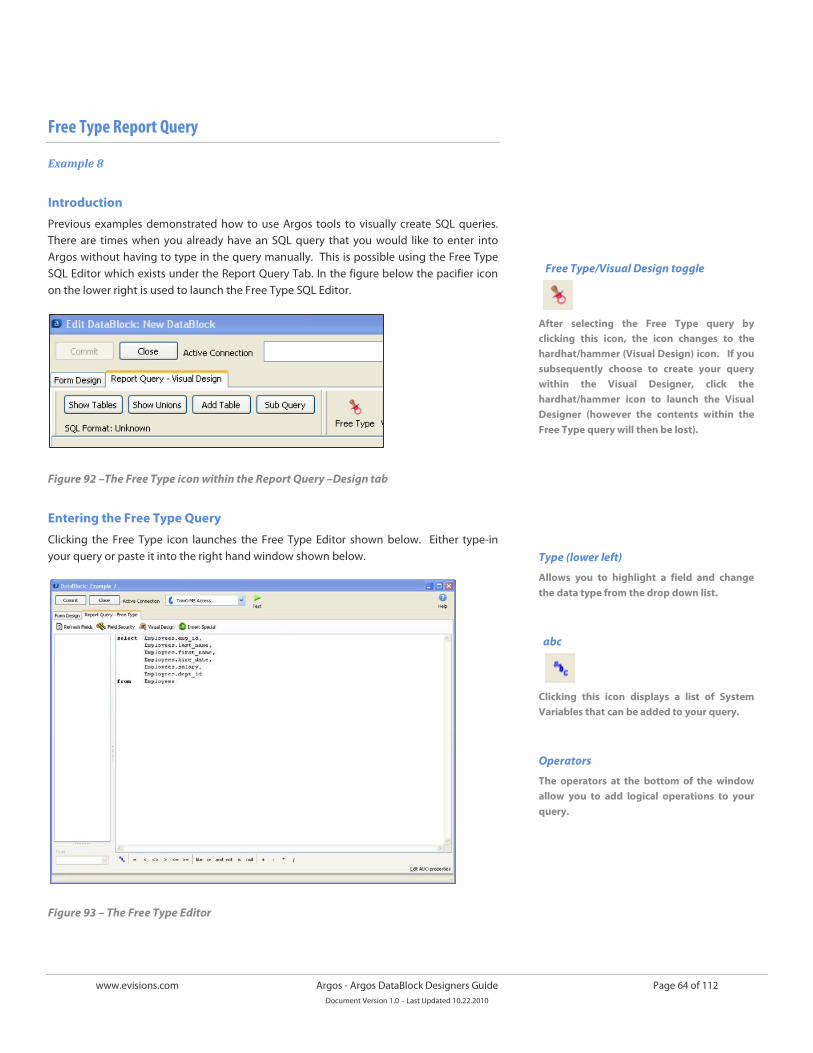
www.evisions.com Argos - Argos DataBlock Designers Guide Page 64 of 112 Document Version 1.0 – Last Updated 10.22.2010
Free Type Report Query
Example 8
Introduction
Previous examples demonstrated how to use Argos tools to visually create SQL queries. There are times when you already have an SQL query that you would like to enter into Argos without having to type in the query manually. This is possible using the Free Type SQL Editor which exists under the Report Query Tab. In the figure below the pacifier icon on the lower right is used to launch the Free Type SQL Editor.
Figure 92 –The Free Type icon within the Report Query –Design tab
Entering the Free Type Query
Clicking the Free Type icon launches the Free Type Editor shown below. Either type-in your query or paste it into the right hand window shown below.
Figure 93 – The Free Type Editor
Free Type/Visual Design toggle
After selecting the Free Type query by clicking this icon, the icon changes to the hardhat/hammer (Visual Design) icon. If you subsequently choose to create your query within the Visual Designer, click the hardhat/hammer icon to launch the Visual Designer (however the contents within the Free Type query will then be lost).
Type (lower left)
Allows you to highlight a field and change the data type from the drop down list.
abc
Clicking this icon displays a list of System Variables that can be added to your query.
Operators
The operators at the bottom of the window allow you to add logical operations to your query.
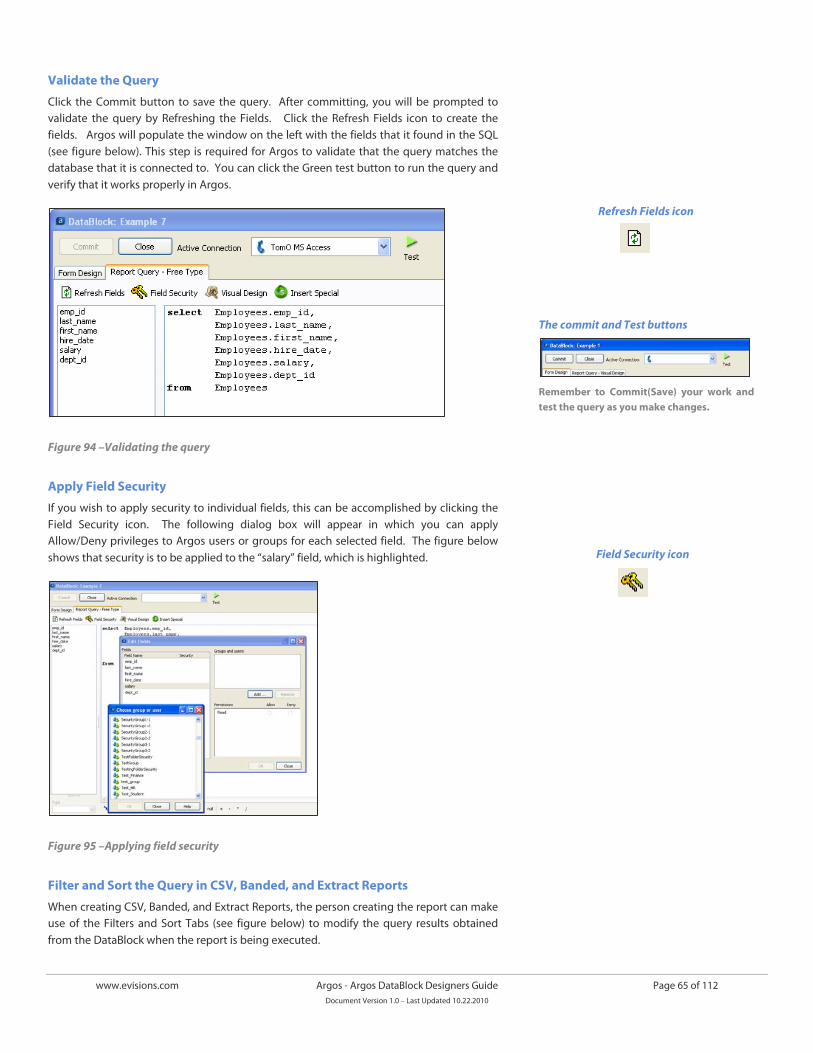
www.evisions.com Argos - Argos DataBlock Designers Guide Page 65 of 112 Document Version 1.0 – Last Updated 10.22.2010
Validate the Query
Click the Commit button to save the query. After committing, you will be prompted to validate the query by Refreshing the Fields. Click the Refresh Fields icon to create the fields. Argos will populate the window on the left with the fields that it found in the SQL (see figure below). This step is required for Argos to validate that the query matches the database that it is connected to. You can click the Green test button to run the query and verify that it works properly in Argos.
Figure 94 –Validating the query
Apply Field Security
If you wish to apply security to individual fields, this can be accomplished by clicking the Field Security icon. The following dialog box will appear in which you can apply Allow/Deny privileges to Argos users or groups for each selected field. The figure below shows that security is to be applied to the “salary” field, which is highlighted.
Figure 95 –Applying field security
Filter and Sort the Query in CSV, Banded, and Extract Reports
When creating CSV, Banded, and Extract Reports, the person creating the report can make use of the Filters and Sort Tabs (see figure below) to modify the query results obtained from the DataBlock when the report is being executed.
Refresh Fields icon
The commit and Test buttons
Remember to Commit(Save) your work and test the query as you make changes.
Field Security icon
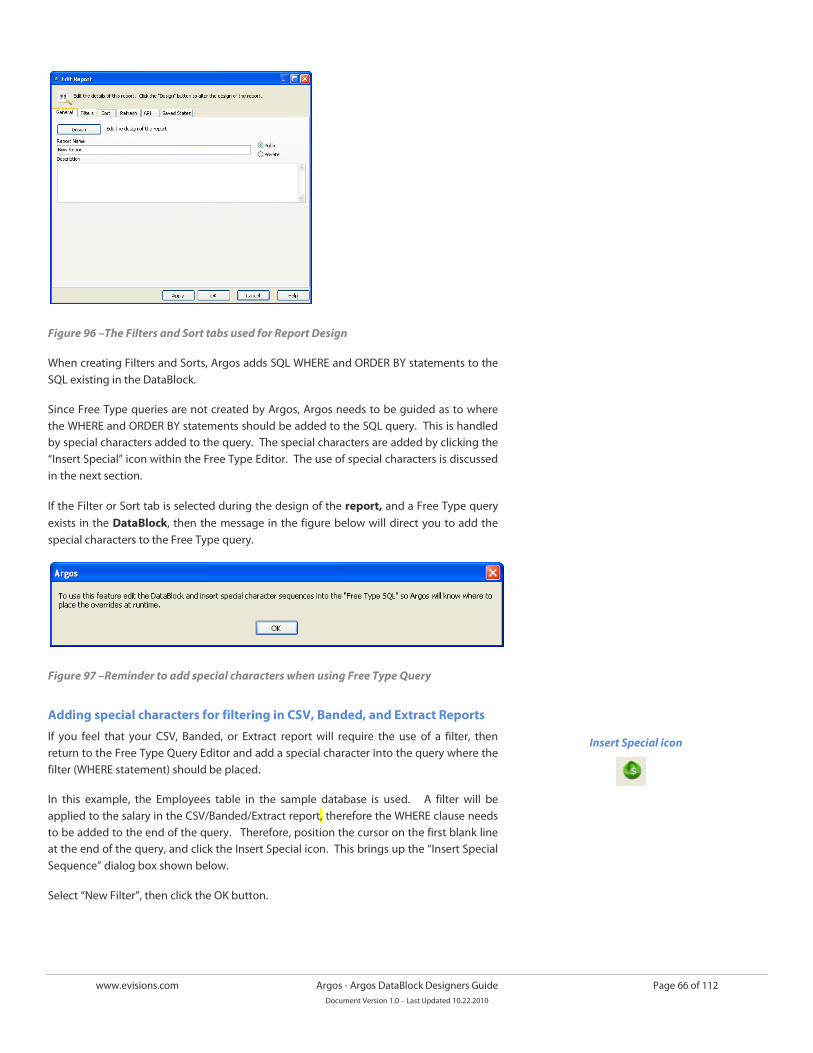
www.evisions.com Argos - Argos DataBlock Designers Guide Page 66 of 112 Document Version 1.0 – Last Updated 10.22.2010
Figure 96 –The Filters and Sort tabs used for Report Design
When creating Filters and Sorts, Argos adds SQL WHERE and ORDER BY statements to the SQL existing in the DataBlock.
Since Free Type queries are not created by Argos, Argos needs to be guided as to where the WHERE and ORDER BY statements should be added to the SQL query. This is handled by special characters added to the query. The special characters are added by clicking the “Insert Special” icon within the Free Type Editor. The use of special characters is discussed in the next section.
If the Filter or Sort tab is selected during the design of the report, and a Free Type query exists in the DataBlock, then the message in the figure below will direct you to add the special characters to the Free Type query.
Figure 97 –Reminder to add special characters when using Free Type Query
Adding special characters for filtering in CSV, Banded, and Extract Reports
If you feel that your CSV, Banded, or Extract report will require the use of a filter, then return to the Free Type Query Editor and add a special character into the query where the filter (WHERE statement) should be placed.
In this example, the Employees table in the sample database is used. A filter will be applied to the salary in the CSV/Banded/Extract report, therefore the WHERE clause needs to be added to the end of the query. Therefore, position the cursor on the first blank line at the end of the query, and click the Insert Special icon. This brings up the “Insert Special Sequence” dialog box shown below.
Select “New Filter”, then click the OK button.
Insert Special icon
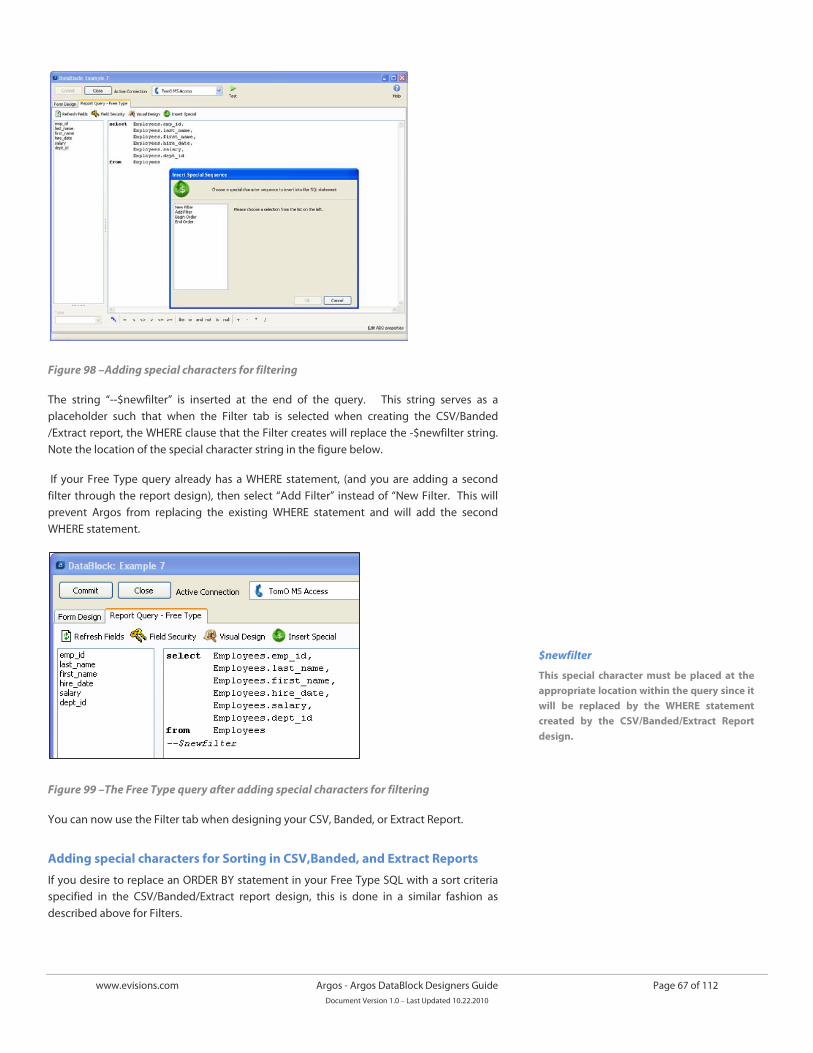
www.evisions.com Argos - Argos DataBlock Designers Guide Page 67 of 112 Document Version 1.0 – Last Updated 10.22.2010
Figure 98 –Adding special characters for filtering
The string “--$newfilter” is inserted at the end of the query. This string serves as a placeholder such that when the Filter tab is selected when creating the CSV/Banded /Extract report, the WHERE clause that the Filter creates will replace the -$newfilter string. Note the location of the special character string in the figure below.
If your Free Type query already has a WHERE statement, (and you are adding a second filter through the report design), then select “Add Filter” instead of “New Filter. This will prevent Argos from replacing the existing WHERE statement and will add the second WHERE statement.
Figure 99 –The Free Type query after adding special characters for filtering
You can now use the Filter tab when designing your CSV, Banded, or Extract Report.
Adding special characters for Sorting in CSV,Banded, and Extract Reports
If you desire to replace an ORDER BY statement in your Free Type SQL with a sort criteria specified in the CSV/Banded/Extract report design, this is done in a similar fashion as described above for Filters.
$newfilter
This special character must be placed at the appropriate location within the query since it will be replaced by the WHERE statement created by the CSV/Banded/Extract Report design.
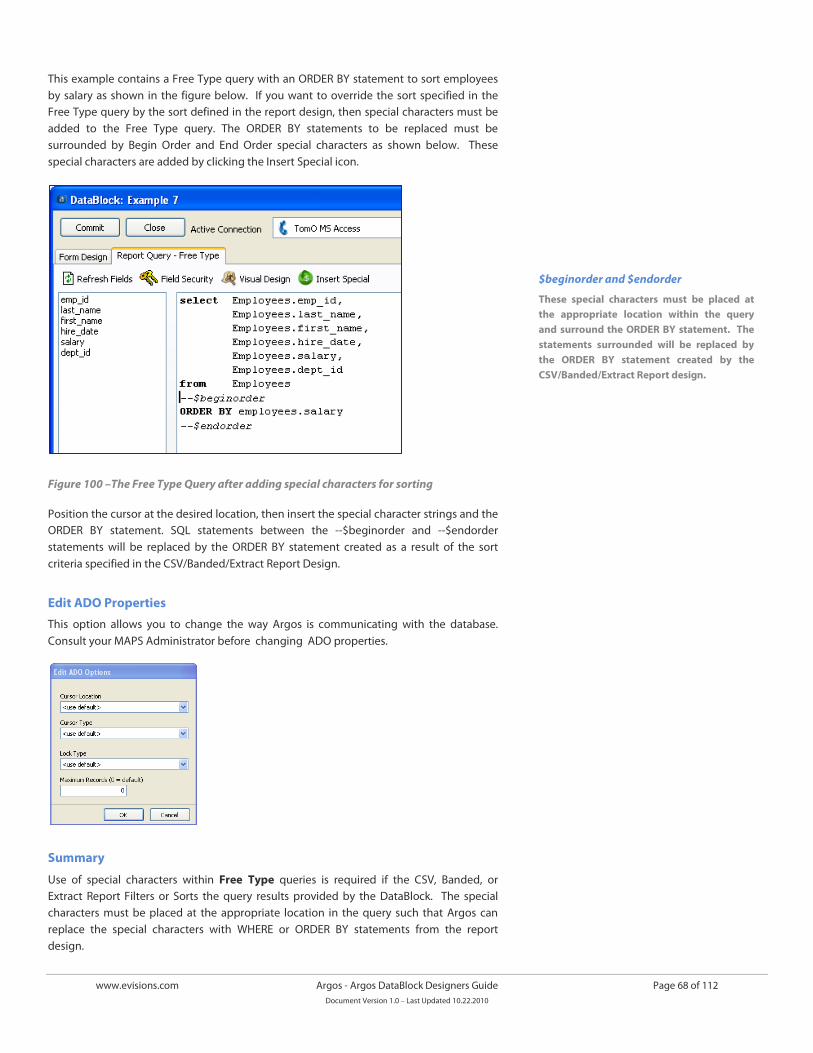
www.evisions.com Argos - Argos DataBlock Designers Guide Page 68 of 112 Document Version 1.0 – Last Updated 10.22.2010
This example contains a Free Type query with an ORDER BY statement to sort employees by salary as shown in the figure below. If you want to override the sort specified in the Free Type query by the sort defined in the report design, then special characters must be added to the Free Type query. The ORDER BY statements to be replaced must be surrounded by Begin Order and End Order special characters as shown below. These special characters are added by clicking the Insert Special icon.
Figure 100 –The Free Type Query after adding special characters for sorting
Position the cursor at the desired location, then insert the special character strings and the ORDER BY statement. SQL statements between the --$beginorder and --$endorder statements will be replaced by the ORDER BY statement created as a result of the sort criteria specified in the CSV/Banded/Extract Report Design.
Edit ADO Properties
This option allows you to change the way Argos is communicating with the database. Consult your MAPS Administrator before changing ADO properties.
Summary
Use of special characters within Free Type queries is required if the CSV, Banded, or Extract Report Filters or Sorts the query results provided by the DataBlock. The special characters must be placed at the appropriate location in the query such that Argos can replace the special characters with WHERE or ORDER BY statements from the report design.
$beginorder and $endorder
These special characters must be placed at the appropriate location within the query and surround the ORDER BY statement. The statements surrounded will be replaced by the ORDER BY statement created by the CSV/Banded/Extract Report design.
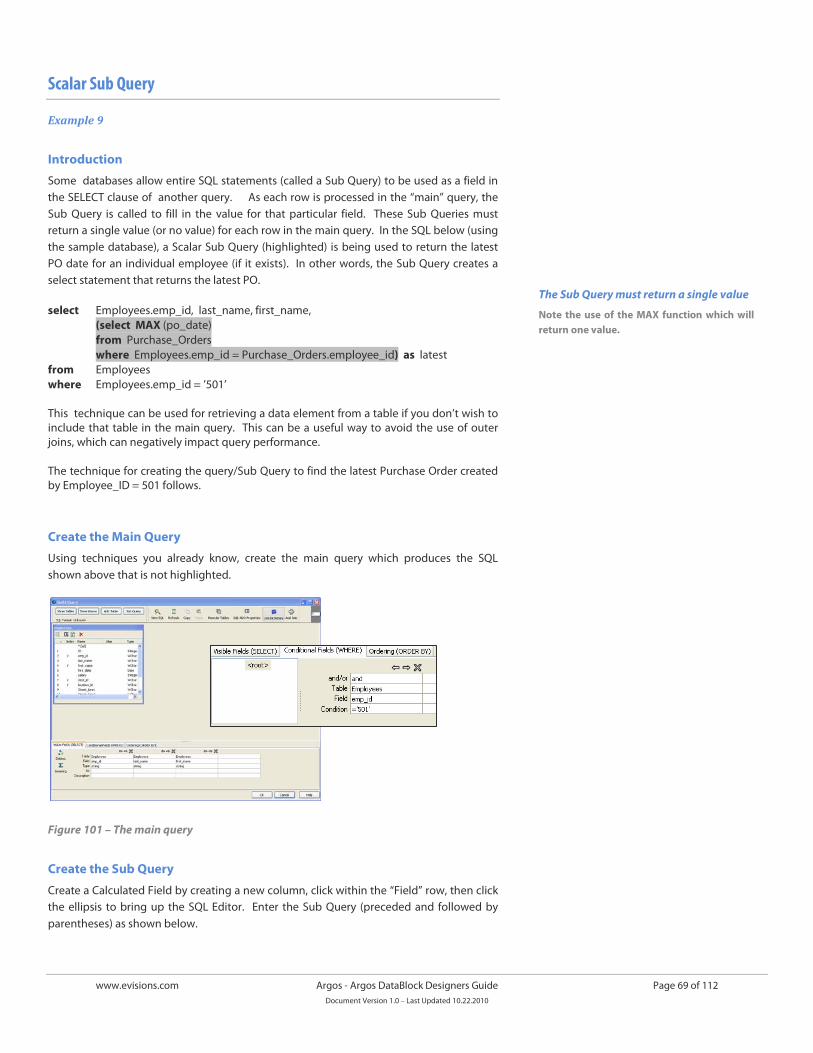
www.evisions.com Argos - Argos DataBlock Designers Guide Page 69 of 112 Document Version 1.0 – Last Updated 10.22.2010
Scalar Sub Query
Example 9
Introduction
Some databases allow entire SQL statements (called a Sub Query) to be used as a field in the SELECT clause of another query. As each row is processed in the “main” query, the Sub Query is called to fill in the value for that particular field. These Sub Queries must return a single value (or no value) for each row in the main query. In the SQL below (using the sample database), a Scalar Sub Query (highlighted) is being used to return the latest PO date for an individual employee (if it exists). In other words, the Sub Query creates a select statement that returns the latest PO.
select Employees.emp_id, last_name, first_name, (select MAX (po_date) from Purchase_Orders where Employees.emp_id = Purchase_Orders.employee_id) as latest
from Employees where Employees.emp_id = ’501’ This technique can be used for retrieving a data element from a table if you don’t wish to include that table in the main query. This can be a useful way to avoid the use of outer joins, which can negatively impact query performance. The technique for creating the query/Sub Query to find the latest Purchase Order created by Employee_ID = 501 follows.
Create the Main Query
Using techniques you already know, create the main query which produces the SQL shown above that is not highlighted.
Figure 101 – The main query
Create the Sub Query
Create a Calculated Field by creating a new column, click within the “Field” row, then click the ellipsis to bring up the SQL Editor. Enter the Sub Query (preceded and followed by parentheses) as shown below.
The Sub Query must return a single value
Note the use of the MAX function which will return one value.
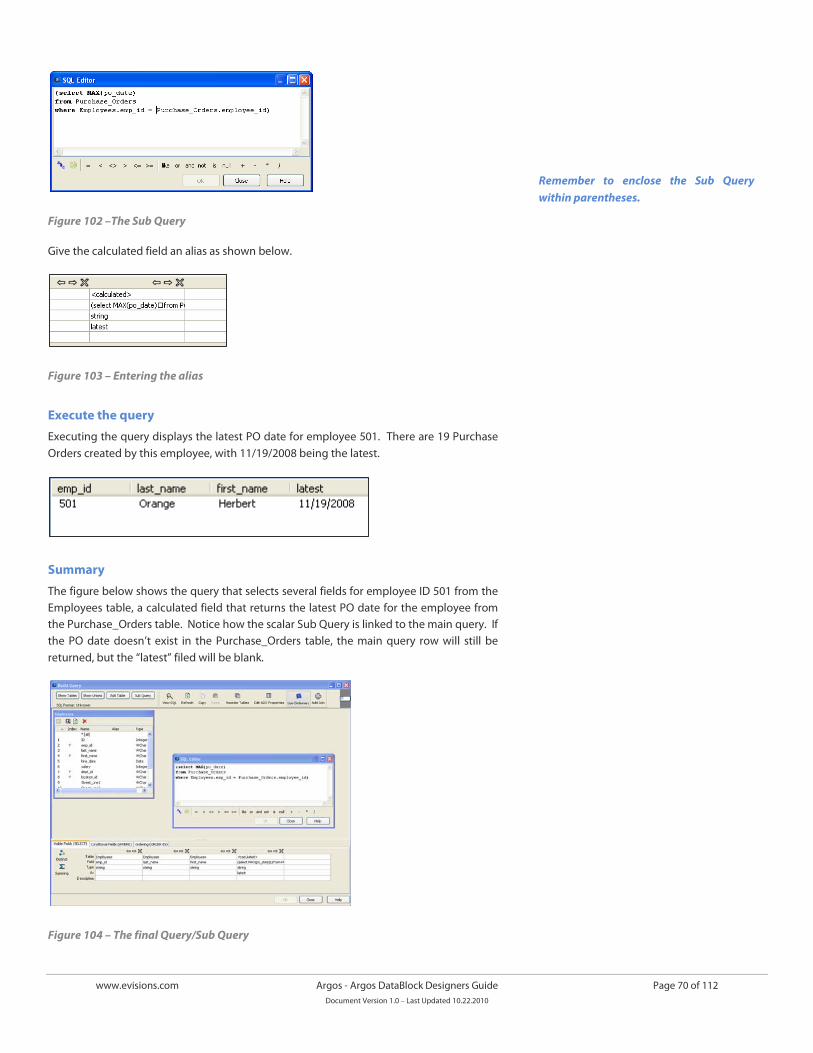
www.evisions.com Argos - Argos DataBlock Designers Guide Page 70 of 112 Document Version 1.0 – Last Updated 10.22.2010
Figure 102 –The Sub Query
Give the calculated field an alias as shown below.
Figure 103 – Entering the alias
Execute the query
Executing the query displays the latest PO date for employee 501. There are 19 Purchase Orders created by this employee, with 11/19/2008 being the latest.
Summary
The figure below shows the query that selects several fields for employee ID 501 from the Employees table, a calculated field that returns the latest PO date for the employee from the Purchase_Orders table. Notice how the scalar Sub Query is linked to the main query. If the PO date doesn’t exist in the Purchase_Orders table, the main query row will still be returned, but the “latest” filed will be blank.
Figure 104 – The final Query/Sub Query
Remember to enclose the Sub Query within parentheses.
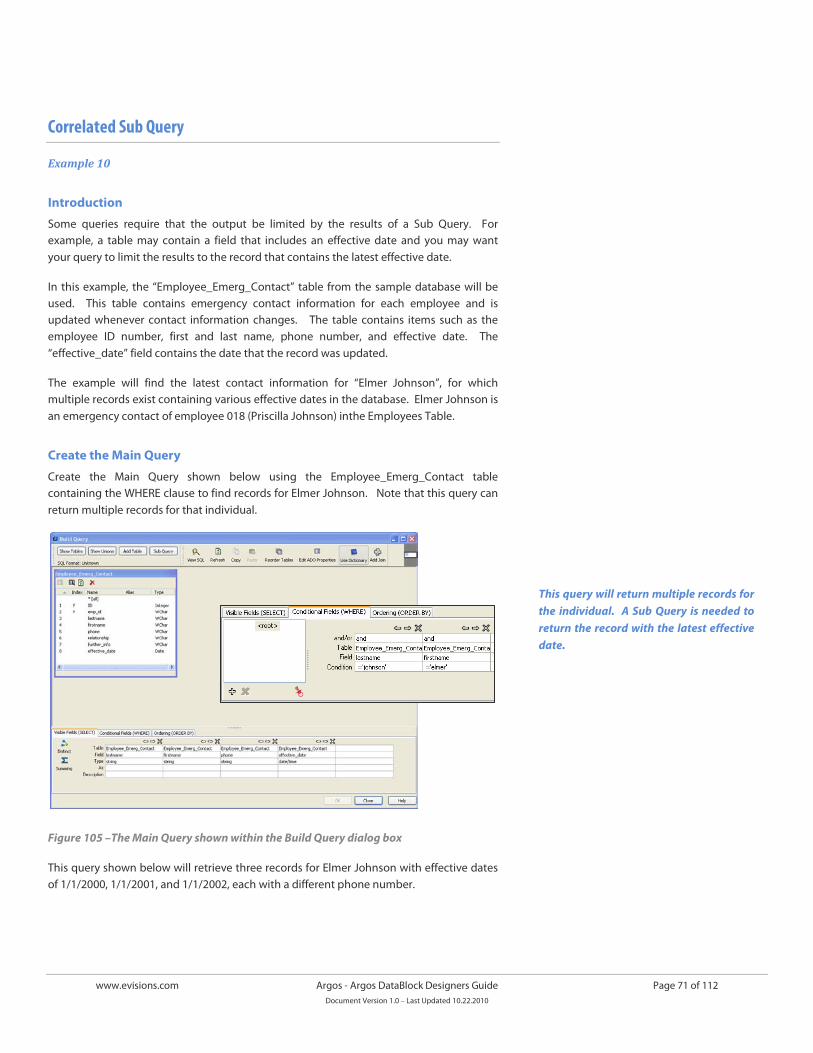
www.evisions.com Argos - Argos DataBlock Designers Guide Page 71 of 112 Document Version 1.0 – Last Updated 10.22.2010
Correlated Sub Query
Example 10
Introduction
Some queries require that the output be limited by the results of a Sub Query. For example, a table may contain a field that includes an effective date and you may want your query to limit the results to the record that contains the latest effective date.
In this example, the “Employee_Emerg_Contact” table from the sample database will be used. This table contains emergency contact information for each employee and is updated whenever contact information changes. The table contains items such as the employee ID number, first and last name, phone number, and effective date. The “effective_date” field contains the date that the record was updated.
The example will find the latest contact information for “Elmer Johnson”, for which multiple records exist containing various effective dates in the database. Elmer Johnson is an emergency contact of employee 018 (Priscilla Johnson) inthe Employees Table.
Create the Main Query
Create the Main Query shown below using the Employee_Emerg_Contact table containing the WHERE clause to find records for Elmer Johnson. Note that this query can return multiple records for that individual.
Figure 105 –The Main Query shown within the Build Query dialog box
This query shown below will retrieve three records for Elmer Johnson with effective dates of 1/1/2000, 1/1/2001, and 1/1/2002, each with a different phone number.
This query will return multiple records for the individual. A Sub Query is needed to return the record with the latest effective date.
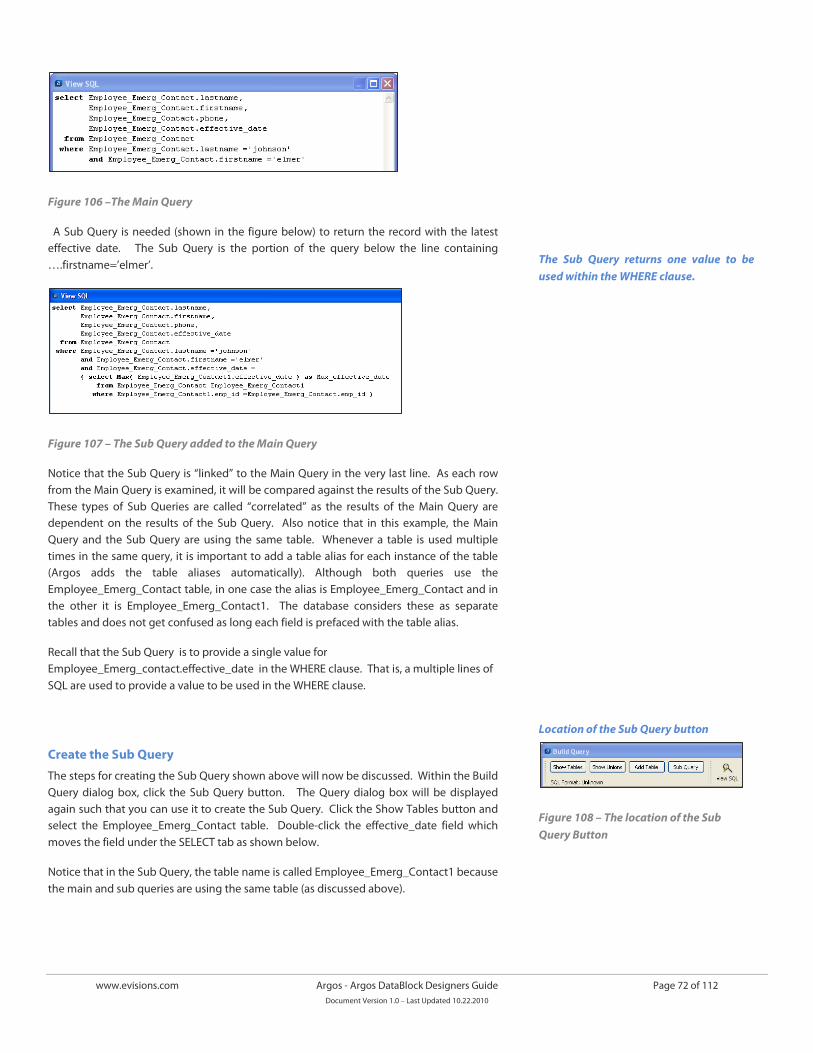
www.evisions.com Argos - Argos DataBlock Designers Guide Page 72 of 112 Document Version 1.0 – Last Updated 10.22.2010
Figure 106 –The Main Query
A Sub Query is needed (shown in the figure below) to return the record with the latest effective date. The Sub Query is the portion of the query below the line containing ….firstname=’elmer’.
Figure 107 – The Sub Query added to the Main Query
Notice that the Sub Query is “linked” to the Main Query in the very last line. As each row from the Main Query is examined, it will be compared against the results of the Sub Query. These types of Sub Queries are called “correlated” as the results of the Main Query are dependent on the results of the Sub Query. Also notice that in this example, the Main Query and the Sub Query are using the same table. Whenever a table is used multiple times in the same query, it is important to add a table alias for each instance of the table (Argos adds the table aliases automatically). Although both queries use the Employee_Emerg_Contact table, in one case the alias is Employee_Emerg_Contact and in the other it is Employee_Emerg_Contact1. The database considers these as separate tables and does not get confused as long each field is prefaced with the table alias.
Recall that the Sub Query is to provide a single value for Employee_Emerg_contact.effective_date in the WHERE clause. That is, a multiple lines of SQL are used to provide a value to be used in the WHERE clause.
Create the Sub Query
The steps for creating the Sub Query shown above will now be discussed. Within the Build Query dialog box, click the Sub Query button. The Query dialog box will be displayed again such that you can use it to create the Sub Query. Click the Show Tables button and select the Employee_Emerg_Contact table. Double-click the effective_date field which moves the field under the SELECT tab as shown below.
Notice that in the Sub Query, the table name is called Employee_Emerg_Contact1 because the main and sub queries are using the same table (as discussed above).
The Sub Query returns one value to be used within the WHERE clause.
Location of the Sub Query button
Figure 108 – The location of the Sub Query Button
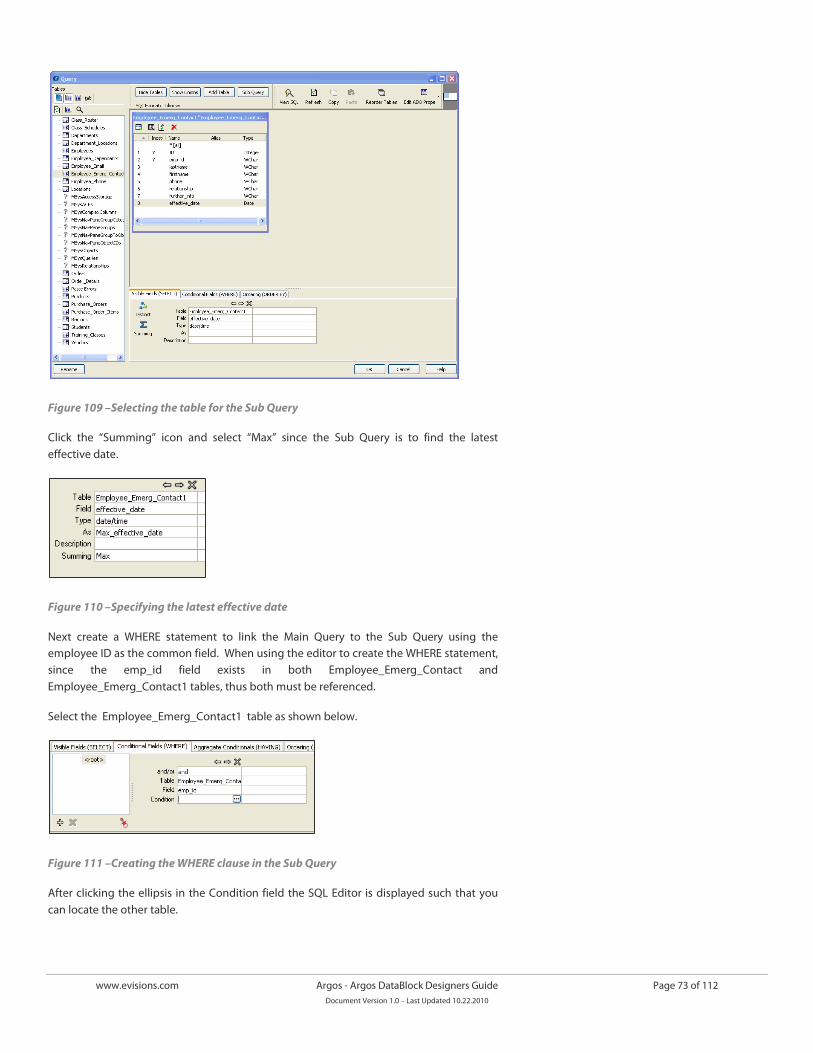
www.evisions.com Argos - Argos DataBlock Designers Guide Page 73 of 112 Document Version 1.0 – Last Updated 10.22.2010
Figure 109 –Selecting the table for the Sub Query
Click the “Summing” icon and select “Max” since the Sub Query is to find the latest effective date.
Figure 110 –Specifying the latest effective date
Next create a WHERE statement to link the Main Query to the Sub Query using the employee ID as the common field. When using the editor to create the WHERE statement, since the emp_id field exists in both Employee_Emerg_Contact and Employee_Emerg_Contact1 tables, thus both must be referenced.
Select the Employee_Emerg_Contact1 table as shown below.
Figure 111 –Creating the WHERE clause in the Sub Query
After clicking the ellipsis in the Condition field the SQL Editor is displayed such that you can locate the other table.
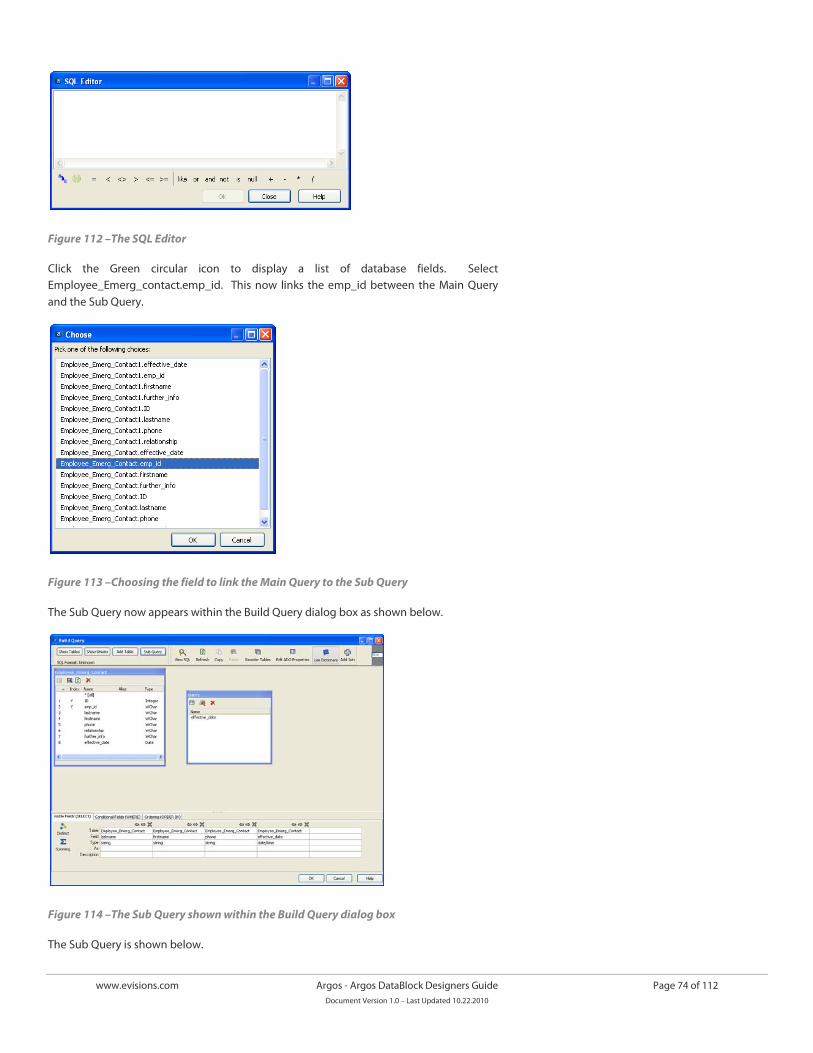
www.evisions.com Argos - Argos DataBlock Designers Guide Page 74 of 112 Document Version 1.0 – Last Updated 10.22.2010
Figure 112 –The SQL Editor
Click the Green circular icon to display a list of database fields. Select Employee_Emerg_contact.emp_id. This now links the emp_id between the Main Query and the Sub Query.
Figure 113 –Choosing the field to link the Main Query to the Sub Query
The Sub Query now appears within the Build Query dialog box as shown below.
Figure 114 –The Sub Query shown within the Build Query dialog box
The Sub Query is shown below.
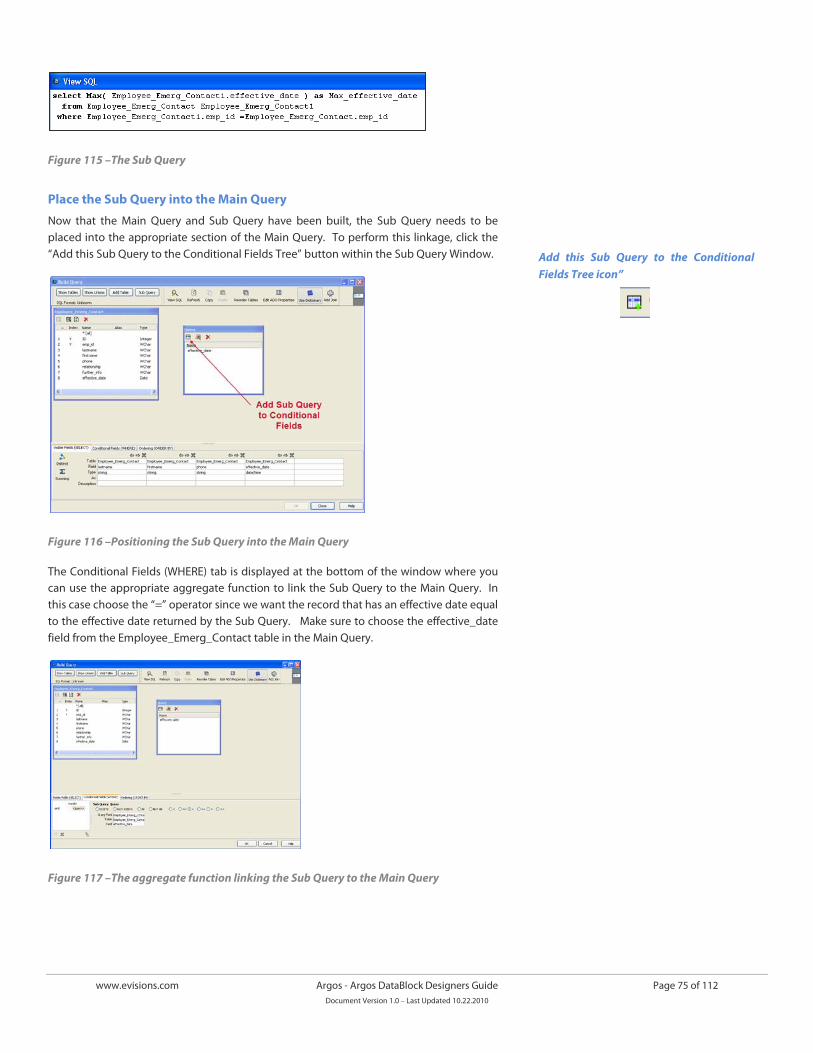
www.evisions.com Argos - Argos DataBlock Designers Guide Page 75 of 112 Document Version 1.0 – Last Updated 10.22.2010
Figure 115 –The Sub Query
Place the Sub Query into the Main Query
Now that the Main Query and Sub Query have been built, the Sub Query needs to be placed into the appropriate section of the Main Query. To perform this linkage, click the “Add this Sub Query to the Conditional Fields Tree” button within the Sub Query Window.
Figure 116 –Positioning the Sub Query into the Main Query
The Conditional Fields (WHERE) tab is displayed at the bottom of the window where you can use the appropriate aggregate function to link the Sub Query to the Main Query. In this case choose the “=” operator since we want the record that has an effective date equal to the effective date returned by the Sub Query. Make sure to choose the effective_date field from the Employee_Emerg_Contact table in the Main Query.
Figure 117 –The aggregate function linking the Sub Query to the Main Query
Add this Sub Query to the Conditional Fields Tree icon”
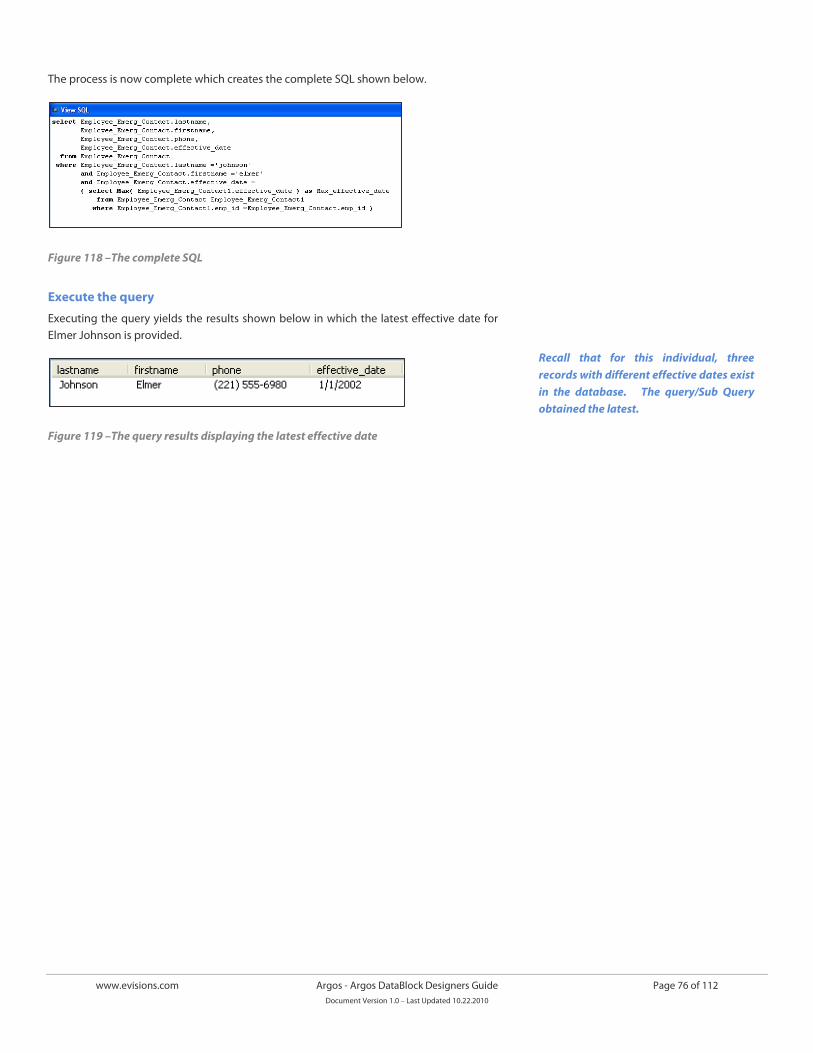
www.evisions.com Argos - Argos DataBlock Designers Guide Page 76 of 112 Document Version 1.0 – Last Updated 10.22.2010
The process is now complete which creates the complete SQL shown below.
Figure 118 –The complete SQL
Execute the query
Executing the query yields the results shown below in which the latest effective date for Elmer Johnson is provided.
Figure 119 –The query results displaying the latest effective date
Recall that for this individual, three records with different effective dates exist in the database. The query/Sub Query obtained the latest.
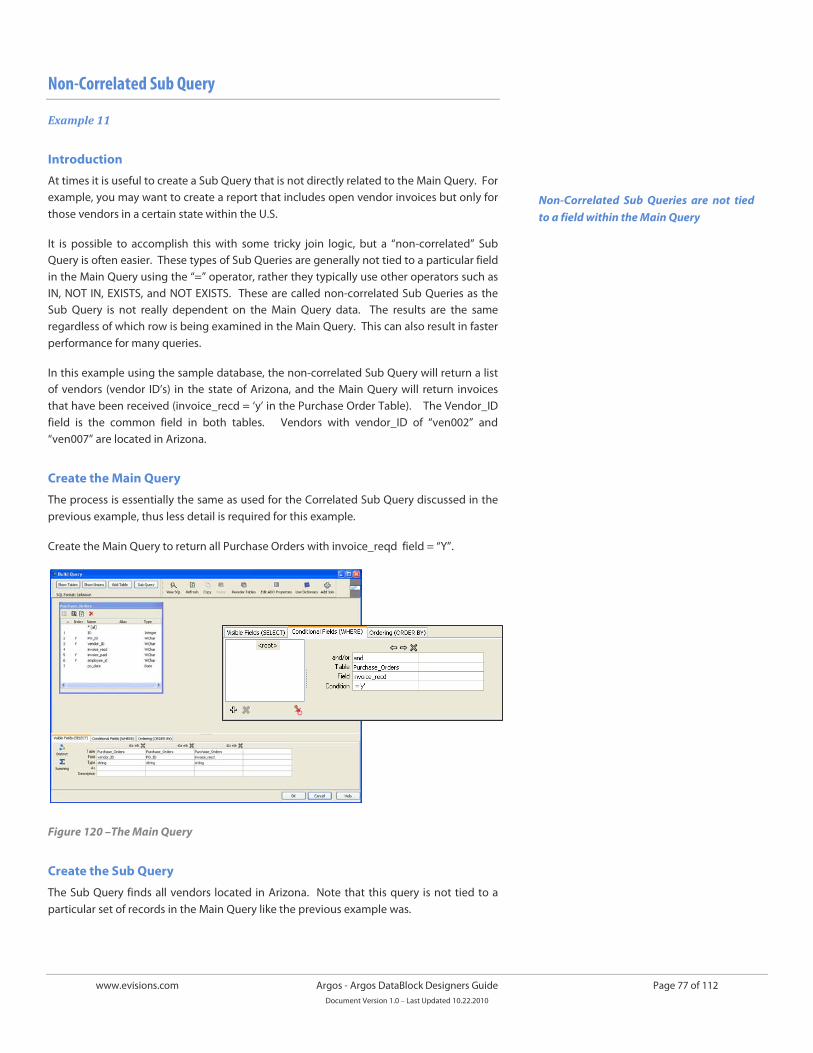
www.evisions.com Argos - Argos DataBlock Designers Guide Page 77 of 112 Document Version 1.0 – Last Updated 10.22.2010
Non-Correlated Sub Query
Example 11
Introduction
At times it is useful to create a Sub Query that is not directly related to the Main Query. For example, you may want to create a report that includes open vendor invoices but only for those vendors in a certain state within the U.S.
It is possible to accomplish this with some tricky join logic, but a “non-correlated” Sub Query is often easier. These types of Sub Queries are generally not tied to a particular field in the Main Query using the “=” operator, rather they typically use other operators such as IN, NOT IN, EXISTS, and NOT EXISTS. These are called non-correlated Sub Queries as the Sub Query is not really dependent on the Main Query data. The results are the same regardless of which row is being examined in the Main Query. This can also result in faster performance for many queries.
In this example using the sample database, the non-correlated Sub Query will return a list of vendors (vendor ID’s) in the state of Arizona, and the Main Query will return invoices that have been received (invoice_recd = ‘y’ in the Purchase Order Table). The Vendor_ID field is the common field in both tables. Vendors with vendor_ID of “ven002” and “ven007” are located in Arizona.
Create the Main Query
The process is essentially the same as used for the Correlated Sub Query discussed in the previous example, thus less detail is required for this example.
Create the Main Query to return all Purchase Orders with invoice_reqd field = “Y”.
Figure 120 –The Main Query
Create the Sub Query
The Sub Query finds all vendors located in Arizona. Note that this query is not tied to a particular set of records in the Main Query like the previous example was.
Non-Correlated Sub Queries are not tied to a field within the Main Query
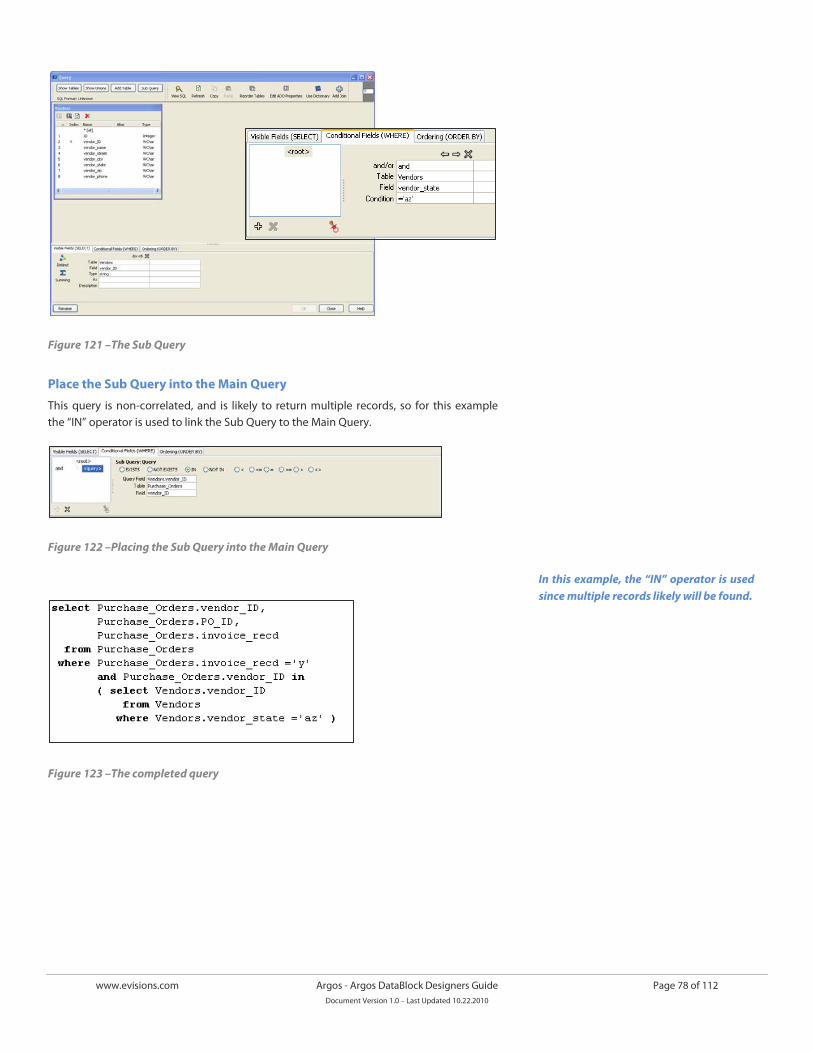
www.evisions.com Argos - Argos DataBlock Designers Guide Page 78 of 112 Document Version 1.0 – Last Updated 10.22.2010
Figure 121 –The Sub Query
Place the Sub Query into the Main Query
This query is non-correlated, and is likely to return multiple records, so for this example the “IN” operator is used to link the Sub Query to the Main Query.
Figure 122 –Placing the Sub Query into the Main Query
Figure 123 –The completed query
In this example, the “IN” operator is used since multiple records likely will be found.
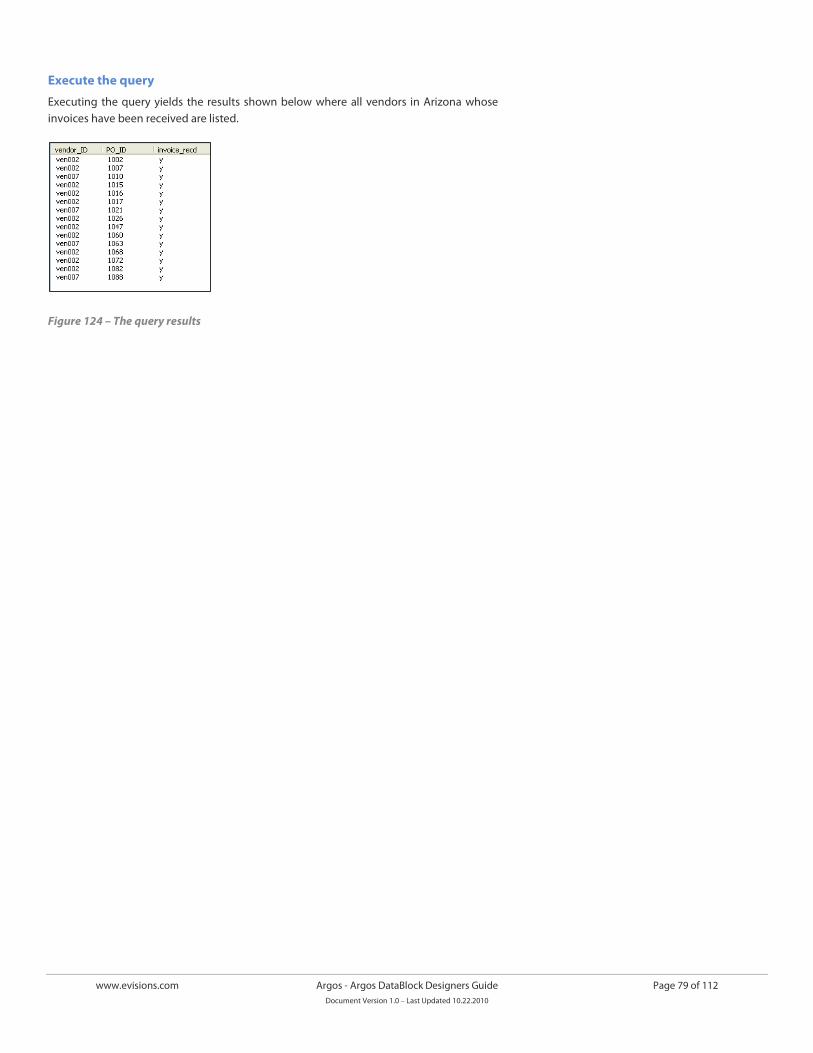
www.evisions.com Argos - Argos DataBlock Designers Guide Page 79 of 112 Document Version 1.0 – Last Updated 10.22.2010
Execute the query
Executing the query yields the results shown below where all vendors in Arizona whose invoices have been received are listed.
Figure 124 – The query results
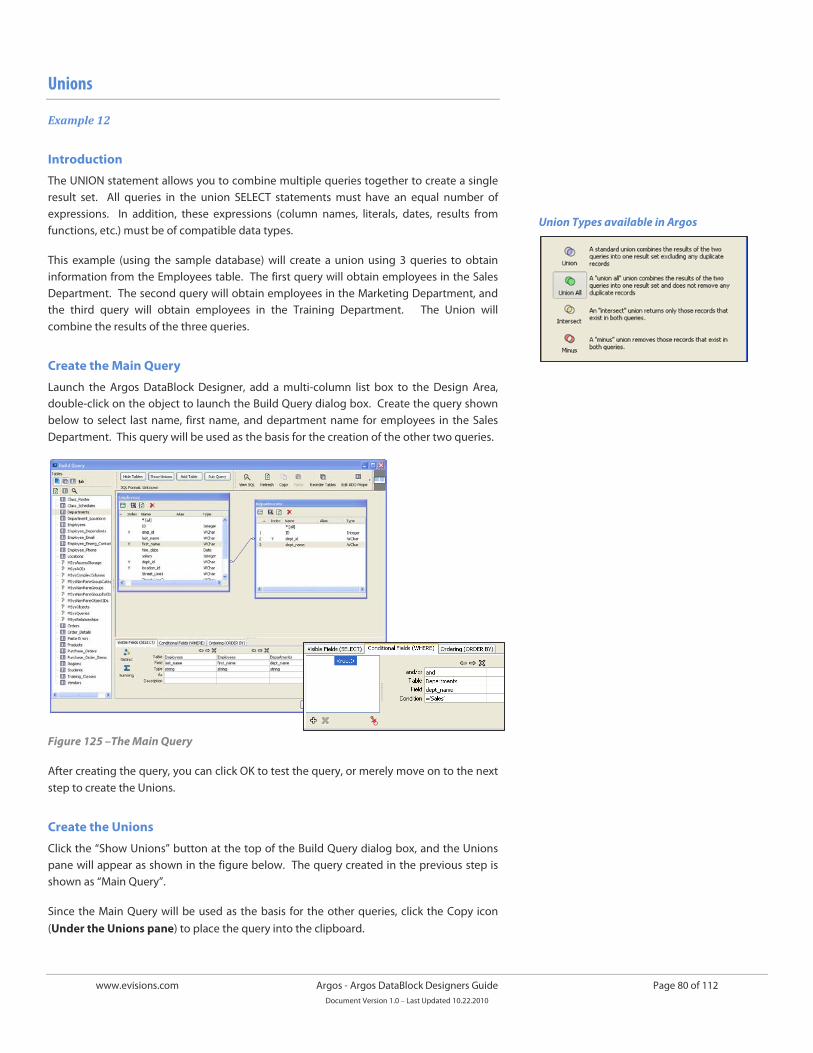
www.evisions.com Argos - Argos DataBlock Designers Guide Page 80 of 112 Document Version 1.0 – Last Updated 10.22.2010
Unions
Example 12
Introduction
The UNION statement allows you to combine multiple queries together to create a single result set. All queries in the union SELECT statements must have an equal number of expressions. In addition, these expressions (column names, literals, dates, results from functions, etc.) must be of compatible data types.
This example (using the sample database) will create a union using 3 queries to obtain information from the Employees table. The first query will obtain employees in the Sales Department. The second query will obtain employees in the Marketing Department, and the third query will obtain employees in the Training Department. The Union will combine the results of the three queries.
Create the Main Query
Launch the Argos DataBlock Designer, add a multi-column list box to the Design Area, double-click on the object to launch the Build Query dialog box. Create the query shown below to select last name, first name, and department name for employees in the Sales Department. This query will be used as the basis for the creation of the other two queries.
Figure 125 –The Main Query
After creating the query, you can click OK to test the query, or merely move on to the next step to create the Unions.
Create the Unions
Click the “Show Unions” button at the top of the Build Query dialog box, and the Unions pane will appear as shown in the figure below. The query created in the previous step is shown as “Main Query”.
Since the Main Query will be used as the basis for the other queries, click the Copy icon (Under the Unions pane) to place the query into the clipboard.
Union Types available in Argos
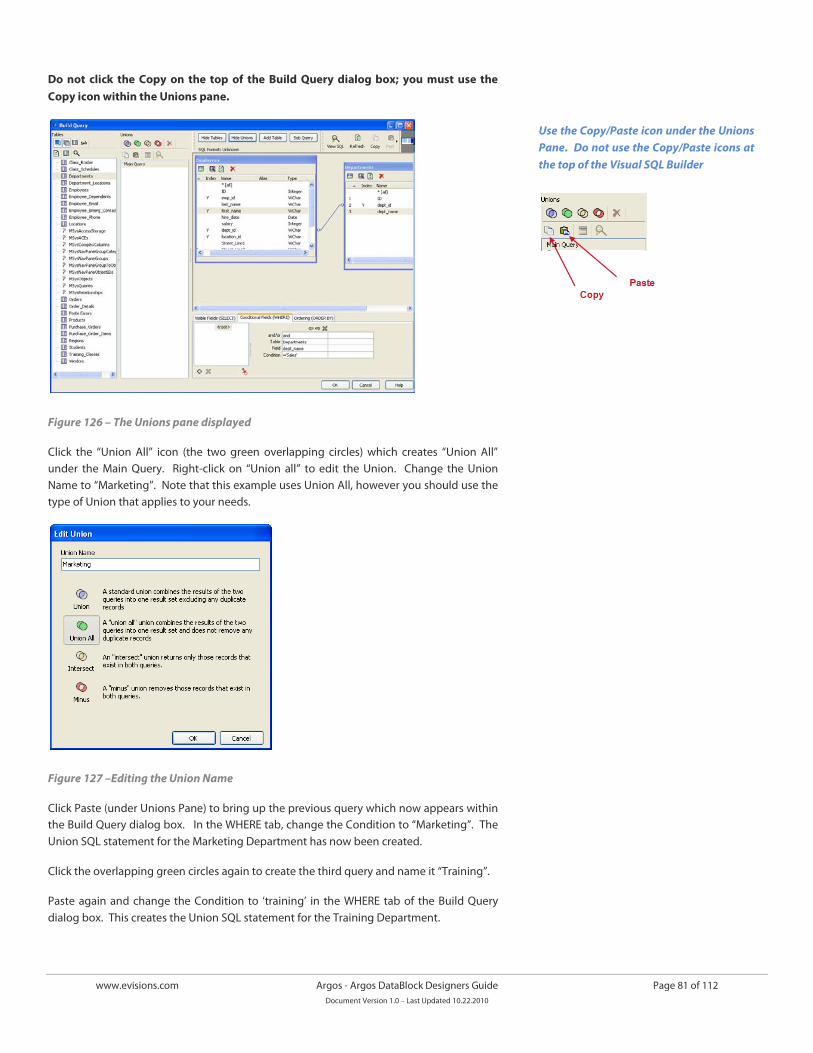
www.evisions.com Argos - Argos DataBlock Designers Guide Page 81 of 112 Document Version 1.0 – Last Updated 10.22.2010
Do not click the Copy on the top of the Build Query dialog box; you must use the Copy icon within the Unions pane.
Figure 126 – The Unions pane displayed
Click the “Union All” icon (the two green overlapping circles) which creates “Union All” under the Main Query. Right-click on “Union all” to edit the Union. Change the Union Name to “Marketing”. Note that this example uses Union All, however you should use the type of Union that applies to your needs.
Figure 127 –Editing the Union Name
Click Paste (under Unions Pane) to bring up the previous query which now appears within the Build Query dialog box. In the WHERE tab, change the Condition to “Marketing”. The Union SQL statement for the Marketing Department has now been created.
Click the overlapping green circles again to create the third query and name it “Training”.
Paste again and change the Condition to ‘training’ in the WHERE tab of the Build Query dialog box. This creates the Union SQL statement for the Training Department.
Use the Copy/Paste icon under the Unions Pane. Do not use the Copy/Paste icons at the top of the Visual SQL Builder
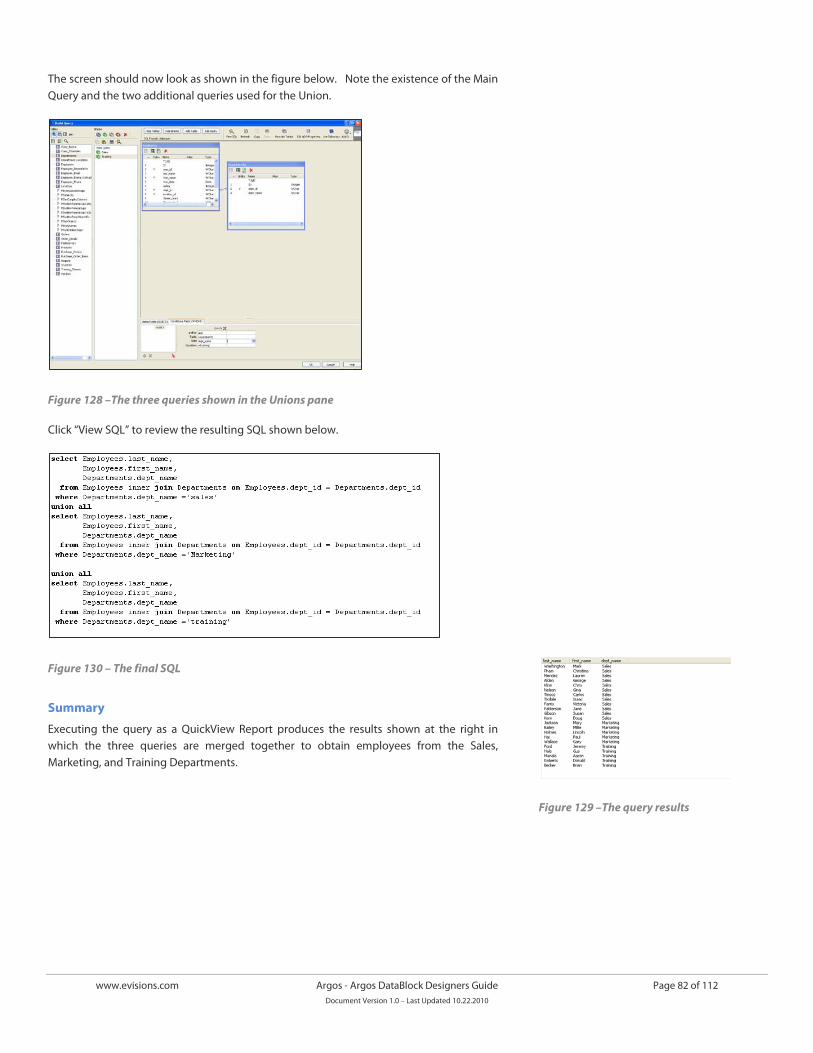
www.evisions.com Argos - Argos DataBlock Designers Guide Page 82 of 112 Document Version 1.0 – Last Updated 10.22.2010
The screen should now look as shown in the figure below. Note the existence of the Main Query and the two additional queries used for the Union.
Figure 128 –The three queries shown in the Unions pane
Click “View SQL” to review the resulting SQL shown below.
Figure 130 – The final SQL
Summary
Executing the query as a QuickView Report produces the results shown at the right in which the three queries are merged together to obtain employees from the Sales, Marketing, and Training Departments.
Figure 129 –The query results
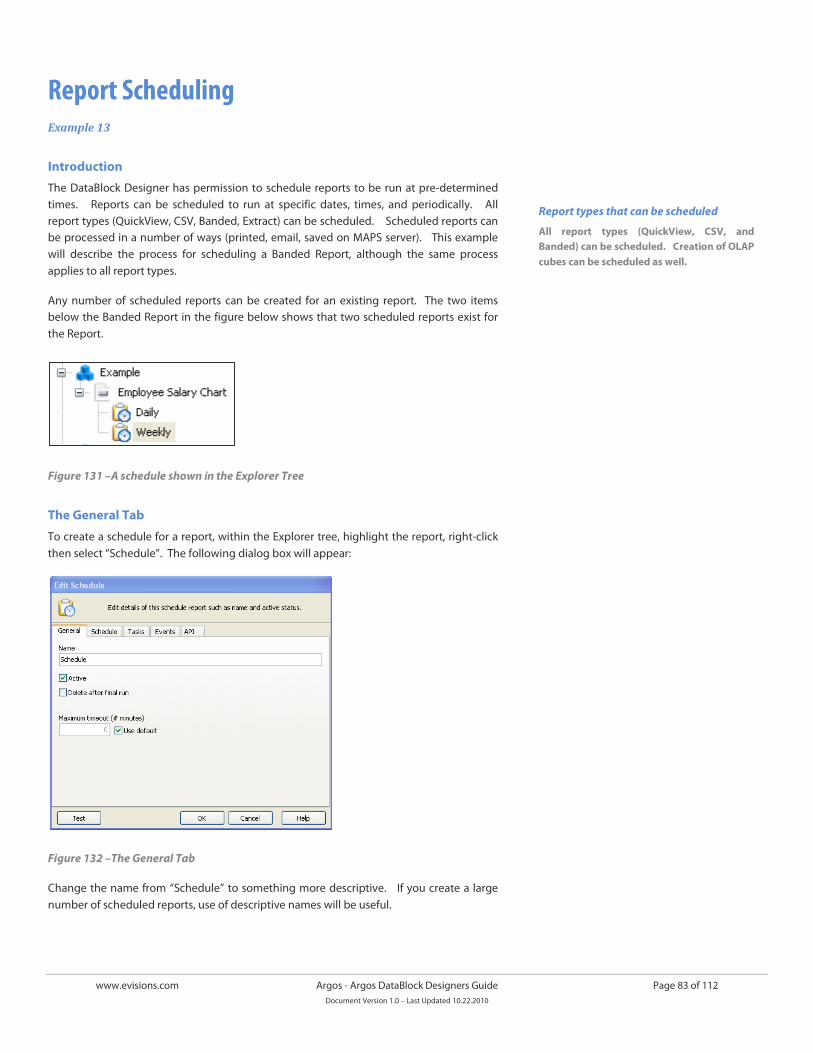
www.evisions.com Argos - Argos DataBlock Designers Guide Page 83 of 112 Document Version 1.0 – Last Updated 10.22.2010
Report Scheduling Example 13
Introduction
The DataBlock Designer has permission to schedule reports to be run at pre-determined times. Reports can be scheduled to run at specific dates, times, and periodically. All report types (QuickView, CSV, Banded, Extract) can be scheduled. Scheduled reports can be processed in a number of ways (printed, email, saved on MAPS server). This example will describe the process for scheduling a Banded Report, although the same process applies to all report types.
Any number of scheduled reports can be created for an existing report. The two items below the Banded Report in the figure below shows that two scheduled reports exist for the Report.
Figure 131 –A schedule shown in the Explorer Tree
The General Tab
To create a schedule for a report, within the Explorer tree, highlight the report, right-click then select “Schedule”. The following dialog box will appear:
Figure 132 –The General Tab
Change the name from “Schedule” to something more descriptive. If you create a large number of scheduled reports, use of descriptive names will be useful.
Report types that can be scheduled
All report types (QuickView, CSV, and Banded) can be scheduled. Creation of OLAP cubes can be scheduled as well.
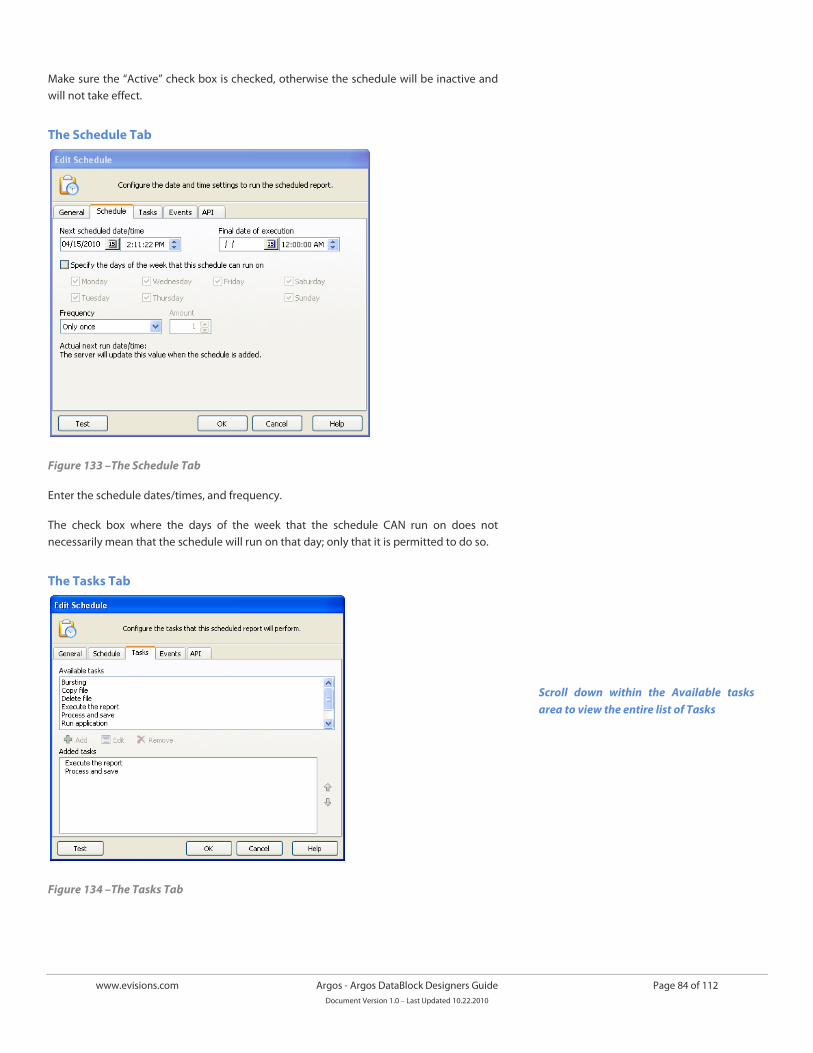
www.evisions.com Argos - Argos DataBlock Designers Guide Page 84 of 112 Document Version 1.0 – Last Updated 10.22.2010
Make sure the “Active” check box is checked, otherwise the schedule will be inactive and will not take effect.
The Schedule Tab
Figure 133 –The Schedule Tab
Enter the schedule dates/times, and frequency.
The check box where the days of the week that the schedule CAN run on does not necessarily mean that the schedule will run on that day; only that it is permitted to do so.
The Tasks Tab
Figure 134 –The Tasks Tab
Scroll down within the Available tasks area to view the entire list of Tasks
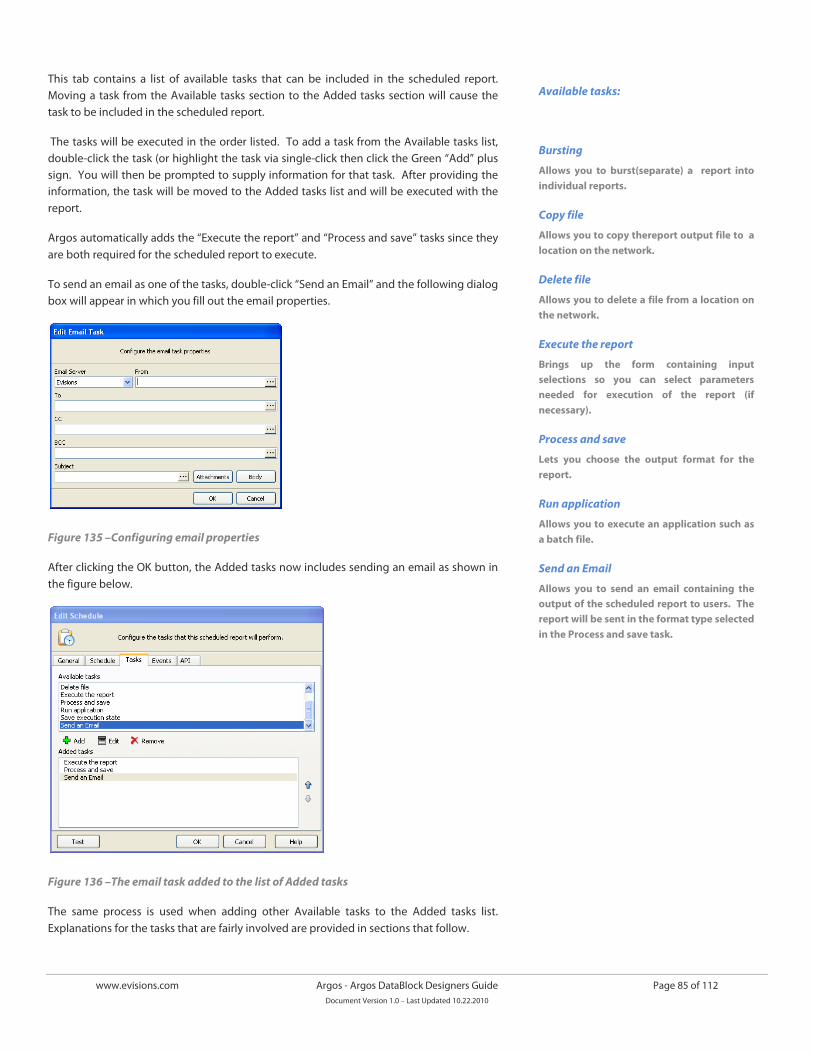
www.evisions.com Argos - Argos DataBlock Designers Guide Page 85 of 112 Document Version 1.0 – Last Updated 10.22.2010
This tab contains a list of available tasks that can be included in the scheduled report. Moving a task from the Available tasks section to the Added tasks section will cause the task to be included in the scheduled report.
The tasks will be executed in the order listed. To add a task from the Available tasks list, double-click the task (or highlight the task via single-click then click the Green “Add” plus sign. You will then be prompted to supply information for that task. After providing the information, the task will be moved to the Added tasks list and will be executed with the report.
Argos automatically adds the “Execute the report” and “Process and save” tasks since they are both required for the scheduled report to execute.
To send an email as one of the tasks, double-click “Send an Email” and the following dialog box will appear in which you fill out the email properties.
Figure 135 –Configuring email properties
After clicking the OK button, the Added tasks now includes sending an email as shown in the figure below.
Figure 136 –The email task added to the list of Added tasks
The same process is used when adding other Available tasks to the Added tasks list. Explanations for the tasks that are fairly involved are provided in sections that follow.
Available tasks:
Bursting
Allows you to burst(separate) a report into individual reports.
Copy file
Allows you to copy thereport output file to a location on the network.
Delete file
Allows you to delete a file from a location on the network.
Execute the report
Brings up the form containing input selections so you can select parameters needed for execution of the report (if necessary).
Process and save
Lets you choose the output format for the report.
Run application
Allows you to execute an application such as a batch file.
Send an Email
Allows you to send an email containing the output of the scheduled report to users. The report will be sent in the format type selected in the Process and save task.
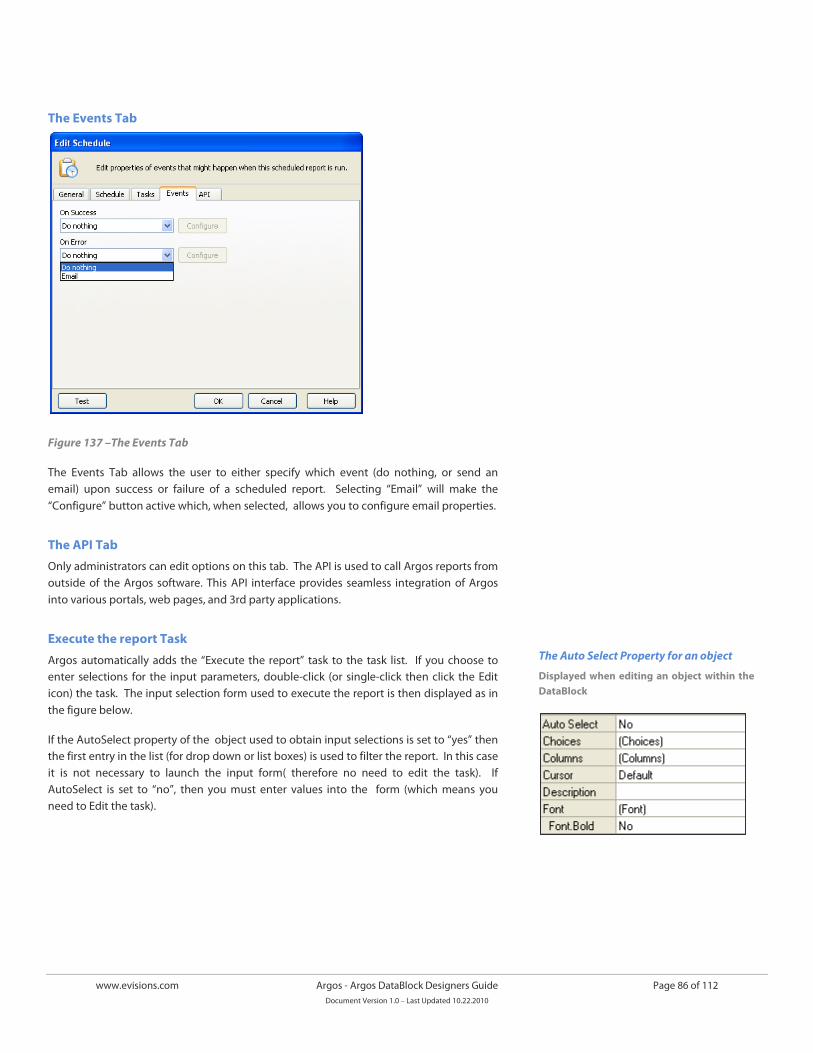
www.evisions.com Argos - Argos DataBlock Designers Guide Page 86 of 112 Document Version 1.0 – Last Updated 10.22.2010
The Events Tab
Figure 137 –The Events Tab
The Events Tab allows the user to either specify which event (do nothing, or send an email) upon success or failure of a scheduled report. Selecting “Email” will make the “Configure” button active which, when selected, allows you to configure email properties.
The API Tab
Only administrators can edit options on this tab. The API is used to call Argos reports from outside of the Argos software. This API interface provides seamless integration of Argos into various portals, web pages, and 3rd party applications.
Execute the report Task
Argos automatically adds the “Execute the report” task to the task list. If you choose to enter selections for the input parameters, double-click (or single-click then click the Edit icon) the task. The input selection form used to execute the report is then displayed as in the figure below.
If the AutoSelect property of the object used to obtain input selections is set to “yes” then the first entry in the list (for drop down or list boxes) is used to filter the report. In this case it is not necessary to launch the input form( therefore no need to edit the task). If AutoSelect is set to “no”, then you must enter values into the form (which means you need to Edit the task).
The Auto Select Property for an object
Displayed when editing an object within the DataBlock
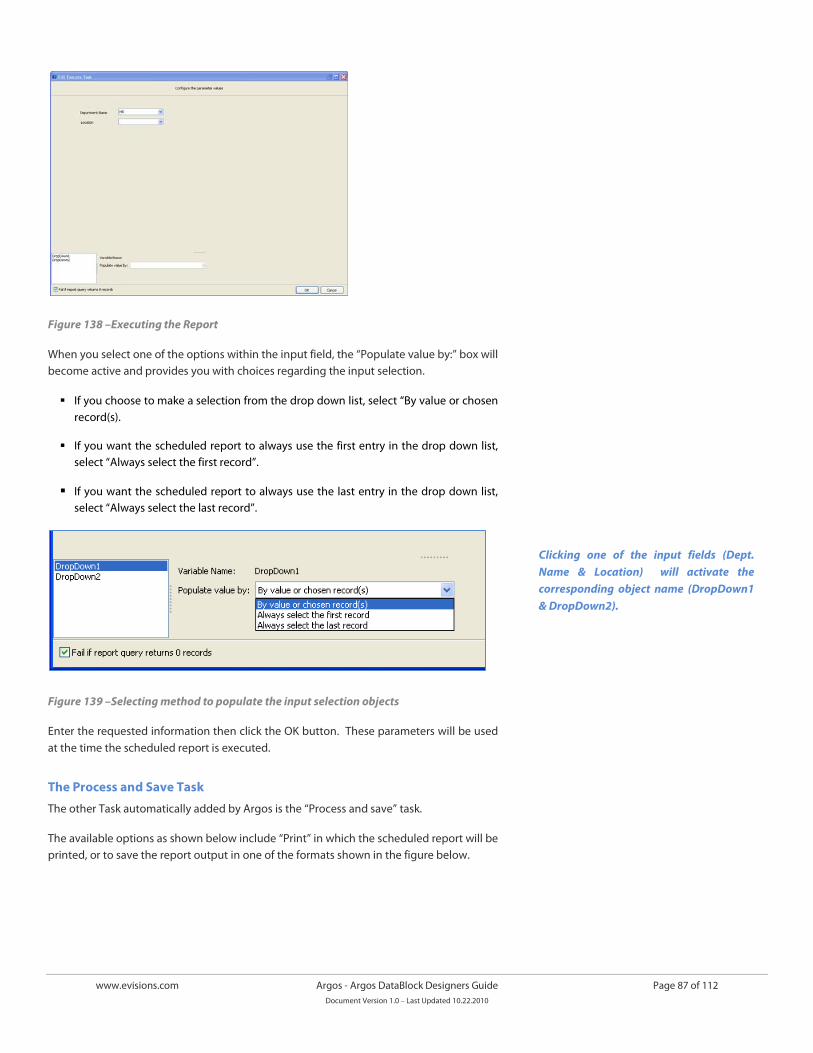
www.evisions.com Argos - Argos DataBlock Designers Guide Page 87 of 112 Document Version 1.0 – Last Updated 10.22.2010
Figure 138 –Executing the Report
When you select one of the options within the input field, the “Populate value by:” box will become active and provides you with choices regarding the input selection.
If you choose to make a selection from the drop down list, select “By value or chosen record(s).
If you want the scheduled report to always use the first entry in the drop down list, select “Always select the first record”.
If you want the scheduled report to always use the last entry in the drop down list, select “Always select the last record”.
Figure 139 –Selecting method to populate the input selection objects
Enter the requested information then click the OK button. These parameters will be used at the time the scheduled report is executed.
The Process and Save Task
The other Task automatically added by Argos is the “Process and save” task.
The available options as shown below include “Print” in which the scheduled report will be printed, or to save the report output in one of the formats shown in the figure below.
Clicking one of the input fields (Dept. Name & Location) will activate the corresponding object name (DropDown1 & DropDown2).
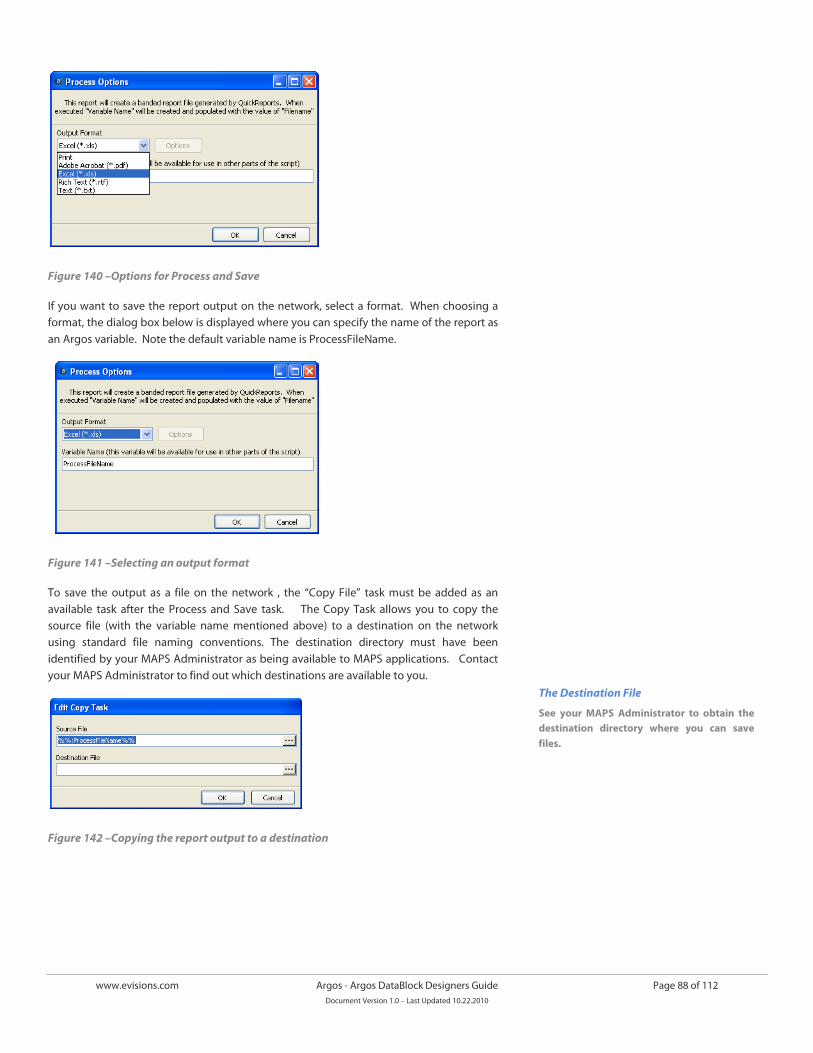
www.evisions.com Argos - Argos DataBlock Designers Guide Page 88 of 112 Document Version 1.0 – Last Updated 10.22.2010
Figure 140 –Options for Process and Save
If you want to save the report output on the network, select a format. When choosing a format, the dialog box below is displayed where you can specify the name of the report as an Argos variable. Note the default variable name is ProcessFileName.
Figure 141 –Selecting an output format
To save the output as a file on the network , the “Copy File” task must be added as an available task after the Process and Save task. The Copy Task allows you to copy the source file (with the variable name mentioned above) to a destination on the network using standard file naming conventions. The destination directory must have been identified by your MAPS Administrator as being available to MAPS applications. Contact your MAPS Administrator to find out which destinations are available to you.
Figure 142 –Copying the report output to a destination
The Destination File
See your MAPS Administrator to obtain the destination directory where you can save files.
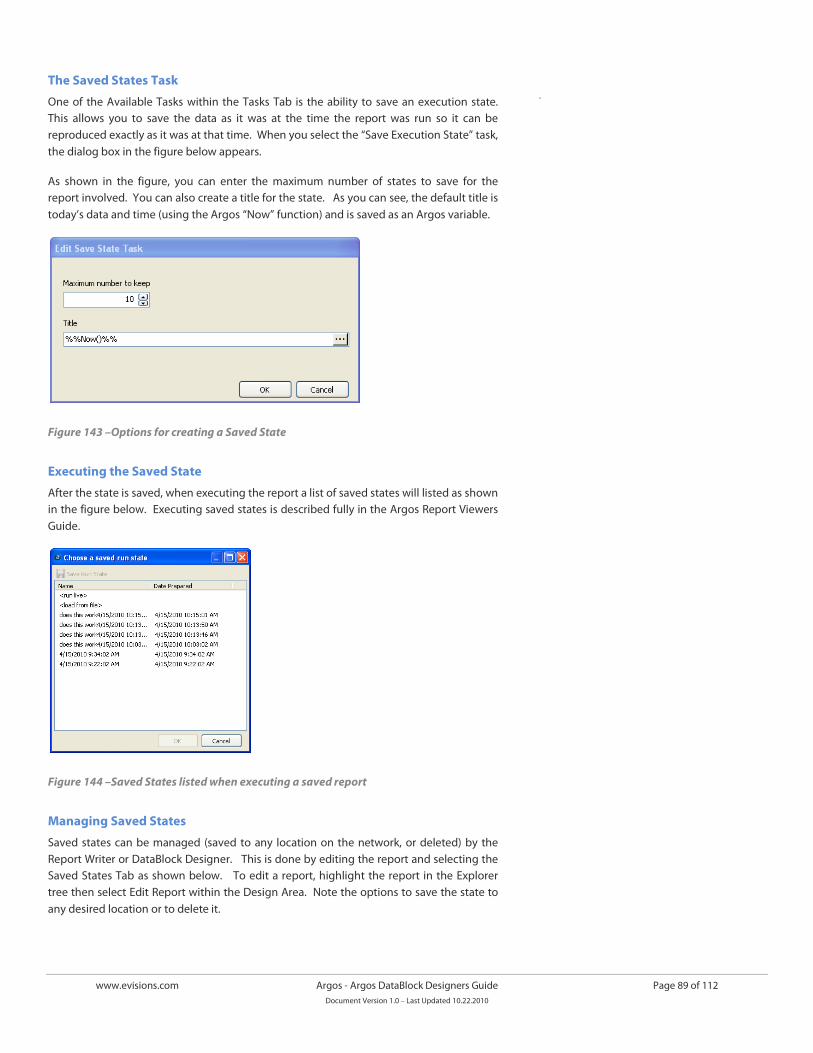
www.evisions.com Argos - Argos DataBlock Designers Guide Page 89 of 112 Document Version 1.0 – Last Updated 10.22.2010
The Saved States Task
One of the Available Tasks within the Tasks Tab is the ability to save an execution state. This allows you to save the data as it was at the time the report was run so it can be reproduced exactly as it was at that time. When you select the “Save Execution State” task, the dialog box in the figure below appears.
As shown in the figure, you can enter the maximum number of states to save for the report involved. You can also create a title for the state. As you can see, the default title is today’s data and time (using the Argos “Now” function) and is saved as an Argos variable.
Figure 143 –Options for creating a Saved State
Executing the Saved State
After the state is saved, when executing the report a list of saved states will listed as shown in the figure below. Executing saved states is described fully in the Argos Report Viewers Guide.
Figure 144 –Saved States listed when executing a saved report
Managing Saved States
Saved states can be managed (saved to any location on the network, or deleted) by the Report Writer or DataBlock Designer. This is done by editing the report and selecting the Saved States Tab as shown below. To edit a report, highlight the report in the Explorer tree then select Edit Report within the Design Area. Note the options to save the state to any desired location or to delete it.
.
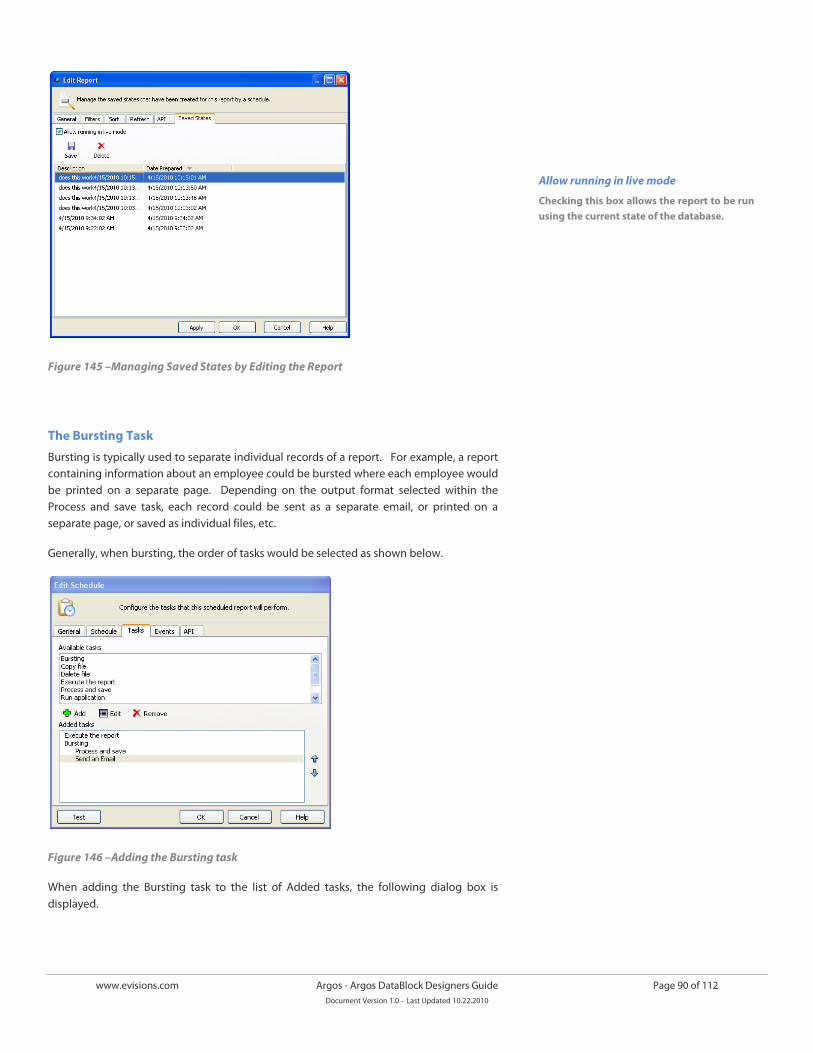
www.evisions.com Argos - Argos DataBlock Designers Guide Page 90 of 112 Document Version 1.0 – Last Updated 10.22.2010
Figure 145 –Managing Saved States by Editing the Report
The Bursting Task
Bursting is typically used to separate individual records of a report. For example, a report containing information about an employee could be bursted where each employee would be printed on a separate page. Depending on the output format selected within the Process and save task, each record could be sent as a separate email, or printed on a separate page, or saved as individual files, etc.
Generally, when bursting, the order of tasks would be selected as shown below.
Figure 146 –Adding the Bursting task
When adding the Bursting task to the list of Added tasks, the following dialog box is displayed.
Allow running in live mode
Checking this box allows the report to be run using the current state of the database.
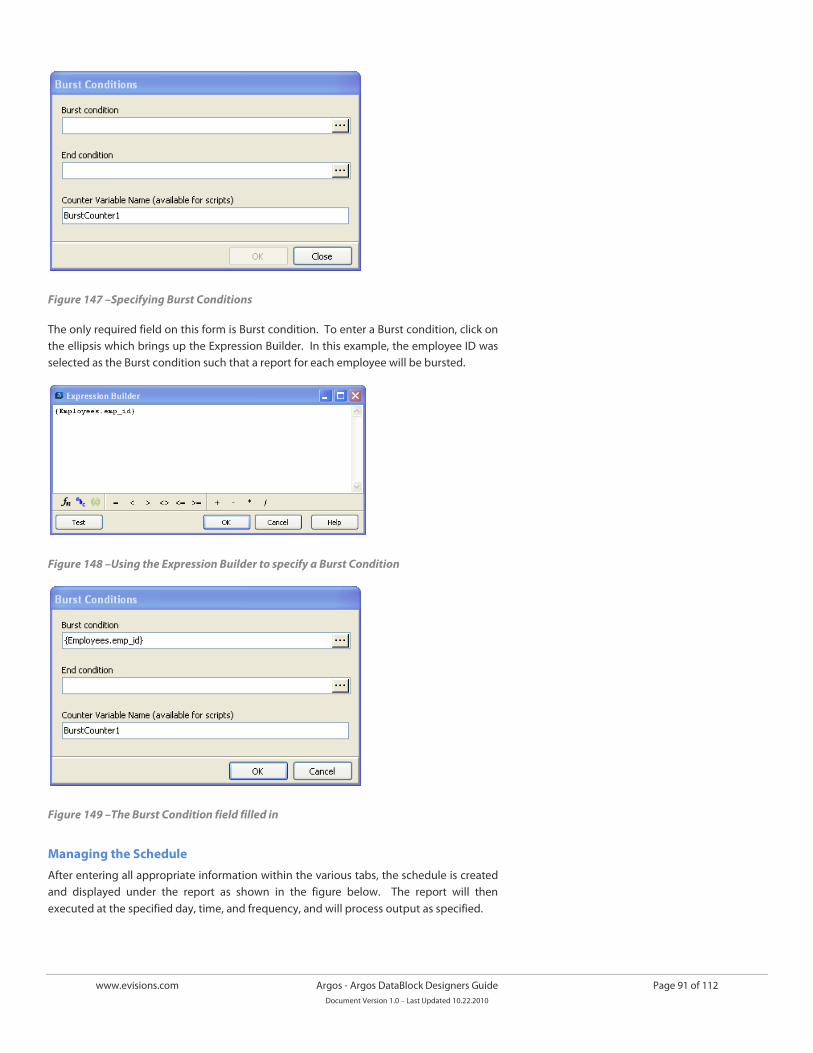
www.evisions.com Argos - Argos DataBlock Designers Guide Page 91 of 112 Document Version 1.0 – Last Updated 10.22.2010
Figure 147 –Specifying Burst Conditions
The only required field on this form is Burst condition. To enter a Burst condition, click on the ellipsis which brings up the Expression Builder. In this example, the employee ID was selected as the Burst condition such that a report for each employee will be bursted.
Figure 148 –Using the Expression Builder to specify a Burst Condition
Figure 149 –The Burst Condition field filled in
Managing the Schedule
After entering all appropriate information within the various tabs, the schedule is created and displayed under the report as shown in the figure below. The report will then executed at the specified day, time, and frequency, and will process output as specified.
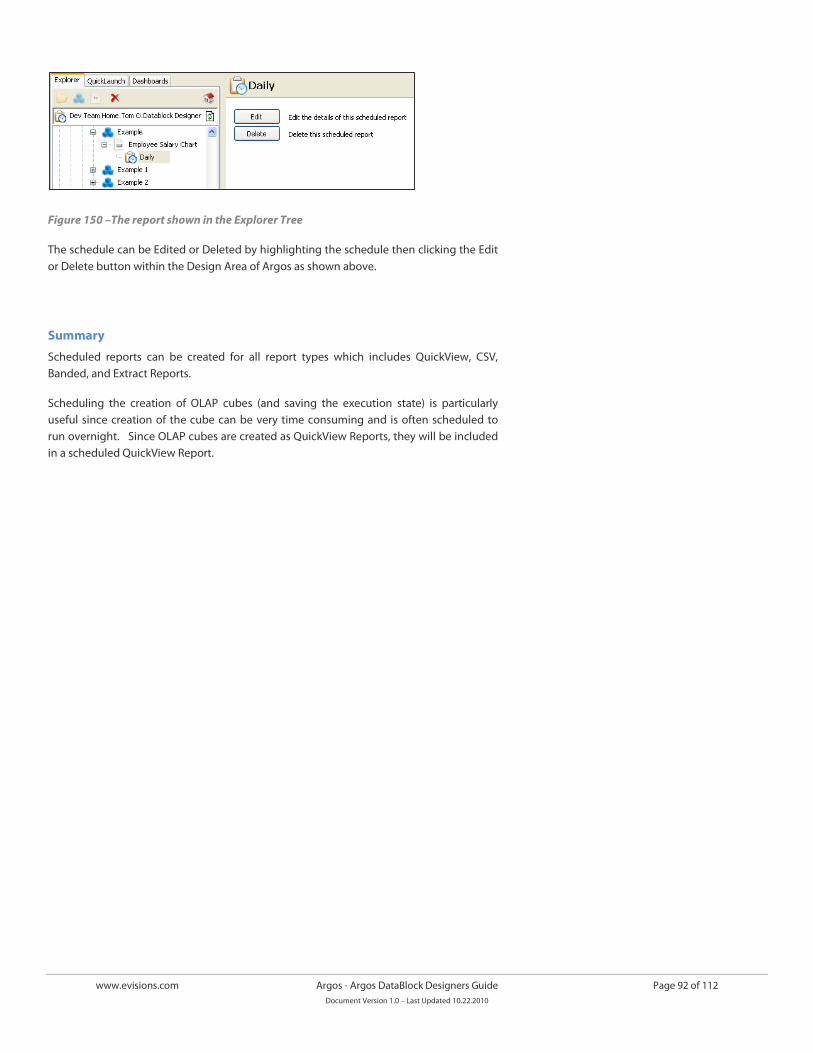
www.evisions.com Argos - Argos DataBlock Designers Guide Page 92 of 112 Document Version 1.0 – Last Updated 10.22.2010
Figure 150 –The report shown in the Explorer Tree
The schedule can be Edited or Deleted by highlighting the schedule then clicking the Edit or Delete button within the Design Area of Argos as shown above.
Summary
Scheduled reports can be created for all report types which includes QuickView, CSV, Banded, and Extract Reports.
Scheduling the creation of OLAP cubes (and saving the execution state) is particularly useful since creation of the cube can be very time consuming and is often scheduled to run overnight. Since OLAP cubes are created as QuickView Reports, they will be included in a scheduled QuickView Report.
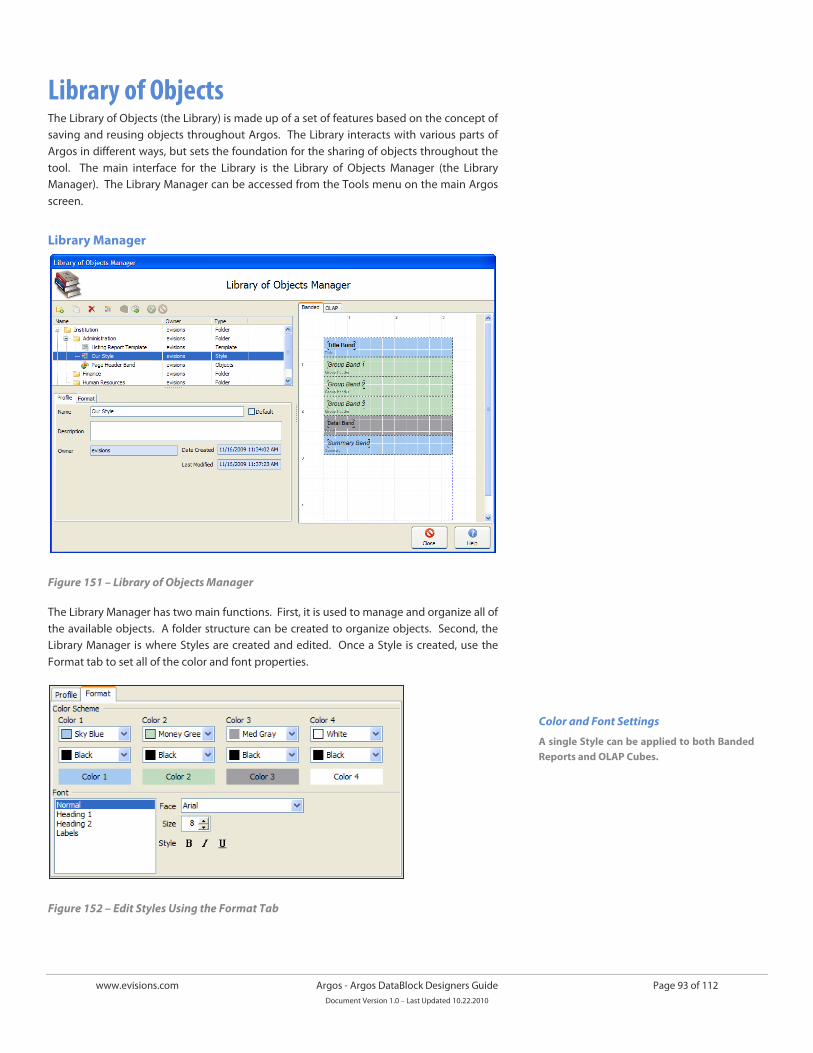
www.evisions.com Argos - Argos DataBlock Designers Guide Page 93 of 112 Document Version 1.0 – Last Updated 10.22.2010
Library of Objects The Library of Objects (the Library) is made up of a set of features based on the concept of saving and reusing objects throughout Argos. The Library interacts with various parts of Argos in different ways, but sets the foundation for the sharing of objects throughout the tool. The main interface for the Library is the Library of Objects Manager (the Library Manager). The Library Manager can be accessed from the Tools menu on the main Argos screen.
Library Manager
Figure 151 – Library of Objects Manager
The Library Manager has two main functions. First, it is used to manage and organize all of the available objects. A folder structure can be created to organize objects. Second, the Library Manager is where Styles are created and edited. Once a Style is created, use the Format tab to set all of the color and font properties.
Figure 152 – Edit Styles Using the Format Tab
Color and Font Settings
A single Style can be applied to both Banded Reports and OLAP Cubes.
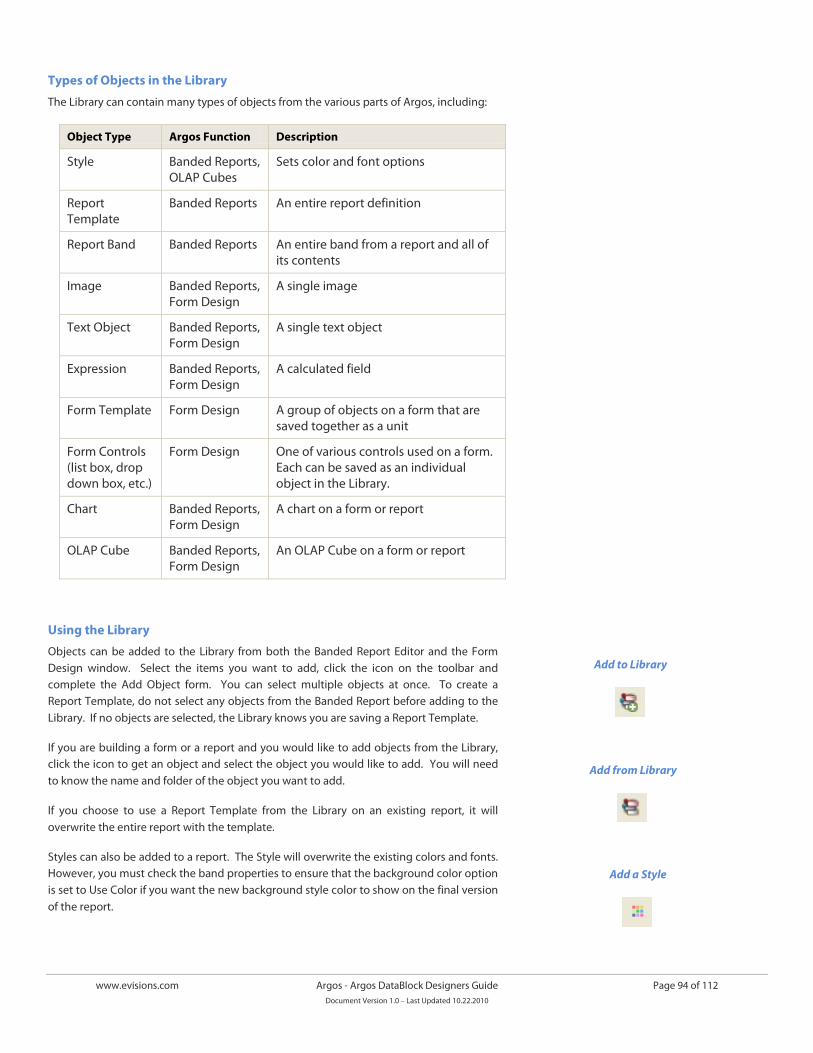
www.evisions.com Argos - Argos DataBlock Designers Guide Page 94 of 112 Document Version 1.0 – Last Updated 10.22.2010
Types of Objects in the Library
The Library can contain many types of objects from the various parts of Argos, including:
Object Type Argos Function Description
Style Banded Reports, OLAP Cubes
Sets color and font options
Report Template
Banded Reports An entire report definition
Report Band Banded Reports An entire band from a report and all of its contents
Image Banded Reports, Form Design
A single image
Text Object Banded Reports, Form Design
A single text object
Expression Banded Reports, Form Design
A calculated field
Form Template Form Design A group of objects on a form that are saved together as a unit
Form Controls (list box, drop down box, etc.)
Form Design One of various controls used on a form. Each can be saved as an individual object in the Library.
Chart Banded Reports, Form Design
A chart on a form or report
OLAP Cube Banded Reports, Form Design
An OLAP Cube on a form or report
Using the Library
Objects can be added to the Library from both the Banded Report Editor and the Form Design window. Select the items you want to add, click the icon on the toolbar and complete the Add Object form. You can select multiple objects at once. To create a Report Template, do not select any objects from the Banded Report before adding to the Library. If no objects are selected, the Library knows you are saving a Report Template.
If you are building a form or a report and you would like to add objects from the Library, click the icon to get an object and select the object you would like to add. You will need to know the name and folder of the object you want to add.
If you choose to use a Report Template from the Library on an existing report, it will overwrite the entire report with the template.
Styles can also be added to a report. The Style will overwrite the existing colors and fonts. However, you must check the band properties to ensure that the background color option is set to Use Color if you want the new background style color to show on the final version of the report.
Add to Library
Add from Library
Add a Style
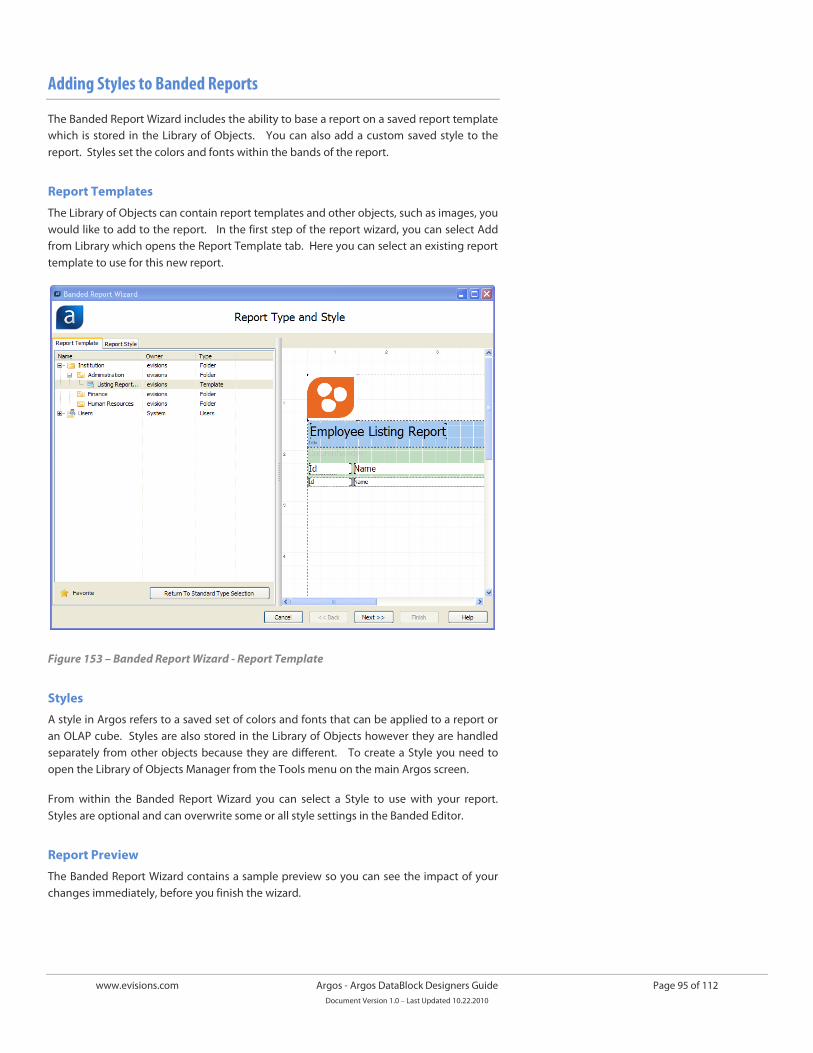
www.evisions.com Argos - Argos DataBlock Designers Guide Page 95 of 112 Document Version 1.0 – Last Updated 10.22.2010
Adding Styles to Banded Reports
The Banded Report Wizard includes the ability to base a report on a saved report template which is stored in the Library of Objects. You can also add a custom saved style to the report. Styles set the colors and fonts within the bands of the report.
Report Templates
The Library of Objects can contain report templates and other objects, such as images, you would like to add to the report. In the first step of the report wizard, you can select Add from Library which opens the Report Template tab. Here you can select an existing report template to use for this new report.
Figure 153 – Banded Report Wizard - Report Template
Styles
A style in Argos refers to a saved set of colors and fonts that can be applied to a report or an OLAP cube. Styles are also stored in the Library of Objects however they are handled separately from other objects because they are different. To create a Style you need to open the Library of Objects Manager from the Tools menu on the main Argos screen.
From within the Banded Report Wizard you can select a Style to use with your report. Styles are optional and can overwrite some or all style settings in the Banded Editor.
Report Preview
The Banded Report Wizard contains a sample preview so you can see the impact of your changes immediately, before you finish the wizard.
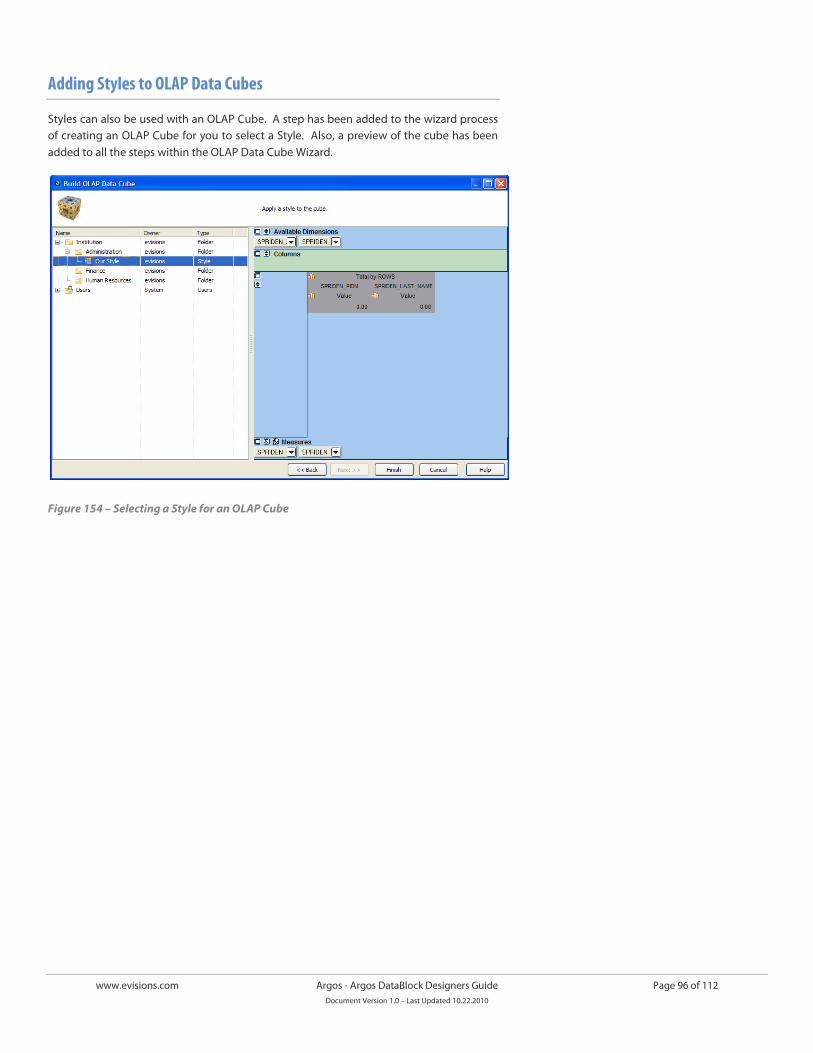
www.evisions.com Argos - Argos DataBlock Designers Guide Page 96 of 112 Document Version 1.0 – Last Updated 10.22.2010
Adding Styles to OLAP Data Cubes
Styles can also be used with an OLAP Cube. A step has been added to the wizard process of creating an OLAP Cube for you to select a Style. Also, a preview of the cube has been added to all the steps within the OLAP Data Cube Wizard.
Figure 154 – Selecting a Style for an OLAP Cube
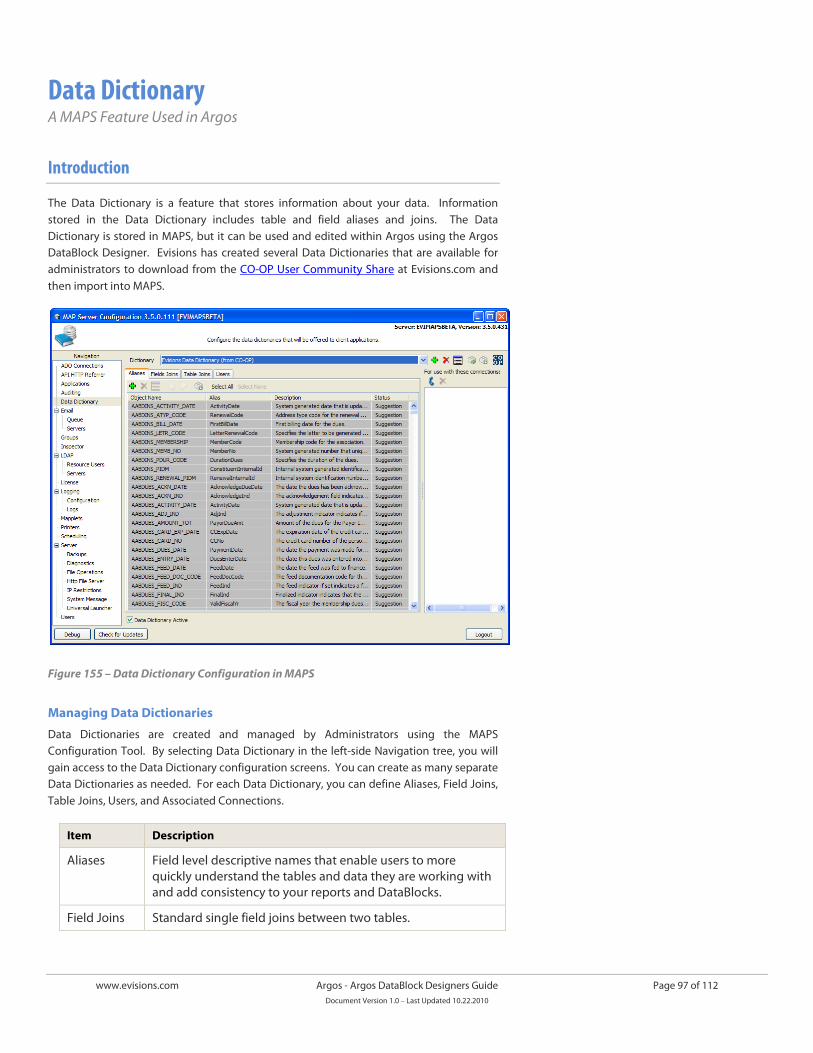
www.evisions.com Argos - Argos DataBlock Designers Guide Page 97 of 112 Document Version 1.0 – Last Updated 10.22.2010
Data Dictionary A MAPS Feature Used in Argos
Introduction
The Data Dictionary is a feature that stores information about your data. Information stored in the Data Dictionary includes table and field aliases and joins. The Data Dictionary is stored in MAPS, but it can be used and edited within Argos using the Argos DataBlock Designer. Evisions has created several Data Dictionaries that are available for administrators to download from the CO-OP User Community Share at Evisions.com and then import into MAPS.
Figure 155 – Data Dictionary Configuration in MAPS
Managing Data Dictionaries
Data Dictionaries are created and managed by Administrators using the MAPS Configuration Tool. By selecting Data Dictionary in the left-side Navigation tree, you will gain access to the Data Dictionary configuration screens. You can create as many separate Data Dictionaries as needed. For each Data Dictionary, you can define Aliases, Field Joins, Table Joins, Users, and Associated Connections.
Item Description
Aliases Field level descriptive names that enable users to more quickly understand the tables and data they are working with and add consistency to your reports and DataBlocks.
Field Joins Standard single field joins between two tables.
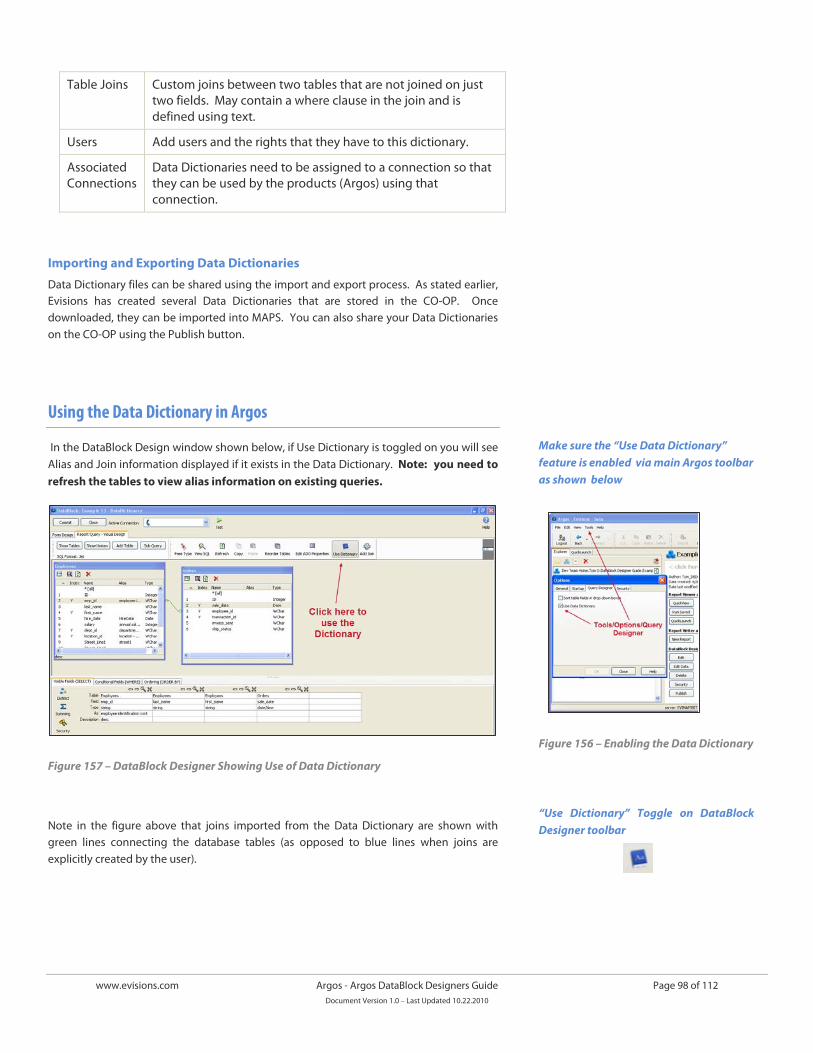
www.evisions.com Argos - Argos DataBlock Designers Guide Page 98 of 112 Document Version 1.0 – Last Updated 10.22.2010
Table Joins Custom joins between two tables that are not joined on just two fields. May contain a where clause in the join and is defined using text.
Users Add users and the rights that they have to this dictionary.
Associated Connections
Data Dictionaries need to be assigned to a connection so that they can be used by the products (Argos) using that connection.
Importing and Exporting Data Dictionaries
Data Dictionary files can be shared using the import and export process. As stated earlier, Evisions has created several Data Dictionaries that are stored in the CO-OP. Once downloaded, they can be imported into MAPS. You can also share your Data Dictionaries on the CO-OP using the Publish button.
Using the Data Dictionary in Argos
In the DataBlock Design window shown below, if Use Dictionary is toggled on you will see Alias and Join information displayed if it exists in the Data Dictionary. Note: you need to refresh the tables to view alias information on existing queries.
Figure 157 – DataBlock Designer Showing Use of Data Dictionary
Note in the figure above that joins imported from the Data Dictionary are shown with green lines connecting the database tables (as opposed to blue lines when joins are explicitly created by the user).
Make sure the “Use Data Dictionary” feature is enabled via main Argos toolbar as shown below
Figure 156 – Enabling the Data Dictionary
“Use Dictionary” Toggle on DataBlock Designer toolbar
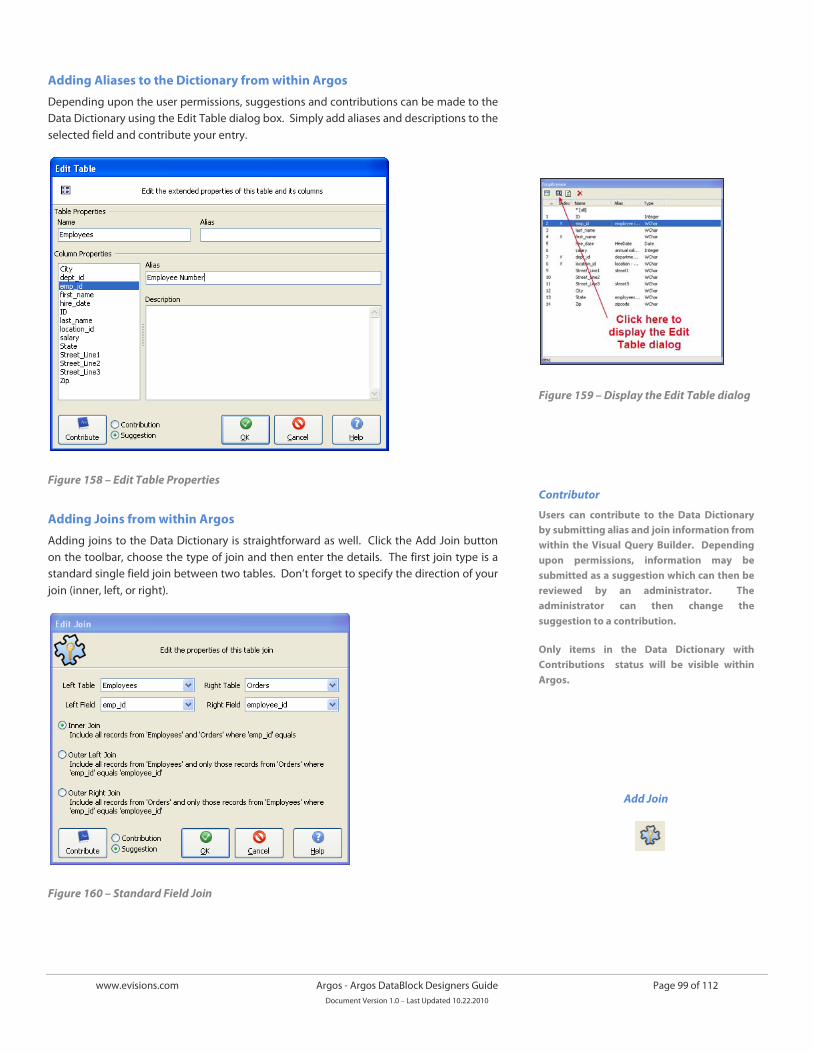
www.evisions.com Argos - Argos DataBlock Designers Guide Page 99 of 112 Document Version 1.0 – Last Updated 10.22.2010
Adding Aliases to the Dictionary from within Argos
Depending upon the user permissions, suggestions and contributions can be made to the Data Dictionary using the Edit Table dialog box. Simply add aliases and descriptions to the selected field and contribute your entry.
Figure 158 – Edit Table Properties
Adding Joins from within Argos
Adding joins to the Data Dictionary is straightforward as well. Click the Add Join button on the toolbar, choose the type of join and then enter the details. The first join type is a standard single field join between two tables. Don’t forget to specify the direction of your join (inner, left, or right).
Figure 160 – Standard Field Join
Figure 159 – Display the Edit Table dialog
Contributor
Users can contribute to the Data Dictionary by submitting alias and join information from within the Visual Query Builder. Depending upon permissions, information may be submitted as a suggestion which can then be reviewed by an administrator. The administrator can then change the suggestion to a contribution.
Only items in the Data Dictionary with Contributions status will be visible within Argos.
Add Join
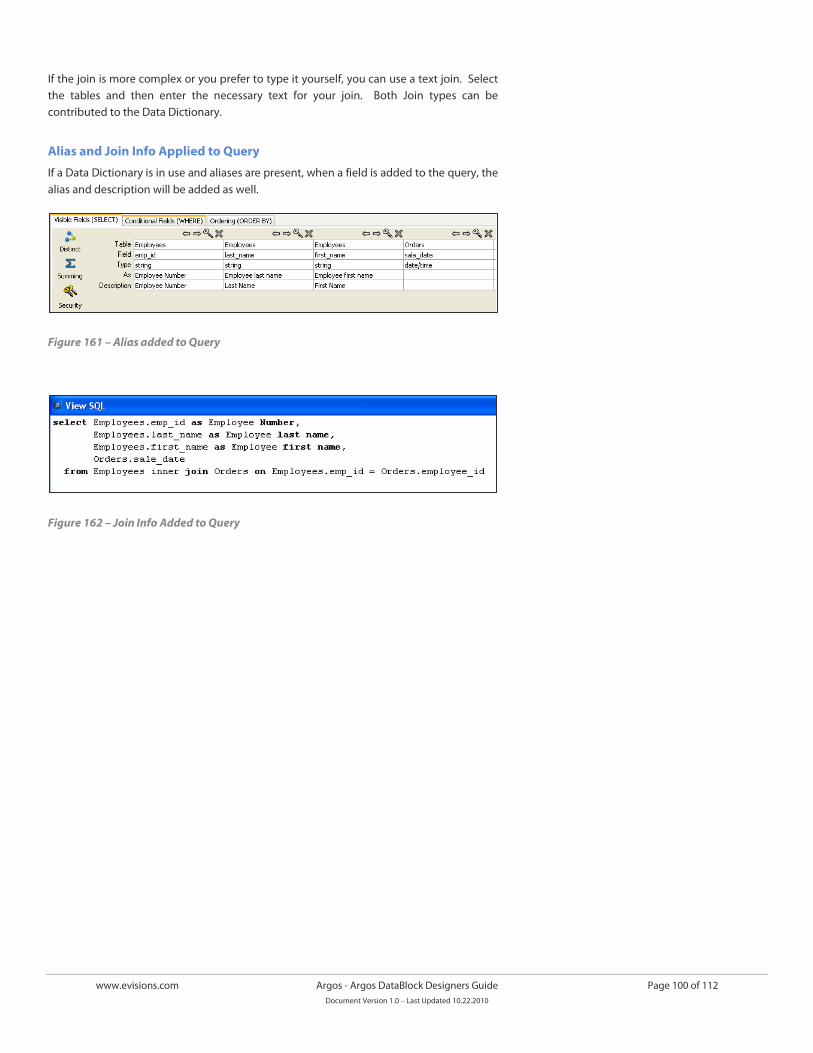
www.evisions.com Argos - Argos DataBlock Designers Guide Page 100 of 112 Document Version 1.0 – Last Updated 10.22.2010
If the join is more complex or you prefer to type it yourself, you can use a text join. Select the tables and then enter the necessary text for your join. Both Join types can be contributed to the Data Dictionary.
Alias and Join Info Applied to Query
If a Data Dictionary is in use and aliases are present, when a field is added to the query, the alias and description will be added as well.
Figure 161 – Alias added to Query
Figure 162 – Join Info Added to Query
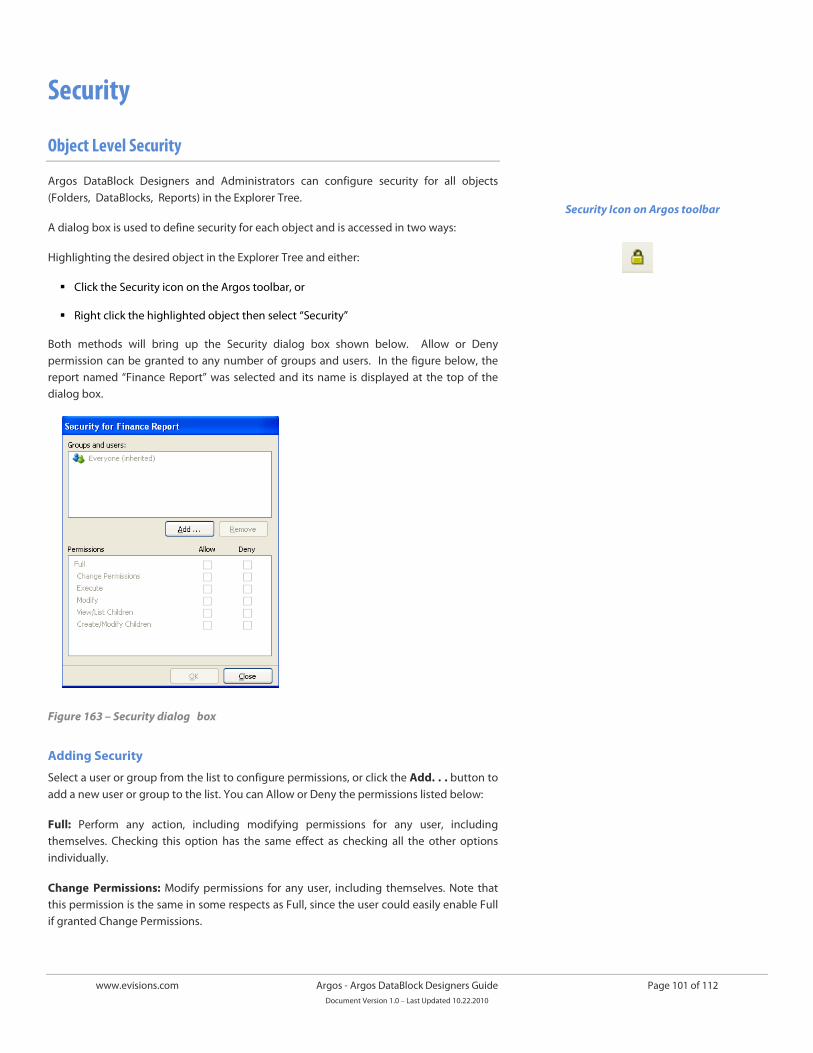
www.evisions.com Argos - Argos DataBlock Designers Guide Page 101 of 112 Document Version 1.0 – Last Updated 10.22.2010
Security
Object Level Security
Argos DataBlock Designers and Administrators can configure security for all objects (Folders, DataBlocks, Reports) in the Explorer Tree.
A dialog box is used to define security for each object and is accessed in two ways:
Highlighting the desired object in the Explorer Tree and either:
Click the Security icon on the Argos toolbar, or
Right click the highlighted object then select “Security”
Both methods will bring up the Security dialog box shown below. Allow or Deny permission can be granted to any number of groups and users. In the figure below, the report named “Finance Report” was selected and its name is displayed at the top of the dialog box.
Figure 163 – Security dialog box
Adding Security
Select a user or group from the list to configure permissions, or click the Add. . . button to add a new user or group to the list. You can Allow or Deny the permissions listed below:
Full: Perform any action, including modifying permissions for any user, including themselves. Checking this option has the same effect as checking all the other options individually.
Change Permissions: Modify permissions for any user, including themselves. Note that this permission is the same in some respects as Full, since the user could easily enable Full if granted Change Permissions.
Security Icon on Argos toolbar
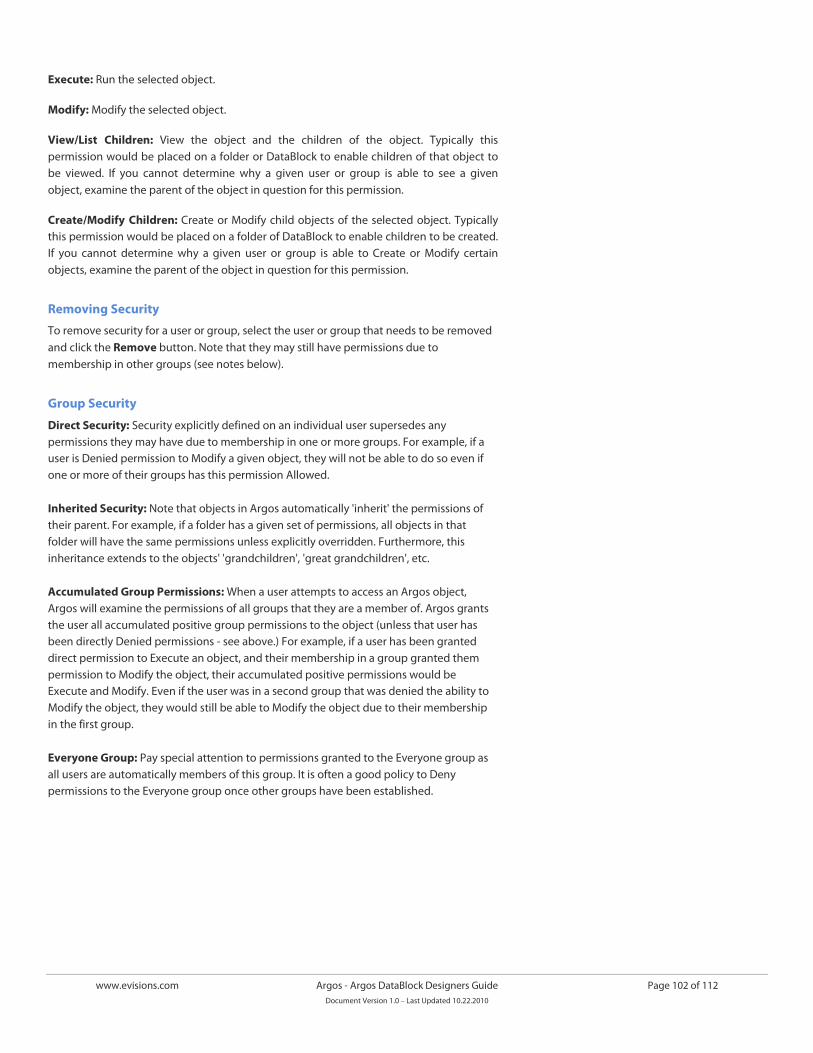
www.evisions.com Argos - Argos DataBlock Designers Guide Page 102 of 112 Document Version 1.0 – Last Updated 10.22.2010
Execute: Run the selected object.
Modify: Modify the selected object.
View/List Children: View the object and the children of the object. Typically this permission would be placed on a folder or DataBlock to enable children of that object to be viewed. If you cannot determine why a given user or group is able to see a given object, examine the parent of the object in question for this permission.
Create/Modify Children: Create or Modify child objects of the selected object. Typically this permission would be placed on a folder of DataBlock to enable children to be created. If you cannot determine why a given user or group is able to Create or Modify certain objects, examine the parent of the object in question for this permission.
Removing Security
To remove security for a user or group, select the user or group that needs to be removed and click the Remove button. Note that they may still have permissions due to membership in other groups (see notes below).
Group Security
Direct Security: Security explicitly defined on an individual user supersedes any permissions they may have due to membership in one or more groups. For example, if a user is Denied permission to Modify a given object, they will not be able to do so even if one or more of their groups has this permission Allowed. Inherited Security: Note that objects in Argos automatically 'inherit' the permissions of their parent. For example, if a folder has a given set of permissions, all objects in that folder will have the same permissions unless explicitly overridden. Furthermore, this inheritance extends to the objects' 'grandchildren', 'great grandchildren', etc. Accumulated Group Permissions: When a user attempts to access an Argos object, Argos will examine the permissions of all groups that they are a member of. Argos grants the user all accumulated positive group permissions to the object (unless that user has been directly Denied permissions - see above.) For example, if a user has been granted direct permission to Execute an object, and their membership in a group granted them permission to Modify the object, their accumulated positive permissions would be Execute and Modify. Even if the user was in a second group that was denied the ability to Modify the object, they would still be able to Modify the object due to their membership in the first group. Everyone Group: Pay special attention to permissions granted to the Everyone group as all users are automatically members of this group. It is often a good policy to Deny permissions to the Everyone group once other groups have been established.
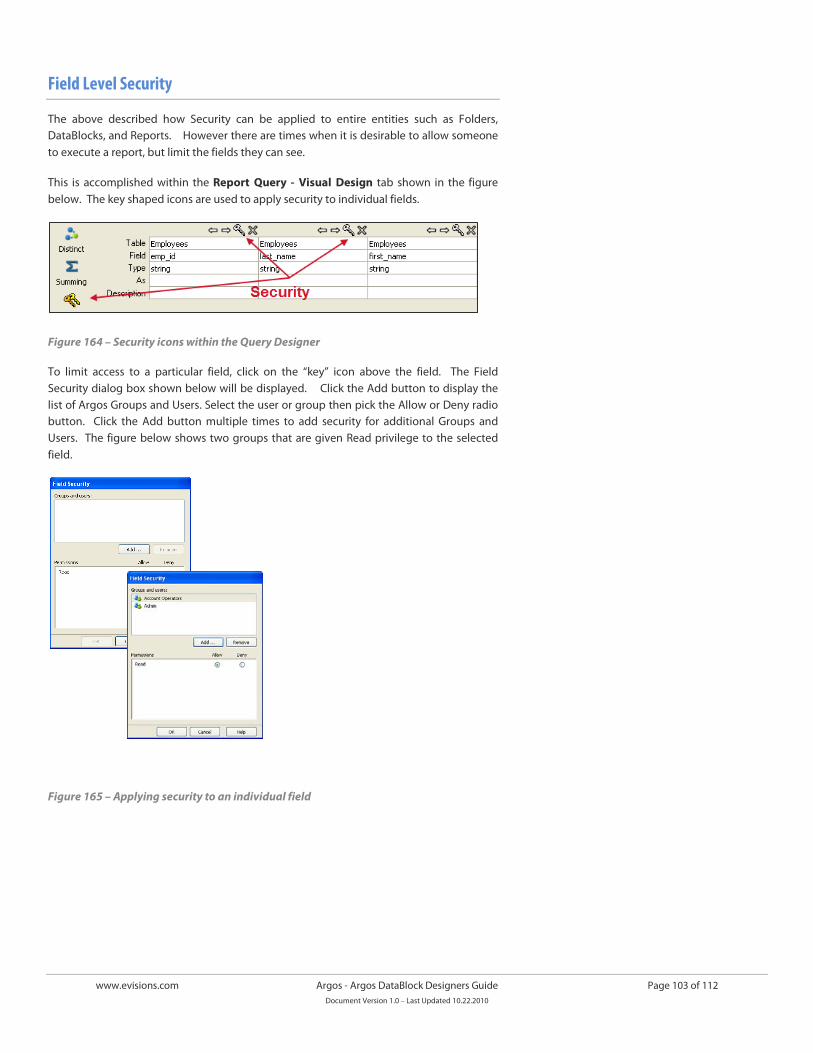
www.evisions.com Argos - Argos DataBlock Designers Guide Page 103 of 112 Document Version 1.0 – Last Updated 10.22.2010
Field Level Security
The above described how Security can be applied to entire entities such as Folders, DataBlocks, and Reports. However there are times when it is desirable to allow someone to execute a report, but limit the fields they can see.
This is accomplished within the Report Query - Visual Design tab shown in the figure below. The key shaped icons are used to apply security to individual fields.
Figure 164 – Security icons within the Query Designer
To limit access to a particular field, click on the “key” icon above the field. The Field Security dialog box shown below will be displayed. Click the Add button to display the list of Argos Groups and Users. Select the user or group then pick the Allow or Deny radio button. Click the Add button multiple times to add security for additional Groups and Users. The figure below shows two groups that are given Read privilege to the selected field.
Figure 165 – Applying security to an individual field
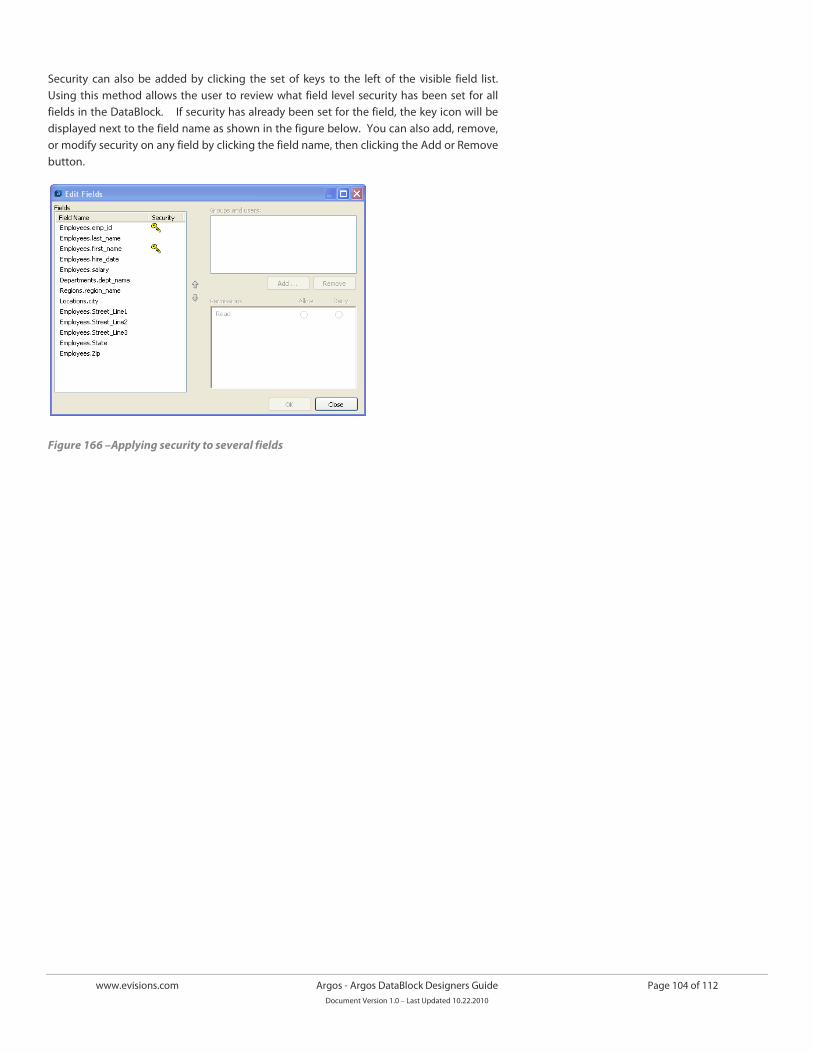
www.evisions.com Argos - Argos DataBlock Designers Guide Page 104 of 112 Document Version 1.0 – Last Updated 10.22.2010
Security can also be added by clicking the set of keys to the left of the visible field list. Using this method allows the user to review what field level security has been set for all fields in the DataBlock. If security has already been set for the field, the key icon will be displayed next to the field name as shown in the figure below. You can also add, remove, or modify security on any field by clicking the field name, then clicking the Add or Remove button.
Figure 166 –Applying security to several fields
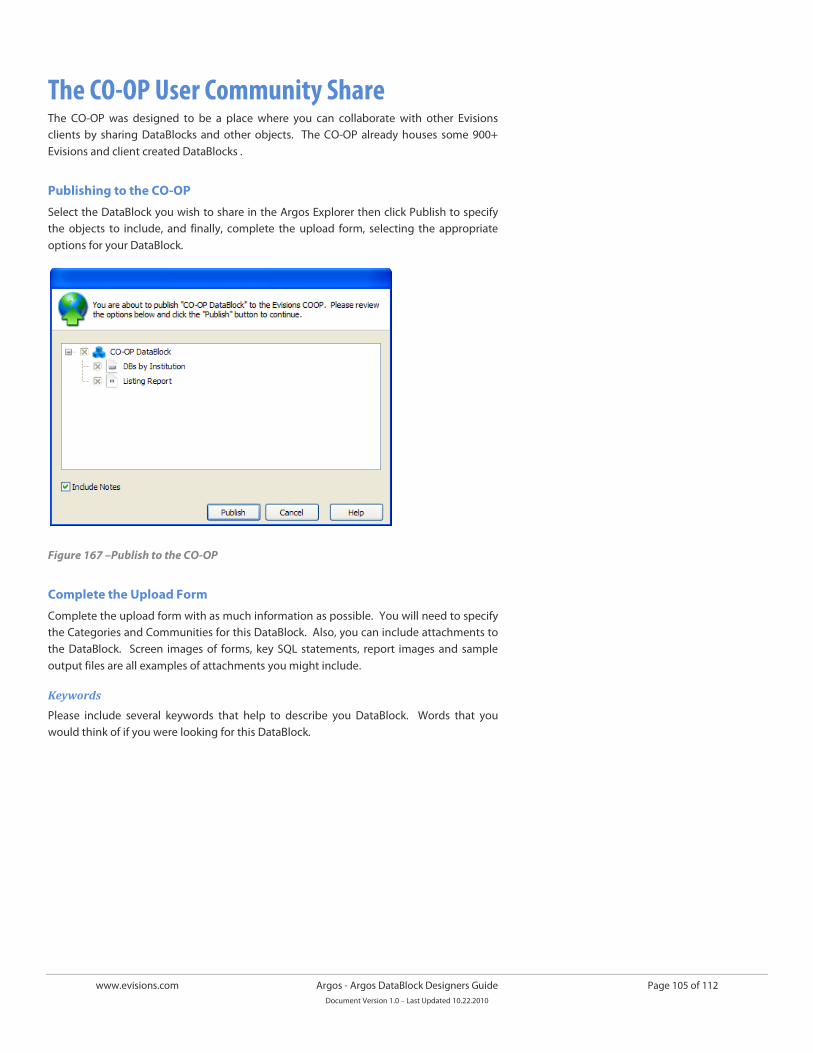
www.evisions.com Argos - Argos DataBlock Designers Guide Page 105 of 112 Document Version 1.0 – Last Updated 10.22.2010
The CO-OP User Community Share The CO-OP was designed to be a place where you can collaborate with other Evisions clients by sharing DataBlocks and other objects. The CO-OP already houses some 900+ Evisions and client created DataBlocks .
Publishing to the CO-OP
Select the DataBlock you wish to share in the Argos Explorer then click Publish to specify the objects to include, and finally, complete the upload form, selecting the appropriate options for your DataBlock.
Figure 167 –Publish to the CO-OP
Complete the Upload Form
Complete the upload form with as much information as possible. You will need to specify the Categories and Communities for this DataBlock. Also, you can include attachments to the DataBlock. Screen images of forms, key SQL statements, report images and sample output files are all examples of attachments you might include.
Keywords
Please include several keywords that help to describe you DataBlock. Words that you would think of if you were looking for this DataBlock.
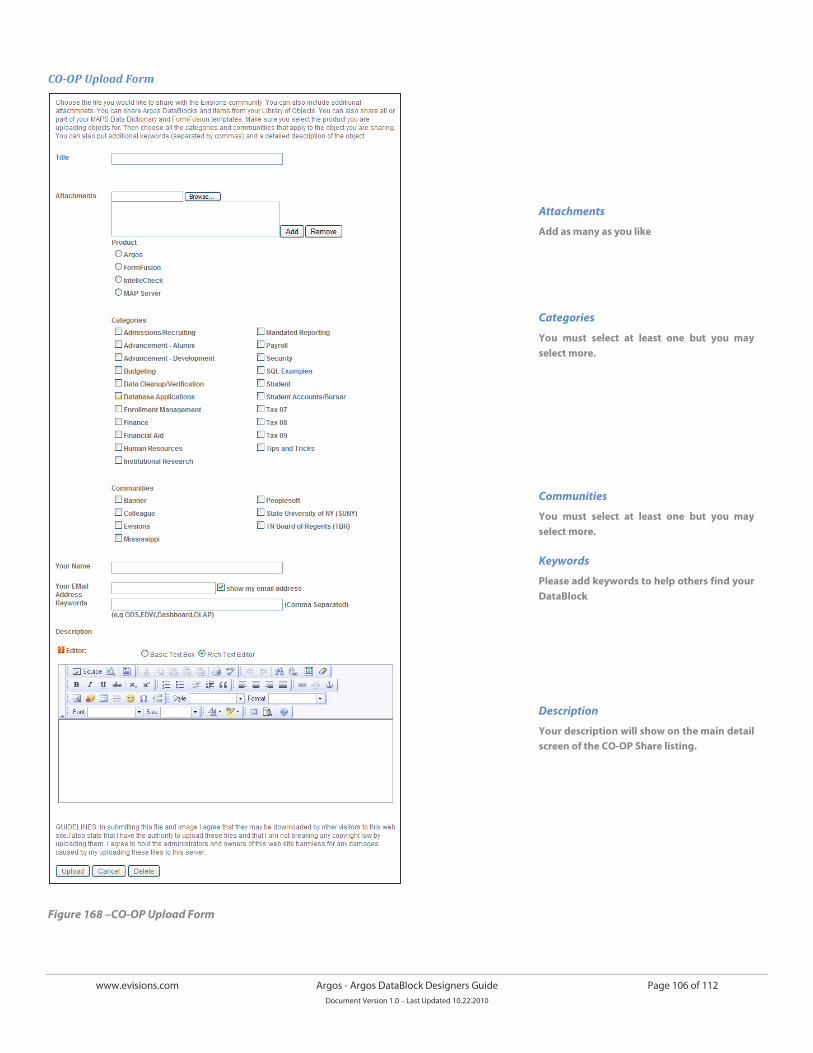
www.evisions.com Argos - Argos DataBlock Designers Guide Page 106 of 112 Document Version 1.0 – Last Updated 10.22.2010
CO-OP Upload Form
Figure 168 –CO-OP Upload Form
Attachments
Add as many as you like
Categories
You must select at least one but you may select more.
Communities
You must select at least one but you may select more.
Keywords
Please add keywords to help others find your DataBlock
Description
Your description will show on the main detail screen of the CO-OP Share listing.
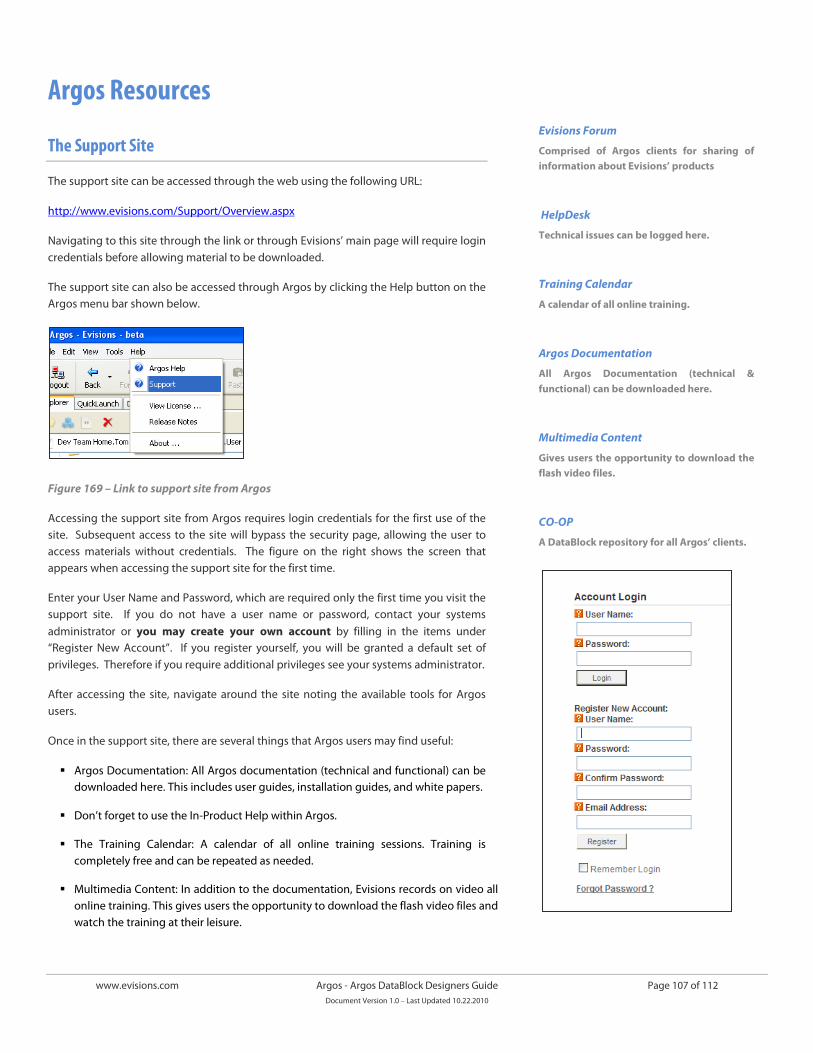
www.evisions.com Argos - Argos DataBlock Designers Guide Page 107 of 112 Document Version 1.0 – Last Updated 10.22.2010
Argos Resources
The Support Site
The support site can be accessed through the web using the following URL:
http://www.evisions.com/Support/Overview.aspx
Navigating to this site through the link or through Evisions’ main page will require login credentials before allowing material to be downloaded.
The support site can also be accessed through Argos by clicking the Help button on the Argos menu bar shown below.
Figure 169 – Link to support site from Argos
Accessing the support site from Argos requires login credentials for the first use of the site. Subsequent access to the site will bypass the security page, allowing the user to access materials without credentials. The figure on the right shows the screen that appears when accessing the support site for the first time.
Enter your User Name and Password, which are required only the first time you visit the support site. If you do not have a user name or password, contact your systems administrator or you may create your own account by filling in the items under “Register New Account”. If you register yourself, you will be granted a default set of privileges. Therefore if you require additional privileges see your systems administrator.
After accessing the site, navigate around the site noting the available tools for Argos users.
Once in the support site, there are several things that Argos users may find useful:
Argos Documentation: All Argos documentation (technical and functional) can be downloaded here. This includes user guides, installation guides, and white papers.
Don’t forget to use the In-Product Help within Argos.
The Training Calendar: A calendar of all online training sessions. Training is completely free and can be repeated as needed.
Multimedia Content: In addition to the documentation, Evisions records on video all online training. This gives users the opportunity to download the flash video files and watch the training at their leisure.
Evisions Forum
Comprised of Argos clients for sharing of information about Evisions’ products
HelpDesk
Technical issues can be logged here.
Training Calendar
A calendar of all online training.
Argos Documentation
All Argos Documentation (technical & functional) can be downloaded here.
Multimedia Content
Gives users the opportunity to download the flash video files.
CO-OP
A DataBlock repository for all Argos’ clients.
www.evisions.com Argos - Argos DataBlock Designers Guide Page 108 of 112 Document Version 1.0 – Last Updated 10.22.2010
Evisions Forums: collaborate with peers and share ideas about the Evisions Suite of Products based upon specific topics. The forums are also used to provide Evisions product/update information to clients. Forums can be found on the Evisions web site under the CO-OP User Community page.
The HelpDesk: Technical issues can be logged here. The link to the HelpDesk is listed below under “Important Links”.
The CO-OP User Community
Like the support site, the COOP can be accessed in two ways:
1. Through the Evisions main page under the Support tab
2. Using the COOP button in the Argos interface
The COOP is a DataBlock repository for all Argos clients. Evisions periodically uploads DataBlocks to the COOP for use in its client base. In addition, clients are encouraged to use the COOP as a mechanism to share the DataBlocks they have put together. Joining the Evisions CO-OP User Community also allows users to participate in forums and obtain Evisions Documentation and Software.
Click the “Visit the Argos COOP Site” icon on the toolbar. Enter your User Name and Password shown on the Account Login screen shown on the previous page. This is only required the first time you visit the COOP site. If you do not have a user name or password, contact your systems administrator or you may create your own account by filling in the items under “Register New Account”. If you register yourself, you will be granted a default set of privileges. Therefore if you require additional privileges see your systems administrator. The default privilege will allow you to download files from the CO-OP.
This will bring you to the CO-OP User Community page on the Evisions web site where you can take advantage of the features described above.
Important Links
Evisions Help Desk: http://helpdesk.evisions.com
Evisions Training Calendar: http://www.evisions.com/calendar
CO-OP
“Visit the COOP Site” icon on the Argos toolbar
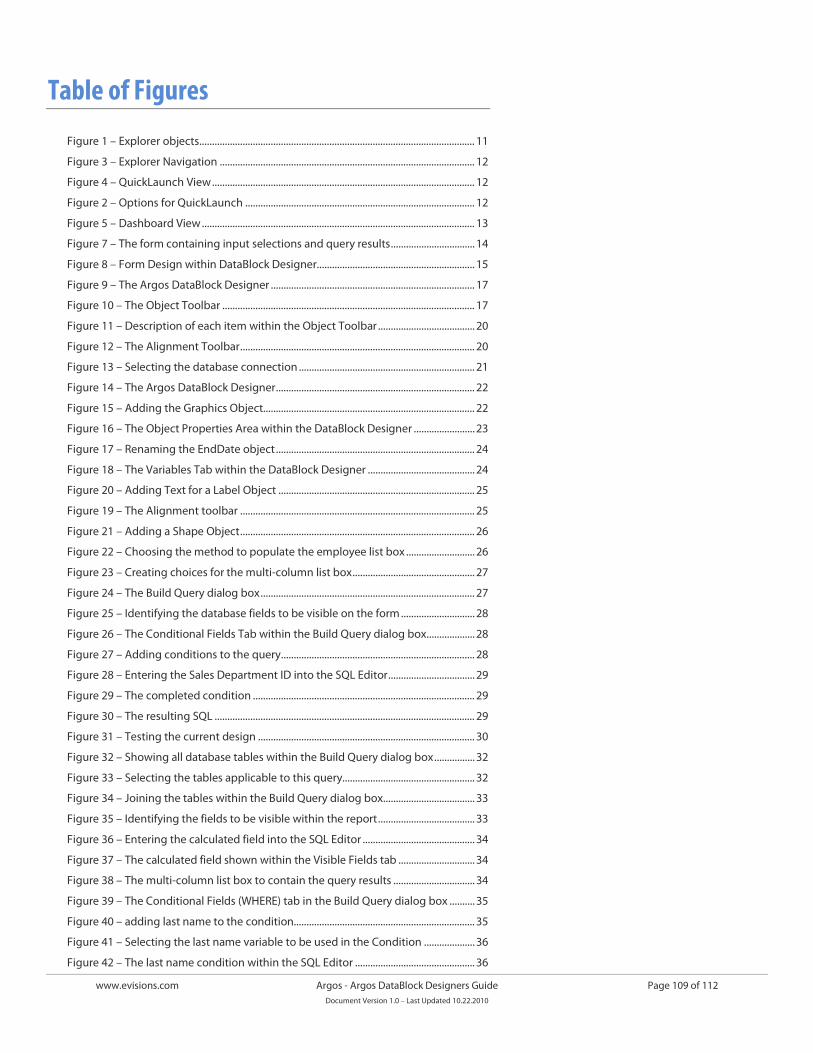
www.evisions.com Argos - Argos DataBlock Designers Guide Page 109 of 112 Document Version 1.0 – Last Updated 10.22.2010
Table of Figures
Figure 1 – Explorer objects ............................................................................................................ 11 Figure 3 – Explorer Navigation .................................................................................................... 12 Figure 4 – QuickLaunch View ....................................................................................................... 12 Figure 2 – Options for QuickLaunch .......................................................................................... 12 Figure 5 – Dashboard View ........................................................................................................... 13 Figure 7 – The form containing input selections and query results ................................. 14 Figure 8 – Form Design within DataBlock Designer.............................................................. 15 Figure 9 – The Argos DataBlock Designer ................................................................................ 17 Figure 10 – The Object Toolbar ................................................................................................... 17 Figure 11 – Description of each item within the Object Toolbar ...................................... 20 Figure 12 – The Alignment Toolbar ............................................................................................ 20 Figure 13 – Selecting the database connection ..................................................................... 21 Figure 14 – The Argos DataBlock Designer .............................................................................. 22 Figure 15 – Adding the Graphics Object................................................................................... 22 Figure 16 – The Object Properties Area within the DataBlock Designer ........................ 23 Figure 17 – Renaming the EndDate object .............................................................................. 24 Figure 18 – The Variables Tab within the DataBlock Designer .......................................... 24 Figure 20 – Adding Text for a Label Object ............................................................................. 25 Figure 19 – The Alignment toolbar ............................................................................................ 25 Figure 21 – Adding a Shape Object ............................................................................................ 26 Figure 22 – Choosing the method to populate the employee list box ........................... 26 Figure 23 – Creating choices for the multi-column list box ................................................ 27 Figure 24 – The Build Query dialog box .................................................................................... 27 Figure 25 – Identifying the database fields to be visible on the form ............................. 28 Figure 26 – The Conditional Fields Tab within the Build Query dialog box ................... 28 Figure 27 – Adding conditions to the query ............................................................................ 28 Figure 28 – Entering the Sales Department ID into the SQL Editor .................................. 29 Figure 29 – The completed condition ....................................................................................... 29 Figure 30 – The resulting SQL ...................................................................................................... 29 Figure 31 – Testing the current design ..................................................................................... 30 Figure 32 – Showing all database tables within the Build Query dialog box ................ 32 Figure 33 – Selecting the tables applicable to this query.................................................... 32 Figure 34 – Joining the tables within the Build Query dialog box .................................... 33 Figure 35 – Identifying the fields to be visible within the report ...................................... 33 Figure 36 – Entering the calculated field into the SQL Editor ............................................ 34 Figure 37 – The calculated field shown within the Visible Fields tab .............................. 34 Figure 38 – The multi-column list box to contain the query results ................................ 34 Figure 39 – The Conditional Fields (WHERE) tab in the Build Query dialog box .......... 35 Figure 40 – adding last name to the condition....................................................................... 35 Figure 41 – Selecting the last name variable to be used in the Condition .................... 36 Figure 42 – The last name condition within the SQL Editor ............................................... 36

www.evisions.com Argos - Argos DataBlock Designers Guide Page 110 of 112 Document Version 1.0 – Last Updated 10.22.2010
Figure 43 – The completed condition for last name ............................................................. 36 Figure 44 – Adding the condition for first name .................................................................... 37 Figure 45 – The complete variable list ....................................................................................... 37 Figure 46 – Creating the conditions for start date and end date ...................................... 37 Figure 47 – Creating the condition for the GO Button ......................................................... 38 Figure 48 – The final query for the query display................................................................... 39 Figure 49 – The QuickView report .............................................................................................. 39 Figure 50 – DataBlock/QuickView Report ................................................................................ 40 Figure 51 – Creating a new report .............................................................................................. 40 Figure 52 – The Copy and Paste selections within the Build Query dialog box ........... 41 Figure 53 – CSV, Banded, and Extract Reports now selectable .......................................... 41 Figure 54 –Edit Box added to the form ..................................................................................... 43 Figure 55 – Properties for edit box ............................................................................................. 44 Figure 57 – The report results ...................................................................................................... 44 Figure 58 –Other variables for this DataBlock ......................................................................... 45 Figure 59 – Contact types used in this example ..................................................................... 46 Figure 60 – The Main Form ........................................................................................................... 46 Figure 61 – The Forms Tab within the DataBlock Designer ................................................ 47 Figure 62 – Adding the four additional forms ......................................................................... 47 Figure 63 – Properties of the Address Button ......................................................................... 48 Figure 64 – Associating a button to an event ......................................................................... 48 Figure 65 – The design of the address form ............................................................................ 49 Figure 66 – Selecting the employee on the main form ........................................................ 50 Figure 67 – Query results for the phone number form ........................................................ 50 Figure 68 – The chart for fiscal years 2006 - 2008 .................................................................. 51 Figure 69 – The Main Chart Wizard Interface .......................................................................... 52 Figure 70 – The SQL Editor ............................................................................................................ 52 Figure 71 – The SELECT tab for the fy2006 dataset ............................................................... 52 Figure 72 – The WHERE tab for the fy2006 dataset ............................................................... 53 Figure 73 – After completing the dataset for fy2006 ............................................................ 54 Figure 74 – Selecting the Series that is being created/updated ....................................... 54 Figure 75 –The input selection object ....................................................................................... 56 Figure 76 – Adding the OLAP Cube Object.............................................................................. 56 Figure 77 –Selecting the Main Properties ................................................................................ 57 Figure 78 – Creating the Fact Table............................................................................................ 57 Figure 79 – The fact table (query) within the Build Query dialog box ............................. 58 Figure 80 – Identifying the Measures ........................................................................................ 58 Figure 81 –Identifying the Dimensions ..................................................................................... 59 Figure 82 –Applying a style........................................................................................................... 59 Figure 84 –The OLAP cube ............................................................................................................ 60 Figure 85 – The OLAP cube after moving dimensions into rows and columns ............ 60 Figure 83 – Library of Objects selection .................................................................................... 60 Figure 86 – The Form showing the 3 input selections.......................................................... 61 Figure 87 – Entering data into the SELECT tab ....................................................................... 62
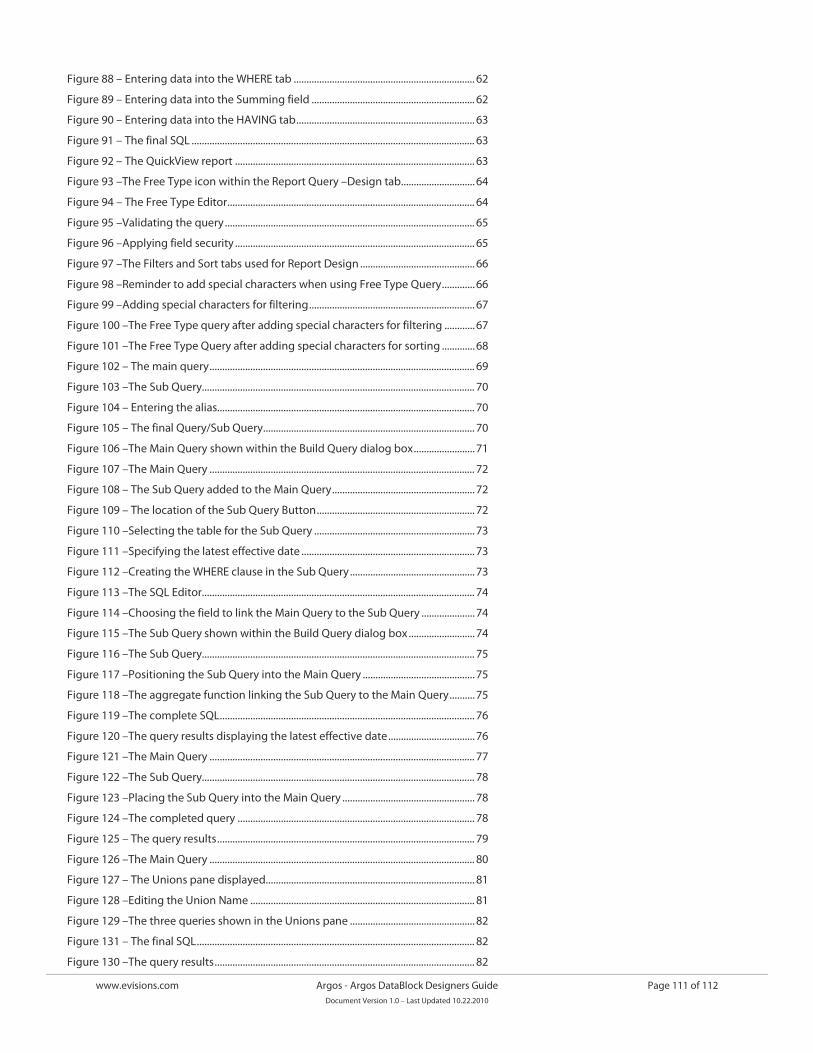
www.evisions.com Argos - Argos DataBlock Designers Guide Page 111 of 112 Document Version 1.0 – Last Updated 10.22.2010
Figure 88 – Entering data into the WHERE tab ....................................................................... 62 Figure 89 – Entering data into the Summing field ................................................................ 62 Figure 90 – Entering data into the HAVING tab ...................................................................... 63 Figure 91 – The final SQL ............................................................................................................... 63 Figure 92 – The QuickView report .............................................................................................. 63 Figure 93 –The Free Type icon within the Report Query –Design tab............................. 64 Figure 94 – The Free Type Editor ................................................................................................. 64 Figure 95 –Validating the query .................................................................................................. 65 Figure 96 –Applying field security .............................................................................................. 65 Figure 97 –The Filters and Sort tabs used for Report Design ............................................. 66 Figure 98 –Reminder to add special characters when using Free Type Query ............. 66 Figure 99 –Adding special characters for filtering ................................................................. 67 Figure 100 –The Free Type query after adding special characters for filtering ............ 67 Figure 101 –The Free Type Query after adding special characters for sorting ............. 68 Figure 102 – The main query ........................................................................................................ 69 Figure 103 –The Sub Query........................................................................................................... 70 Figure 104 – Entering the alias..................................................................................................... 70 Figure 105 – The final Query/Sub Query ................................................................................... 70 Figure 106 –The Main Query shown within the Build Query dialog box ........................ 71 Figure 107 –The Main Query ........................................................................................................ 72 Figure 108 – The Sub Query added to the Main Query ........................................................ 72 Figure 109 – The location of the Sub Query Button .............................................................. 72 Figure 110 –Selecting the table for the Sub Query ............................................................... 73 Figure 111 –Specifying the latest effective date .................................................................... 73 Figure 112 –Creating the WHERE clause in the Sub Query ................................................. 73 Figure 113 –The SQL Editor........................................................................................................... 74 Figure 114 –Choosing the field to link the Main Query to the Sub Query ..................... 74 Figure 115 –The Sub Query shown within the Build Query dialog box .......................... 74 Figure 116 –The Sub Query........................................................................................................... 75 Figure 117 –Positioning the Sub Query into the Main Query ............................................ 75 Figure 118 –The aggregate function linking the Sub Query to the Main Query .......... 75 Figure 119 –The complete SQL .................................................................................................... 76 Figure 120 –The query results displaying the latest effective date .................................. 76 Figure 121 –The Main Query ........................................................................................................ 77 Figure 122 –The Sub Query........................................................................................................... 78 Figure 123 –Placing the Sub Query into the Main Query .................................................... 78 Figure 124 –The completed query ............................................................................................. 78 Figure 125 – The query results ..................................................................................................... 79 Figure 126 –The Main Query ........................................................................................................ 80 Figure 127 – The Unions pane displayed .................................................................................. 81 Figure 128 –Editing the Union Name ........................................................................................ 81 Figure 129 –The three queries shown in the Unions pane ................................................. 82 Figure 131 – The final SQL ............................................................................................................. 82 Figure 130 –The query results ...................................................................................................... 82
www.evisions.com Argos - Argos DataBlock Designers Guide Page 112 of 112 Document Version 1.0 – Last Updated 10.22.2010
Figure 132 –A schedule shown in the Explorer Tree ............................................................. 83 Figure 133 –The General Tab........................................................................................................ 83 Figure 134 –The Schedule Tab ..................................................................................................... 84 Figure 135 –The Tasks Tab ............................................................................................................ 84 Figure 136 –Configuring email properties ............................................................................... 85 Figure 137 –The email task added to the list of Added tasks ............................................. 85 Figure 138 –The Events Tab .......................................................................................................... 86 Figure 139 –Executing the Report .............................................................................................. 87 Figure 140 –Selecting method to populate the input selection objects ........................ 87 Figure 141 –Options for Process and Save ............................................................................... 88 Figure 142 –Selecting an output format ................................................................................... 88 Figure 143 –Copying the report output to a destination .................................................... 88 Figure 144 –Options for creating a Saved State ..................................................................... 89 Figure 145 –Saved States listed when executing a saved report ...................................... 89 Figure 146 –Managing Saved States by Editing the Report ............................................... 90 Figure 147 –Adding the Bursting task ....................................................................................... 90 Figure 148 –Specifying Burst Conditions.................................................................................. 91 Figure 149 –Using the Expression Builder to specify a Burst Condition ......................... 91 Figure 150 –The Burst Condition field filled in........................................................................ 91 Figure 151 –The report shown in the Explorer Tree .............................................................. 92 Figure 152 – Library of Objects Manager .................................................................................. 93 Figure 153 – Edit Styles Using the Format Tab ....................................................................... 93 Figure 154 – Banded Report Wizard - Report Template ...................................................... 95 Figure 155 – Selecting a Style for an OLAP Cube ................................................................... 96 Figure 156 – Data Dictionary Configuration in MAPS ........................................................... 97 Figure 158 – DataBlock Designer Showing Use of Data Dictionary ................................. 98 Figure 157 – Enabling the Data Dictionary .............................................................................. 98 Figure 159 – Edit Table Properties .............................................................................................. 99 Figure 161 – Standard Field Join ................................................................................................. 99 Figure 160 – Display the Edit Table dialog ............................................................................... 99 Figure 162 – Alias added to Query............................................................................................ 100 Figure 163 – Join Info Added to Query ................................................................................... 100 Figure 164 – Security dialog box ............................................................................................. 101 Figure 165 – Security icons within the Query Designer ..................................................... 103 Figure 166 – Applying security to an individual field ......................................................... 103 Figure 167 –Applying security to several fields .................................................................... 104 Figure 168 –Publish to the CO-OP ............................................................................................ 105 Figure 169 –CO-OP Upload Form .............................................................................................. 106 Figure 170 – Link to support site from Argos ........................................................................ 107