Embed Size (px)
Citation preview
Comparison of Two Comparison of Two International Approaches to International Approaches to
Controlling Risk from Controlling Risk from Produced Water DischargesProduced Water Discharges
John A. VeilManager – Water Policy ProgramEnvironmental Science Division
NEL Produced Water Workshop Aberdeen, Scotland
April 23-24, 2008

2
Topics for Discussion
What is produced water?What is in produced water?Approaches to minimize risk– U.S. approach– North Sea approach
Why are there differences?

3
What is Produced Water?
Water that comes to the surface with oil and gasContains many chemical constituents– Salt content (salinity, total dissolved solids
[TDS], electrical conductivity)– Oil and grease
• Composite of many hydrocarbons and other organic materials
– Toxicity from various natural inorganic and organic compounds or chemical additives
– NORM
4
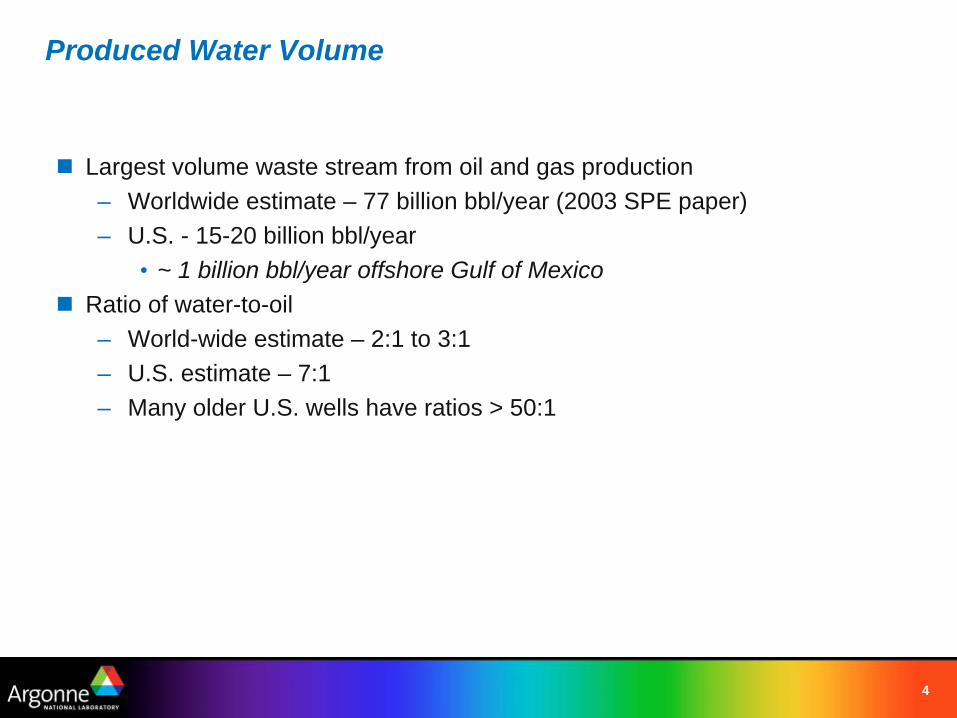
Produced Water Volume
Largest volume waste stream from oil and gas production– Worldwide estimate – 77 billion bbl/year (2003 SPE paper)– U.S. - 15-20 billion bbl/year
• ~ 1 billion bbl/year offshore Gulf of MexicoRatio of water-to-oil– World-wide estimate – 2:1 to 3:1– U.S. estimate – 7:1– Many older U.S. wells have ratios > 50:1

5
Number of U.S. Producing Wells
Type of Well Total
Onshore (low production)
718,976 (2006)
Onshore (high production)
217,214 (2004)
Offshore 7,961 (2004)
Total 944,151
Source: U.S. Department of Energy, Energy Information Administration and Interstate Oil and Gas Compact Commission

6
Approaches to Minimizing Risk from Produced Water Discharges to the Ocean
U.S. approach– Gulf of Mexico– California– Alaska
North Sea regional approach– Norwegian approach

7
U.S. Approach to Minimizing Produced Water Risk
Emphasizes combined or holistic effect of the effluent when it is dischargedFollows U.S. legal/regulatory frameworkSpecific requirements vary between regions, but all:– Start with national oil and grease limits– Add effluent toxicity testing requirements for several species– Add other monitoring, studies, or operational controls to meet regional
needs and interests

8
EPA Oil and Gas National Discharge Standards Effluent Limitations Guidelines [40 CFR 435]
Onshore
Stripper (<10bbl/day)
Agricultural and wildlife use
Coastal
Offshore
98th meridian

9
National Produced Water Discharge Standards for Wells Located Onshore
Onshore subcategory – Zero discharge
Stripper subcategory– No national requirements– Jurisdiction left to state or EPA region
Agricultural and Wildlife Use subcategory– Produced water must have a use
• Water must be of good enough quality for wildlife, livestock, or other agricultural use
• Produced water must actually be put to that use– Oil and grease limit of 35 mg/l maximum
EPA is currently evaluating the need for a new subcategory for coal bed methane

10
National Discharge Standards for Produced Water Discharges to Offshore and Coastal Waters
Coastal wells– Zero discharge except in Cook Inlet, Alaska– Offshore limits required there
Offshore wells– Oil and grease limits before discharge
• 29 mg/l monthly average• 42 mg/l daily maximum
– No other parameters are limited by national standards
– Discharges are regulated through NPDES (National Pollutant Discharge Elimination System) general permits

11
Basis for U.S. Offshore Produced Water Standards
Oil and grease limit used as a “surrogate” for other pollutants
– When oil and grease are controlled, other pollutants will also be controlled
Limit is based on a statistical analysis of data from 60 U.S. platforms
– Monthly average = 95th percentile = 29 mg/l– Daily maximum = 99th percentile = 42 mg/l

12
EPA Region 4 – Eastern Gulf of Mexico
Region 4 - Eastern Gulf of Mexico OCS
13
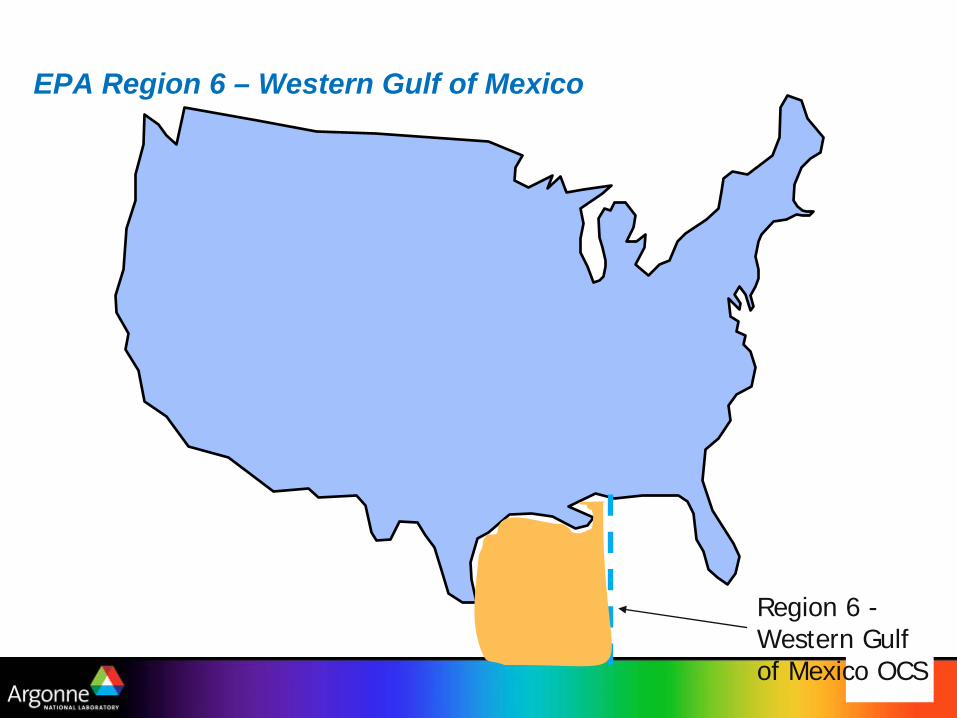
EPA Region 6 – Western Gulf of Mexico
Region 6 - Western Gulf of Mexico OCS

14
EPA Region 6 – Western Gulf of Mexico
Region 6 - Western Gulf of Mexico - Territorial Seas

15
EPA Region 9 – California Coast
Region 9 – California Coast

16
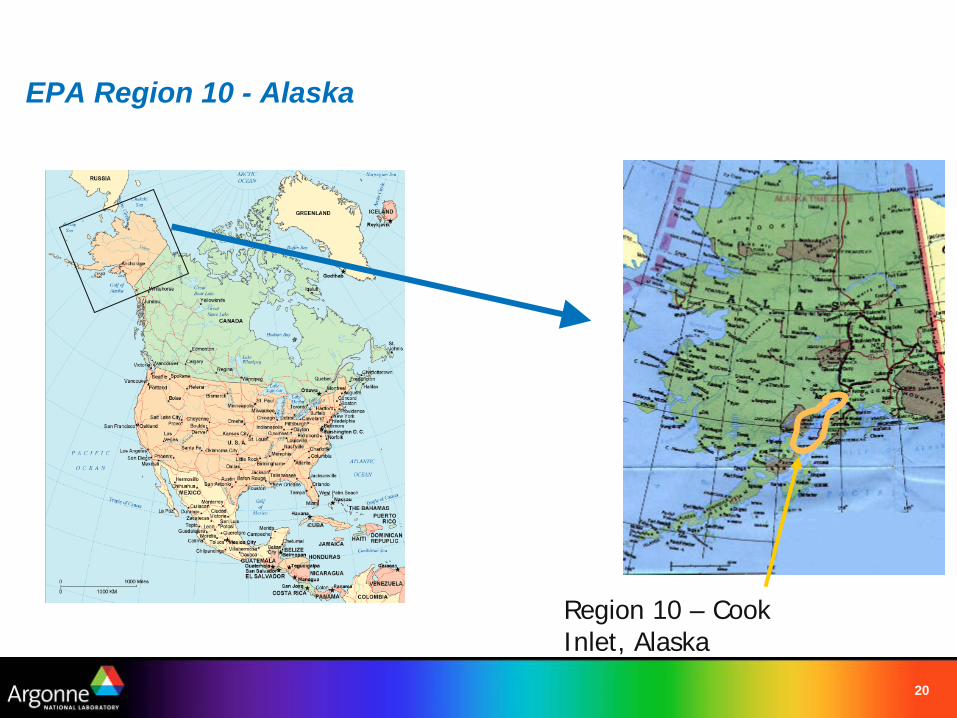
EPA Region 10 - Alaska
Region 10 – Cook Inlet, Alaska

17
Produced Water Controls in EPA Permits
Oil and grease limitsToxicity tests– Limits based on water quality modeling
Limits on other pollutantsRestrictions or prohibitions on dischargeStudies

18
Comparison of Toxicity Requirements in EPA Permits
PermitDateIssued Type of Test Species
Region 4, 12/04 Chronic Mysid shrimp (Mysidopsis bahia)Inland silverside minnow (Menidia beryllina)
Region 6, OCS
10/07 Chronic Mysid shrimp (Mysidopsis bahia)Inland silverside minnow (Menidia beryllina)
Region 6,Territorial
Seas
8/05 Chronic plus 24-hour acute test using full-strength effluent
Mysid shrimp (Mysidopsis bahia)Inland silverside minnow (Menidia beryllina)
Region 9,California
12/04 Chronic Red abalone (Haliotis rufescens)Giant kelp (Macrocystis pyrifera)Topsmelt fish (Atherinops affinis)
Region 10, Cook Inlet
7/07 Chronic Topsmelt fish (Atherinops affinis)Mussel (Mytilus sp.) or Pacific oyster (Crassostrea
gigas)Purple sea urchin (Strongylocentrotus purpuratus) or
sand dollar (Dendraster excentricus)

19
Toxicity Test Species
20
EPA Region 10 - Alaska
Region 10 – Cook Inlet, Alaska
21
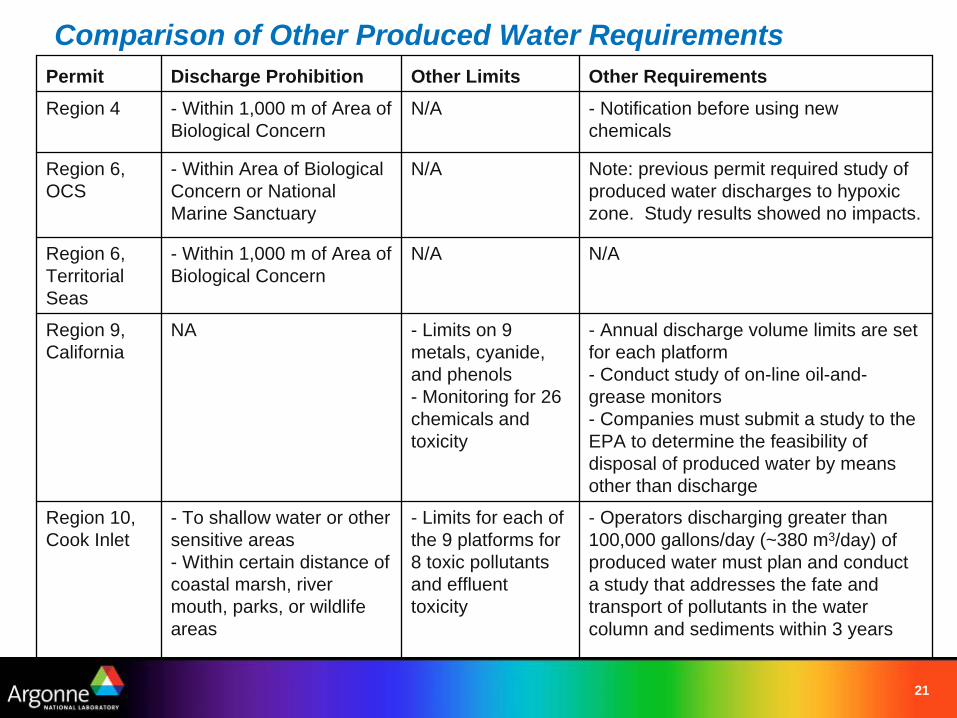
Comparison of Other Produced Water RequirementsPermit Discharge Prohibition Other Limits Other RequirementsRegion 4 - Within 1,000 m of Area of
Biological ConcernN/A - Notification before using new
chemicals
Region 6,OCS
- Within Area of Biological Concern or National Marine Sanctuary
N/A Note: previous permit required study of produced water discharges to hypoxic zone. Study results showed no impacts.
Region 6,Territorial Seas
- Within 1,000 m of Area of Biological Concern
N/A N/A
Region 9,California
NA - Limits on 9 metals, cyanide, and phenols- Monitoring for 26 chemicals and toxicity
- Annual discharge volume limits are set for each platform- Conduct study of on-line oil-and- grease monitors- Companies must submit a study to the EPA to determine the feasibility of disposal of produced water by means other than discharge
Region 10,Cook Inlet
- To shallow water or other sensitive areas- Within certain distance of coastal marsh, river mouth, parks, or wildlife areas
- Limits for each of the 9 platforms for 8 toxic pollutants and effluent toxicity
- Operators discharging greater than 100,000 gallons/day (~380 m3/day) of produced water must plan and conduct a study that addresses the fate and transport of pollutants in the water column and sediments within 3 years
22
North Sea Approach to Minimizing Produced Water Risk
Emphasizes control of the chemical products used in the well and during treatment such that the combined impact will be acceptable Follows a more complicated framework of requirementsBased on OSPAR Convention

23
North Sea Regulatory Requirements
Long-standing oil and grease limit of 40 mg/l
Changes made in 2006
– Oil and grease limit of 30 mg/l
– Achieve 15% reduction in total oil loading compared to 2000 level

24
North Sea Approach Considers Impacts and Risks
Use risk assessment approach to authorize dischargesOCNS (offshore chemical notification system)– Chemicals must be tested and pre-approved before they can be
used– Must consider biodegradation, bioaccumulation, and toxicity– Chemicals on PLONOR (poses little or no risk) list can have
reduced screening
Evaluate whether predicted environmental concentration (PEC) exceeds predicted no effect concentration (PNEC)
– PEC/PNEC should be <1

5 3 0Log Pow , (bioaccumulation)
BIODEGRADATION
Substances with less degradation than 20%, must be tested on:
• Skeletonema
• Acartia
• Corophium
100%
60%
20%
0%
BOD > 60%if toxic =>
red
BOD <60%
BOD <20%black black
log Pow >5 log Pow >3 log Pow < 3
PLONOR
Black = no discharge permitted Red = to be substitutedYellow = acceptable
”If toxic" applies if measured toxicity by EC-50 or LC-50 is less than 10 mg/l.Product toxicity should be used unless component toxicity is available.
Green = PLONOR and water
if toxic => red
if toxic => red
if toxic => if toxic =>
Screening Criteria
Source: J. McMahon,
Baker Petrolite

26
Norway Has Additional ControlsCHARM model used to estimate PECs and PNECs
Source:
S. Johnsen Statoil, 2003

27
Norwegian industry further developed the DREAM model – Used to calculate EIF (environmental impact factor) and the
volume of water surrounding a platform that has PEC/PNEC > 1
Source:
S. Johnsen Statoil, 2003
More on the Norwegian Approach

28
OSPAR and Other Regional Conventions
40 mg/l; 100 mg/l max.Barcelona Convention (Mediterranean)
40 mg/l ; 100 mg/l max.Kuwait Convention and (Red Sea region)
Pre-approval of chemical additives
15 mg/l; up to 40 mg/l if BAT cannot achieve 15 mg/l
HELCOM (Baltic Sea)
Pre-approval of chemical additives
30 mg/lOSPAR (North East Atlantic)
OtherOil in Water LimitConvention

29
Why Are the Two Approaches Different?
Number of offshore wells and dischargesLength of time offshore production has occurredNational/regional culture and politicsDifferent analytical methodsHuman nature

30
Comparison of the Number of U.S. Offshore to North Sea Producing WellsCountry/Region # Platforms
/Offshore FieldsProducing Oil Wells (2004)
Denmark 19 225
Netherlands 12 69
Norway 40 801
UK 174 1,383
North Sea Total 245 2,478
Source: Oil & Gas Journal, December 19, 2005
Country/Region # Platforms Producing Oil & Gas Wells (2002)
U.S. Gulf of Mexico 3,895 6,948
Source: U.S. Department of Energy, Energy Information Administration, and U.S. Minerals Management Service

31
Effect of Number of Wells on Risk Management Approach
U.S. has had thousands of offshore wells to regulate for several decadesNorth Sea, and particularly Norway, has far fewer discharges to regulate – This allows for more platform-specific analyses and studies
Parallel example can be seen by comparing strategies between EPARegions – Region 6 (Gulf of Mexico) has thousands of platforms– Region 9 (California) has 22 platforms– Region 10 (Cook Inlet) has 9 platforms
Region 6 permit requirements are general, while Region 9 and 10 permits allow for platform-specific requirements

32
Duration of Offshore Experience
U.S. began in 1940s– Kerr-McGee drilled the first well from a fixed platform offshore out-of-
sight of land in 1947. – By 1949, 11 fields were found in the Gulf of Mexico with 44 exploratory
wells. North Sea– The first offshore hole in the North Sea was made by the drilling
platform Mr. Louie in May 1964 thirty miles north of the island of Juist, in the German sector
– The Drilling Barge Sea Gem was the first rig ever to find hydrocarbons in the British North Sea sector in September 1965
– In May 1963, Norway asserted sovereign rights over natural resources in its sector of the North Sea. Exploration started in July 1966. First oil came in August 1969.

33
Effect of Duration of Experience on Risk Management Approach
The U.S. had already drilled hundreds to thousands of offshore wells by the time the first North Sea wells were drilledCertain produced water management practices were already establishedEarly U.S. platforms did not include space for extensive produced water treatment– Many were relatively small compared to the North Sea platformsWhen first round of U.S. offshore permits were being written in the 1980s, agencies needed to look at existing facilities and technologiesNorth Sea started later and had larger facilities to work with

34
Culture/Political Differences
European culture, law, and politics have developed over a much long time frame than U.S. cultureEuropean nations have had to live side-by-side with other nations for many centuries and have developed different ways of dealing with shared resources (i.e., North Sea water quality) than have North American countriesMuch of Europe leans toward “green” politics and policies

35
There is a wide range of politics and societal attitudes about oil and gas in different parts of the U.S.– Citizens and regulators in California and Florida do not strongly support
offshore production– Texas and Louisiana do support offshore production
Most U.S. offshore production is off the coast of Texas and Louisiana– Consequently, there has been less strong objection to produced water
management practices there than in Europe or in California and FloridaU.S. discharge policy is based on setting standards, then letting industry figure out how to do it most effectively and economically– EPA does not generally get involved in how the limits are met
Effect of Culture/Politics on Risk Management Approach

36
Analytical Methods
Measurement of oil and grease depends on the analytical method used– Oil and grease is not a single chemical substance – The test measures the sum of many different hydrocarbons and other organic
substances that happen to be detected by the analytical methodThe U.S. oil and grease standards are based on statistical analysis of hundreds of samples measured using an analytical method that included Freon as the extraction solventThe phase-out of Freon caused EPA to change its approved analytical method to use hexane as an extraction solvent– The current compliance samples are being made using a different analytical
method

37
Effect of Analytical Methods on Risk Management Approach
The North Sea region uses still different analytical methods for oil and greaseConclusion: the U.S. and the North Sea are not measuring exactly the same commodity “oil and grease”Although oil and grease is a reasonable indicator of the hydrocarbon and other organic concentrations in the produced water, the effectiveness of regulatory controls based solely on oil and grease are not as precise as regulators may believe
Source: Turner Designs

38
Effect of Human Nature on Risk Management Approach
Humans are stubborn and tend to show strong “pride of ownership” for their own ideas, systems, and proceduresEven if one society sees parts of the other society’s system that look better or appear to be more effective, there will generally be strong resistance to dropping your own system and adding major features from the other systemThis “regulatory inertia” has contributed to development and maintenance of two distinct approaches to regulating and managing risk from produced water discharges

39
Conclusions
Oil and grease is the baseline of produced water regulatory controls in most countries– Most jurisdictions use additional controls
beyond oil and grease limitsThe two best-established systems (U.S. and North Sea) have followed dramatically different approaches to manage produced water risk – Both approaches successfully manage risk
but place the management controls on opposite ends of the process• North Sea emphasizes inputs• U.S. emphasizes outputs

40
Conclusions (continued)
Is one approach better than the other?– One may be more effective than the other in
some situations– Conversely, one may be more constraining or
restrictive than needed to ensure environmental protection

41
Example of Critical Dilutions for Toxicity