Embed Size (px)
Citation preview
FLARE-NOTE-LAR 56
Argon Purity and Purification in aLarge Cryogenic Tank
April 28, 2005
A. Para, Fermilab
Abstract
Problems and issues related to the attaining and maintaining highlevels of purity of liquid argon in a large commercial cryogenic tank areanalyzed. High levels of argon purity can be achieved with modest size re-circulation system as th purification may be extended over very long time.Out-gassing from the walls and from the materials inside the tank is ofrelatively low importance, again because of long periods of time involved.The most important design objective of the experiment is minimizationof potential leaks and reduction of their impact on the argon purity bybuffer volumes filled with gaseous argon. Gas purification system is foundto be of relatively little importance.
1 Introduction
Large Liquid Argon Time Projection Chamber presents an attractive option fora neutrino detector. In addition to its superb particles detection and measure-ment capabilities a large LAr TPC can be built in a relatively straightforwardand economic manner. Principles of the detection technique as well as many ofthe technical solutions have been established by the ICARUS collaboration.[1].
The fundamental advantage of the LAr TPC technology stems from thepossibility of attaining very long (of the order of several meters) drift distances,hence permitting a readout of a very large detector volume with relatively smallnumber of wires and electronics channels. Detector performance is related to twofundamental parameters, signal size, S, and electronics noise, N . The former isintimately related to the purity of argon and in particular to the concentrationof electro-negative impurities, oxygen being the principal one.
In this note we examine issues related to the argon purity requirements inFLARE. The relevant features and parameters of the detector are:
• large commercial cryogenic tank
• commercial purification system
• drift distance of 3 m
• wire spacing of 5 mm
2 Requirements
Signal-to-noise ratio, S/N, requirement determines several aspects of the exper-iment:
• data size after baseline subtraction (if no further signal processing is per-formed)
• pattern recognition capability
• energy resolution
While S/N of the order of 5 − 6 is probably quite sufficient, as shown bythe date recorded in T600 module of ICARUS[1] , we feel that the design ofa large detector should aim for the S/N of the order of 10, thus to leave someroom for possible design optimization. The noise level, in number of electrons,is primarily determined by the detector capacitance. With JFET technologyand for the integration time of 1 µs it is of the order
N [e] = 500 + 2.6C
1
where C is the detector (i.e. wires and cables) capacitance in pF . FLAREdetector is designed is to achieve N � 2000 el, by reducing the wire capacitanceand keeping the cables length below 3 − 4 m.
Minimum ionizing particle produces 55000 e/cm in liquid argon, thus theproduced signal as seen by a single wire (with 5 mm spacing) is 27500 electrons.The challenge of argon purification system is to ensure that more than 75% ofthe produced electrons survive the drift to the wire even for the longest driftpath of 3 m.
Drift velocity of electrons in liquid argon depends on the applied electricfield. We assume field of 500 V/cm , giving vdrift ≈ 1.5 mm/µ sec, thus thelongest drift time is 2 ms.
Diffusion coefficient for liquid argon is D = 4.8 cm2/s, hence the maximallongitudinal spread of the electron signal due to diffusion is
∆x =√
2Dt = 1.4 mm
The primary mechanism of the loss of electrons is the electron attachment tothe electro-negative impurities in argon, mostly oxygen. It os a random processwhich can be parameterized by a characteristic lifetime τ :
Q(t) = Q(0) exp(−t/τ)
A requirement that Q(2 ms)/Q(0) � 0.75 translates into the requirementthat the electron lifetime τ exceeds 7 ms.
Electron lifetime is primarily related to the concentration of oxygen in thevolume of liquid argon with the approximate relation
τ = 300 µsO2 concentration
1ppb(O2)
thus the required purity of the liquid argon is 50 ppt(trillion) (oxygen-equivalent).
It should be noted that electron lifetime exceeding 10 ms has been attainedusing a commercial filter (Oxysorb/Hydrosorb) by ICARUS collaboration in asmall test module[2]. In a short operation of a large T600 detector the lifetimeof 1.75 ms was attained. Detailed analysis of the argon purity data indicatesthat the electron lifetime was limited by duration of the run due to out-gassingof the cables ad that it would eventually reach the value of 13 ms[6].
Analysis of the T600 data shows, in particular, that the there were no de-tectable leaks leading to a degradation of the argon purity.
3 From ICARUS to FLARE
Several measurements indicate that long drift distance can be easily realizedwith ICARUS-type modules. Whereas it is a good news, it must be stressed
2
that there are very significant differences between the ICARUS detector and theproposed FLARE detector[3]:
• vessel
– ICARUS has a custom designed aluminum vessel with thin insulationand active cooling using liquid nitrogen
– FLARE is using commercial cryogenic tank constructed of 9% nickelsteel. Thermal insulation is provided by a thick layer of perlite.
• vessel surface preparation:
– ICARUS tank walls have been subject to pickling using dilutes solu-tion of nitric acid and to passivation. They were subsequently rinsedwith de-mineralized water and dried with dry air
– FLARE tank will be washed with cleaning solution (no halogens!)and water
• initial conditions
– ICARUS vessel has been evacuated to 10−4 mbar before filling withliquid argon
– FLARE tank will be purged with inert gas (probably argon) beforea fill
• leak-tightness
– all the welds of ICARUS vessel were tested for Helium-tightness byvacuum pumping in the volume of the walls themselves
– all the welds of the FLARE tank will be tested using automated Ul-trasonic Technology. More about leaks in the corresponding section.
In addition to these factors, which may indicate that attaining the ultra-highlevels of purity may be considerably more challenging in a large commercial tankand which will be examined in this note, there are several other factors makingthe large volume easier to purify than the ICARUS detector:
• time factor: continuous purification process monotonically reduces theamount of oxygen in the inner volume (in the absence of leaks). Long filltime, of the order of 9 months, permits removal of a very large amountof oxygen before the start of data taking. This factor also reduces theimpact of out-gassing.
• surface-to-volume ratio. The contaminating oxygen comes primarily fromthe surfaces tank walls and the readout cables. These surfaces grow like asquare of linear dimensions, hence their effect on the argon purity dimin-ishes inversely with the linear dimensions of the tank
3
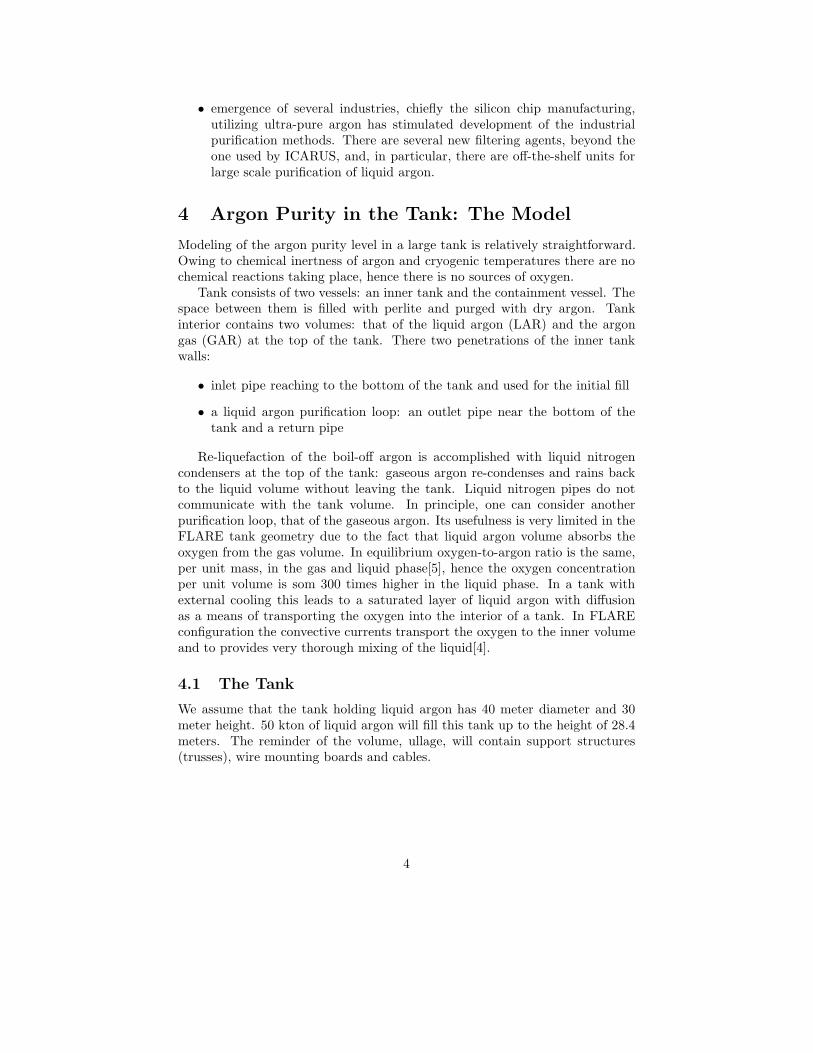
• emergence of several industries, chiefly the silicon chip manufacturing,utilizing ultra-pure argon has stimulated development of the industrialpurification methods. There are several new filtering agents, beyond theone used by ICARUS, and, in particular, there are off-the-shelf units forlarge scale purification of liquid argon.
4 Argon Purity in the Tank: The Model
Modeling of the argon purity level in a large tank is relatively straightforward.Owing to chemical inertness of argon and cryogenic temperatures there are nochemical reactions taking place, hence there is no sources of oxygen.
Tank consists of two vessels: an inner tank and the containment vessel. Thespace between them is filled with perlite and purged with dry argon. Tankinterior contains two volumes: that of the liquid argon (LAR) and the argongas (GAR) at the top of the tank. There two penetrations of the inner tankwalls:
• inlet pipe reaching to the bottom of the tank and used for the initial fill
• a liquid argon purification loop: an outlet pipe near the bottom of thetank and a return pipe
Re-liquefaction of the boil-off argon is accomplished with liquid nitrogencondensers at the top of the tank: gaseous argon re-condenses and rains backto the liquid volume without leaving the tank. Liquid nitrogen pipes do notcommunicate with the tank volume. In principle, one can consider anotherpurification loop, that of the gaseous argon. Its usefulness is very limited in theFLARE tank geometry due to the fact that liquid argon volume absorbs theoxygen from the gas volume. In equilibrium oxygen-to-argon ratio is the same,per unit mass, in the gas and liquid phase[5], hence the oxygen concentrationper unit volume is som 300 times higher in the liquid phase. In a tank withexternal cooling this leads to a saturated layer of liquid argon with diffusionas a means of transporting the oxygen into the interior of a tank. In FLAREconfiguration the convective currents transport the oxygen to the inner volumeand to provides very thorough mixing of the liquid[4].
4.1 The Tank
We assume that the tank holding liquid argon has 40 meter diameter and 30meter height. 50 kton of liquid argon will fill this tank up to the height of 28.4meters. The reminder of the volume, ullage, will contain support structures(trusses), wire mounting boards and cables.
4
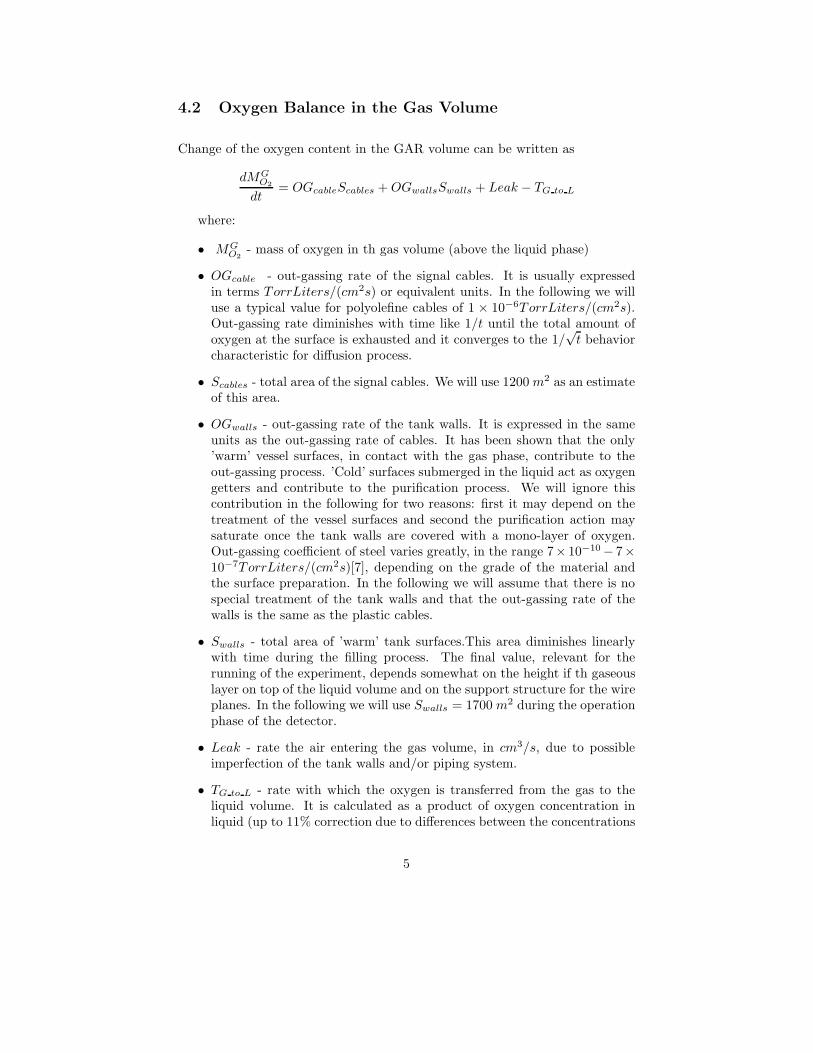
4.2 Oxygen Balance in the Gas Volume
Change of the oxygen content in the GAR volume can be written as
dMGO2
dt= OGcableScables + OGwallsSwalls + Leak − TG to L
where:
• MGO2
- mass of oxygen in th gas volume (above the liquid phase)
• OGcable - out-gassing rate of the signal cables. It is usually expressedin terms TorrLiters/(cm2s) or equivalent units. In the following we willuse a typical value for polyolefine cables of 1 × 10⁻⁶TorrLiters/(cm2s).Out-gassing rate diminishes with time like 1/t until the total amount ofoxygen at the surface is exhausted and it converges to the 1/
√t behavior
characteristic for diffusion process.
• Scables - total area of the signal cables. We will use 1200 m2 as an estimateof this area.
• OGwalls - out-gassing rate of the tank walls. It is expressed in the sameunits as the out-gassing rate of cables. It has been shown that the only’warm’ vessel surfaces, in contact with the gas phase, contribute to theout-gassing process. ’Cold’ surfaces submerged in the liquid act as oxygengetters and contribute to the purification process. We will ignore thiscontribution in the following for two reasons: first it may depend on thetreatment of the vessel surfaces and second the purification action maysaturate once the tank walls are covered with a mono-layer of oxygen.Out-gassing coefficient of steel varies greatly, in the range 7× 10⁻¹⁰ − 7×10⁻⁷TorrLiters/(cm2s)[7], depending on the grade of the material andthe surface preparation. In the following we will assume that there is nospecial treatment of the tank walls and that the out-gassing rate of thewalls is the same as the plastic cables.
• Swalls - total area of ’warm’ tank surfaces.This area diminishes linearlywith time during the filling process. The final value, relevant for therunning of the experiment, depends somewhat on the height if th gaseouslayer on top of the liquid volume and on the support structure for the wireplanes. In the following we will use Swalls = 1700 m2 during the operationphase of the detector.
• Leak - rate the air entering the gas volume, in cm3/s, due to possibleimperfection of the tank walls and/or piping system.
• TG to L - rate with which the oxygen is transferred from the gas to theliquid volume. It is calculated as a product of oxygen concentration inliquid (up to 11% correction due to differences between the concentrations
5
in gas and liquid phases) and a rate of the downward mass transfer nearthe surface of the tank. If calculated amount of oxygen transfered to liquidvolume in a given amount of time exceeds the total amount of oxygen inthe gas phase, the latter is used instead.
As mentioned before a possible reduction of the oxygen content in the gasphase with a dedicated gas purification system is neglected. Its inclusion in themodel with GAR recirculation rate of 1000 m3/hour changes (improves) thelevel of purity in LAR by 10 − 20%. This improvement is realized, however,only at very late times when the argon purity is already at very high levels.Gas phase purification is effective in removing the oxygen out-gassed from thematerials and their contribution to the oxygen level in the liquid is likely to bemuch smaller than the contribution of the input material during the fill time.
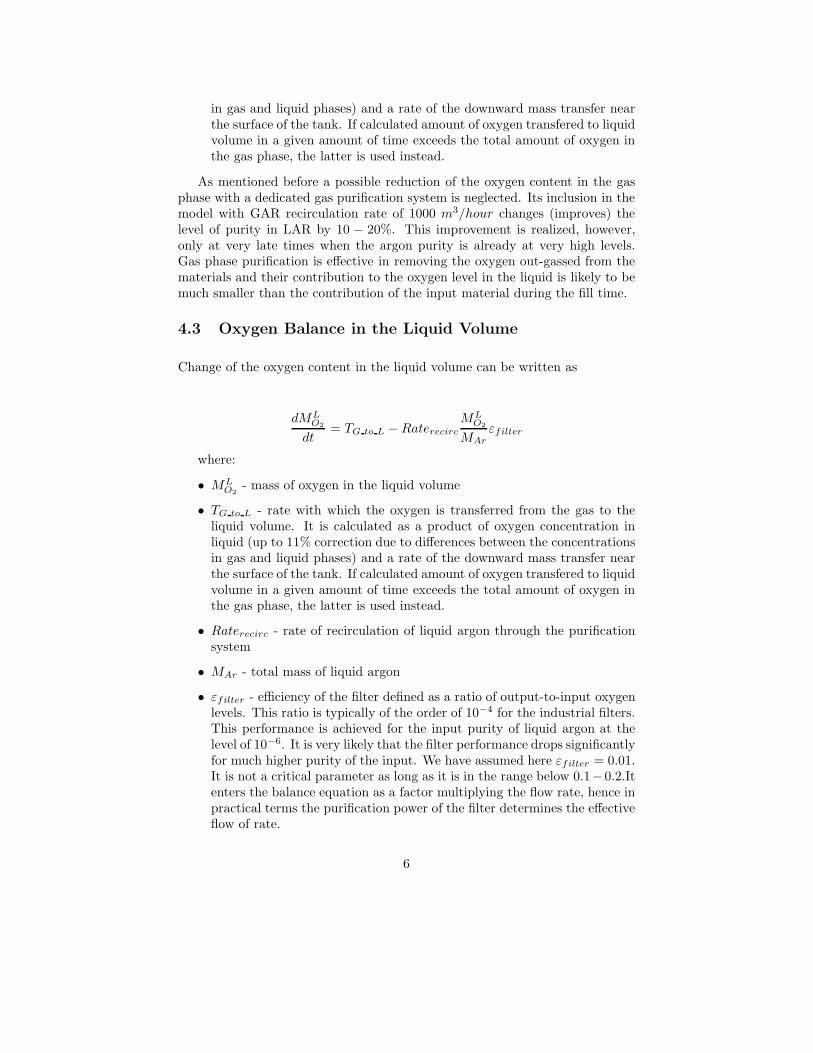
4.3 Oxygen Balance in the Liquid Volume
Change of the oxygen content in the liquid volume can be written as
dMLO2
dt= TG to L − Raterecirc
MLO2
MArεfilter
where:
• MLO2
- mass of oxygen in the liquid volume
• TG to L - rate with which the oxygen is transferred from the gas to theliquid volume. It is calculated as a product of oxygen concentration inliquid (up to 11% correction due to differences between the concentrationsin gas and liquid phases) and a rate of the downward mass transfer nearthe surface of the tank. If calculated amount of oxygen transfered to liquidvolume in a given amount of time exceeds the total amount of oxygen inthe gas phase, the latter is used instead.
• Raterecirc - rate of recirculation of liquid argon through the purificationsystem
• MAr - total mass of liquid argon
• εfilter - efficiency of the filter defined as a ratio of output-to-input oxygenlevels. This ratio is typically of the order of 10−4 for the industrial filters.This performance is achieved for the input purity of liquid argon at thelevel of 10−6. It is very likely that the filter performance drops significantlyfor much higher purity of the input. We have assumed here εfilter = 0.01.It is not a critical parameter as long as it is in the range below 0.1−0.2.Itenters the balance equation as a factor multiplying the flow rate, hence inpractical terms the purification power of the filter determines the effectiveflow of rate.
6
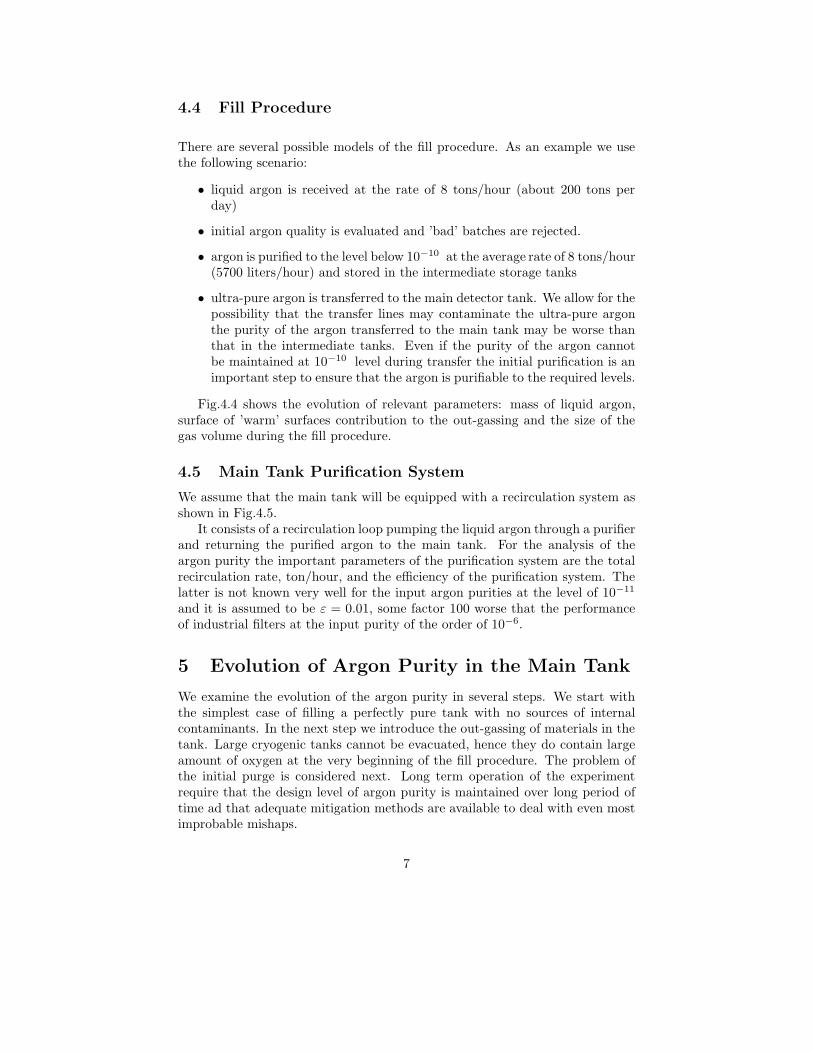
4.4 Fill Procedure
There are several possible models of the fill procedure. As an example we usethe following scenario:
• liquid argon is received at the rate of 8 tons/hour (about 200 tons perday)
• initial argon quality is evaluated and ’bad’ batches are rejected.
• argon is purified to the level below 10−10 at the average rate of 8 tons/hour(5700 liters/hour) and stored in the intermediate storage tanks
• ultra-pure argon is transferred to the main detector tank. We allow for thepossibility that the transfer lines may contaminate the ultra-pure argonthe purity of the argon transferred to the main tank may be worse thanthat in the intermediate tanks. Even if the purity of the argon cannotbe maintained at 10−10 level during transfer the initial purification is animportant step to ensure that the argon is purifiable to the required levels.
Fig.4.4 shows the evolution of relevant parameters: mass of liquid argon,surface of ’warm’ surfaces contribution to the out-gassing and the size of thegas volume during the fill procedure.
4.5 Main Tank Purification System
We assume that the main tank will be equipped with a recirculation system asshown in Fig.4.5.
It consists of a recirculation loop pumping the liquid argon through a purifierand returning the purified argon to the main tank. For the analysis of theargon purity the important parameters of the purification system are the totalrecirculation rate, ton/hour, and the efficiency of the purification system. Thelatter is not known very well for the input argon purities at the level of 10−11
and it is assumed to be ε = 0.01, some factor 100 worse that the performanceof industrial filters at the input purity of the order of 10−6.
5 Evolution of Argon Purity in the Main Tank
We examine the evolution of the argon purity in several steps. We start withthe simplest case of filling a perfectly pure tank with no sources of internalcontaminants. In the next step we introduce the out-gassing of materials in thetank. Large cryogenic tanks cannot be evacuated, hence they do contain largeamount of oxygen at the very beginning of the fill procedure. The problem ofthe initial purge is considered next. Long term operation of the experimentrequire that the design level of argon purity is maintained over long period oftime ad that adequate mitigation methods are available to deal with even mostimprobable mishaps.
7
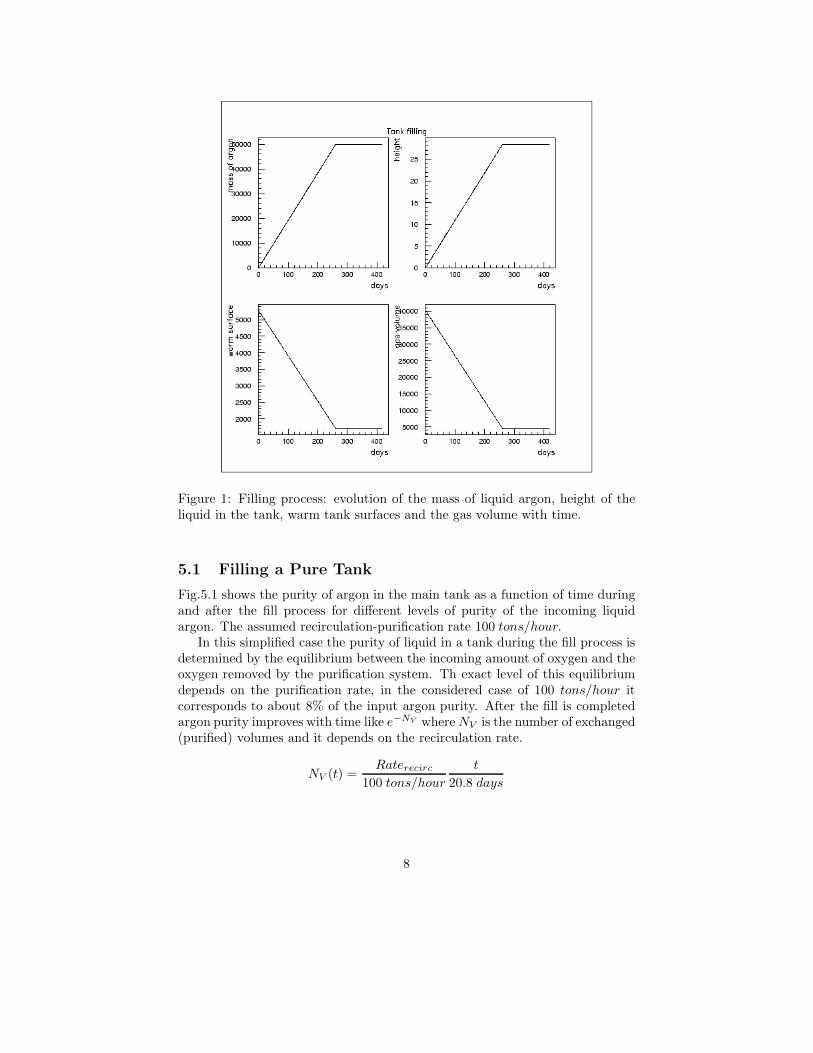
Figure 1: Filling process: evolution of the mass of liquid argon, height of theliquid in the tank, warm tank surfaces and the gas volume with time.
5.1 Filling a Pure Tank
Fig.5.1 shows the purity of argon in the main tank as a function of time duringand after the fill process for different levels of purity of the incoming liquidargon. The assumed recirculation-purification rate 100 tons/hour.
In this simplified case the purity of liquid in a tank during the fill process isdetermined by the equilibrium between the incoming amount of oxygen and theoxygen removed by the purification system. Th exact level of this equilibriumdepends on the purification rate, in the considered case of 100 tons/hour itcorresponds to about 8% of the input argon purity. After the fill is completedargon purity improves with time like e−NV where NV is the number of exchanged(purified) volumes and it depends on the recirculation rate.
NV (t) =Raterecirc
100 tons/hour
t
20.8 days
8
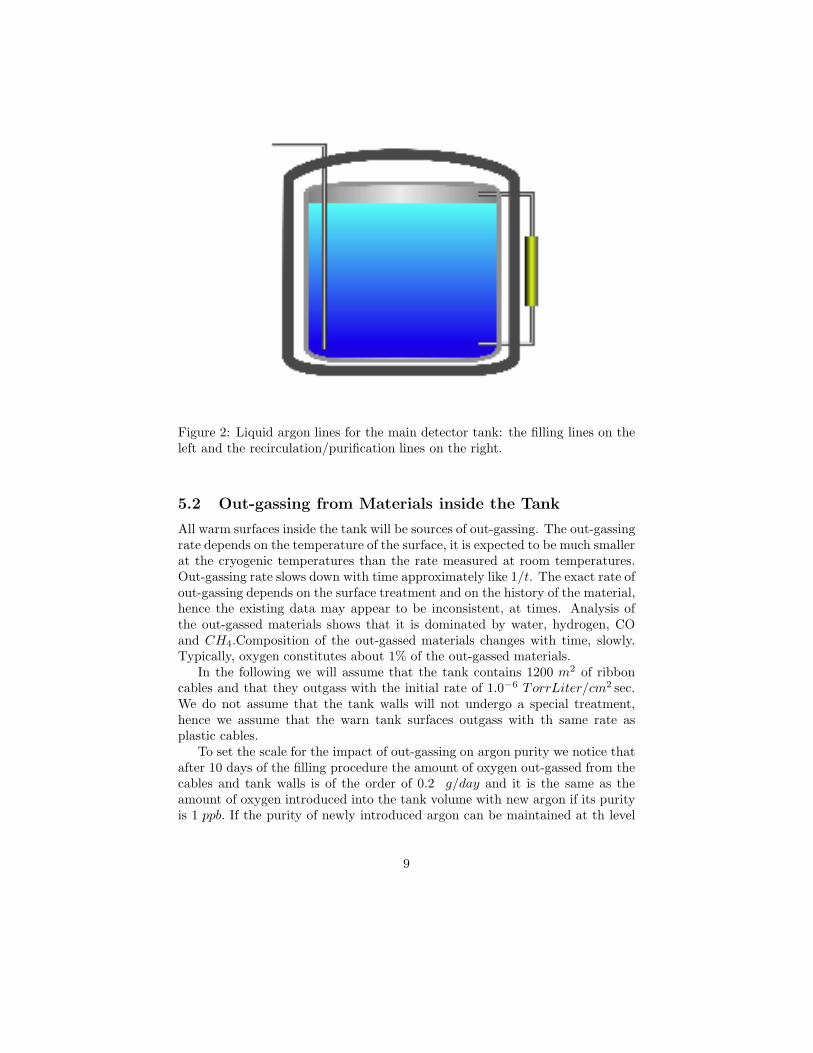
Figure 2: Liquid argon lines for the main detector tank: the filling lines on theleft and the recirculation/purification lines on the right.
5.2 Out-gassing from Materials inside the Tank
All warm surfaces inside the tank will be sources of out-gassing. The out-gassingrate depends on the temperature of the surface, it is expected to be much smallerat the cryogenic temperatures than the rate measured at room temperatures.Out-gassing rate slows down with time approximately like 1/t. The exact rate ofout-gassing depends on the surface treatment and on the history of the material,hence the existing data may appear to be inconsistent, at times. Analysis ofthe out-gassed materials shows that it is dominated by water, hydrogen, COand CH4.Composition of the out-gassed materials changes with time, slowly.Typically, oxygen constitutes about 1% of the out-gassed materials.
In the following we will assume that the tank contains 1200 m2 of ribboncables and that they outgass with the initial rate of 1.0−6 TorrLiter/cm2 sec.We do not assume that the tank walls will not undergo a special treatment,hence we assume that the warn tank surfaces outgass with th same rate asplastic cables.
To set the scale for the impact of out-gassing on argon purity we notice thatafter 10 days of the filling procedure the amount of oxygen out-gassed from thecables and tank walls is of the order of 0.2 g/day and it is the same as theamount of oxygen introduced into the tank volume with new argon if its purityis 1 ppb. If the purity of newly introduced argon can be maintained at th level
9
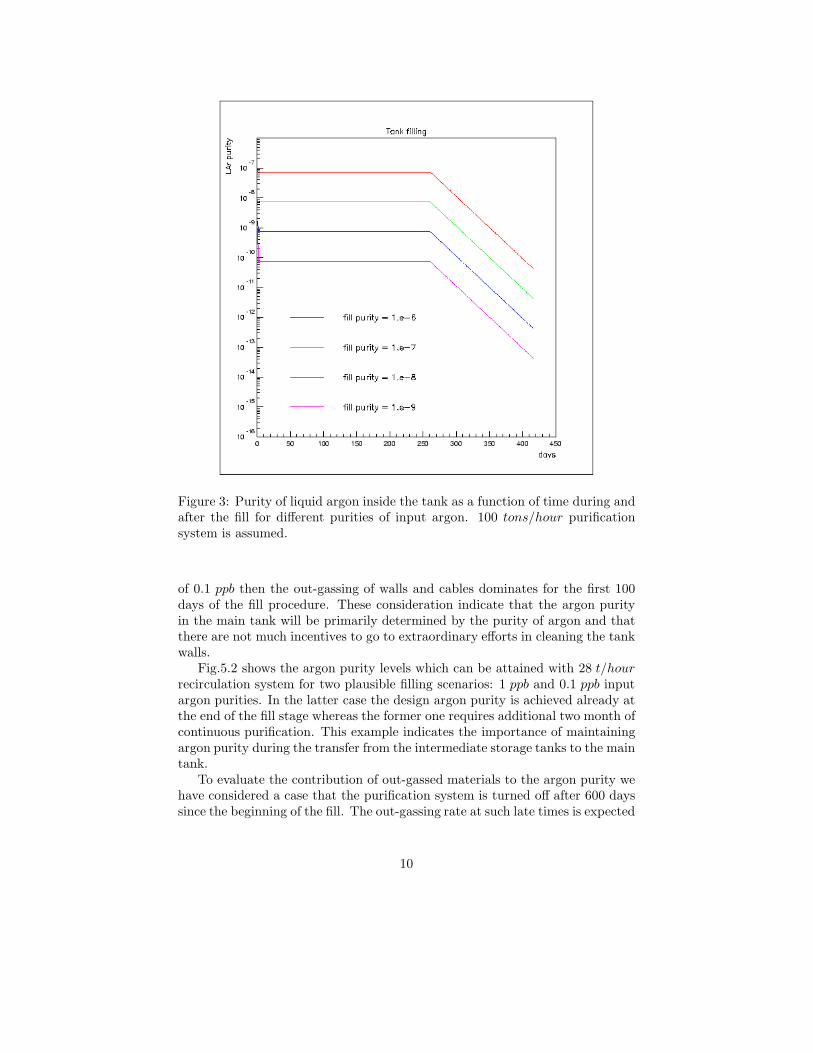
Figure 3: Purity of liquid argon inside the tank as a function of time during andafter the fill for different purities of input argon. 100 tons/hour purificationsystem is assumed.
of 0.1 ppb then the out-gassing of walls and cables dominates for the first 100days of the fill procedure. These consideration indicate that the argon purityin the main tank will be primarily determined by the purity of argon and thatthere are not much incentives to go to extraordinary efforts in cleaning the tankwalls.
Fig.5.2 shows the argon purity levels which can be attained with 28 t/hourrecirculation system for two plausible filling scenarios: 1 ppb and 0.1 ppb inputargon purities. In the latter case the design argon purity is achieved already atthe end of the fill stage whereas the former one requires additional two month ofcontinuous purification. This example indicates the importance of maintainingargon purity during the transfer from the intermediate storage tanks to the maintank.
To evaluate the contribution of out-gassed materials to the argon purity wehave considered a case that the purification system is turned off after 600 dayssince the beginning of the fill. The out-gassing rate at such late times is expected
10
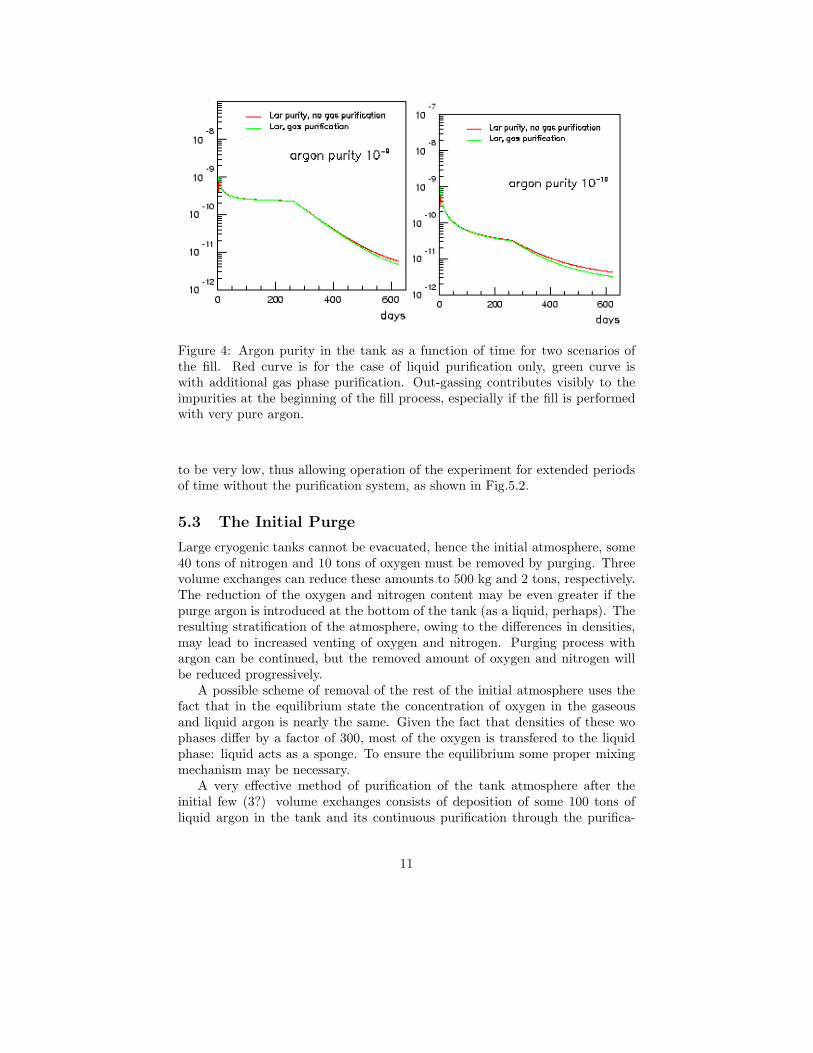
Figure 4: Argon purity in the tank as a function of time for two scenarios ofthe fill. Red curve is for the case of liquid purification only, green curve iswith additional gas phase purification. Out-gassing contributes visibly to theimpurities at the beginning of the fill process, especially if the fill is performedwith very pure argon.
to be very low, thus allowing operation of the experiment for extended periodsof time without the purification system, as shown in Fig.5.2.
5.3 The Initial Purge
Large cryogenic tanks cannot be evacuated, hence the initial atmosphere, some40 tons of nitrogen and 10 tons of oxygen must be removed by purging. Threevolume exchanges can reduce these amounts to 500 kg and 2 tons, respectively.The reduction of the oxygen and nitrogen content may be even greater if thepurge argon is introduced at the bottom of the tank (as a liquid, perhaps). Theresulting stratification of the atmosphere, owing to the differences in densities,may lead to increased venting of oxygen and nitrogen. Purging process withargon can be continued, but the removed amount of oxygen and nitrogen willbe reduced progressively.
A possible scheme of removal of the rest of the initial atmosphere uses thefact that in the equilibrium state the concentration of oxygen in the gaseousand liquid argon is nearly the same. Given the fact that densities of these wophases differ by a factor of 300, most of the oxygen is transfered to the liquidphase: liquid acts as a sponge. To ensure the equilibrium some proper mixingmechanism may be necessary.
A very effective method of purification of the tank atmosphere after theinitial few (3?) volume exchanges consists of deposition of some 100 tons ofliquid argon in the tank and its continuous purification through the purifica-
11
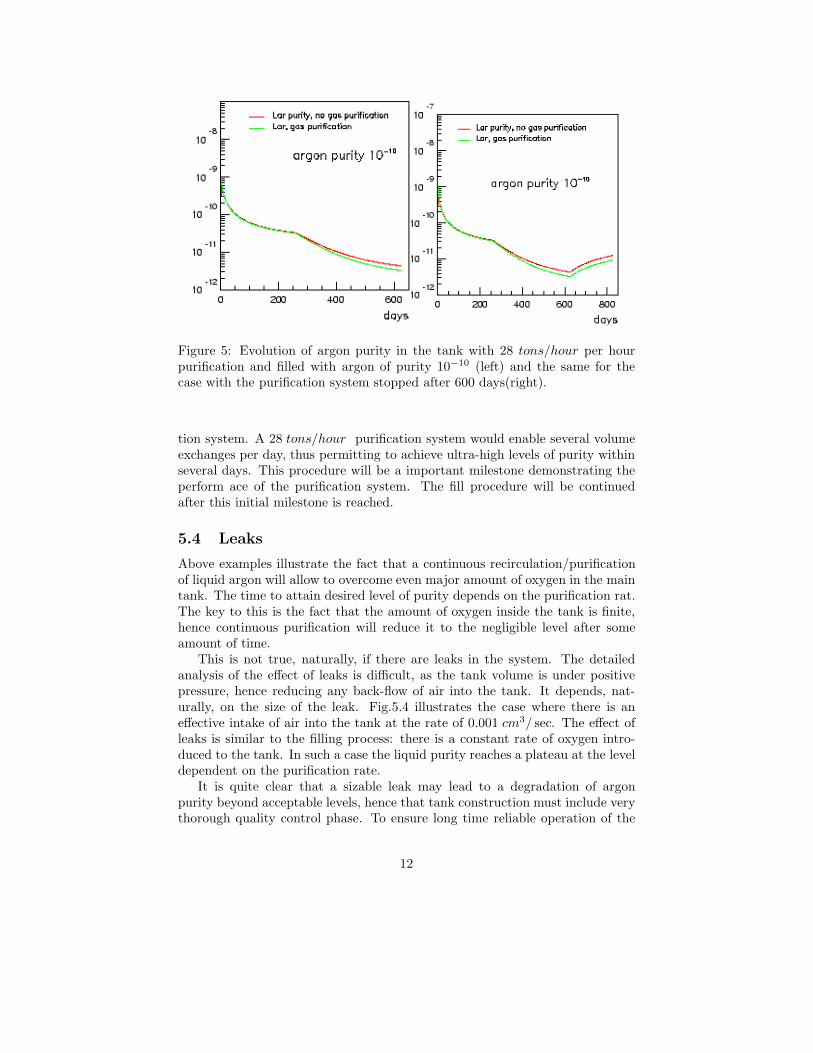
Figure 5: Evolution of argon purity in the tank with 28 tons/hour per hourpurification and filled with argon of purity 10−10 (left) and the same for thecase with the purification system stopped after 600 days(right).
tion system. A 28 tons/hour purification system would enable several volumeexchanges per day, thus permitting to achieve ultra-high levels of purity withinseveral days. This procedure will be a important milestone demonstrating theperform ace of the purification system. The fill procedure will be continuedafter this initial milestone is reached.
5.4 Leaks
Above examples illustrate the fact that a continuous recirculation/purificationof liquid argon will allow to overcome even major amount of oxygen in the maintank. The time to attain desired level of purity depends on the purification rat.The key to this is the fact that the amount of oxygen inside the tank is finite,hence continuous purification will reduce it to the negligible level after someamount of time.
This is not true, naturally, if there are leaks in the system. The detailedanalysis of the effect of leaks is difficult, as the tank volume is under positivepressure, hence reducing any back-flow of air into the tank. It depends, nat-urally, on the size of the leak. Fig.5.4 illustrates the case where there is aneffective intake of air into the tank at the rate of 0.001 cm3/ sec. The effect ofleaks is similar to the filling process: there is a constant rate of oxygen intro-duced to the tank. In such a case the liquid purity reaches a plateau at the leveldependent on the purification rate.
It is quite clear that a sizable leak may lead to a degradation of argonpurity beyond acceptable levels, hence that tank construction must include verythorough quality control phase. To ensure long time reliable operation of the
12
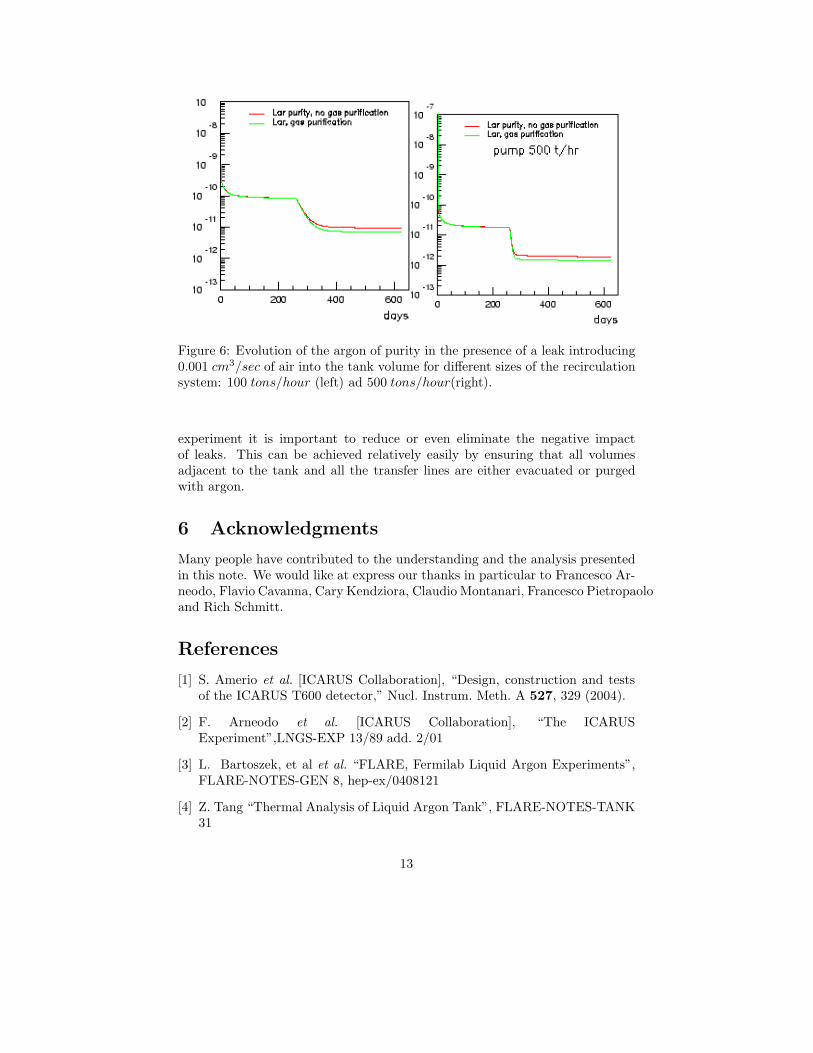
Figure 6: Evolution of the argon of purity in the presence of a leak introducing0.001 cm3/sec of air into the tank volume for different sizes of the recirculationsystem: 100 tons/hour (left) ad 500 tons/hour(right).
experiment it is important to reduce or even eliminate the negative impactof leaks. This can be achieved relatively easily by ensuring that all volumesadjacent to the tank and all the transfer lines are either evacuated or purgedwith argon.
6 Acknowledgments
Many people have contributed to the understanding and the analysis presentedin this note. We would like at express our thanks in particular to Francesco Ar-neodo, Flavio Cavanna, Cary Kendziora, Claudio Montanari, Francesco Pietropaoloand Rich Schmitt.
References
[1] S. Amerio et al. [ICARUS Collaboration], “Design, construction and testsof the ICARUS T600 detector,” Nucl. Instrum. Meth. A 527, 329 (2004).
[2] F. Arneodo et al. [ICARUS Collaboration], “The ICARUSExperiment”,LNGS-EXP 13/89 add. 2/01
[3] L. Bartoszek, et al et al. “FLARE, Fermilab Liquid Argon Experiments”,FLARE-NOTES-GEN 8, hep-ex/0408121
[4] Z. Tang “Thermal Analysis of Liquid Argon Tank”, FLARE-NOTES-TANK31
13
[5] R. Schmitt, private communication
[6] S. Amoruso et al., “Analysis of the liquid argon purity in the ICARUS T600TPC,” Nucl. Instrum. Meth. A 516, 68 (2004).
[7] see for example http://www.ee.ualberta.ca/˜schmaus/vacf/outgas.html.Large collection of outgassing data is assembled by NASA athttp://outgassing.nasa.gov/
14