Embed Size (px)
Citation preview
1
Argo Group:
Driving Growth and Value
for Shareholders
May 2019
2
This presentation may include forward-looking statements, both with respect
to Argo Group and its industry, that reflect our current views with respect to
future events and financial performance. These statements are made
pursuant to the safe harbor provisions of the Private Securities Litigation
Reform act of 1995. Forward-looking statements include all statements that do
not relate solely to historical or current facts, and can be identified by the use
of words such as “expect,” “intend,” “plan,” “believe,” “do not believe,” “aim,”
“project,” “anticipate,” “seek,” “will,” “likely,” “assume,” “estimate,” “may,”
“continue,” “guidance,” “objective,” “outlook,” “trends,” “future,” “could,”
“would,” “should,” “target,” “on track,” and similar expressions of a future or
forward-looking nature. All forward-looking statements address matters that
involve risks and uncertainties, many of which are beyond Argo Group’s
control. Accordingly, there are or will be important factors that could cause
actual results to differ materially from those indicated in such statements and,
therefore, you should not place undue reliance on any such statements. We
believe that these factors include, but are not limited to, the following: 1)
unpredictability and severity of catastrophic events; 2) rating agency actions;
3) adequacy of our risk management and loss limitation methods; 4) cyclicality
of demand and pricing in the insurance and reinsurance markets; 5) statutory
or regulatory developments including tax policy, reinsurance and other
regulatory matters; 6) our ability to implement our business strategy; 7)
adequacy of our loss reserves; 8) continued availability of capital and financial
resources; 9) retention of key personnel; 10) competition; 11) potential loss of
business from one or more major insurance or reinsurance brokers; 12) our
ability to implement, successfully and on a timely basis, complex
infrastructure, distribution capabilities, systems, procedures, and internal
controls, and to develop accurate actuarial data to support the business and
regulatory and reporting requirements; 13) general economic and market
conditions (including inflation, volatility in the credit and capital markets,
interest rates, and foreign currency exchange rates); 14) the integration of
businesses we may acquire or new business ventures we may start; 15) the
effect on our investment portfolios of changing financial market conditions
including inflation, interest rates, liquidity and other factors; 16) acts of
terrorism or outbreak of war; 17) shareholder activism and 18) availability of
reinsurance and retrocessional coverage, as well as management’s response
to any of the aforementioned factors.
In addition, any estimates relating to loss events involve the exercise of
considerable judgments and reflect a combination of ground-up evaluations,
information available to date from brokers, market intelligence, initial tentative
loss reports, and other sources. The actuarial range of reserves and
management’s best estimate is based on our then-current state of knowledge
including explicit and implicit assumptions relating to the pattern of claim
development, the expected ultimate settlement amount, inflation and
dependencies between lines of business. Our internal models are used to
consider the distribution for reserving risk around this best estimate and
predict the potential range of outcomes. However, due to the complexity of
factors contributing to the losses and preliminary nature of the information
used to prepare these estimates, there can be no assurance that Argo
Group’s ultimate losses will remain within the stated amount.
The foregoing review of important factors should not be construed as
exhaustive and should be read in conjunction with the other cautionary
statements that are included herein and elsewhere, including the risk factors
included in our most recent reports on Form 10-K and Form 10-Q and other
documents of Argo Group on file with or furnished to the U.S. Securities and
Exchange Commissions (“SEC”). Any forward-looking statements made in this
presentation are qualified by these cautionary statements, and there can be
no assurance that the actual results or developments anticipated by Argo
Group will be realized, or even if substantially realized, that they will have the
expected consequences to or effects on, Argo Group or its business or
operations. Except as required by law, Argo Group undertakes no obligation to
update publicly or revise forward-looking statements, whether as a result of
new information, future developments or otherwise.
Forward-Looking Statements
3
Argo Group – Maximizing Value for Shareholders
Through Commitment to Strong Stewardship
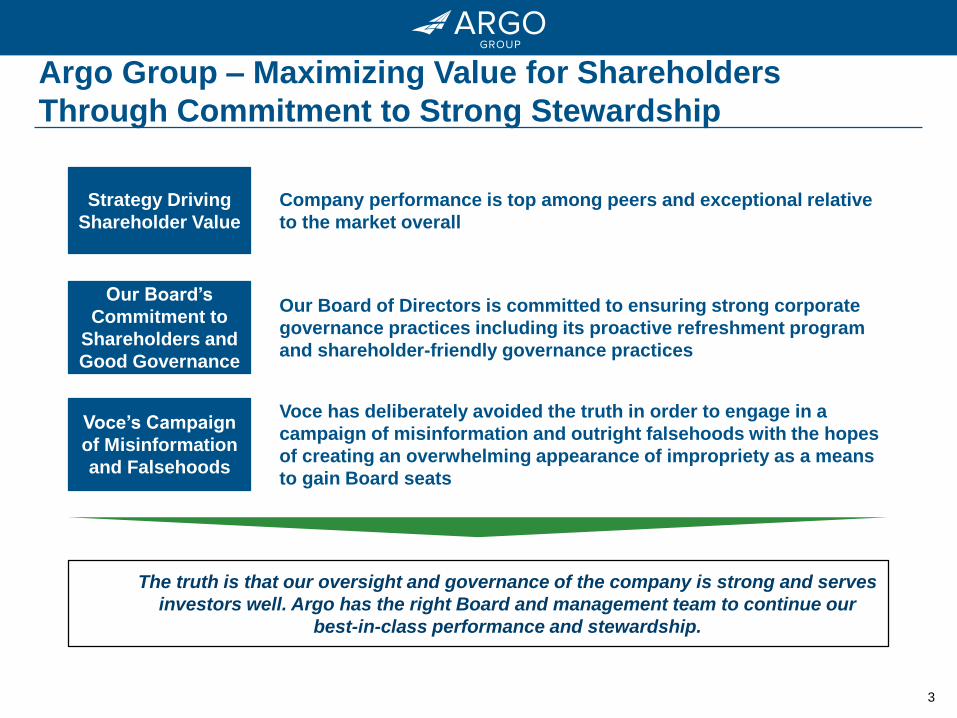
Company performance is top among peers and exceptional relative
to the market overall
Our Board of Directors is committed to ensuring strong corporate
governance practices including its proactive refreshment program
and shareholder-friendly governance practices
Voce has deliberately avoided the truth in order to engage in a
campaign of misinformation and outright falsehoods with the hopes
of creating an overwhelming appearance of impropriety as a means
to gain Board seats
The truth is that our oversight and governance of the company is strong and serves
investors well. Argo has the right Board and management team to continue our
best-in-class performance and stewardship.
Strategy Driving
Shareholder Value
Our Board’s
Commitment to
Shareholders and
Good Governance
Voce’s Campaign
of Misinformation
and Falsehoods
4
Argo’s Board and Management Team Consistently
Delivers Shareholder Value
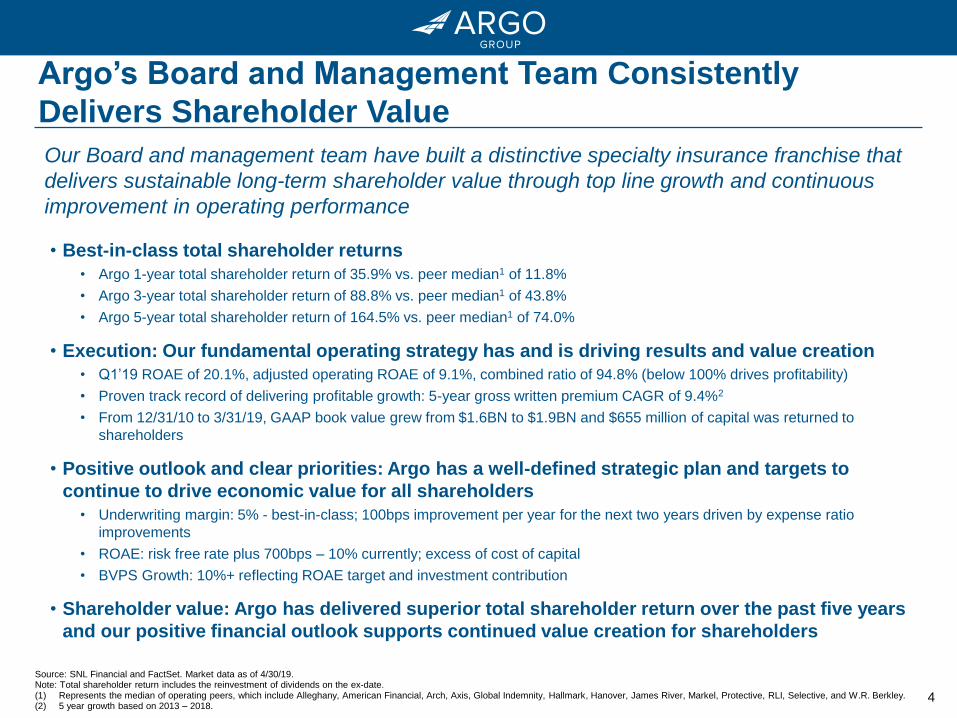
• Best-in-class total shareholder returns
• Argo 1-year total shareholder return of 35.9% vs. peer median1 of 11.8%
• Argo 3-year total shareholder return of 88.8% vs. peer median1 of 43.8%
• Argo 5-year total shareholder return of 164.5% vs. peer median1 of 74.0%
• Execution: Our fundamental operating strategy has and is driving results and value creation
• Q1’19 ROAE of 20.1%, adjusted operating ROAE of 9.1%, combined ratio of 94.8% (below 100% drives profitability)
• Proven track record of delivering profitable growth: 5-year gross written premium CAGR of 9.4%2
• From 12/31/10 to 3/31/19, GAAP book value grew from $1.6BN to $1.9BN and $655 million of capital was returned to
shareholders
• Positive outlook and clear priorities: Argo has a well-defined strategic plan and targets to
continue to drive economic value for all shareholders
• Underwriting margin: 5% - best-in-class; 100bps improvement per year for the next two years driven by expense ratio
improvements
• ROAE: risk free rate plus 700bps – 10% currently; excess of cost of capital
• BVPS Growth: 10%+ reflecting ROAE target and investment contribution
• Shareholder value: Argo has delivered superior total shareholder return over the past five years
and our positive financial outlook supports continued value creation for shareholders
Our Board and management team have built a distinctive specialty insurance franchise that
delivers sustainable long-term shareholder value through top line growth and continuous
improvement in operating performance
Source: SNL Financial and FactSet. Market data as of 4/30/19. Note: Total shareholder return includes the reinvestment of dividends on the ex-date. (1) Represents the median of operating peers, which include Alleghany, American Financial, Arch, Axis, Global Indemnity, Hallmark, Hanover, James River, Markel, Protective, RLI, Selective, and W.R. Berkley. (2) 5 year growth based on 2013 – 2018.
5
Superior Total Shareholder Returns
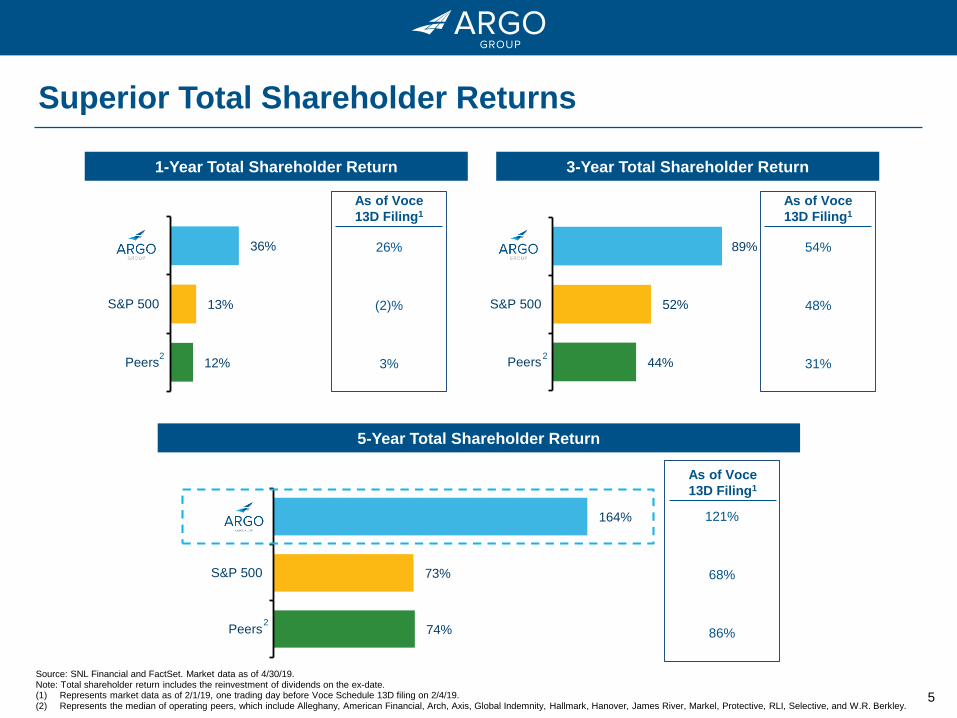
Source: SNL Financial and FactSet. Market data as of 4/30/19. Note: Total shareholder return includes the reinvestment of dividends on the ex-date. (1) Represents market data as of 2/1/19, one trading day before Voce Schedule 13D filing on 2/4/19.(2) Represents the median of operating peers, which include Alleghany, American Financial, Arch, Axis, Global Indemnity, Hallmark, Hanover, James River, Markel, Protective, RLI, Selective, and W.R. Berkley.
36%
13%
12%
Argo
S&P 500
Peers
89%
52%
44%
Argo
S&P 500
Peers
164%
73%
74%
Argo
S&P 500
Peers
3-Year Total Shareholder Return
5-Year Total Shareholder Return
1-Year Total Shareholder Return
22
2
As of Voce
13D Filing1
26%
(2)%
3%
54%
48%
31%
121%
68%
86%
As of Voce
13D Filing1
As of Voce
13D Filing1
6
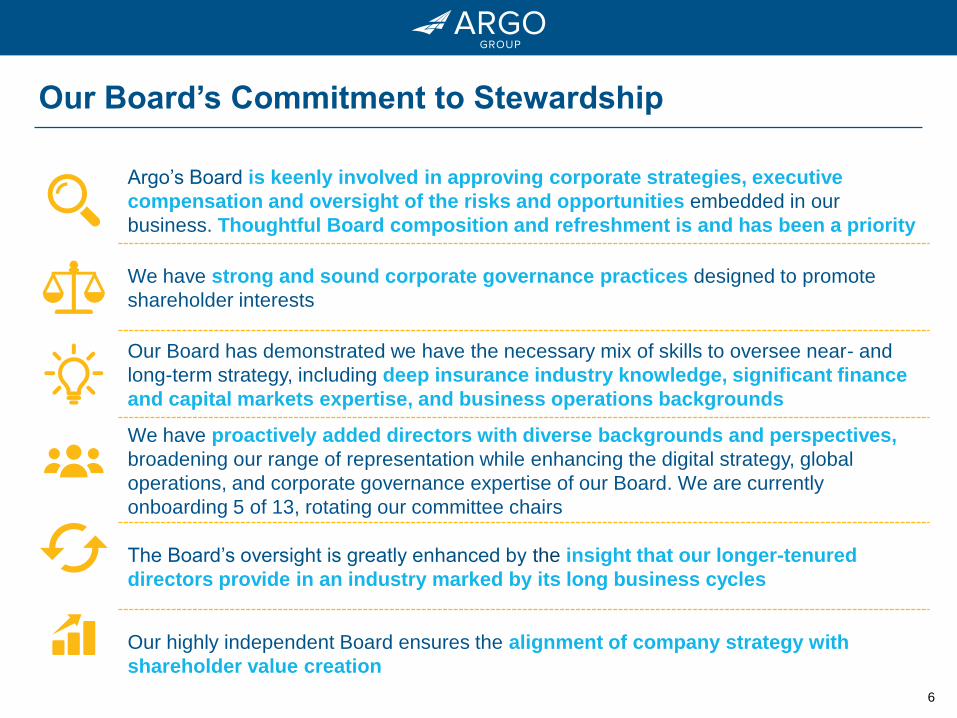
Our Board’s Commitment to Stewardship
Argo’s Board is keenly involved in approving corporate strategies, executive
compensation and oversight of the risks and opportunities embedded in our
business. Thoughtful Board composition and refreshment is and has been a priority
We have strong and sound corporate governance practices designed to promote
shareholder interests
Our Board has demonstrated we have the necessary mix of skills to oversee near- and
long-term strategy, including deep insurance industry knowledge, significant finance
and capital markets expertise, and business operations backgrounds
We have proactively added directors with diverse backgrounds and perspectives,
broadening our range of representation while enhancing the digital strategy, global
operations, and corporate governance expertise of our Board. We are currently
onboarding 5 of 13, rotating our committee chairs
The Board’s oversight is greatly enhanced by the insight that our longer-tenured
directors provide in an industry marked by its long business cycles
Our highly independent Board ensures the alignment of company strategy with
shareholder value creation
7
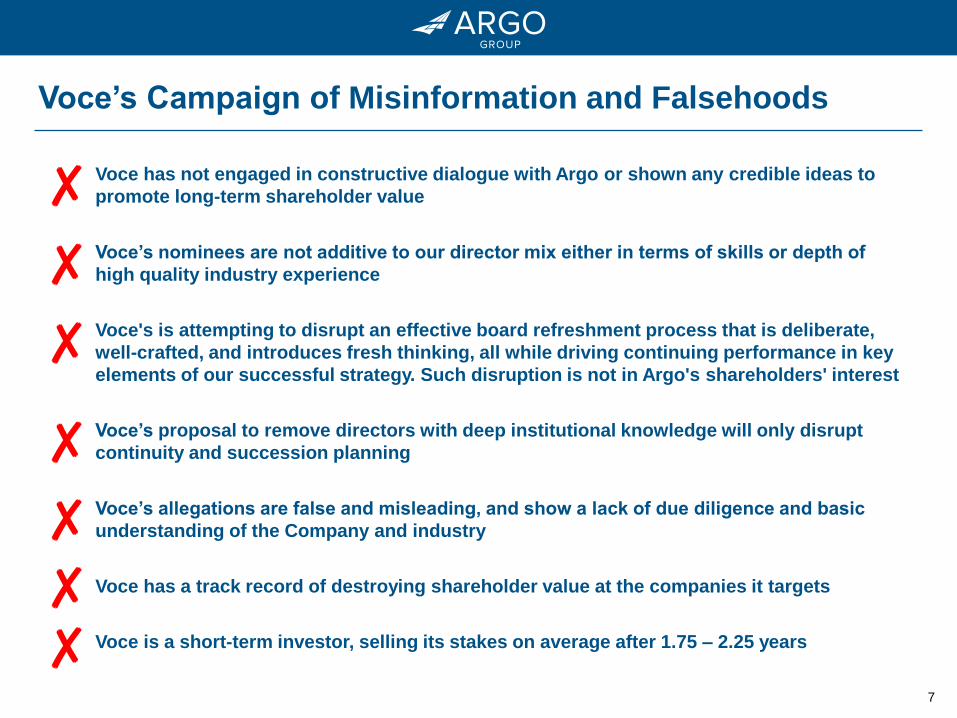
Voce’s Campaign of Misinformation and Falsehoods
Voce has not engaged in constructive dialogue with Argo or shown any credible ideas to
promote long-term shareholder value
Voce’s nominees are not additive to our director mix either in terms of skills or depth of
high quality industry experience
Voce's is attempting to disrupt an effective board refreshment process that is deliberate,
well-crafted, and introduces fresh thinking, all while driving continuing performance in key
elements of our successful strategy. Such disruption is not in Argo's shareholders' interest
Voce’s proposal to remove directors with deep institutional knowledge will only disrupt
continuity and succession planning
Voce’s allegations are false and misleading, and show a lack of due diligence and basic
understanding of the Company and industry
Voce has a track record of destroying shareholder value at the companies it targets
Voce is a short-term investor, selling its stakes on average after 1.75 – 2.25 years
✘
✘
✘
✘
✘
✘
✘
8
Today’s Agenda
Our Board’s Commitment to Investor Stewardship
4
Voce’s Campaign
5
Concluding Remarks
6
Argo has Generated Superior Shareholder Returns2
Argo’s Fundamental Operating Strategy is Delivering Results
3
Argo Overview
1
9
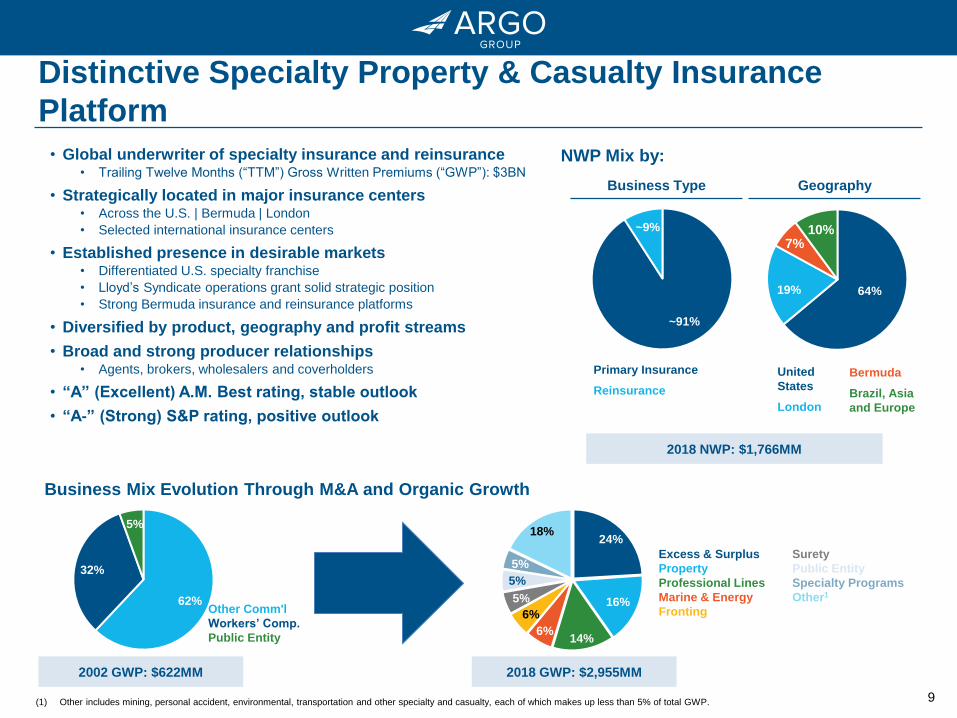
• Global underwriter of specialty insurance and reinsurance• Trailing Twelve Months (“TTM”) Gross Written Premiums (“GWP”): $3BN
• Strategically located in major insurance centers • Across the U.S. | Bermuda | London
• Selected international insurance centers
• Established presence in desirable markets • Differentiated U.S. specialty franchise
• Lloyd’s Syndicate operations grant solid strategic position
• Strong Bermuda insurance and reinsurance platforms
• Diversified by product, geography and profit streams
• Broad and strong producer relationships• Agents, brokers, wholesalers and coverholders
• “A” (Excellent) A.M. Best rating, stable outlook
• “A-” (Strong) S&P rating, positive outlook
Business Type
Primary Insurance
Reinsurance
Geography
United
States
London
Distinctive Specialty Property & Casualty Insurance
Platform
2018 NWP: $1,766MM
~91%
~9%
64%19%
7%10%
Business Mix Evolution Through M&A and Organic Growth
62%
32%
5%
Other Comm'l
Workers’ Comp.
Public Entity
24%
16%
14%6%
6%
5%
5%
5%
18%
2002 GWP: $622MM 2018 GWP: $2,955MM
NWP Mix by:
Bermuda
Brazil, Asia
and Europe
Excess & Surplus
Property
Professional Lines
Marine & Energy
Fronting
Surety
Public Entity
Specialty Programs
Other1
(1) Other includes mining, personal accident, environmental, transportation and other specialty and casualty, each of which makes up less than 5% of total GWP.
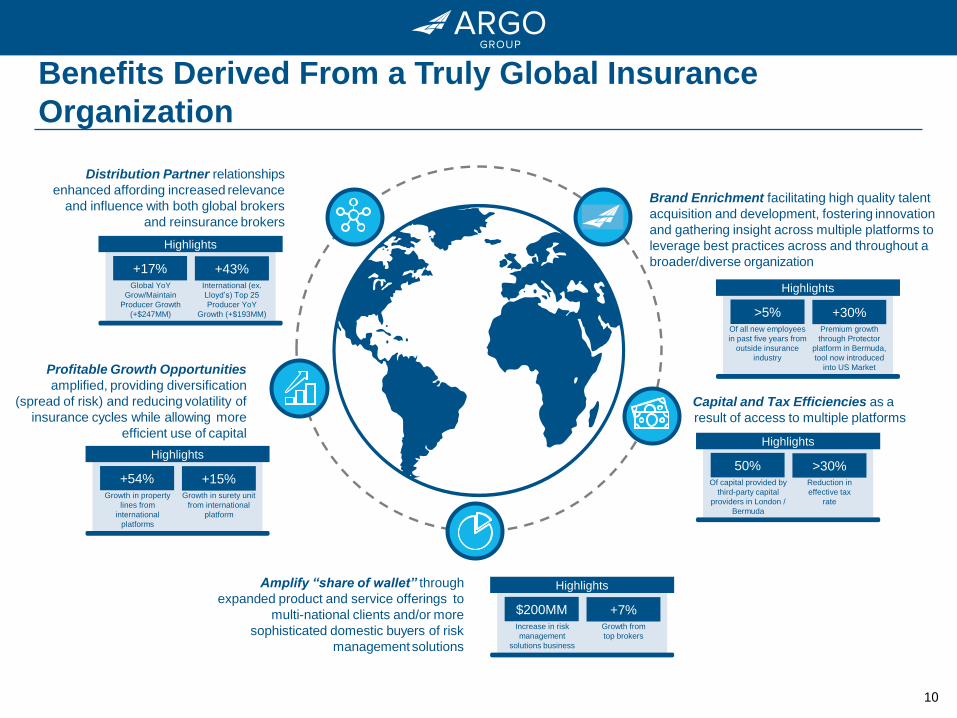
Distribution Partner relationships
enhanced affording increased relevance
and influence with both global brokers
and reinsurance brokers
Highlights
+17% +43%Global YoY
Grow/Maintain
Producer Growth
(+$247MM)
International (ex.
Lloyd’s) Top 25
Producer YoY
Growth (+$193MM)
Highlights
+54% +15%Growth in property
lines from
international
platforms
Growth in surety unit
from international
platform
Highlights
$200MM +7%Increase in risk
management
solutions business
Growth from
top brokers
Benefits Derived From a Truly Global Insurance
Organization
Brand Enrichment facilitating high quality talent
acquisition and development, fostering innovation
and gathering insight across multiple platforms to
leverage best practices across and throughout a
broader/diverse organization
Profitable Growth Opportunities
amplified, providing diversification
(spread of risk) and reducing volatility of
insurance cycles while allowing more
efficient use of capital
Amplify “share of wallet” through
expanded product and service offerings to
multi-national clients and/or more
sophisticated domestic buyers of risk
managementsolutions
Highlights
>5% +30%Of all new employees
in past five years from
outside insurance
industry
Premium growth
through Protector
platform in Bermuda,
tool now introduced
into US Market
Capital and Tax Efficiencies as a
result of access to multiple platforms
Highlights
50% >30%Of capital provided by
third-party capital
providers in London /
Bermuda
Reduction in
effective tax
rate
10
11
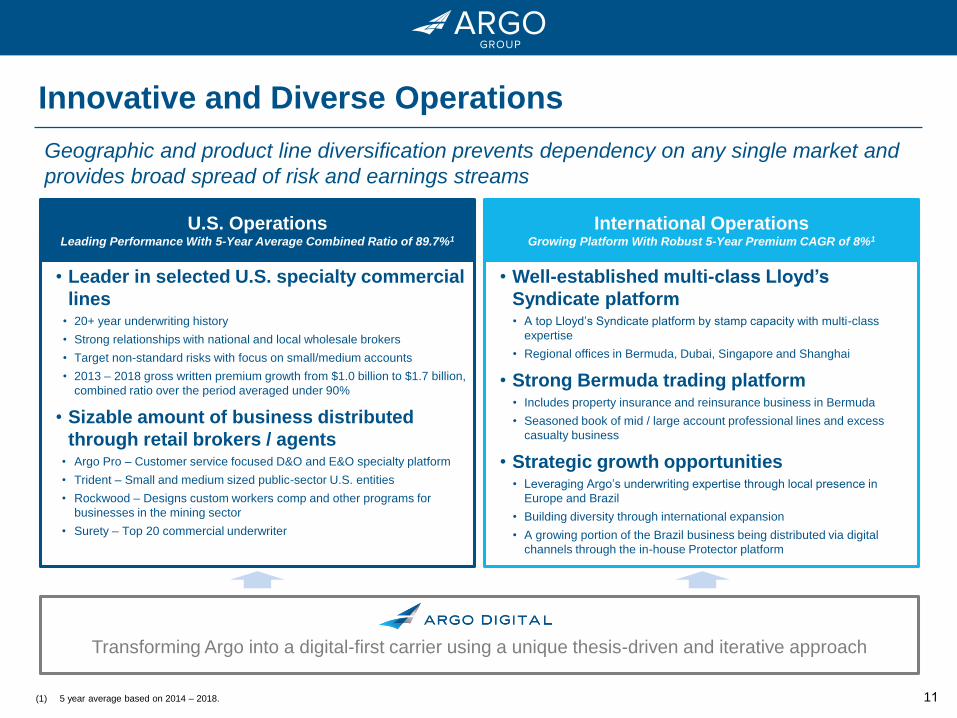
Innovative and Diverse Operations
• Well-established multi-class Lloyd’s
Syndicate platform• A top Lloyd’s Syndicate platform by stamp capacity with multi-class
expertise
• Regional offices in Bermuda, Dubai, Singapore and Shanghai
• Strong Bermuda trading platform• Includes property insurance and reinsurance business in Bermuda
• Seasoned book of mid / large account professional lines and excess
casualty business
• Strategic growth opportunities• Leveraging Argo’s underwriting expertise through local presence in
Europe and Brazil
• Building diversity through international expansion
• A growing portion of the Brazil business being distributed via digital
channels through the in-house Protector platform
• Leader in selected U.S. specialty commercial
lines• 20+ year underwriting history
• Strong relationships with national and local wholesale brokers
• Target non-standard risks with focus on small/medium accounts
• 2013 – 2018 gross written premium growth from $1.0 billion to $1.7 billion,
combined ratio over the period averaged under 90%
• Sizable amount of business distributed
through retail brokers / agents• Argo Pro – Customer service focused D&O and E&O specialty platform
• Trident – Small and medium sized public-sector U.S. entities
• Rockwood – Designs custom workers comp and other programs for
businesses in the mining sector
• Surety – Top 20 commercial underwriter
U.S. OperationsLeading Performance With 5-Year Average Combined Ratio of 89.7%1
International OperationsGrowing Platform With Robust 5-Year Premium CAGR of 8%1
Transforming Argo into a digital-first carrier using a unique thesis-driven and iterative approach
Geographic and product line diversification prevents dependency on any single market and
provides broad spread of risk and earnings streams
(1) 5 year average based on 2014 – 2018.
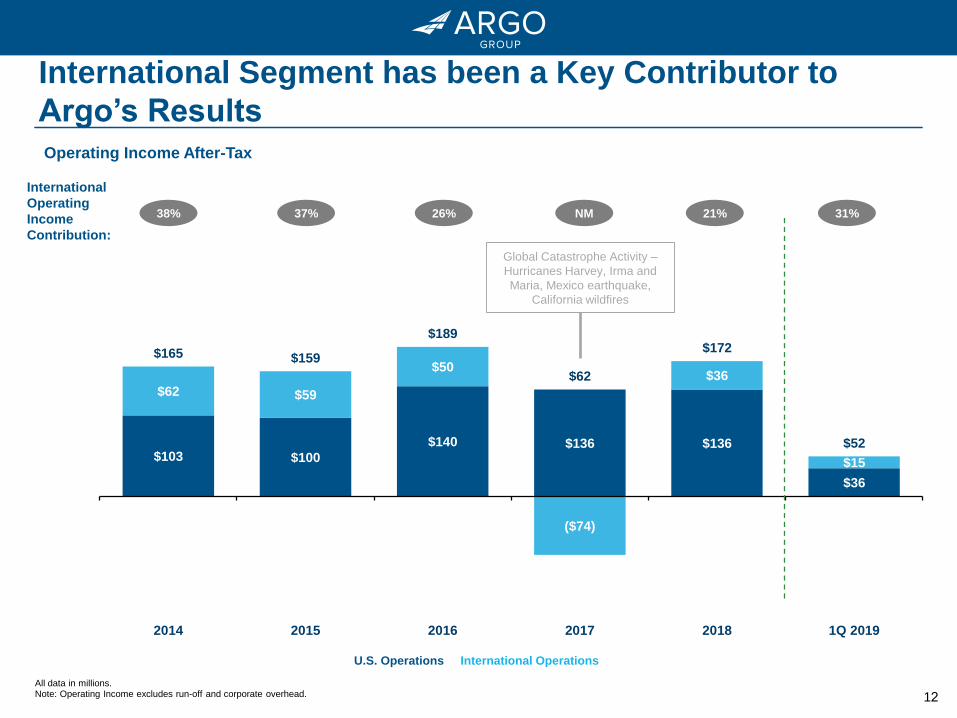
12
International Segment has been a Key Contributor to
Argo’s Results
All data in millions.Note: Operating Income excludes run-off and corporate overhead.
$103 $100
$140 $136 $136
$36
$62 $59
$50
($74)
$36
$15
$165 $159
$189
$62
$172
$52
2014 2015 2016 2017 2018 1Q 2019
31%21%
International
Operating
Income
Contribution:
38% 37% NM26%
U.S. Operations International Operations
Operating Income After-Tax
Global Catastrophe Activity –
Hurricanes Harvey, Irma and
Maria, Mexico earthquake,
California wildfires
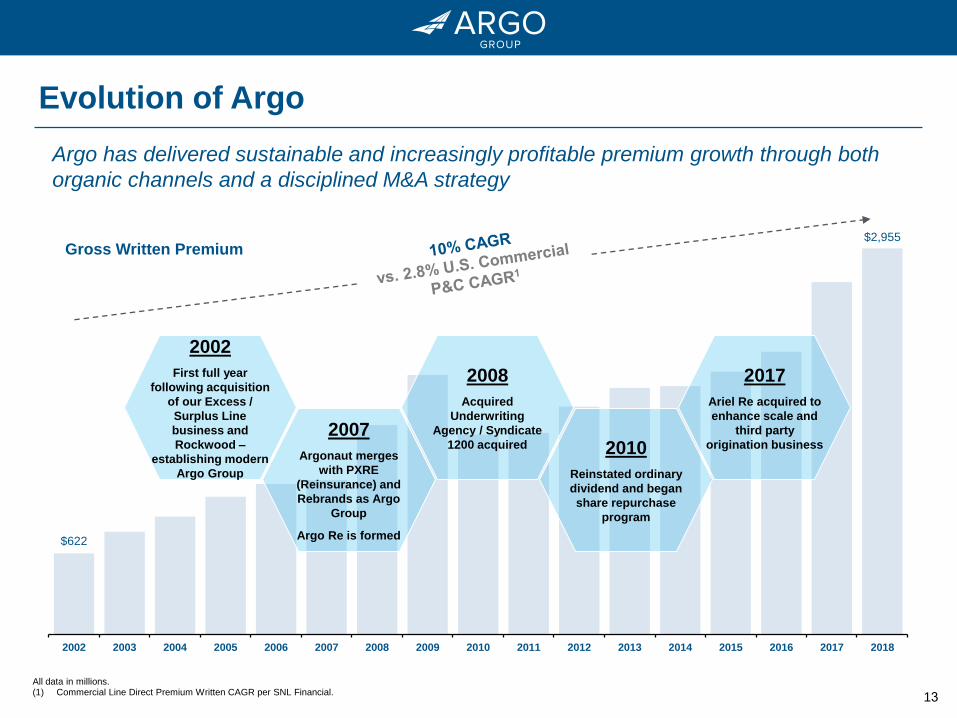
13
$622
$2,955
2002 2003 2004 2005 2006 2007 2008 2009 2010 2011 2012 2013 2014 2015 2016 2017 2018
All data in millions.(1) Commercial Line Direct Premium Written CAGR per SNL Financial.
Evolution of Argo
Argo has delivered sustainable and increasingly profitable premium growth through both
organic channels and a disciplined M&A strategy
Gross Written Premium
2002
First full year
following acquisition
of our Excess /
Surplus Line
business and
Rockwood –
establishing modern
Argo Group
2007
Argonaut merges
with PXRE
(Reinsurance) and
Rebrands as Argo
Group
Argo Re is formed
2008
Acquired
Underwriting
Agency / Syndicate
1200 acquired 2010
Reinstated ordinary
dividend and began
share repurchase
program
2017
Ariel Re acquired to
enhance scale and
third party
origination business
14
Today’s Agenda
Our Board’s Commitment to Investor Stewardship
4
Voce’s Campaign
5
Concluding Remarks
6
Argo has Generated Superior Shareholder Returns2
Argo’s Fundamental Operating Strategy is Delivering Results
3
Argo Overview
1
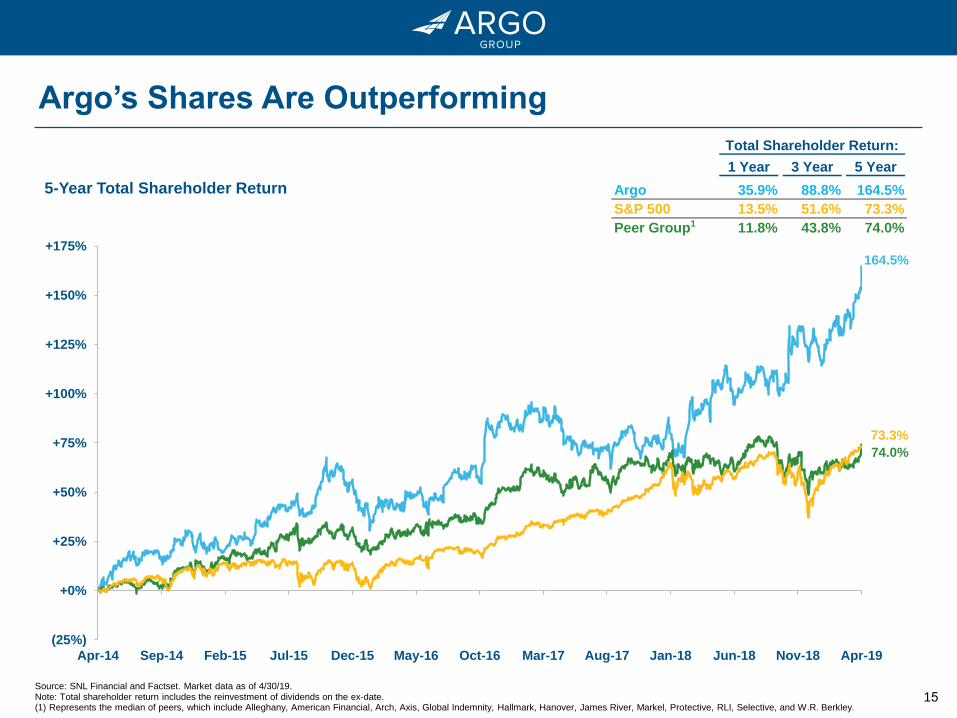
15Source: SNL Financial and Factset. Market data as of 4/30/19.Note: Total shareholder return includes the reinvestment of dividends on the ex-date.(1) Represents the median of peers, which include Alleghany, American Financial, Arch, Axis, Global Indemnity, Hallmark, Hanover, James River, Markel, Protective, RLI, Selective, and W.R. Berkley.
164.5%
74.0%
73.3%
(25%)
+0%
+25%
+50%
+75%
+100%
+125%
+150%
+175%
Apr-14 Sep-14 Feb-15 Jul-15 Dec-15 May-16 Oct-16 Mar-17 Aug-17 Jan-18 Jun-18 Nov-18 Apr-19
5-Year Total Shareholder Return
Total Shareholder Return:
1 Year 3 Year 5 Year
Argo 35.9% 88.8% 164.5%
S&P 500 13.5% 51.6% 73.3%
Peer Group 11.8% 43.8% 74.0%1
Argo’s Shares Are Outperforming
16
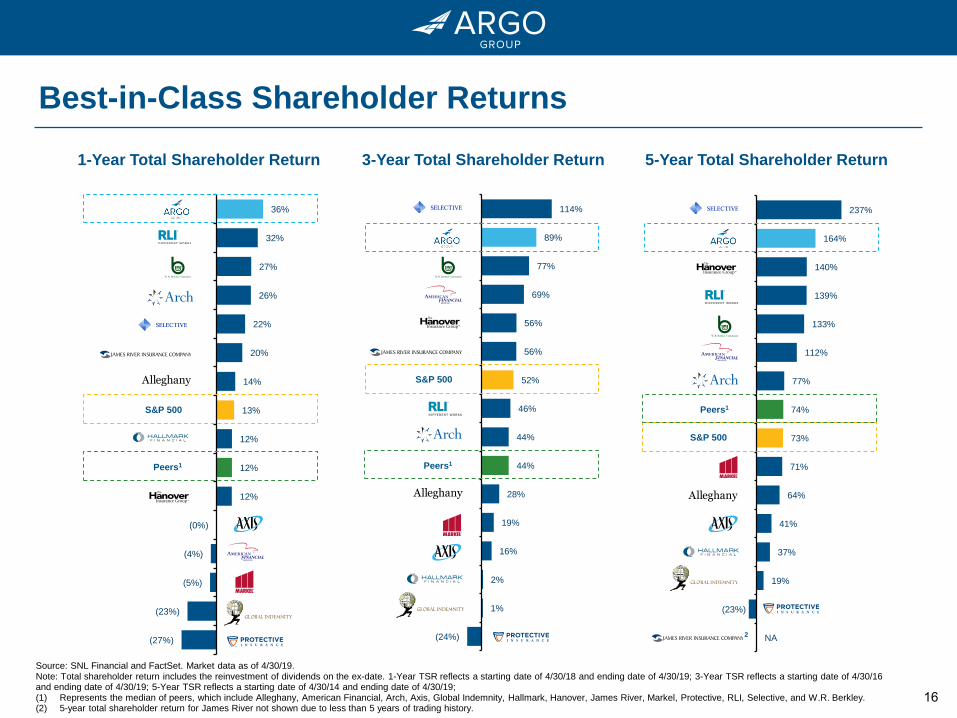
(27%)
(23%)
(5%)
(4%)
(0%)
12%
12%
12%
13%
14%
20%
22%
26%
27%
32%
36%
PTVCB
GBLI
MKL
AFG
AXS
THG
Peers
HALL
S&P 500
Y
JRVR
SIGI
ACGL
WRB
RLI
Argo
1-Year Total Shareholder Return
(24%)
1%
2%
16%
19%
28%
44%
44%
46%
52%
56%
56%
69%
77%
89%
114%
PTVCB
GBLI
HALL
AXS
MKL
Y
Peers
ACGL
RLI
S&P 500
JRVR
THG
AFG
WRB
Argo
SIGI
3-Year Total Shareholder Return 5-Year Total Shareholder Return
(1) Represents the median of peers, which include Alleghany, American Financial, Arch, Axis, Global Indemnity, Hallmark, Hanover, James River, Markel, Protective, RLI, Selective, and W.R. Berkley. (2) 5-year total shareholder return for James River not shown due to less than 5 years of trading history.
Best-in-Class Shareholder Returns
NA
(23%)
19%
37%
41%
64%
71%
73%
74%
77%
112%
133%
139%
140%
164%
237%
JRVR
PTVCB
GBLI
HALL
AXS
Y
MKL
S&P 500
Peers
ACGL
AFG
WRB
RLI
THG
Argo
SIGI
1
Peers1
S&P 500
S&P 500
Peers1
Peers1
S&P 500
2
Source: SNL Financial and FactSet. Market data as of 4/30/19.Note: Total shareholder return includes the reinvestment of dividends on the ex-date. 1-Year TSR reflects a starting date of 4/30/18 and ending date of 4/30/19; 3-Year TSR reflects a starting date of 4/30/16 and ending date of 4/30/19; 5-Year TSR reflects a starting date of 4/30/14 and ending date of 4/30/19;
17
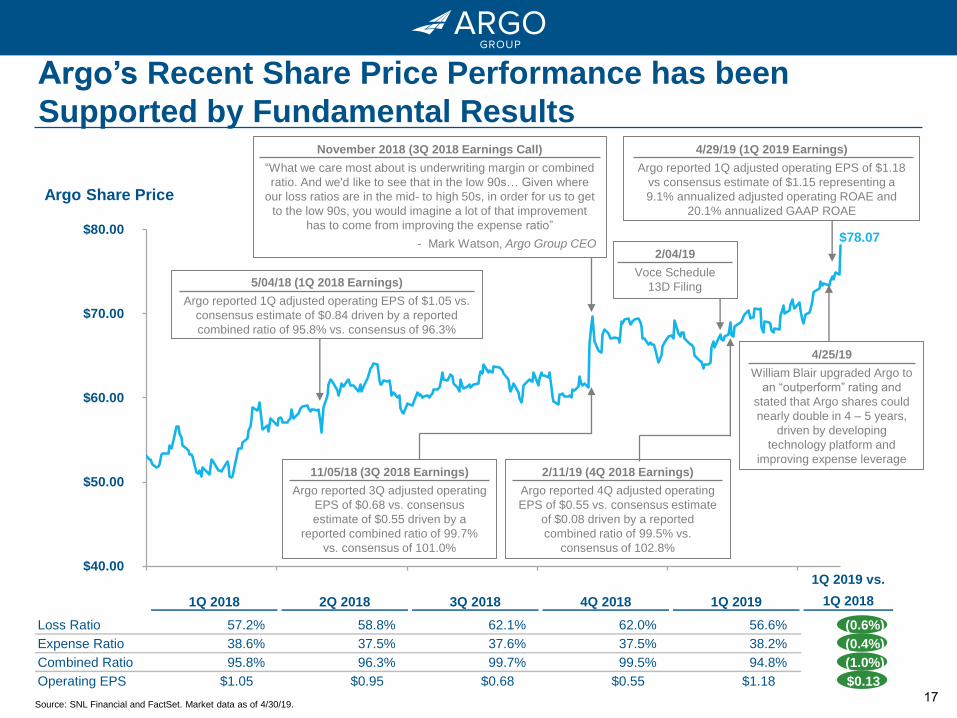
6/30/2019
1Q 2018 2Q 2018 3Q 2018 4Q 2018 1Q 2019
1Q 2019 vs.
1Q 2018
Loss Ratio 57.2% 58.8% 62.1% 62.0% 56.6% (0.6%)
Expense Ratio 38.6% 37.5% 37.6% 37.5% 38.2% (0.4%)
Combined Ratio 95.8% 96.3% 99.7% 99.5% 94.8% (1.0%)
Operating EPS $1.05 $0.95 $0.68 $0.55 $1.18 $0.13
$78.07
$40.00
$50.00
$60.00
$70.00
$80.00
4/29/19 (1Q 2019 Earnings)
Argo reported 1Q adjusted operating EPS of $1.18
vs consensus estimate of $1.15 representing a
9.1% annualized adjusted operating ROAE and
20.1% annualized GAAP ROAE
Argo’s Recent Share Price Performance has been
Supported by Fundamental Results
Argo Share Price
November 2018 (3Q 2018 Earnings Call)
“What we care most about is underwriting margin or combined
ratio. And we'd like to see that in the low 90s… Given where
our loss ratios are in the mid- to high 50s, in order for us to get
to the low 90s, you would imagine a lot of that improvement
has to come from improving the expense ratio”
- Mark Watson, Argo Group CEO2/04/19
Voce Schedule
13D Filing
11/05/18 (3Q 2018 Earnings)
Argo reported 3Q adjusted operating
EPS of $0.68 vs. consensus
estimate of $0.55 driven by a
reported combined ratio of 99.7%
vs. consensus of 101.0%
Source: SNL Financial and FactSet. Market data as of 4/30/19.
2/11/19 (4Q 2018 Earnings)
Argo reported 4Q adjusted operating
EPS of $0.55 vs. consensus estimate
of $0.08 driven by a reported
combined ratio of 99.5% vs.
consensus of 102.8%
5/04/18 (1Q 2018 Earnings)
Argo reported 1Q adjusted operating EPS of $1.05 vs.
consensus estimate of $0.84 driven by a reported
combined ratio of 95.8% vs. consensus of 96.3%
4/25/19
William Blair upgraded Argo to
an “outperform” rating and
stated that Argo shares could
nearly double in 4 – 5 years,
driven by developing
technology platform and
improving expense leverage
18
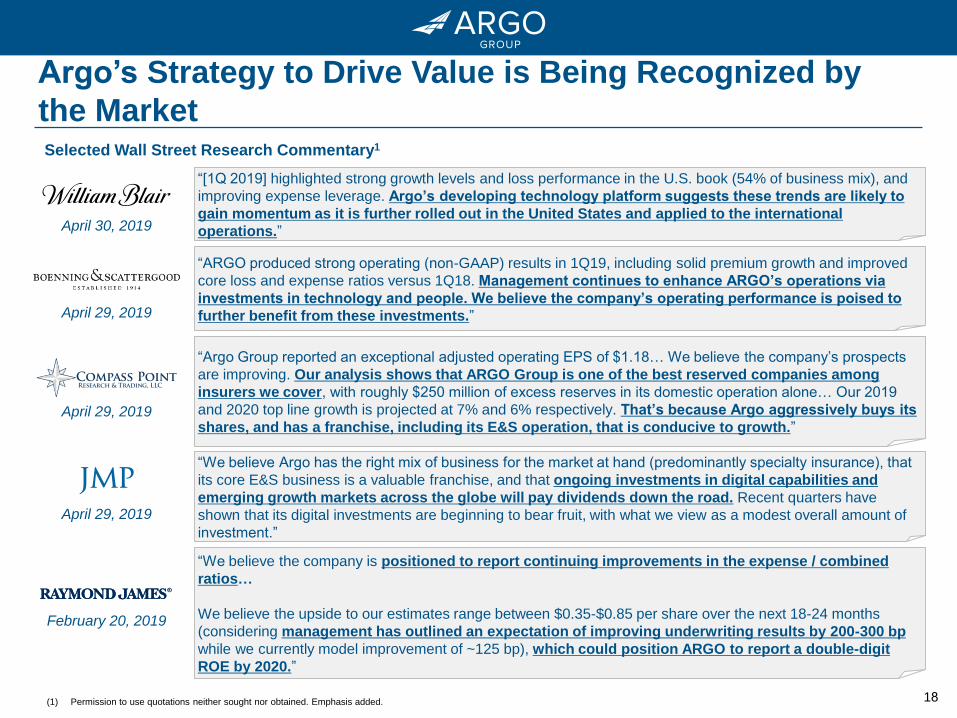
Argo’s Strategy to Drive Value is Being Recognized by
the Market
(1) Permission to use quotations neither sought nor obtained. Emphasis added.
“ARGO produced strong operating (non-GAAP) results in 1Q19, including solid premium growth and improved
core loss and expense ratios versus 1Q18. Management continues to enhance ARGO’s operations via
investments in technology and people. We believe the company’s operating performance is poised to
further benefit from these investments.”
“[1Q 2019] highlighted strong growth levels and loss performance in the U.S. book (54% of business mix), and
improving expense leverage. Argo’s developing technology platform suggests these trends are likely to
gain momentum as it is further rolled out in the United States and applied to the international
operations.”
“Argo Group reported an exceptional adjusted operating EPS of $1.18… We believe the company’s prospects
are improving. Our analysis shows that ARGO Group is one of the best reserved companies among
insurers we cover, with roughly $250 million of excess reserves in its domestic operation alone… Our 2019
and 2020 top line growth is projected at 7% and 6% respectively. That’s because Argo aggressively buys its
shares, and has a franchise, including its E&S operation, that is conducive to growth.”
“We believe Argo has the right mix of business for the market at hand (predominantly specialty insurance), that
its core E&S business is a valuable franchise, and that ongoing investments in digital capabilities and
emerging growth markets across the globe will pay dividends down the road. Recent quarters have
shown that its digital investments are beginning to bear fruit, with what we view as a modest overall amount of
investment.”
Selected Wall Street Research Commentary1
April 29, 2019
April 29, 2019
April 30, 2019
February 20, 2019
April 29, 2019
“We believe the company is positioned to report continuing improvements in the expense / combined
ratios…
We believe the upside to our estimates range between $0.35-$0.85 per share over the next 18-24 months
(considering management has outlined an expectation of improving underwriting results by 200-300 bp
while we currently model improvement of ~125 bp), which could position ARGO to report a double-digit
ROE by 2020.”
19
Today’s Agenda
Our Board’s Commitment to Investor Stewardship
4
Voce’s Campaign
5
Concluding Remarks
6
Argo has Generated Superior Shareholder Returns2
Argo’s Fundamental Operating Strategy is Delivering Results
3
Argo Overview
1
20
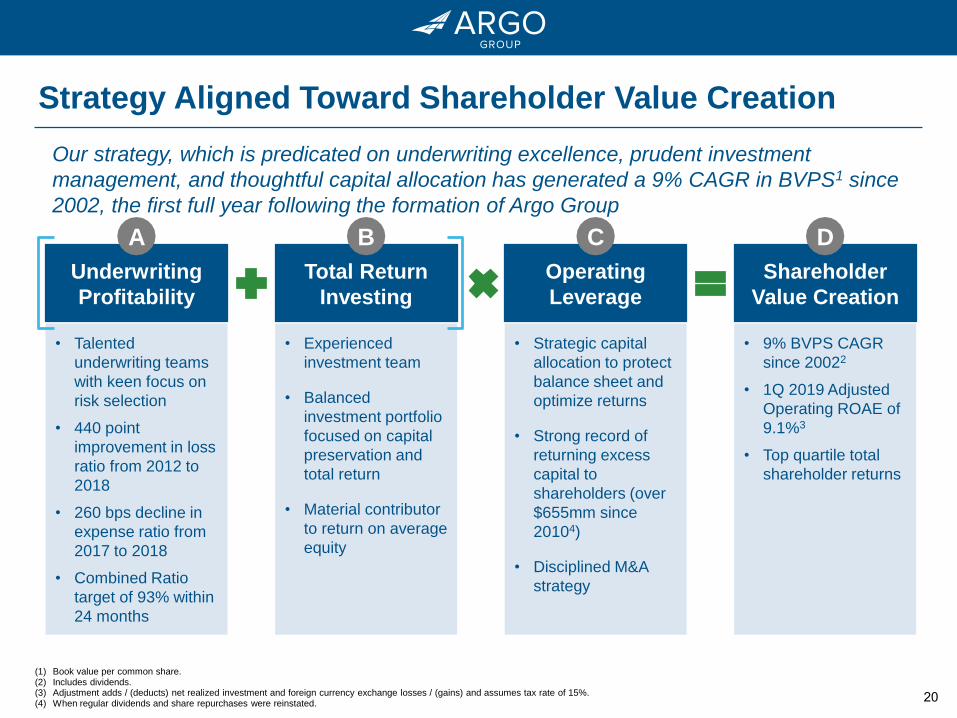
Strategy Aligned Toward Shareholder Value Creation
Shareholder
Value Creation
• 9% BVPS CAGR
since 20022
• 1Q 2019 Adjusted
Operating ROAE of
9.1%3
• Top quartile total
shareholder returns
Our strategy, which is predicated on underwriting excellence, prudent investment
management, and thoughtful capital allocation has generated a 9% CAGR in BVPS1 since
2002, the first full year following the formation of Argo Group
Underwriting
Profitability
Total Return
Investing
Operating
Leverage
• Talented
underwriting teams
with keen focus on
risk selection
• 440 point
improvement in loss
ratio from 2012 to
2018
• 260 bps decline in
expense ratio from
2017 to 2018
• Combined Ratio
target of 93% within
24 months
• Experienced
investment team
• Balanced
investment portfolio
focused on capital
preservation and
total return
• Material contributor
to return on average
equity
• Strategic capital
allocation to protect
balance sheet and
optimize returns
• Strong record of
returning excess
capital to
shareholders (over
$655mm since
20104)
• Disciplined M&A
strategy
(1) Book value per common share. (2) Includes dividends. (3) Adjustment adds / (deducts) net realized investment and foreign currency exchange losses / (gains) and assumes tax rate of 15%.(4) When regular dividends and share repurchases were reinstated.
A B C D
21
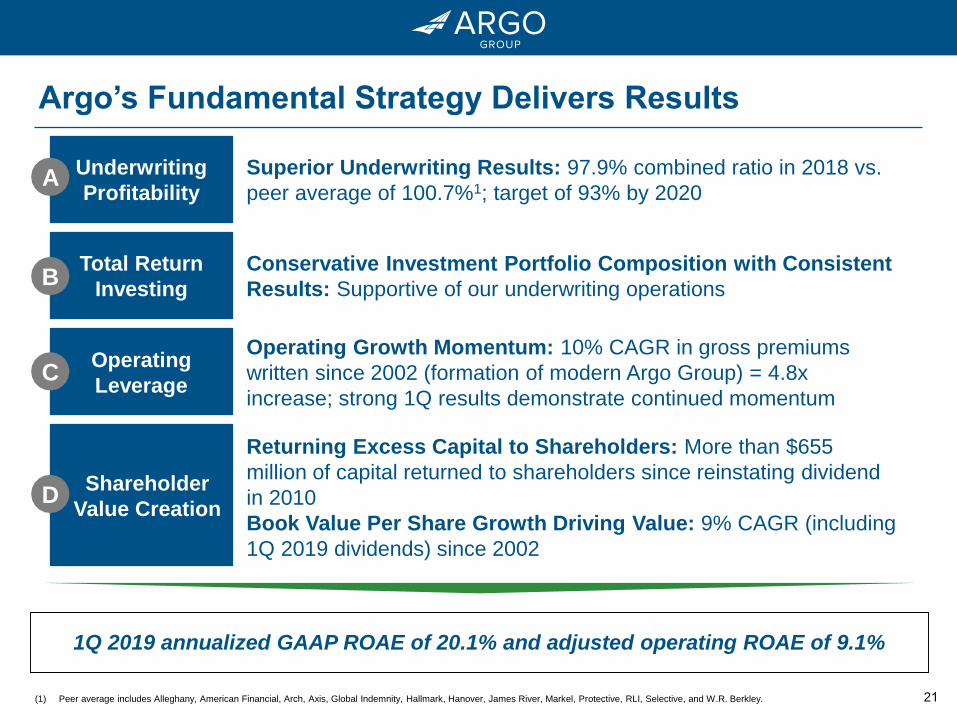
Argo’s Fundamental Strategy Delivers Results
Superior Underwriting Results: 97.9% combined ratio in 2018 vs.
peer average of 100.7%1; target of 93% by 2020
(1) Peer average includes Alleghany, American Financial, Arch, Axis, Global Indemnity, Hallmark, Hanover, James River, Markel, Protective, RLI, Selective, and W.R. Berkley.
1Q 2019 annualized GAAP ROAE of 20.1% and adjusted operating ROAE of 9.1%
E
Underwriting
Profitability
Total Return
Investing
Operating
Leverage
Shareholder
Value Creation
A
B
C
D
Conservative Investment Portfolio Composition with Consistent
Results: Supportive of our underwriting operations
Operating Growth Momentum: 10% CAGR in gross premiums
written since 2002 (formation of modern Argo Group) = 4.8x
increase; strong 1Q results demonstrate continued momentum
Returning Excess Capital to Shareholders: More than $655
million of capital returned to shareholders since reinstating dividend
in 2010
Book Value Per Share Growth Driving Value: 9% CAGR (including
1Q 2019 dividends) since 2002
22
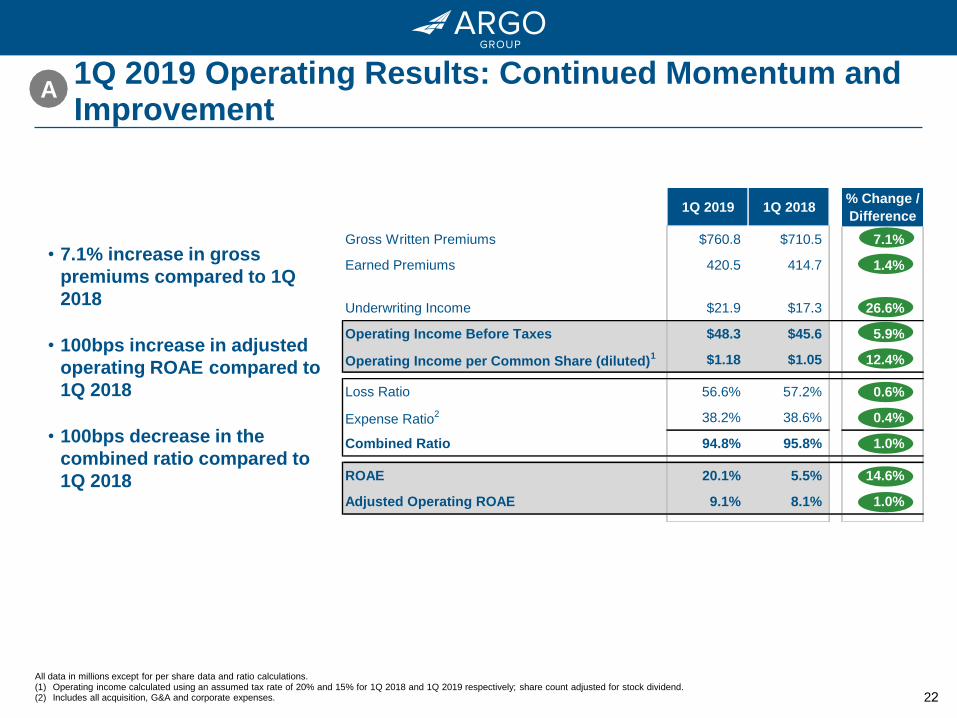
1Q 2019 Operating Results: Continued Momentum and Improvement
All data in millions except for per share data and ratio calculations.(1) Operating income calculated using an assumed tax rate of 20% and 15% for 1Q 2018 and 1Q 2019 respectively; share count adjusted for stock dividend.(2) Includes all acquisition, G&A and corporate expenses.
1Q 2019 1Q 2018% Change /
Difference
Gross Written Premiums $760.8 $710.5 7.1%
Earned Premiums 420.5 414.7 1.4%
Underwriting Income $21.9 $17.3 26.6%
Operating Income Before Taxes $48.3 $45.6 5.9%
Operating Income per Common Share (diluted)1 $1.18 $1.05 12.4%
Loss Ratio 56.6% 57.2% 0.6%
Expense Ratio2 38.2% 38.6% 0.4%
Combined Ratio 94.8% 95.8% 1.0%
ROAE 20.1% 5.5% 14.6%
Adjusted Operating ROAE 9.1% 8.1% 1.0%
• 7.1% increase in gross
premiums compared to 1Q
2018
• 100bps increase in adjusted
operating ROAE compared to
1Q 2018
• 100bps decrease in the
combined ratio compared to
1Q 2018
A
23
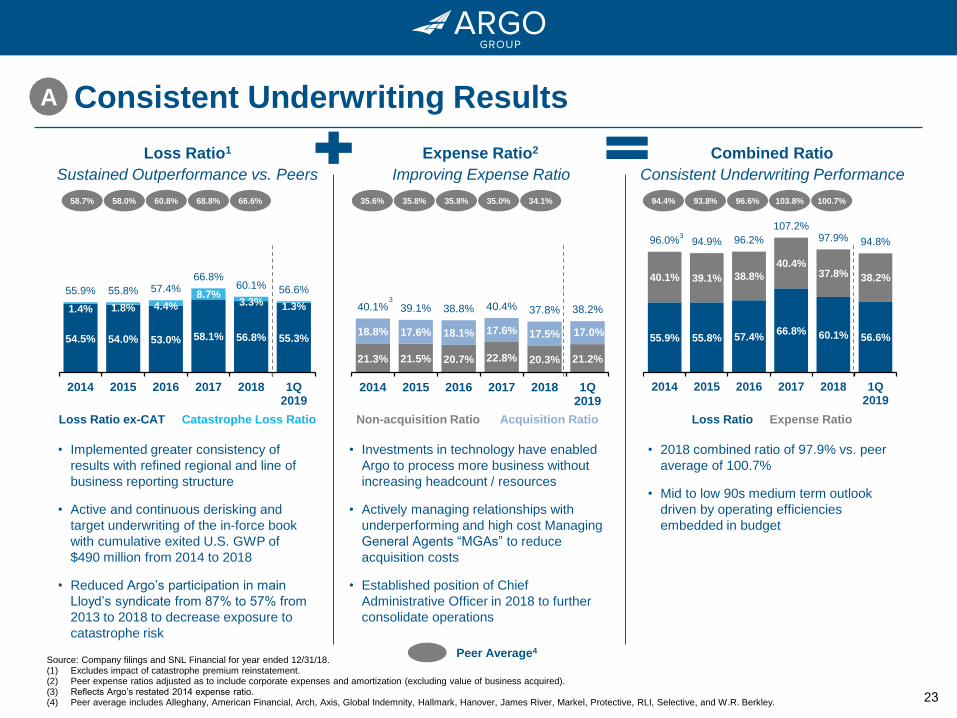
Consistent Underwriting Results A
Loss Ratio1 Expense Ratio2 Combined Ratio
21.3% 21.5% 20.7% 22.8% 20.3% 21.2%
18.8% 17.6% 18.1% 17.6% 17.5% 17.0%
40.1% 39.1% 38.8% 40.4% 37.8% 38.2%
2014 2015 2016 2017 2018 1Q2019
54.5% 54.0% 53.0% 58.1% 56.8% 55.3%
1.4% 1.8% 4.4% 8.7%
3.3% 1.3%
55.9% 55.8% 57.4% 66.8%
60.1% 56.6%
2014 2015 2016 2017 2018 1Q2019
55.9% 55.8% 57.4% 66.8% 60.1% 56.6%
40.1% 39.1% 38.8%
40.4% 37.8% 38.2%
96.0% 94.9% 96.2%
107.2% 97.9% 94.8%
2014 2015 2016 2017 2018 1Q2019
Loss Ratio ex-CAT Catastrophe Loss Ratio Non-acquisition Ratio Acquisition Ratio Loss Ratio Expense Ratio
• Implemented greater consistency of
results with refined regional and line of
business reporting structure
• Active and continuous derisking and
target underwriting of the in-force book
with cumulative exited U.S. GWP of
$490 million from 2014 to 2018
• Reduced Argo’s participation in main
Lloyd’s syndicate from 87% to 57% from
2013 to 2018 to decrease exposure to
catastrophe risk
Peer Average4
• Investments in technology have enabled
Argo to process more business without
increasing headcount / resources
• Actively managing relationships with
underperforming and high cost Managing
General Agents “MGAs” to reduce
acquisition costs
• Established position of Chief
Administrative Officer in 2018 to further
consolidate operations
• 2018 combined ratio of 97.9% vs. peer
average of 100.7%
• Mid to low 90s medium term outlook
driven by operating efficiencies
embedded in budget
58.7%
Source: Company filings and SNL Financial for year ended 12/31/18.(1) Excludes impact of catastrophe premium reinstatement. (2) Peer expense ratios adjusted as to include corporate expenses and amortization (excluding value of business acquired).(3) Reflects Argo’s restated 2014 expense ratio.(4) Peer average includes Alleghany, American Financial, Arch, Axis, Global Indemnity, Hallmark, Hanover, James River, Markel, Protective, RLI, Selective, and W.R. Berkley.
58.0% 60.8% 68.8% 66.6% 35.6% 35.8% 35.8% 35.0% 34.1% 94.4% 93.8% 96.6% 103.8% 100.7%
Sustained Outperformance vs. Peers Improving Expense Ratio Consistent Underwriting Performance
3
3
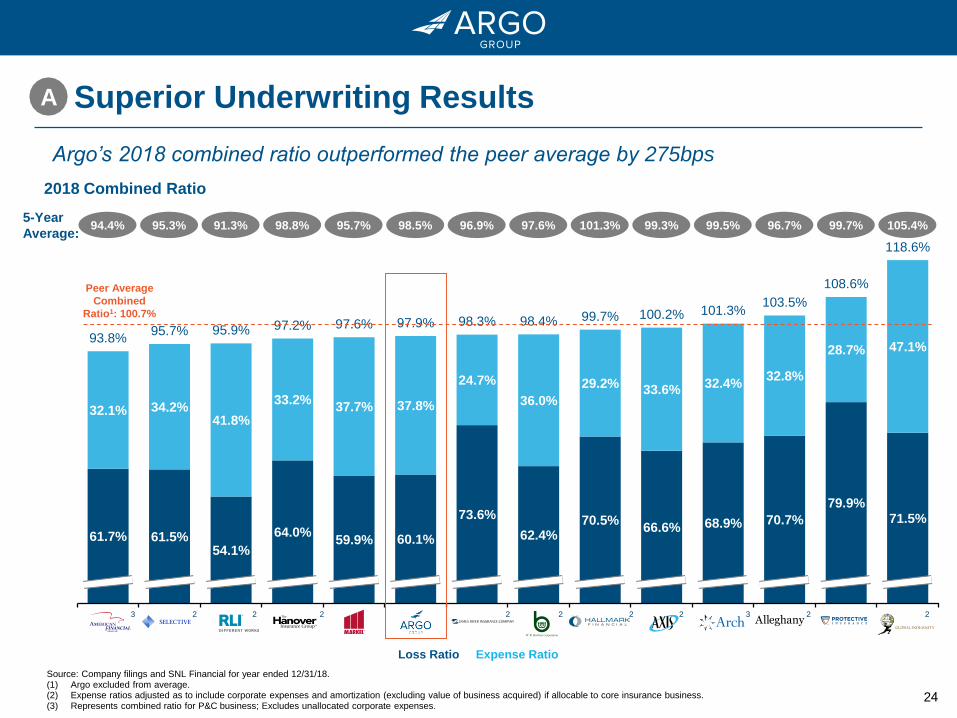
24
71.5% 79.9%
70.7% 68.9% 66.6% 70.5%
62.4%
73.6%
60.1% 59.9% 64.0%
54.1% 61.5% 61.7%
47.1% 28.7%
32.8% 32.4%
33.6% 29.2%
36.0%
24.7%
37.8% 37.7% 33.2%
41.8% 34.2% 32.1%
118.6%
108.6%
103.5% 101.3% 100.2% 99.7% 98.4% 98.3% 97.9% 97.6% 97.2% 95.9% 95.7%
93.8%
GBLIPTVCBYACGLAXSHALLWRBJRVRARGOMKLTHGRLISIGIAFG
2018 Combined Ratio
Superior Underwriting Results
Argo’s 2018 combined ratio outperformed the peer average by 275bps
A
Peer Average
Combined
Ratio1: 100.7%
Loss Ratio Expense Ratio
2222222223 3
Source: Company filings and SNL Financial for year ended 12/31/18.(1) Argo excluded from average.(2) Expense ratios adjusted as to include corporate expenses and amortization (excluding value of business acquired) if allocable to core insurance business.(3) Represents combined ratio for P&C business; Excludes unallocated corporate expenses.
105.4%99.7%5-Year
Average:94.4% 95.3% 91.3% 98.8% 95.7% 98.5% 96.9% 97.6% 101.3% 99.3% 96.7%99.5%
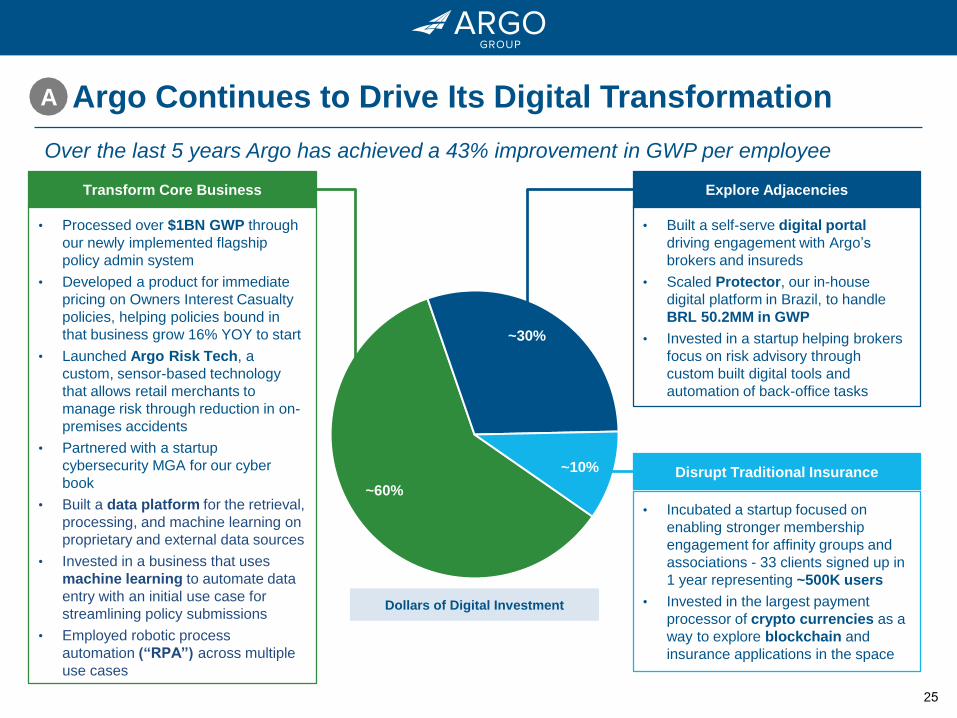
25
Argo Continues to Drive Its Digital Transformation
• Processed over $1BN GWP through
our newly implemented flagship
policy admin system
• Developed a product for immediate
pricing on Owners Interest Casualty
policies, helping policies bound in
that business grow 16% YOY to start
• Launched Argo Risk Tech, a
custom, sensor-based technology
that allows retail merchants to
manage risk through reduction in on-
premises accidents
• Partnered with a startup
cybersecurity MGA for our cyber
book
• Built a data platform for the retrieval,
processing, and machine learning on
proprietary and external data sources
• Invested in a business that uses
machine learning to automate data
entry with an initial use case for
streamlining policy submissions
• Employed robotic process
automation (“RPA”) across multiple
use cases
Transform Core Business
• Built a self-serve digital portal
driving engagement with Argo’s
brokers and insureds
• Scaled Protector, our in-house
digital platform in Brazil, to handle
BRL 50.2MM in GWP
• Invested in a startup helping brokers
focus on risk advisory through
custom built digital tools and
automation of back-office tasks
Explore Adjacencies
• Incubated a startup focused on
enabling stronger membership
engagement for affinity groups and
associations - 33 clients signed up in
1 year representing ~500K users
• Invested in the largest payment
processor of crypto currencies as a
way to explore blockchain and
insurance applications in the space
Disrupt Traditional Insurance
~60%
~30%
~10%
A
Over the last 5 years Argo has achieved a 43% improvement in GWP per employee
Dollars of Digital Investment
26
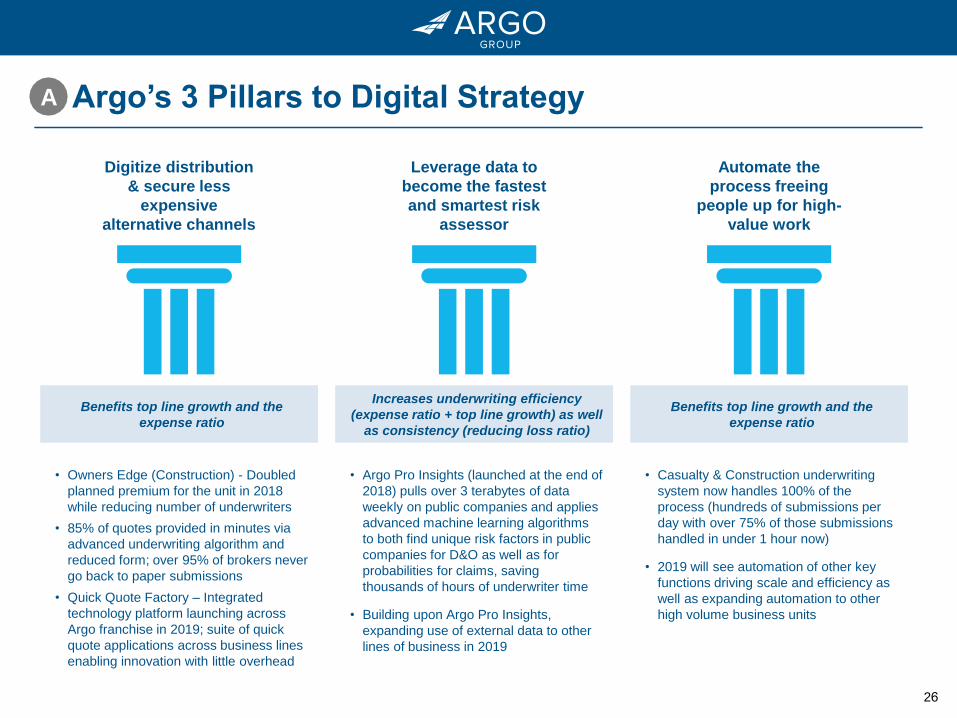
A Argo’s 3 Pillars to Digital Strategy
Benefits top line growth and the
expense ratio
Digitize distribution
& secure less
expensive
alternative channels
Leverage data to
become the fastest
and smartest risk
assessor
Automate the
process freeing
people up for high-
value work
Increases underwriting efficiency
(expense ratio + top line growth) as well
as consistency (reducing loss ratio)
Benefits top line growth and the
expense ratio
• Owners Edge (Construction) - Doubled
planned premium for the unit in 2018
while reducing number of underwriters
• 85% of quotes provided in minutes via
advanced underwriting algorithm and
reduced form; over 95% of brokers never
go back to paper submissions
• Quick Quote Factory – Integrated
technology platform launching across
Argo franchise in 2019; suite of quick
quote applications across business lines
enabling innovation with little overhead
• Argo Pro Insights (launched at the end of
2018) pulls over 3 terabytes of data
weekly on public companies and applies
advanced machine learning algorithms
to both find unique risk factors in public
companies for D&O as well as for
probabilities for claims, saving
thousands of hours of underwriter time
• Building upon Argo Pro Insights,
expanding use of external data to other
lines of business in 2019
• Casualty & Construction underwriting
system now handles 100% of the
process (hundreds of submissions per
day with over 75% of those submissions
handled in under 1 hour now)
• 2019 will see automation of other key
functions driving scale and efficiency as
well as expanding automation to other
high volume business units
27
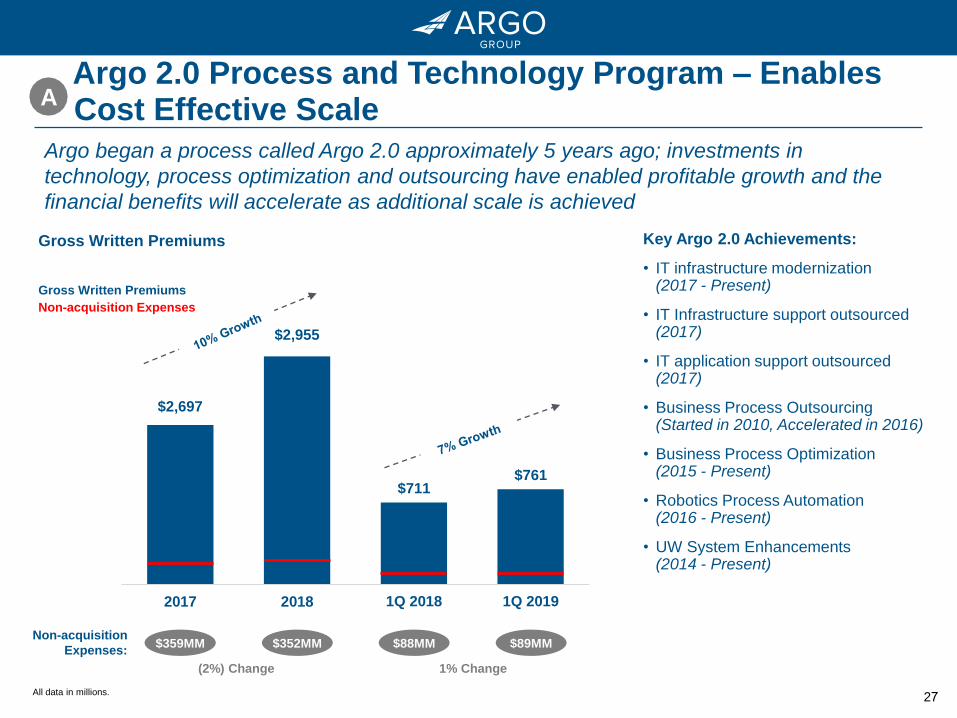
$2,697
$2,955
2017 2018
A
Argo began a process called Argo 2.0 approximately 5 years ago; investments in
technology, process optimization and outsourcing have enabled profitable growth and the
financial benefits will accelerate as additional scale is achieved
Key Argo 2.0 Achievements:
• IT infrastructure modernization(2017 - Present)
• IT Infrastructure support outsourced(2017)
• IT application support outsourced(2017)
• Business Process Outsourcing(Started in 2010, Accelerated in 2016)
• Business Process Optimization(2015 - Present)
• Robotics Process Automation(2016 - Present)
• UW System Enhancements(2014 - Present)
All data in millions.
Non-acquisition
Expenses:$359MM $352MM $88MM $89MM
(2%) Change 1% Change
Argo 2.0 Process and Technology Program – Enables Cost Effective Scale
Gross Written Premiums
Non-acquisition Expenses
Gross Written Premiums
$711$761
1Q 2018 1Q 2019
28
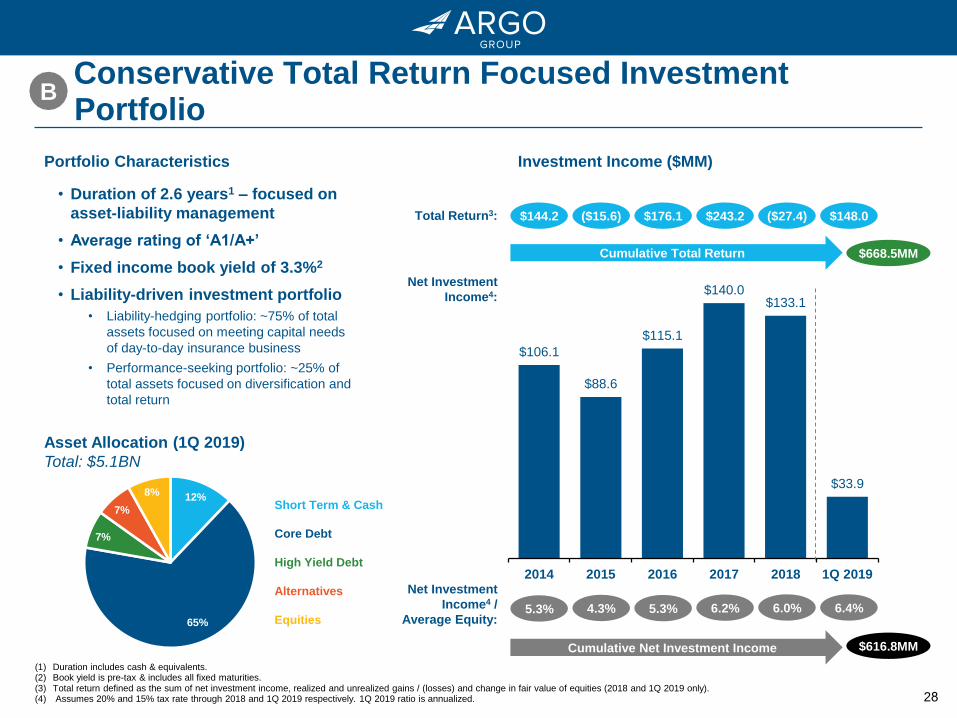
Conservative Total Return Focused Investment Portfolio
(1) Duration includes cash & equivalents.(2) Book yield is pre-tax & includes all fixed maturities.(3) Total return defined as the sum of net investment income, realized and unrealized gains / (losses) and change in fair value of equities (2018 and 1Q 2019 only).(4) Assumes 20% and 15% tax rate through 2018 and 1Q 2019 respectively. 1Q 2019 ratio is annualized.
Portfolio Characteristics
Asset Allocation (1Q 2019)
Total: $5.1BN
• Duration of 2.6 years1 – focused on
asset-liability management
• Average rating of ‘A1/A+’
• Fixed income book yield of 3.3%2
• Liability-driven investment portfolio
• Liability-hedging portfolio: ~75% of total
assets focused on meeting capital needs
of day-to-day insurance business
• Performance-seeking portfolio: ~25% of
total assets focused on diversification and
total return
Short Term & Cash
Core Debt
High Yield Debt
Alternatives
Equities
12%
65%
7%
7%
8%
B
Investment Income ($MM)
$106.1
$88.6
$115.1
$140.0 $133.1
$33.9
2014 2015 2016 2017 2018 1Q 2019
6.0%5.3% 4.3% 5.3% 6.2%
Net Investment
Income4 /
Average Equity:
Total Return3: $144.2 ($27.4)$243.2$176.1($15.6) $148.0
6.4%
Cumulative Total Return
Cumulative Net Investment Income
Net Investment
Income4:
$668.5MM
$616.8MM
29
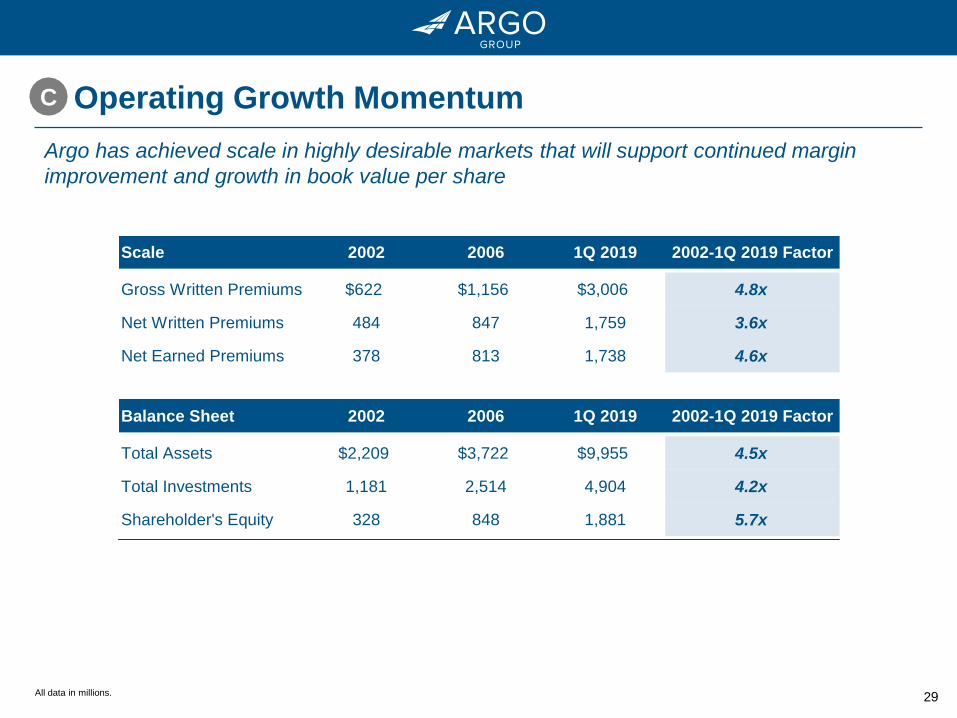
Operating Growth Momentum
Argo has achieved scale in highly desirable markets that will support continued margin
improvement and growth in book value per share
C
Scale 2002 2006 1Q 2019 2002-1Q 2019 Factor
Gross Written Premiums $622 $1,156 $3,006 4.8x
Net Written Premiums 484 847 1,759 3.6x
Net Earned Premiums 378 813 1,738 4.6x
Balance Sheet 2002 2006 1Q 2019 2002-1Q 2019 Factor
Total Assets $2,209 $3,722 $9,955 4.5x
Total Investments 1,181 2,514 4,904 4.2x
Shareholder's Equity 328 848 1,881 5.7x
All data in millions.
30
Active Steward of Shareholder Capital
All data in millions.(1) Peer group includes Alleghany, American Financial, Arch, Axis, Global Indemnity, Hallmark, Hanover, James River, Markel, Protective, RLI, Selective, and W.R. Berkley.
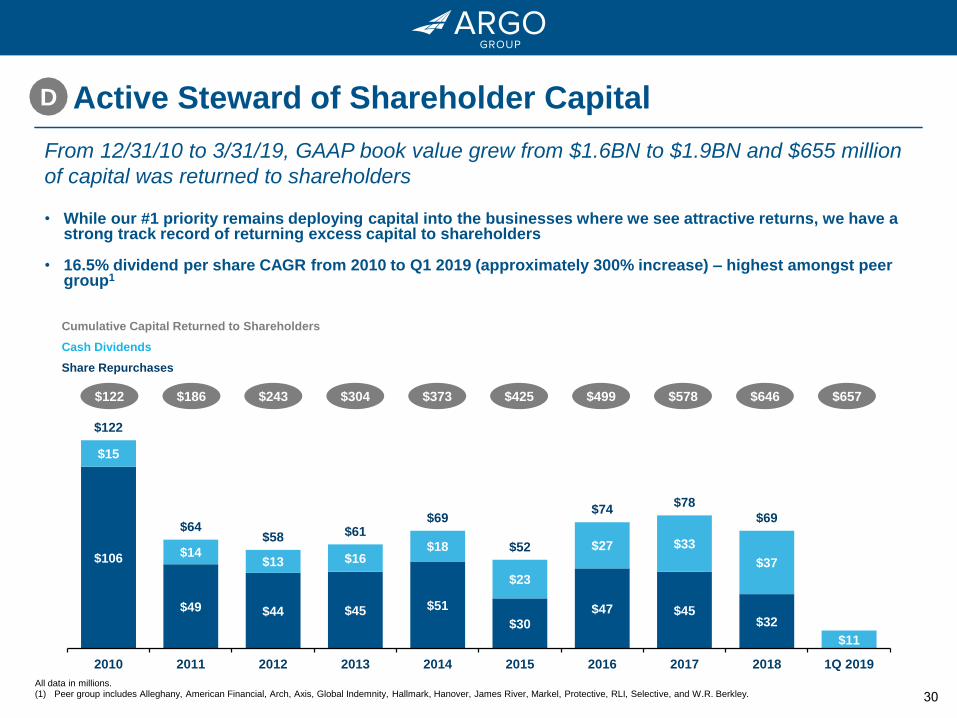
From 12/31/10 to 3/31/19, GAAP book value grew from $1.6BN to $1.9BN and $655 million
of capital was returned to shareholders
• While our #1 priority remains deploying capital into the businesses where we see attractive returns, we have astrong track record of returning excess capital to shareholders
• 16.5% dividend per share CAGR from 2010 to Q1 2019 (approximately 300% increase) – highest amongst peergroup1
$106
$49 $44 $45 $51
$30$47 $45
$32
$15
$14$13 $16
$18
$23
$27 $33
$37
$11
$122
$64$58 $61
$69
$52
$74$78
$69
2010 2011 2012 2013 2014 2015 2016 2017 2018 1Q 2019
Cumulative Capital Returned to Shareholders
Cash Dividends
Share Repurchases
D
$122 $646$186 $243 $304 $373 $425 $499 $578 $657
31
$15.28 $17.78
$19.83 $21.89
$25.53
$29.50 $28.47
$33.78
$37.77 $36.32
$39.69 $42.37
$46.03 $47.22
$51.94 $53.46
$51.43
$55.23
$15.28 $17.78
$19.83 $21.89
$25.53
$30.58 $29.55
$34.86
$39.16 $38.03
$41.71 $44.81
$48.96 $50.79
$56.25 $58.71 $57.77
$61.84
2002 2003 2004 2005 2006 2007 2008 2009 2010 2011 2012 2013 2014 2015 2016 2017 2018 1Q 2019
Book Value Per Share
Reported Book Value1
Cumulative Dividends
(1) Book value per common share:- Adjusted for June 2013, March 2015, June 2016 and March 2018 stock dividends.- 2008-2011 restated to reflect adoption of ASU 2010-26 (related to accounting for costs associated with acquiring or renewing insurance contracts); 2007 and prior not restated.- 2006 and prior years adjusted for PXRE merger.- 2003-2006 includes impact of Series A Mandatory Convertible Preferred on an as-if-converted basis. Preferred stock fully converted into common shares as of Dec. 31, 2007.
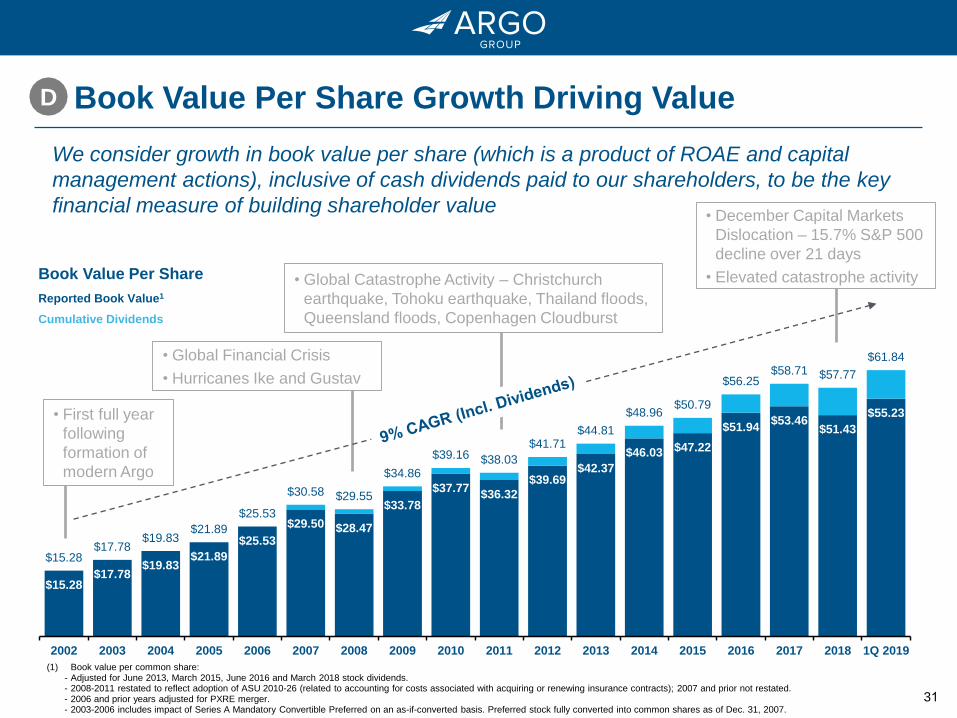
Book Value Per Share Growth Driving Value
• Global Catastrophe Activity – Christchurch
earthquake, Tohoku earthquake, Thailand floods,
Queensland floods, Copenhagen Cloudburst
• Global Financial Crisis
• Hurricanes Ike and Gustav
• December Capital Markets
Dislocation – 15.7% S&P 500
decline over 21 days
• Elevated catastrophe activity
We consider growth in book value per share (which is a product of ROAE and capital
management actions), inclusive of cash dividends paid to our shareholders, to be the key
financial measure of building shareholder value
• First full year
following
formation of
modern Argo
D
32
Achieving Our Target ROAED
Underwriting
Contribution
Investment
Contribution
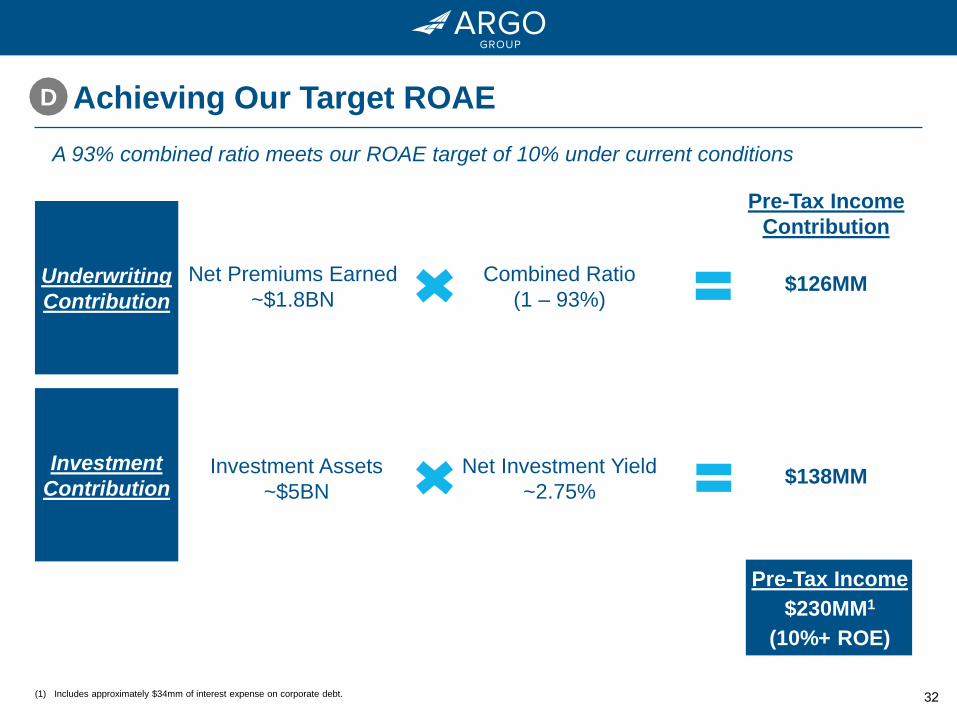
A 93% combined ratio meets our ROAE target of 10% under current conditions
Pre-Tax Income
$230MM1
(10%+ ROE)
Net Premiums Earned
~$1.8BN
Combined Ratio
(1 – 93%)
Investment Assets
~$5BN
Net Investment Yield
~2.75%
Pre-Tax Income
Contribution
$126MM
$138MM
(1) Includes approximately $34mm of interest expense on corporate debt.
33
Today’s Agenda
Our Board’s Commitment to Investor Stewardship
4
Voce’s Campaign
5
Concluding Remarks
6
Argo has Generated Superior Shareholder Returns2
Argo’s Fundamental Operating Strategy is Delivering Results
3
Argo Overview
1
34
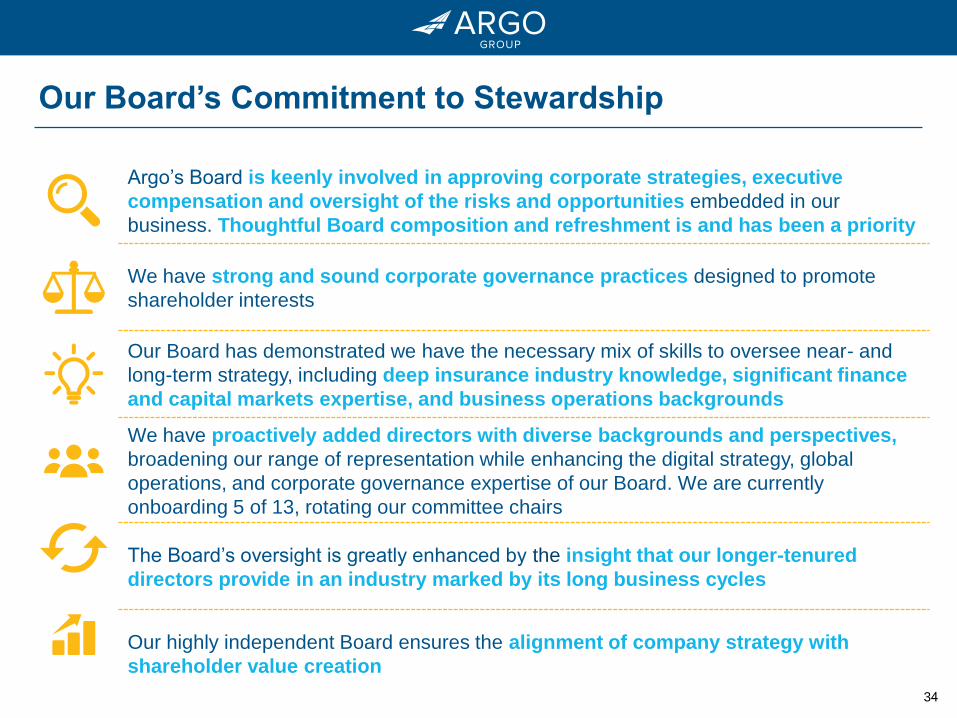
Our Board’s Commitment to Stewardship
Argo’s Board is keenly involved in approving corporate strategies, executive
compensation and oversight of the risks and opportunities embedded in our
business. Thoughtful Board composition and refreshment is and has been a priority
We have strong and sound corporate governance practices designed to promote
shareholder interests
Our Board has demonstrated we have the necessary mix of skills to oversee near- and
long-term strategy, including deep insurance industry knowledge, significant finance
and capital markets expertise, and business operations backgrounds
We have proactively added directors with diverse backgrounds and perspectives,
broadening our range of representation while enhancing the digital strategy, global
operations, and corporate governance expertise of our Board. We are currently
onboarding 5 of 13, rotating our committee chairs
The Board’s oversight is greatly enhanced by the insight that our longer-tenured
directors provide in an industry marked by its long business cycles
Our highly independent Board ensures the alignment of company strategy with
shareholder value creation
35
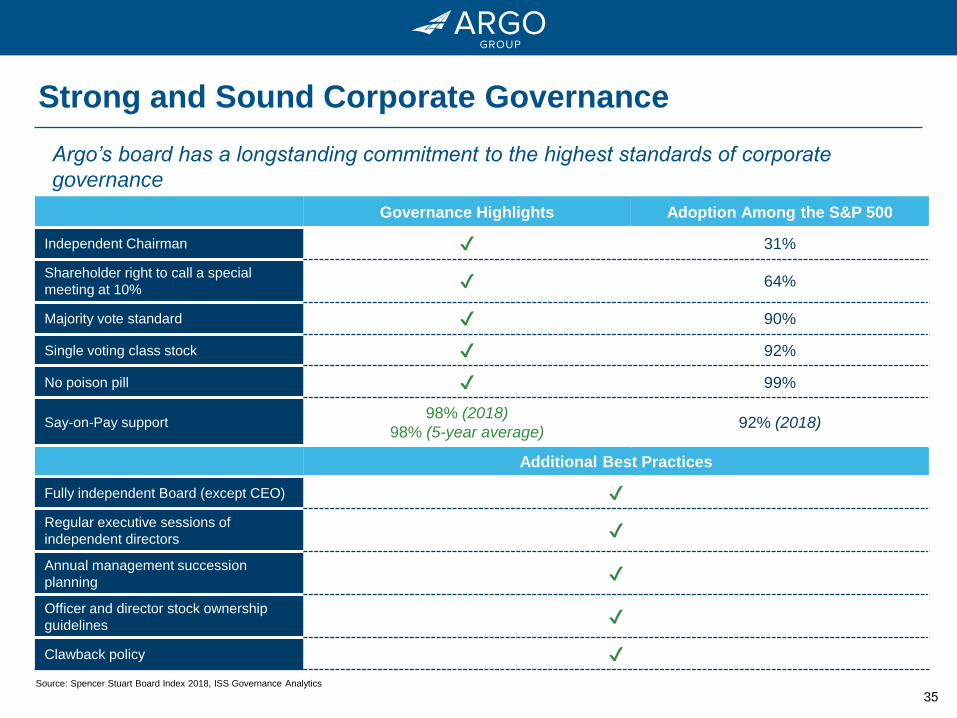
Strong and Sound Corporate Governance
Governance Highlights Adoption Among the S&P 500
Independent Chairman ✔ 31%
Shareholder right to call a special
meeting at 10% ✔ 64%
Majority vote standard ✔ 90%
Single voting class stock ✔ 92%
No poison pill ✔ 99%
Say-on-Pay support98% (2018)
98% (5-year average)92% (2018)
Additional Best Practices
Fully independent Board (except CEO) ✔
Regular executive sessions of
independent directors ✔
Annual management succession
planning ✔
Officer and director stock ownership
guidelines ✔
Clawback policy ✔
Source: Spencer Stuart Board Index 2018, ISS Governance Analytics
Argo’s board has a longstanding commitment to the highest standards of corporate
governance
36
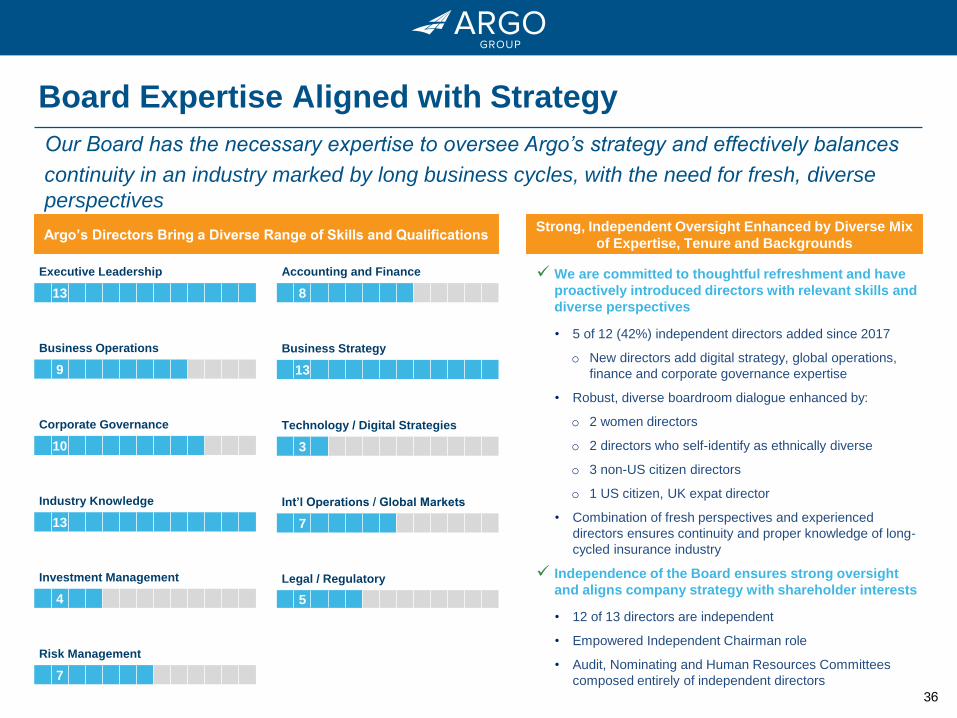
Board Expertise Aligned with Strategy
Corporate Governance
10
Risk Management
7
Executive Leadership
13
Industry Knowledge
13
Int’l Operations / Global Markets
7
Accounting and Finance
8
Investment Management
4
Business Operations
9
Legal / Regulatory
5
Business Strategy
13
Technology / Digital Strategies
3
Argo’s Directors Bring a Diverse Range of Skills and QualificationsStrong, Independent Oversight Enhanced by Diverse Mix
of Expertise, Tenure and Backgrounds
We are committed to thoughtful refreshment and have
proactively introduced directors with relevant skills and
diverse perspectives
• 5 of 12 (42%) independent directors added since 2017
o New directors add digital strategy, global operations,
finance and corporate governance expertise
• Robust, diverse boardroom dialogue enhanced by:
o 2 women directors
o 2 directors who self-identify as ethnically diverse
o 3 non-US citizen directors
o 1 US citizen, UK expat director
• Combination of fresh perspectives and experienced
directors ensures continuity and proper knowledge of long-
cycled insurance industry
Independence of the Board ensures strong oversight
and aligns company strategy with shareholder interests
• 12 of 13 directors are independent
• Empowered Independent Chairman role
• Audit, Nominating and Human Resources Committees
composed entirely of independent directors
Our Board has the necessary expertise to oversee Argo’s strategy and effectively balances
continuity in an industry marked by long business cycles, with the need for fresh, diverse
perspectives
37
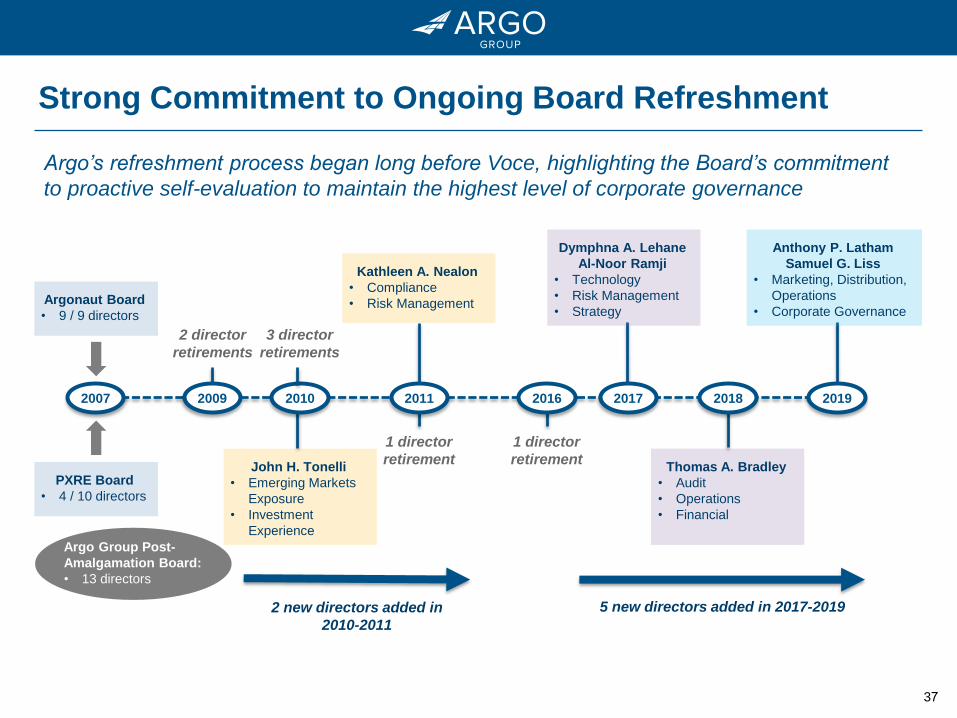
Argo’s refreshment process began long before Voce, highlighting the Board’s commitment
to proactive self-evaluation to maintain the highest level of corporate governance
Strong Commitment to Ongoing Board Refreshment
5 new directors added in 2017-2019
2010 2017 2019
2 new directors added in
2010-2011
Kathleen A. Nealon
• Compliance
• Risk Management
2018
Thomas A. Bradley
• Audit
• Operations
• Financial
Dymphna A. Lehane
Al-Noor Ramji
• Technology
• Risk Management
• Strategy
Anthony P. Latham
Samuel G. Liss
• Marketing, Distribution,
Operations
• Corporate Governance
2007
Argonaut Board
• 9 / 9 directors
PXRE Board
• 4 / 10 directors
John H. Tonelli
• Emerging Markets
Exposure
• Investment
Experience
2 director
retirements
1 director
retirement
2009
1 director
retirement
3 director
retirements
Argo Group Post-
Amalgamation Board:
• 13 directors
•
2011 2016
38
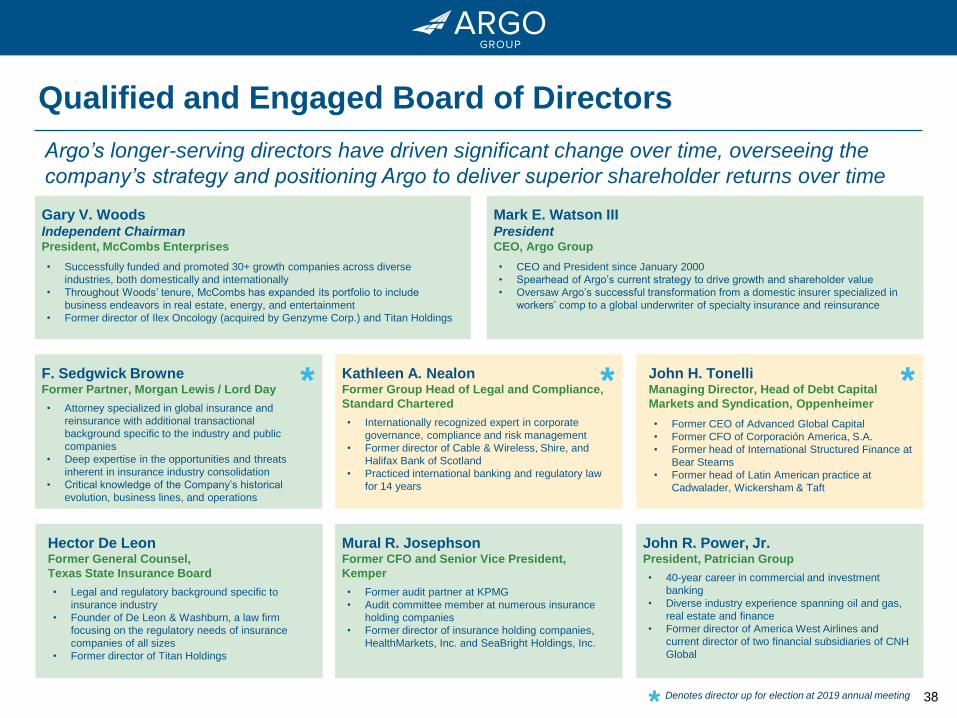
Argo’s longer-serving directors have driven significant change over time, overseeing the
company’s strategy and positioning Argo to deliver superior shareholder returns over time
Qualified and Engaged Board of Directors
Mural R. JosephsonFormer CFO and Senior Vice President,
Kemper
• Former audit partner at KPMG
• Audit committee member at numerous insurance
holding companies
• Former director of insurance holding companies,
HealthMarkets, Inc. and SeaBright Holdings, Inc.
Gary V. Woods Independent ChairmanPresident, McCombs Enterprises
• Successfully funded and promoted 30+ growth companies across diverse
industries, both domestically and internationally
• Throughout Woods’ tenure, McCombs has expanded its portfolio to include
business endeavors in real estate, energy, and entertainment
• Former director of Ilex Oncology (acquired by Genzyme Corp.) and Titan Holdings
Hector De LeonFormer General Counsel,
Texas State Insurance Board
• Legal and regulatory background specific to
insurance industry
• Founder of De Leon & Washburn, a law firm
focusing on the regulatory needs of insurance
companies of all sizes
• Former director of Titan Holdings
F. Sedgwick BrowneFormer Partner, Morgan Lewis / Lord Day
• Attorney specialized in global insurance and
reinsurance with additional transactional
background specific to the industry and public
companies
• Deep expertise in the opportunities and threats
inherent in insurance industry consolidation
• Critical knowledge of the Company’s historical
evolution, business lines, and operations
*
Denotes director up for election at 2019 annual meeting*
John R. Power, Jr.President, Patrician Group
• 40-year career in commercial and investment
banking
• Diverse industry experience spanning oil and gas,
real estate and finance
• Former director of America West Airlines and
current director of two financial subsidiaries of CNH
Global
Mark E. Watson IIIPresidentCEO, Argo Group
• CEO and President since January 2000
• Spearhead of Argo’s current strategy to drive growth and shareholder value
• Oversaw Argo’s successful transformation from a domestic insurer specialized in
workers’ comp to a global underwriter of specialty insurance and reinsurance
Kathleen A. NealonFormer Group Head of Legal and Compliance,
Standard Chartered
• Internationally recognized expert in corporate
governance, compliance and risk management
• Former director of Cable & Wireless, Shire, and
Halifax Bank of Scotland
• Practiced international banking and regulatory law
for 14 years
* John H. TonelliManaging Director, Head of Debt Capital
Markets and Syndication, Oppenheimer
• Former CEO of Advanced Global Capital
• Former CFO of Corporación America, S.A.
• Former head of International Structured Finance at
Bear Stearns
• Former head of Latin American practice at
Cadwalader, Wickersham & Taft
*
39
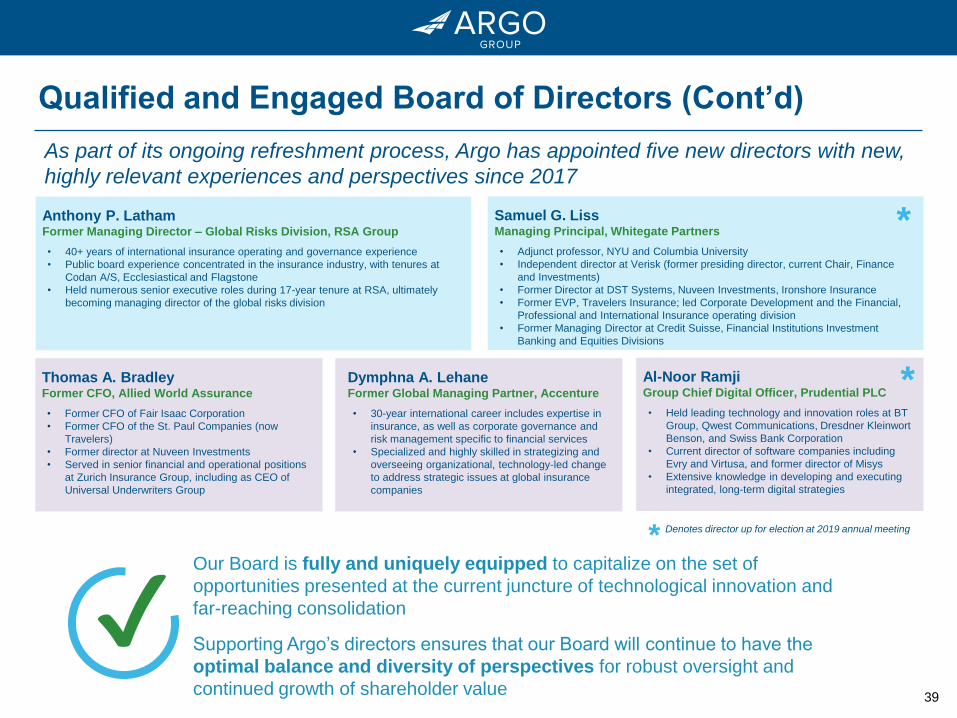
Qualified and Engaged Board of Directors (Cont’d)
Samuel G. LissManaging Principal, Whitegate Partners
• Adjunct professor, NYU and Columbia University
• Independent director at Verisk (former presiding director, current Chair, Finance
and Investments)
• Former Director at DST Systems, Nuveen Investments, Ironshore Insurance
• Former EVP, Travelers Insurance; led Corporate Development and the Financial,
Professional and International Insurance operating division
• Former Managing Director at Credit Suisse, Financial Institutions Investment
Banking and Equities Divisions
*Anthony P. LathamFormer Managing Director – Global Risks Division, RSA Group
• 40+ years of international insurance operating and governance experience
• Public board experience concentrated in the insurance industry, with tenures at
Codan A/S, Ecclesiastical and Flagstone
• Held numerous senior executive roles during 17-year tenure at RSA, ultimately
becoming managing director of the global risks division
Al-Noor RamjiGroup Chief Digital Officer, Prudential PLC
• Held leading technology and innovation roles at BT
Group, Qwest Communications, Dresdner Kleinwort
Benson, and Swiss Bank Corporation
• Current director of software companies including
Evry and Virtusa, and former director of Misys
• Extensive knowledge in developing and executing
integrated, long-term digital strategies
*
✔Our Board is fully and uniquely equipped to capitalize on the set of
opportunities presented at the current juncture of technological innovation and
far-reaching consolidation
Supporting Argo’s directors ensures that our Board will continue to have the
optimal balance and diversity of perspectives for robust oversight and
continued growth of shareholder value
Denotes director up for election at 2019 annual meeting*
Dymphna A. LehaneFormer Global Managing Partner, Accenture
• 30-year international career includes expertise in
insurance, as well as corporate governance and
risk management specific to financial services
• Specialized and highly skilled in strategizing and
overseeing organizational, technology-led change
to address strategic issues at global insurance
companies
Thomas A. BradleyFormer CFO, Allied World Assurance
• Former CFO of Fair Isaac Corporation
• Former CFO of the St. Paul Companies (now
Travelers)
• Former director at Nuveen Investments
• Served in senior financial and operational positions
at Zurich Insurance Group, including as CEO of
Universal Underwriters Group
As part of its ongoing refreshment process, Argo has appointed five new directors with new,
highly relevant experiences and perspectives since 2017
40
Today’s Agenda
Our Board’s Commitment to Investor Stewardship
4
Voce’s Campaign
5
Concluding Remarks
6
Argo has Generated Superior Shareholder Returns2
Argo’s Fundamental Operating Strategy is Delivering Results
3
Argo Overview
1
41
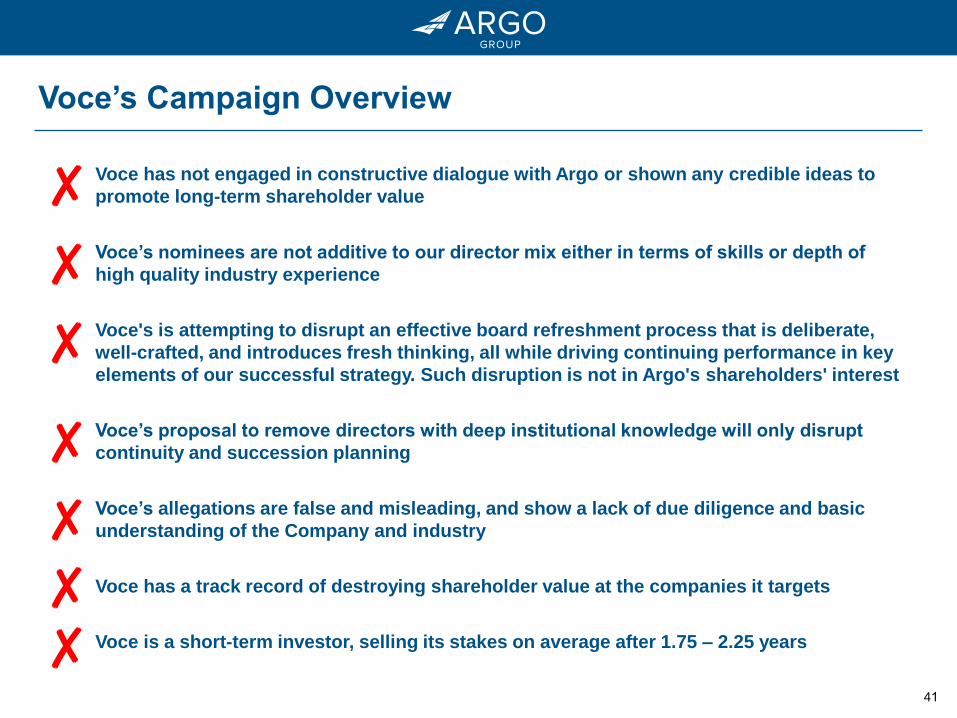
Voce’s Campaign Overview
Voce has not engaged in constructive dialogue with Argo or shown any credible ideas to
promote long-term shareholder value
Voce’s nominees are not additive to our director mix either in terms of skills or depth of
high quality industry experience
Voce's is attempting to disrupt an effective board refreshment process that is deliberate,
well-crafted, and introduces fresh thinking, all while driving continuing performance in key
elements of our successful strategy. Such disruption is not in Argo's shareholders' interest
Voce’s proposal to remove directors with deep institutional knowledge will only disrupt
continuity and succession planning
Voce’s allegations are false and misleading, and show a lack of due diligence and basic
understanding of the Company and industry
Voce has a track record of destroying shareholder value at the companies it targets
Voce is a short-term investor, selling its stakes on average after 1.75 – 2.25 years
✘
✘
✘
✘
✘
✘
✘
42
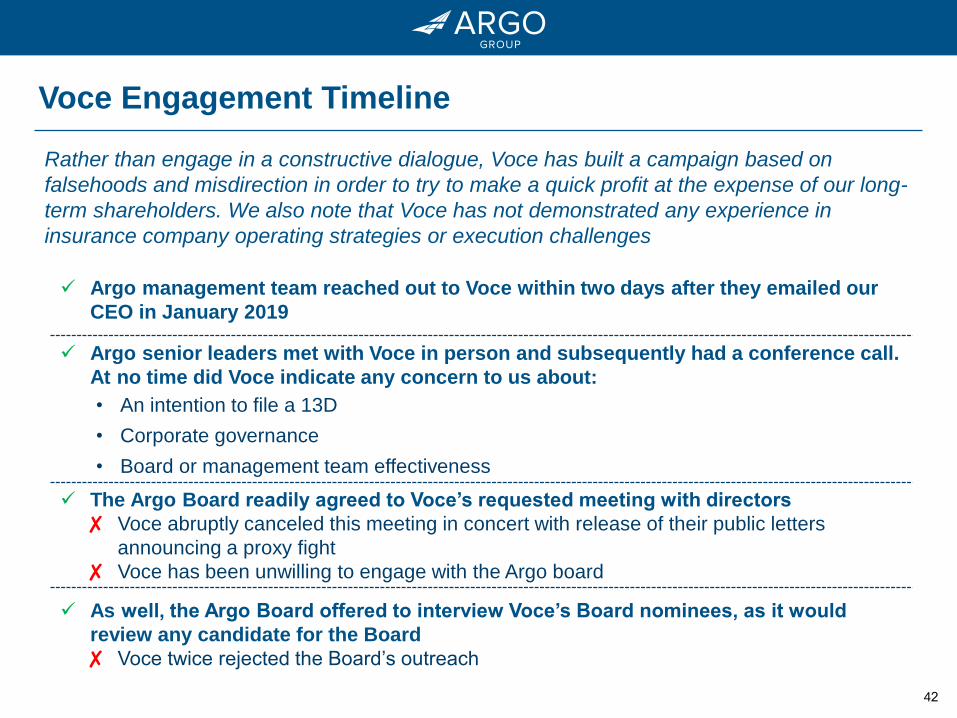
Voce Engagement Timeline
Argo management team reached out to Voce within two days after they emailed our
CEO in January 2019
Argo senior leaders met with Voce in person and subsequently had a conference call.
At no time did Voce indicate any concern to us about:
• An intention to file a 13D
• Corporate governance
• Board or management team effectiveness
The Argo Board readily agreed to Voce’s requested meeting with directors
✘ Voce abruptly canceled this meeting in concert with release of their public letters
announcing a proxy fight
✘ Voce has been unwilling to engage with the Argo board
As well, the Argo Board offered to interview Voce’s Board nominees, as it would
review any candidate for the Board
✘ Voce twice rejected the Board’s outreach
Rather than engage in a constructive dialogue, Voce has built a campaign based on
falsehoods and misdirection in order to try to make a quick profit at the expense of our long-
term shareholders. We also note that Voce has not demonstrated any experience in
insurance company operating strategies or execution challenges
43
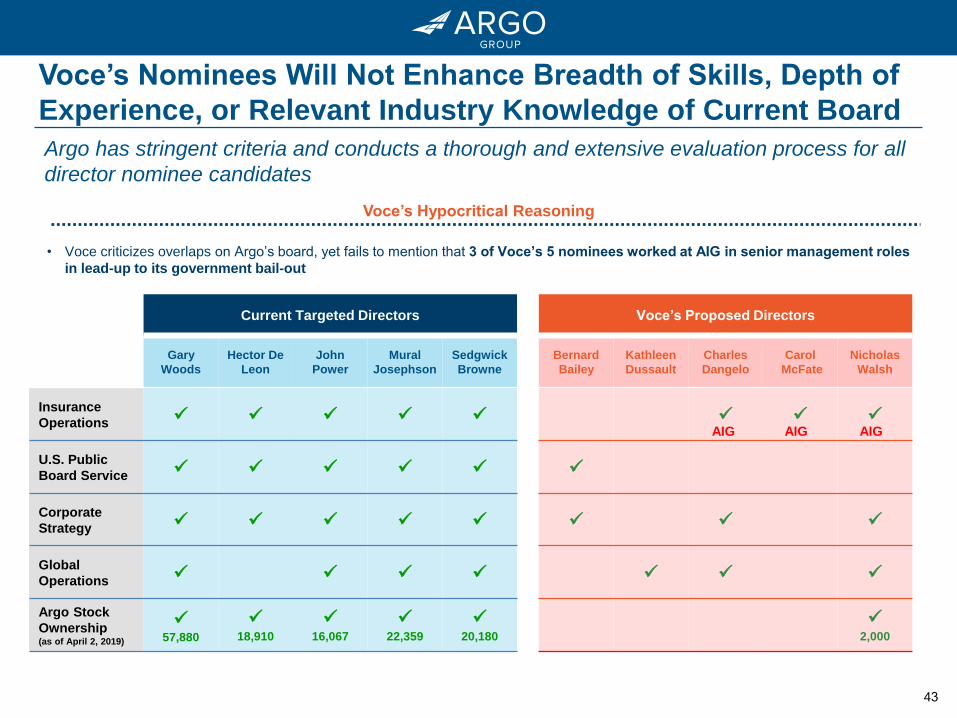
Voce’s Nominees Will Not Enhance Breadth of Skills, Depth of
Experience, or Relevant Industry Knowledge of Current Board
Current Targeted Directors Voce’s Proposed Directors
Gary
Woods
Hector De
Leon
John
Power
Mural
Josephson
Sedgwick
Browne
Bernard
Bailey
Kathleen
Dussault
Charles
Dangelo
Carol
McFate
Nicholas
Walsh
Insurance
Operations
U.S. Public
Board Service
Corporate
Strategy
Global
Operations
Argo Stock
Ownership(as of April 2, 2019)
57,880
18,910
16,067
22,359
20,180
2,000
AIG AIGAIG
Voce’s Hypocritical Reasoning
• Voce criticizes overlaps on Argo’s board, yet fails to mention that 3 of Voce’s 5 nominees worked at AIG in senior management roles
in lead-up to its government bail-out
Argo has stringent criteria and conducts a thorough and extensive evaluation process for all
director nominee candidates
44
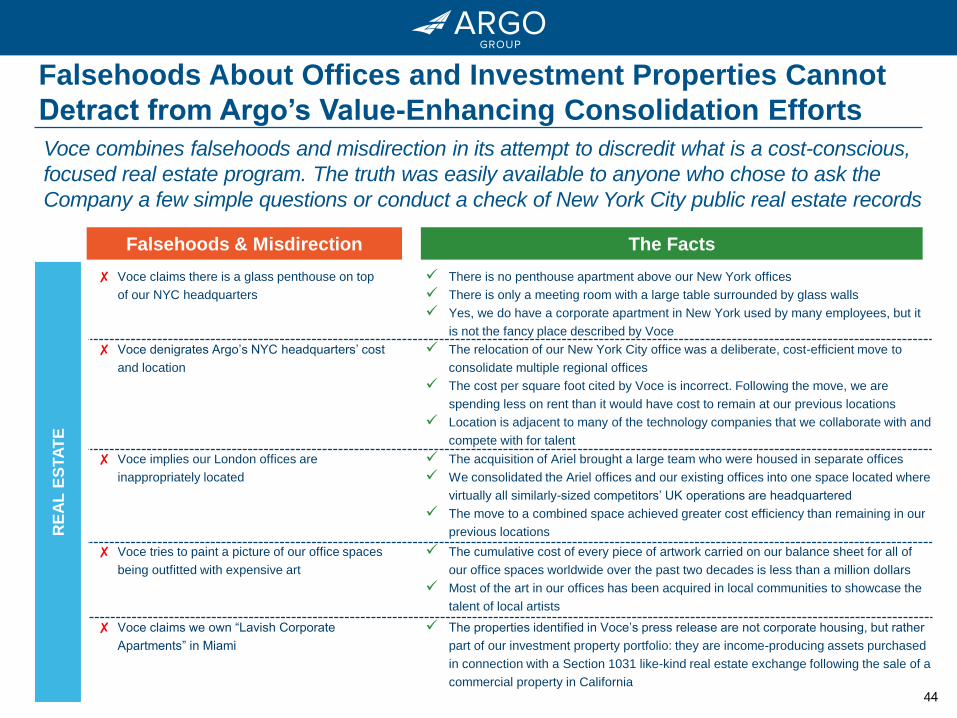
Falsehoods & Misdirection The Facts
RE
AL
ES
TA
TE
Voce combines falsehoods and misdirection in its attempt to discredit what is a cost-conscious,
focused real estate program. The truth was easily available to anyone who chose to ask the
Company a few simple questions or conduct a check of New York City public real estate records
✘ Voce claims there is a glass penthouse on top
of our NYC headquarters
There is no penthouse apartment above our New York offices
There is only a meeting room with a large table surrounded by glass walls
Yes, we do have a corporate apartment in New York used by many employees, but it
is not the fancy place described by Voce
✘ Voce denigrates Argo’s NYC headquarters’ cost
and location
The relocation of our New York City office was a deliberate, cost-efficient move to
consolidate multiple regional offices
The cost per square foot cited by Voce is incorrect. Following the move, we are
spending less on rent than it would have cost to remain at our previous locations
Location is adjacent to many of the technology companies that we collaborate with and
compete with for talent
✘ Voce implies our London offices are
inappropriately located
The acquisition of Ariel brought a large team who were housed in separate offices
We consolidated the Ariel offices and our existing offices into one space located where
virtually all similarly-sized competitors’ UK operations are headquartered
The move to a combined space achieved greater cost efficiency than remaining in our
previous locations
✘ Voce tries to paint a picture of our office spaces
being outfitted with expensive art
The cumulative cost of every piece of artwork carried on our balance sheet for all of
our office spaces worldwide over the past two decades is less than a million dollars
Most of the art in our offices has been acquired in local communities to showcase the
talent of local artists
✘ Voce claims we own “Lavish Corporate
Apartments” in Miami
The properties identified in Voce’s press release are not corporate housing, but rather
part of our investment property portfolio: they are income-producing assets purchased
in connection with a Section 1031 like-kind real estate exchange following the sale of a
commercial property in California
Falsehoods About Offices and Investment Properties Cannot
Detract from Argo’s Value-Enhancing Consolidation Efforts
45
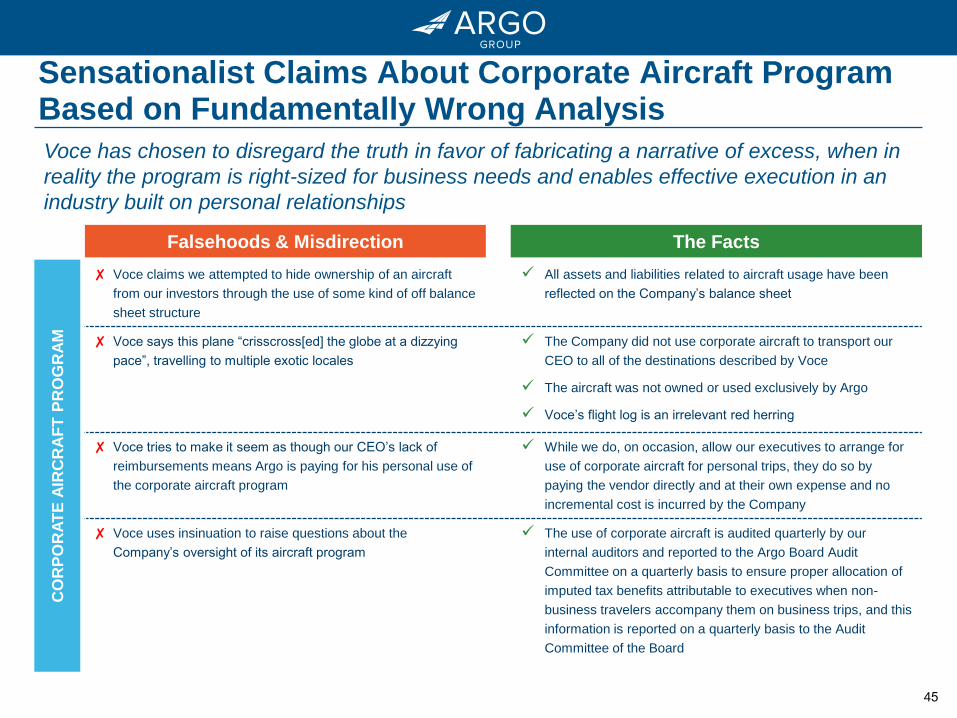
Falsehoods & Misdirection
Sensationalist Claims About Corporate Aircraft Program Based on Fundamentally Wrong Analysis
✘ Voce claims we attempted to hide ownership of an aircraft
from our investors through the use of some kind of off balance
sheet structure
All assets and liabilities related to aircraft usage have been
reflected on the Company’s balance sheet
✘ Voce says this plane “crisscross[ed] the globe at a dizzying
pace”, travelling to multiple exotic locales
The Company did not use corporate aircraft to transport our
CEO to all of the destinations described by Voce
The aircraft was not owned or used exclusively by Argo
Voce’s flight log is an irrelevant red herring
✘ Voce tries to make it seem as though our CEO’s lack of
reimbursements means Argo is paying for his personal use of
the corporate aircraft program
While we do, on occasion, allow our executives to arrange for
use of corporate aircraft for personal trips, they do so by
paying the vendor directly and at their own expense and no
incremental cost is incurred by the Company
✘ Voce uses insinuation to raise questions about the
Company’s oversight of its aircraft program
The use of corporate aircraft is audited quarterly by our
internal auditors and reported to the Argo Board Audit
Committee on a quarterly basis to ensure proper allocation of
imputed tax benefits attributable to executives when non-
business travelers accompany them on business trips, and this
information is reported on a quarterly basis to the Audit
Committee of the Board
The Facts
CO
RP
OR
AT
E A
IRC
RA
FT
PR
OG
RA
M
Voce has chosen to disregard the truth in favor of fabricating a narrative of excess, when in
reality the program is right-sized for business needs and enables effective execution in an
industry built on personal relationships
46
Falsehoods & Misdirection The Facts
SP
ON
SO
RS
HIP
PR
OG
RA
M
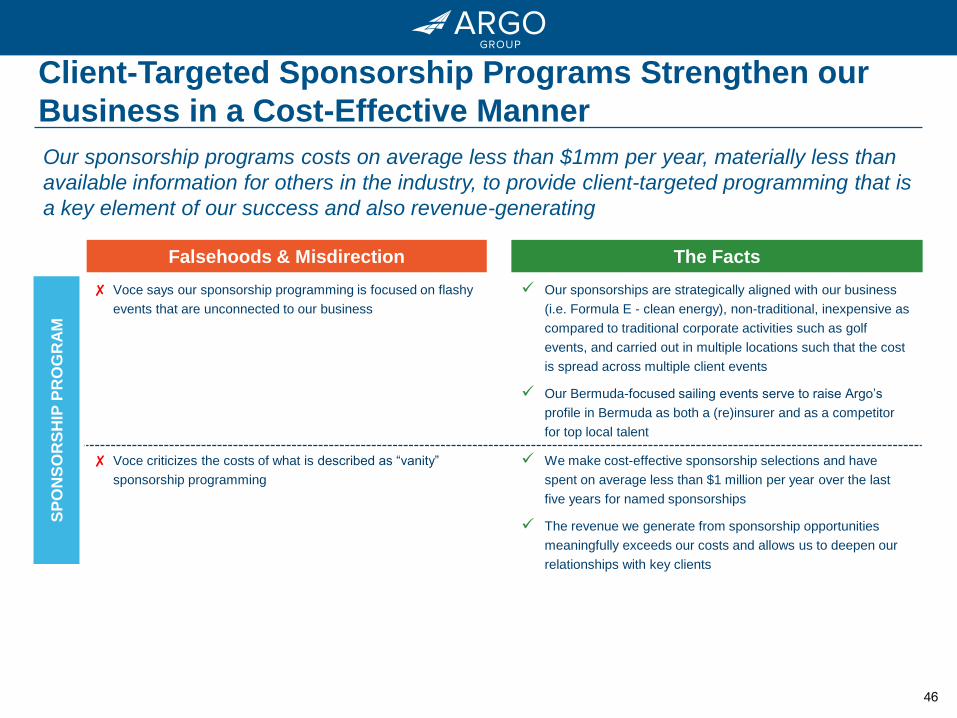
Client-Targeted Sponsorship Programs Strengthen our
Business in a Cost-Effective Manner
✘ Voce says our sponsorship programming is focused on flashy
events that are unconnected to our business
Our sponsorships are strategically aligned with our business
(i.e. Formula E - clean energy), non-traditional, inexpensive as
compared to traditional corporate activities such as golf
events, and carried out in multiple locations such that the cost
is spread across multiple client events
Our Bermuda-focused sailing events serve to raise Argo’s
profile in Bermuda as both a (re)insurer and as a competitor
for top local talent
✘ Voce criticizes the costs of what is described as “vanity”
sponsorship programming
We make cost-effective sponsorship selections and have
spent on average less than $1 million per year over the last
five years for named sponsorships
The revenue we generate from sponsorship opportunities
meaningfully exceeds our costs and allows us to deepen our
relationships with key clients
Our sponsorship programs costs on average less than $1mm per year, materially less than
available information for others in the industry, to provide client-targeted programming that is
a key element of our success and also revenue-generating
47
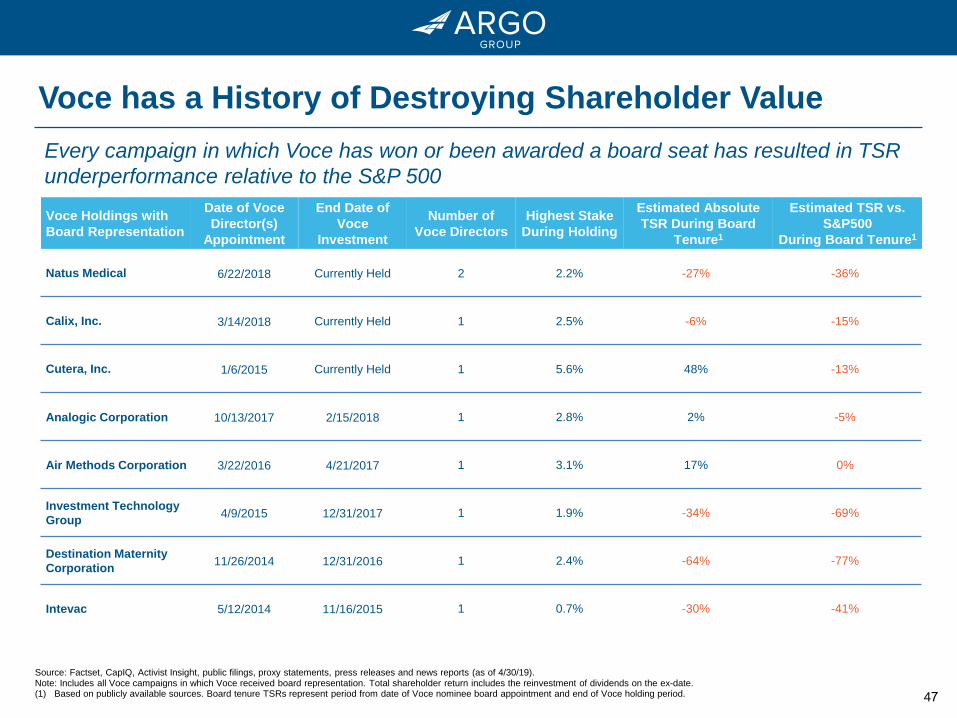
Voce has a History of Destroying Shareholder Value
Source: Factset, CapIQ, Activist Insight, public filings, proxy statements, press releases and news reports (as of 4/30/19).Note: Includes all Voce campaigns in which Voce received board representation. Total shareholder return includes the reinvestment of dividends on the ex-date.(1) Based on publicly available sources. Board tenure TSRs represent period from date of Voce nominee board appointment and end of Voce holding period.
Every campaign in which Voce has won or been awarded a board seat has resulted in TSR
underperformance relative to the S&P 500
Voce Holdings with
Board Representation
Date of Voce
Director(s)
Appointment
End Date of
Voce
Investment
Number of
Voce Directors
Highest Stake
During Holding
Estimated Absolute
TSR During Board
Tenure1
Estimated TSR vs.
S&P500
During Board Tenure1
Natus Medical 6/22/2018 Currently Held 2 2.2% -27% -36%
Calix, Inc. 3/14/2018 Currently Held 1 2.5% -6% -15%
Cutera, Inc. 1/6/2015 Currently Held 1 5.6% 48% -13%
Analogic Corporation 10/13/2017 2/15/2018 1 2.8% 2% -5%
Air Methods Corporation 3/22/2016 4/21/2017 1 3.1% 17% 0%
Investment Technology
Group4/9/2015 12/31/2017 1 1.9% -34% -69%
Destination Maternity
Corporation11/26/2014 12/31/2016 1 2.4% -64% -77%
Intevac 5/12/2014 11/16/2015 1 0.7% -30% -41%
48
Today’s Agenda
Our Board’s Commitment to Investor Stewardship
4
Voce’s Campaign
5
Concluding Remarks
6
Argo has Generated Superior Shareholder Returns2
Argo’s Fundamental Operating Strategy is Delivering Results
3
Argo Overview
1
49
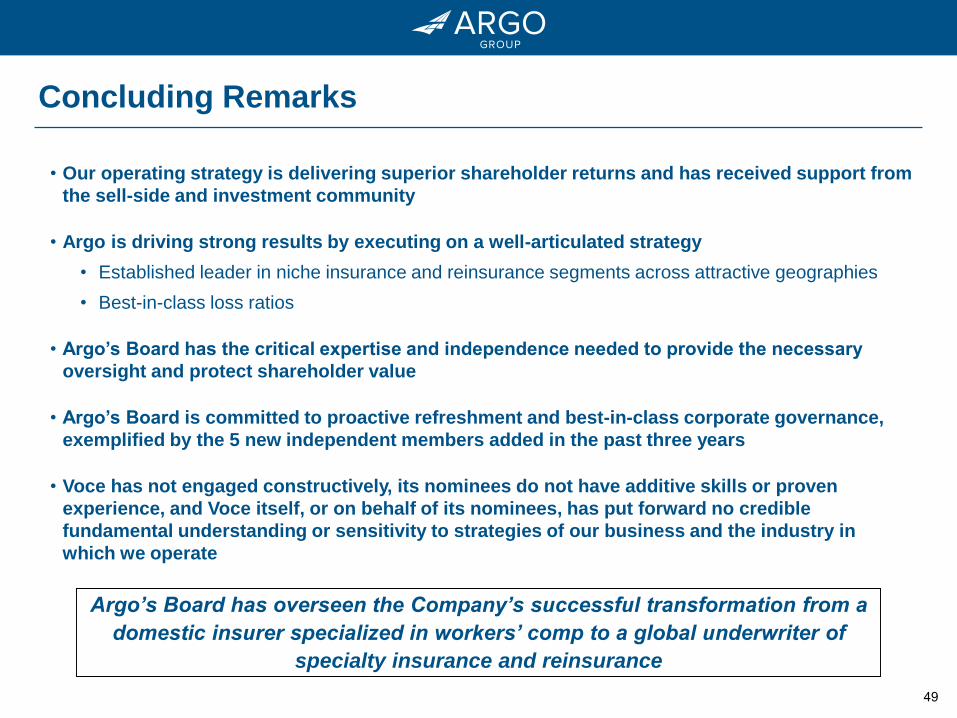
Concluding Remarks
Argo’s Board has overseen the Company’s successful transformation from a
domestic insurer specialized in workers’ comp to a global underwriter of
specialty insurance and reinsurance
• Our operating strategy is delivering superior shareholder returns and has received support from
the sell-side and investment community
• Argo is driving strong results by executing on a well-articulated strategy
• Established leader in niche insurance and reinsurance segments across attractive geographies
• Best-in-class loss ratios
• Argo’s Board has the critical expertise and independence needed to provide the necessary
oversight and protect shareholder value
• Argo’s Board is committed to proactive refreshment and best-in-class corporate governance,
exemplified by the 5 new independent members added in the past three years
• Voce has not engaged constructively, its nominees do not have additive skills or proven
experience, and Voce itself, or on behalf of its nominees, has put forward no credible
fundamental understanding or sensitivity to strategies of our business and the industry in
which we operate
50
Appendix:
Operating Performance
51
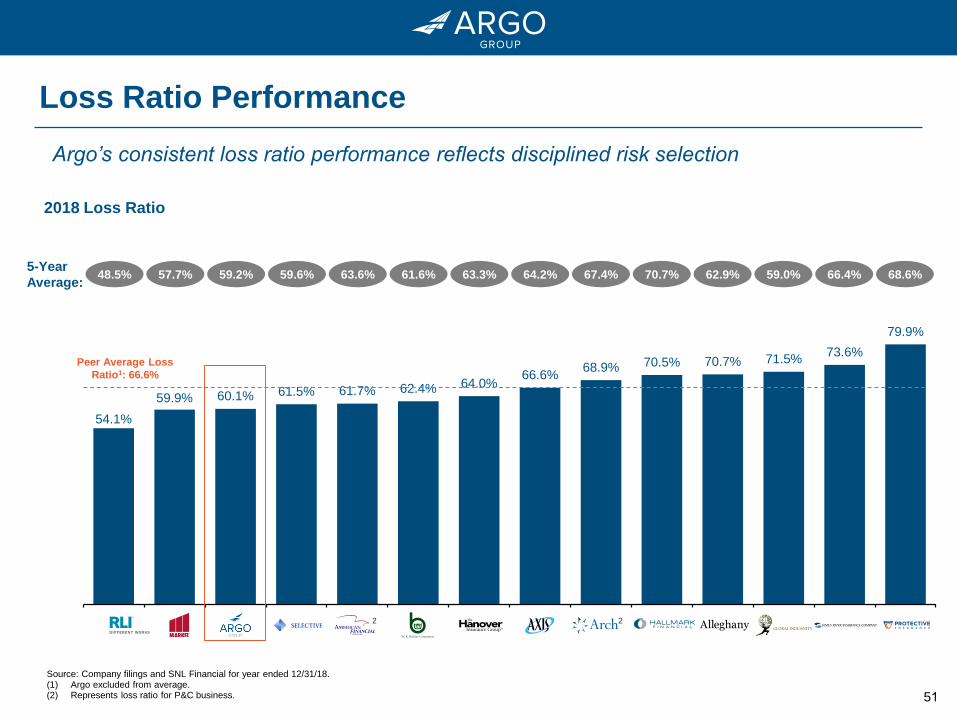
79.9%
73.6% 71.5% 70.7% 70.5% 68.9%
66.6% 64.0% 62.4% 61.7% 61.5% 60.1% 59.9%
54.1%
PTVCBJRVRGBLIYHALLACGLAXSTHGWRBAFGSIGIARGOMKLRLI
2018 Loss Ratio
Loss Ratio Performance
Peer Average Loss
Ratio1: 66.6%
Argo’s consistent loss ratio performance reflects disciplined risk selection
Source: Company filings and SNL Financial for year ended 12/31/18.(1) Argo excluded from average.(2) Represents loss ratio for P&C business.
68.6%66.4%5-Year
Average:48.5% 57.7% 59.2% 59.6% 63.6% 61.6% 63.3% 64.2% 70.7% 62.9% 59.0%67.4%
2 2
52
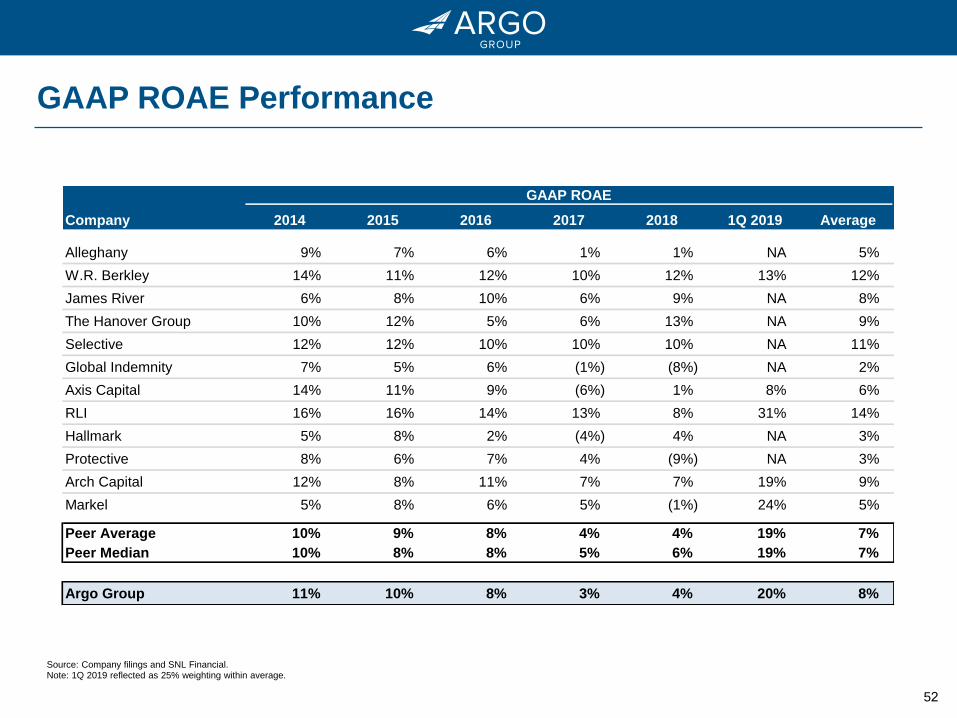
GAAP ROAE Performance
GAAP ROAE
Company 2014 2015 2016 2017 2018 1Q 2019 Average
Alleghany 9% 7% 6% 1% 1% NA 5%
W.R. Berkley 14% 11% 12% 10% 12% 13% 12%
James River 6% 8% 10% 6% 9% NA 8%
The Hanover Group 10% 12% 5% 6% 13% NA 9%
Selective 12% 12% 10% 10% 10% NA 11%
Global Indemnity 7% 5% 6% (1%) (8%) NA 2%
Axis Capital 14% 11% 9% (6%) 1% 8% 6%
RLI 16% 16% 14% 13% 8% 31% 14%
Hallmark 5% 8% 2% (4%) 4% NA 3%
Protective 8% 6% 7% 4% (9%) NA 3%
Arch Capital 12% 8% 11% 7% 7% 19% 9%
Markel 5% 8% 6% 5% (1%) 24% 5%
Peer Average 10% 9% 8% 4% 4% 19% 7%
Peer Median 10% 8% 8% 5% 6% 19% 7%
Argo Group 11% 10% 8% 3% 4% 20% 8%
Source: Company filings and SNL Financial.Note: 1Q 2019 reflected as 25% weighting within average.
53
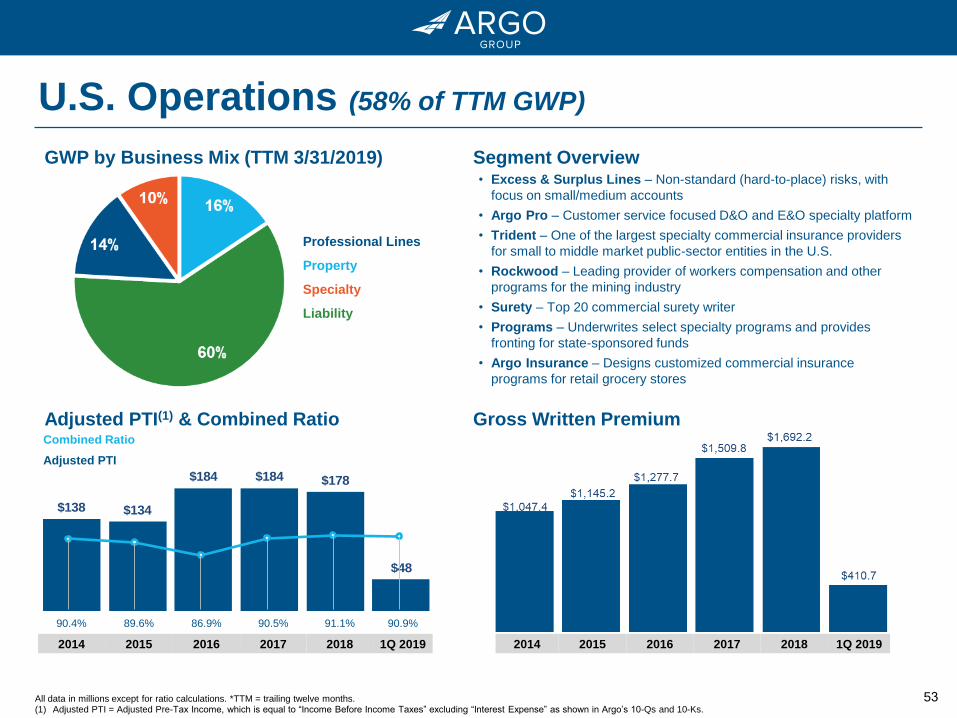
U.S. Operations (58% of TTM GWP)
All data in millions except for ratio calculations. *TTM = trailing twelve months.(1) Adjusted PTI = Adjusted Pre-Tax Income, which is equal to “Income Before Income Taxes” excluding “Interest Expense” as shown in Argo’s 10-Qs and 10-Ks.
GWP by Business Mix (TTM 3/31/2019) Segment Overview
Adjusted PTI(1) & Combined Ratio Gross Written Premium
• Excess & Surplus Lines – Non-standard (hard-to-place) risks, with
focus on small/medium accounts
• Argo Pro – Customer service focused D&O and E&O specialty platform
• Trident – One of the largest specialty commercial insurance providers
for small to middle market public-sector entities in the U.S.
• Rockwood – Leading provider of workers compensation and other
programs for the mining industry
• Surety – Top 20 commercial surety writer
• Programs – Underwrites select specialty programs and provides
fronting for state-sponsored funds
• Argo Insurance – Designs customized commercial insurance
programs for retail grocery stores
Combined Ratio
Adjusted PTI
90.4% 89.6% 86.9% 90.5% 91.1% 90.9%
2014 2015 2016 2017 2018 1Q 2019 2014 2015 2016 2017 2018 1Q 2019
Professional Lines
Property
Specialty
Liability
$138 $134
$184 $184 $178
$48
54
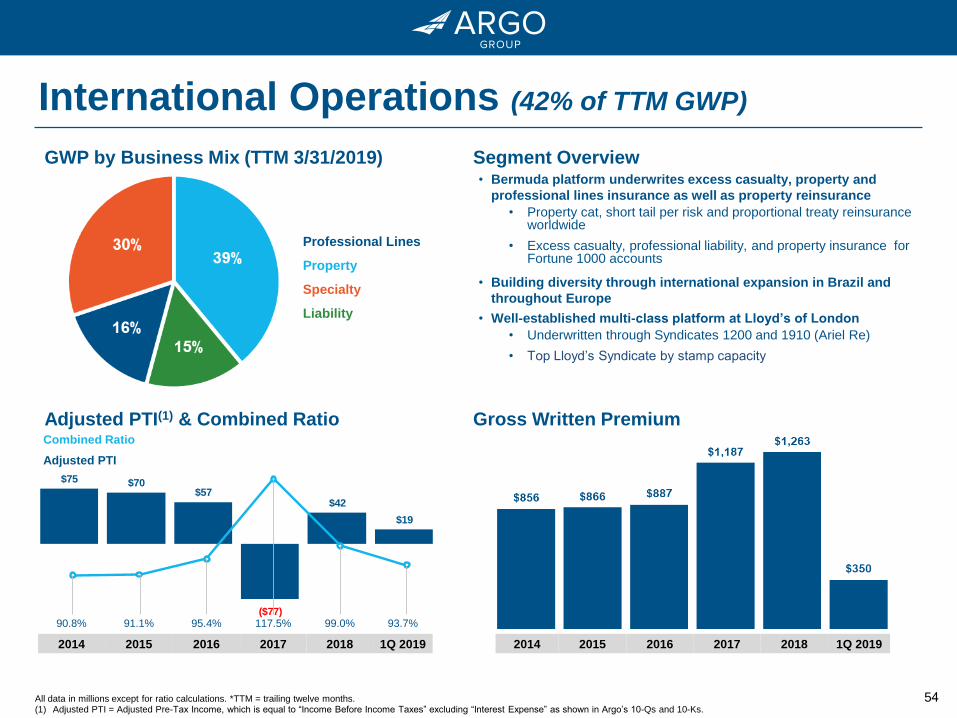
International Operations (42% of TTM GWP)
All data in millions except for ratio calculations. *TTM = trailing twelve months.(1) Adjusted PTI = Adjusted Pre-Tax Income, which is equal to “Income Before Income Taxes” excluding “Interest Expense” as shown in Argo’s 10-Qs and 10-Ks.
GWP by Business Mix (TTM 3/31/2019) Segment Overview
Adjusted PTI(1) & Combined Ratio Gross Written Premium
• Bermuda platform underwrites excess casualty, property and
professional lines insurance as well as property reinsurance
• Property cat, short tail per risk and proportional treaty reinsuranceworldwide
• Excess casualty, professional liability, and property insurance forFortune 1000 accounts
• Building diversity through international expansion in Brazil and
throughout Europe
• Well-established multi-class platform at Lloyd’s of London
• Underwritten through Syndicates 1200 and 1910 (Ariel Re)
• Top Lloyd’s Syndicate by stamp capacity
Combined Ratio
Adjusted PTI
90.8% 91.1% 95.4% 117.5% 99.0% 93.7%
2014 2015 2016 2017 2018 1Q 2019 2014 2015 2016 2017 2018 1Q 2019
Professional Lines
Property
Specialty
Liability
$75 $70 $57
($77)
$42
$19
55
Appendix:
Environmental, Social &
Governance
56
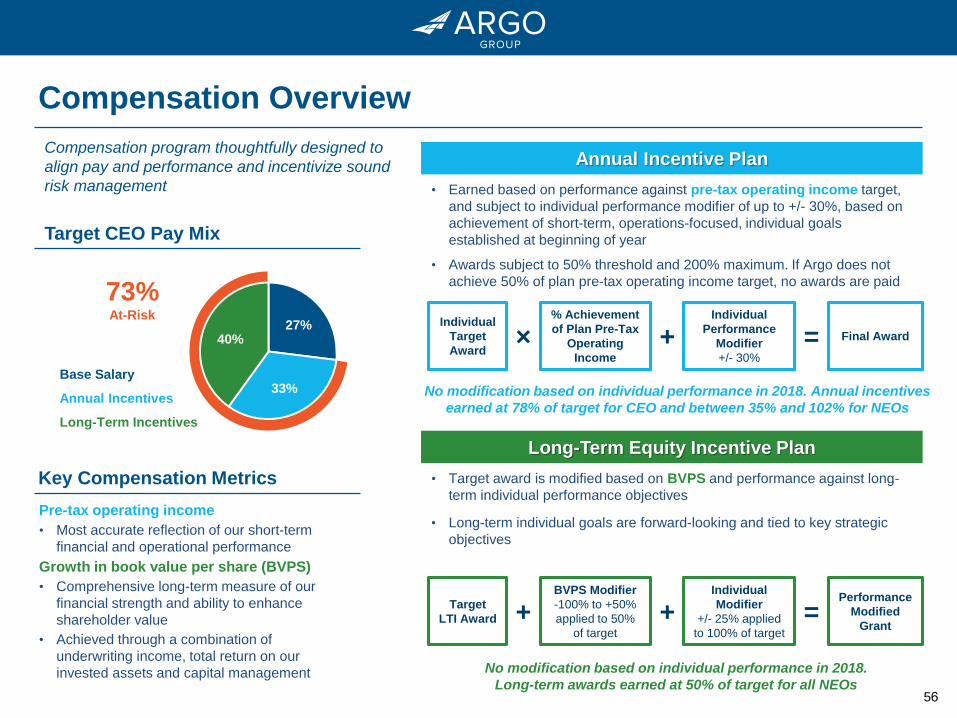
Compensation Overview
Target CEO Pay Mix
Base Salary
Annual Incentives
Long-Term Incentives
Annual Incentive Plan
• Earned based on performance against pre-tax operating income target,
and subject to individual performance modifier of up to +/- 30%, based on
achievement of short-term, operations-focused, individual goals
established at beginning of year
• Awards subject to 50% threshold and 200% maximum. If Argo does not
achieve 50% of plan pre-tax operating income target, no awards are paid
• Target award is modified based on BVPS and performance against long-
term individual performance objectives
• Long-term individual goals are forward-looking and tied to key strategic
objectives
Long-Term Equity Incentive Plan
73%At-Risk
Pre-tax operating income
• Most accurate reflection of our short-term
financial and operational performance
Growth in book value per share (BVPS)
• Comprehensive long-term measure of our
financial strength and ability to enhance
shareholder value
• Achieved through a combination of
underwriting income, total return on our
invested assets and capital management
Key Compensation Metrics
Individual
Target
Award
% Achievement
of Plan Pre-Tax
Operating
Income
Individual
Performance
Modifier
+/- 30%
Final Award
+
=×
Target
LTI Award
BVPS Modifier
-100% to +50%
applied to 50%
of target
Individual
Modifier
+/- 25% applied
to 100% of target
Performance
Modified
Grant=+
Compensation program thoughtfully designed to
align pay and performance and incentivize sound
risk management
27%
33%
40%
No modification based on individual performance in 2018. Annual incentives
earned at 78% of target for CEO and between 35% and 102% for NEOs
No modification based on individual performance in 2018.
Long-term awards earned at 50% of target for all NEOs
+
57
Incentivizing Continued Outperformance
• To incentivize continued outperformance over the
next several years, in November 2018, the Human
Resources Committee granted 3-year performance-
based equity awards to key executives
• Awards are tied to challenging stock price and
expense ratio hurdles, the achievement of which we
believe will drive outperformance
• Awards granted to six key executives
- For CEO, 75% of awards are tied to stock price
targets and 25% to expense ratio goals
- Weightings for other NEOs vary by individual,
with awards weighted either 75/25 or 50/50
between stock price and expense ratio goals
• Automatic forfeiture of entire award if stock price at
end of 3-year performance period is below the grant
date stock price
• Earned shares are subject to an additional 1-year
holding period following the end of the 3-year
performance period
• Awards subject to Argo’s clawback policy
Expense Ratio Reduction
Stock Price Targets
• In recognition of the importance of reducing our
expense ratio, the HR Committee tied a significant
portion of the 2018 Performance Awards to expense
ratio hurdles
• Expense ratio targets based on full year result by end
of 2021
• No payout for below target performance
• Our approach in the past has been to disclose hurdles
and achievement levels retroactively to provide
transparency to investors without the risks of
disclosing competitively sensitive information in
advance
• 2018 Performance Awards are tied to challenging
stock price goals, which require 25% growth for target
payouts
• At least 40% growth in our stock price is required for
the maximum payout at 200% of target
2018 performance-based equity awards incentivize achievement of ambitious
three-year stock price performance and expense ratio reduction goals
58
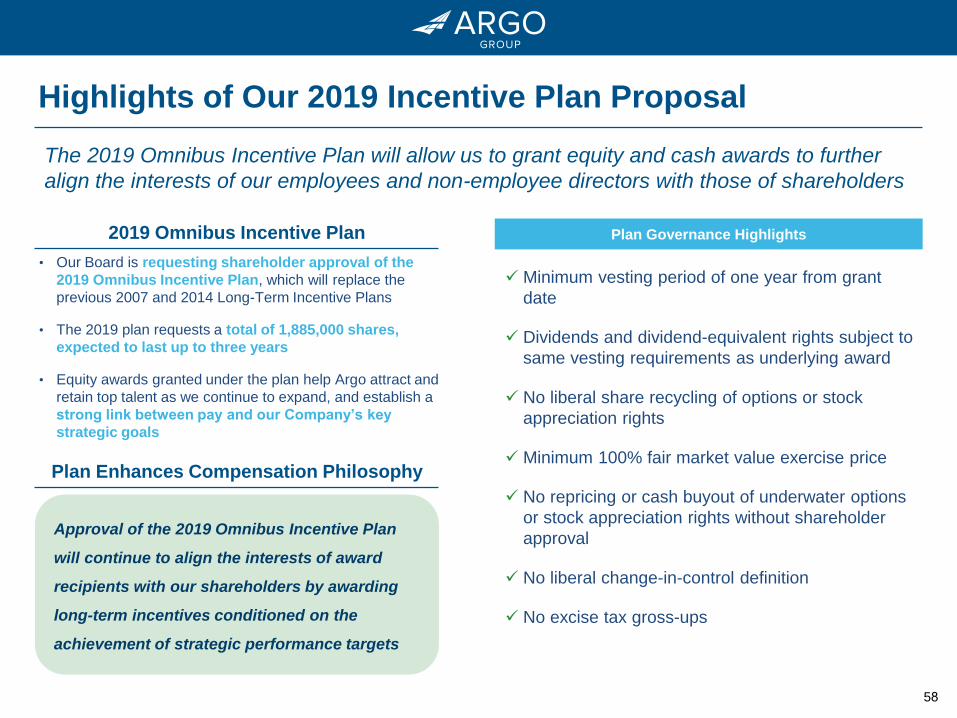
2019 Omnibus Incentive Plan
Highlights of Our 2019 Incentive Plan Proposal
The 2019 Omnibus Incentive Plan will allow us to grant equity and cash awards to further
align the interests of our employees and non-employee directors with those of shareholders
• Our Board is requesting shareholder approval of the
2019 Omnibus Incentive Plan, which will replace the
previous 2007 and 2014 Long-Term Incentive Plans
• The 2019 plan requests a total of 1,885,000 shares,
expected to last up to three years
• Equity awards granted under the plan help Argo attract and
retain top talent as we continue to expand, and establish a
strong link between pay and our Company’s key
strategic goals
Plan Governance Highlights
Minimum vesting period of one year from grant
date
Dividends and dividend-equivalent rights subject to
same vesting requirements as underlying award
No liberal share recycling of options or stock
appreciation rights
Minimum 100% fair market value exercise price
No repricing or cash buyout of underwater options
or stock appreciation rights without shareholder
approval
No liberal change-in-control definition
No excise tax gross-ups
Plan Enhances Compensation Philosophy
Approval of the 2019 Omnibus Incentive Plan
will continue to align the interests of award
recipients with our shareholders by awarding
long-term incentives conditioned on the
achievement of strategic performance targets
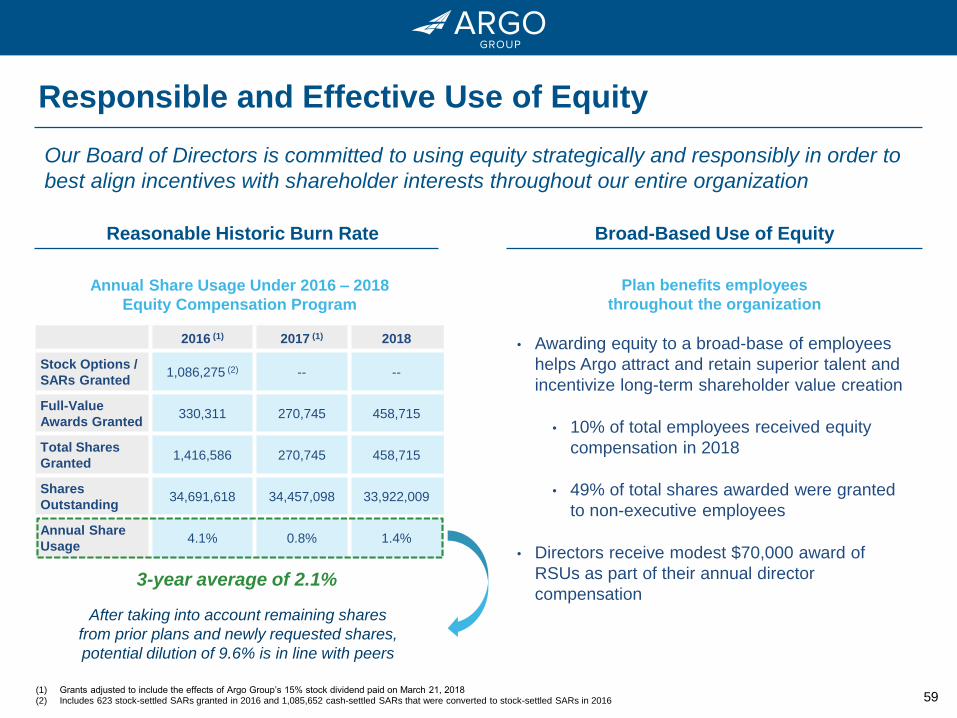
59
Reasonable Historic Burn Rate
Responsible and Effective Use of Equity
Our Board of Directors is committed to using equity strategically and responsibly in order to
best align incentives with shareholder interests throughout our entire organization
Broad-Based Use of Equity
3-year average of 2.1%
Annual Share Usage Under 2016 – 2018
Equity Compensation Program
2016 (1) 2017 (1) 2018
Stock Options /
SARs Granted1,086,275 (2) -- --
Full-Value
Awards Granted330,311 270,745 458,715
Total Shares
Granted1,416,586 270,745 458,715
Shares
Outstanding34,691,618 34,457,098 33,922,009
Annual Share
Usage4.1% 0.8% 1.4%
• Awarding equity to a broad-base of employees
helps Argo attract and retain superior talent and
incentivize long-term shareholder value creation
• 10% of total employees received equity
compensation in 2018
• 49% of total shares awarded were granted
to non-executive employees
• Directors receive modest $70,000 award of
RSUs as part of their annual director
compensation
Plan benefits employees
throughout the organization
(1) Grants adjusted to include the effects of Argo Group’s 15% stock dividend paid on March 21, 2018(2) Includes 623 stock-settled SARs granted in 2016 and 1,085,652 cash-settled SARs that were converted to stock-settled SARs in 2016
After taking into account remaining shares
from prior plans and newly requested shares,
potential dilution of 9.6% is in line with peers
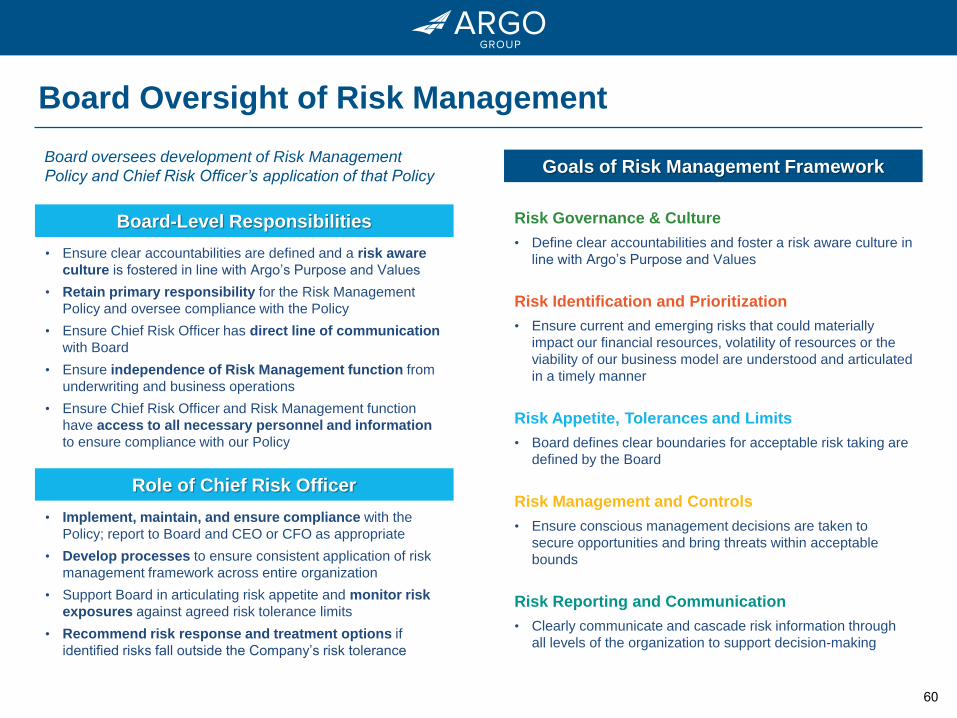
60
Board Oversight of Risk Management
Goals of Risk Management Framework
Risk Governance & Culture
• Define clear accountabilities and foster a risk aware culture in
line with Argo’s Purpose and Values
Risk Identification and Prioritization
• Ensure current and emerging risks that could materially
impact our financial resources, volatility of resources or the
viability of our business model are understood and articulated
in a timely manner
Risk Appetite, Tolerances and Limits
• Board defines clear boundaries for acceptable risk taking are
defined by the Board
Risk Management and Controls
• Ensure conscious management decisions are taken to
secure opportunities and bring threats within acceptable
bounds
Risk Reporting and Communication
• Clearly communicate and cascade risk information through
all levels of the organization to support decision-making
• Implement, maintain, and ensure compliance with the
Policy; report to Board and CEO or CFO as appropriate
• Develop processes to ensure consistent application of risk
management framework across entire organization
• Support Board in articulating risk appetite and monitor risk
exposures against agreed risk tolerance limits
• Recommend risk response and treatment options if
identified risks fall outside the Company’s risk tolerance
• Ensure clear accountabilities are defined and a risk aware
culture is fostered in line with Argo’s Purpose and Values
• Retain primary responsibility for the Risk Management
Policy and oversee compliance with the Policy
• Ensure Chief Risk Officer has direct line of communication
with Board
• Ensure independence of Risk Management function from
underwriting and business operations
• Ensure Chief Risk Officer and Risk Management function
have access to all necessary personnel and information
to ensure compliance with our Policy
Role of Chief Risk Officer
Board-Level Responsibilities
Board oversees development of Risk Management
Policy and Chief Risk Officer’s application of that Policy
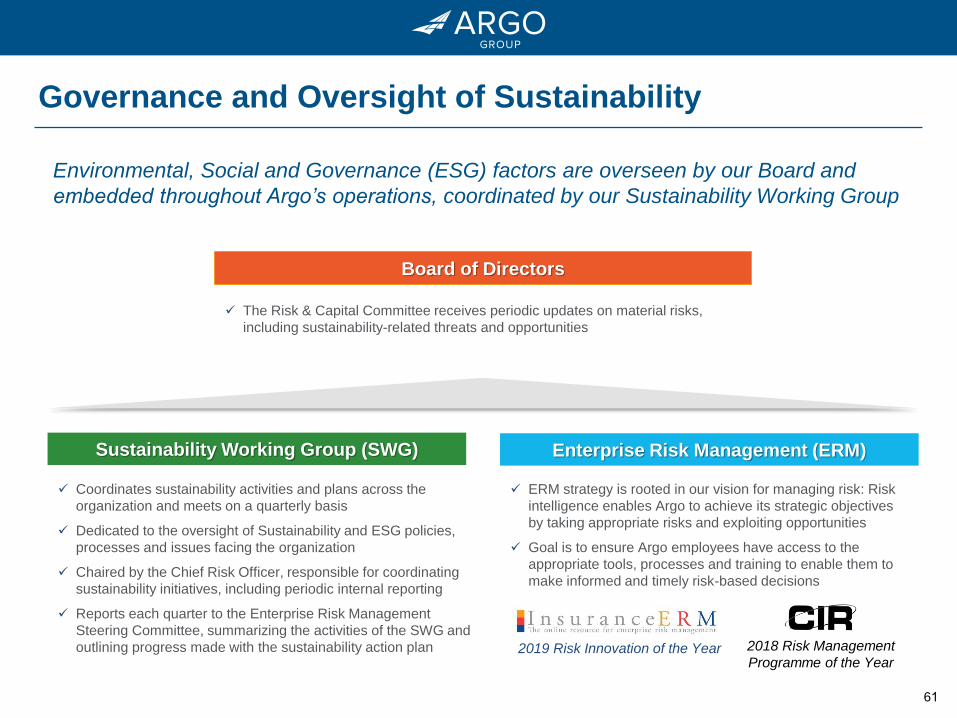
61
Governance and Oversight of Sustainability
Coordinates sustainability activities and plans across the
organization and meets on a quarterly basis
Dedicated to the oversight of Sustainability and ESG policies,
processes and issues facing the organization
Chaired by the Chief Risk Officer, responsible for coordinating
sustainability initiatives, including periodic internal reporting
Reports each quarter to the Enterprise Risk Management
Steering Committee, summarizing the activities of the SWG and
outlining progress made with the sustainability action plan
Environmental, Social and Governance (ESG) factors are overseen by our Board and
embedded throughout Argo’s operations, coordinated by our Sustainability Working Group
ERM strategy is rooted in our vision for managing risk: Risk
intelligence enables Argo to achieve its strategic objectives
by taking appropriate risks and exploiting opportunities
Goal is to ensure Argo employees have access to the
appropriate tools, processes and training to enable them to
make informed and timely risk-based decisions
Sustainability Working Group (SWG) Enterprise Risk Management (ERM)
Board of Directors
The Risk & Capital Committee receives periodic updates on material risks,
including sustainability-related threats and opportunities
2018 Risk Management
Programme of the Year2019 Risk Innovation of the Year
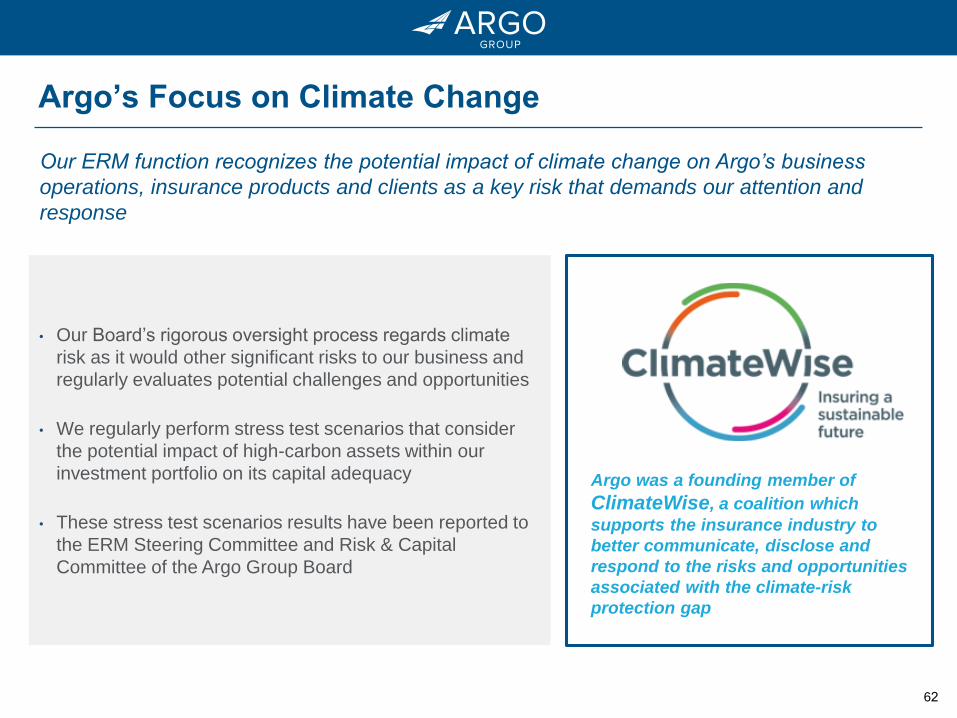
62
Argo’s Focus on Climate Change
Argo was a founding member of
ClimateWise, a coalition which
supports the insurance industry to
better communicate, disclose and
respond to the risks and opportunities
associated with the climate-risk
protection gap
Our ERM function recognizes the potential impact of climate change on Argo’s business
operations, insurance products and clients as a key risk that demands our attention and
response
• Our Board’s rigorous oversight process regards climate
risk as it would other significant risks to our business and
regularly evaluates potential challenges and opportunities
• We regularly perform stress test scenarios that consider
the potential impact of high-carbon assets within our
investment portfolio on its capital adequacy
• These stress test scenarios results have been reported to
the ERM Steering Committee and Risk & Capital
Committee of the Argo Group Board
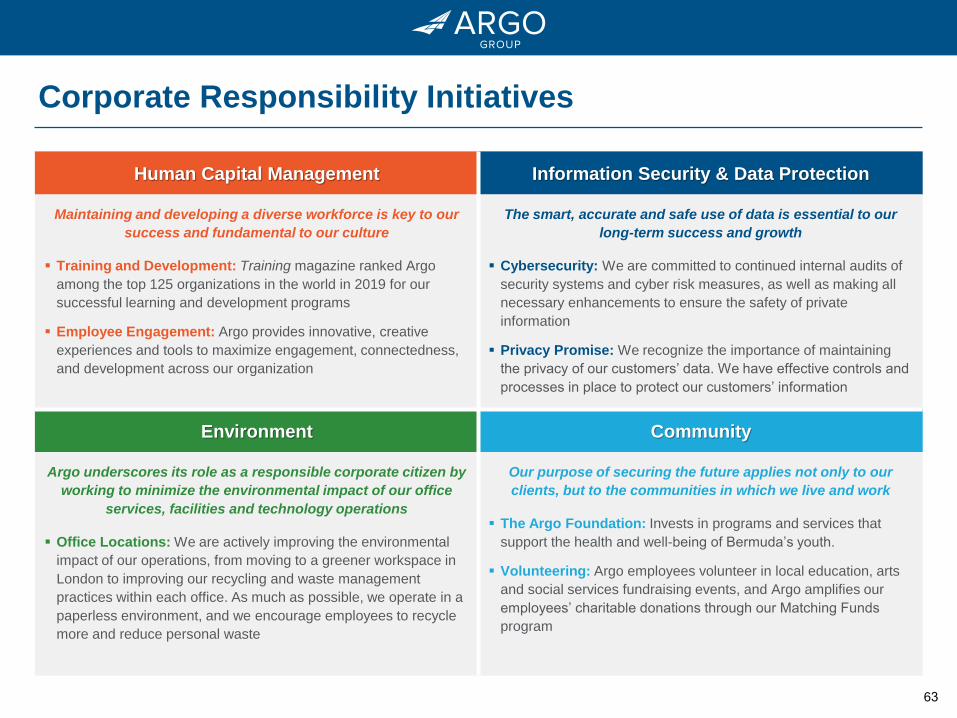
63
Corporate Responsibility Initiatives
Human Capital Management Information Security & Data Protection
Maintaining and developing a diverse workforce is key to our
success and fundamental to our culture
Training and Development: Training magazine ranked Argo
among the top 125 organizations in the world in 2019 for our
successful learning and development programs
Employee Engagement: Argo provides innovative, creative
experiences and tools to maximize engagement, connectedness,
and development across our organization
The smart, accurate and safe use of data is essential to our
long-term success and growth
Cybersecurity: We are committed to continued internal audits of
security systems and cyber risk measures, as well as making all
necessary enhancements to ensure the safety of private
information
Privacy Promise: We recognize the importance of maintaining
the privacy of our customers’ data. We have effective controls and
processes in place to protect our customers’ information
Environment Community
Argo underscores its role as a responsible corporate citizen by
working to minimize the environmental impact of our office
services, facilities and technology operations
Office Locations: We are actively improving the environmental
impact of our operations, from moving to a greener workspace in
London to improving our recycling and waste management
practices within each office. As much as possible, we operate in a
paperless environment, and we encourage employees to recycle
more and reduce personal waste
Our purpose of securing the future applies not only to our
clients, but to the communities in which we live and work
The Argo Foundation: Invests in programs and services that
support the health and well-being of Bermuda’s youth.
Volunteering: Argo employees volunteer in local education, arts
and social services fundraising events, and Argo amplifies our
employees’ charitable donations through our Matching Funds
program
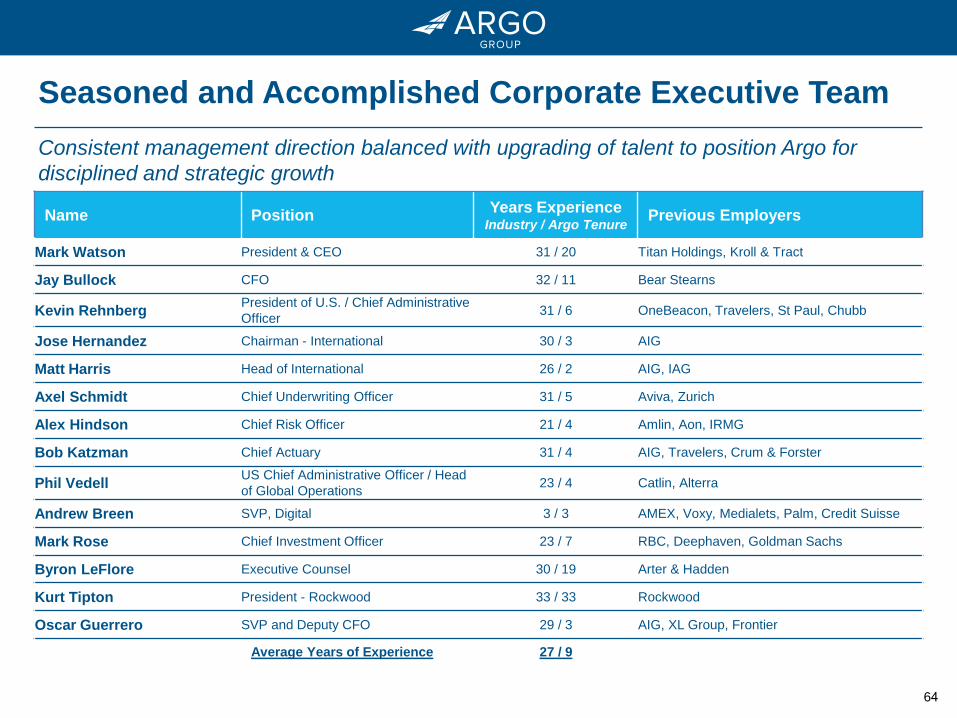
64
Seasoned and Accomplished Corporate Executive Team
Consistent management direction balanced with upgrading of talent to position Argo for
disciplined and strategic growth
Name PositionYears Experience
Industry / Argo TenurePrevious Employers
Mark Watson President & CEO 31 / 20 Titan Holdings, Kroll & Tract
Jay Bullock CFO 32 / 11 Bear Stearns
Kevin RehnbergPresident of U.S. / Chief Administrative
Officer31 / 6 OneBeacon, Travelers, St Paul, Chubb
Jose Hernandez Chairman - International 30 / 3 AIG
Matt Harris Head of International 26 / 2 AIG, IAG
Axel Schmidt Chief Underwriting Officer 31 / 5 Aviva, Zurich
Alex Hindson Chief Risk Officer 21 / 4 Amlin, Aon, IRMG
Bob Katzman Chief Actuary 31 / 4 AIG, Travelers, Crum & Forster
Phil VedellUS Chief Administrative Officer / Head
of Global Operations23 / 4 Catlin, Alterra
Andrew Breen SVP, Digital 3 / 3 AMEX, Voxy, Medialets, Palm, Credit Suisse
Mark Rose Chief Investment Officer 23 / 7 RBC, Deephaven, Goldman Sachs
Byron LeFlore Executive Counsel 30 / 19 Arter & Hadden
Kurt Tipton President - Rockwood 33 / 33 Rockwood
Oscar Guerrero SVP and Deputy CFO 29 / 3 AIG, XL Group, Frontier
Average Years of Experience 27 / 9
65
Appendix:
Reconciliation of Operating
Metrics
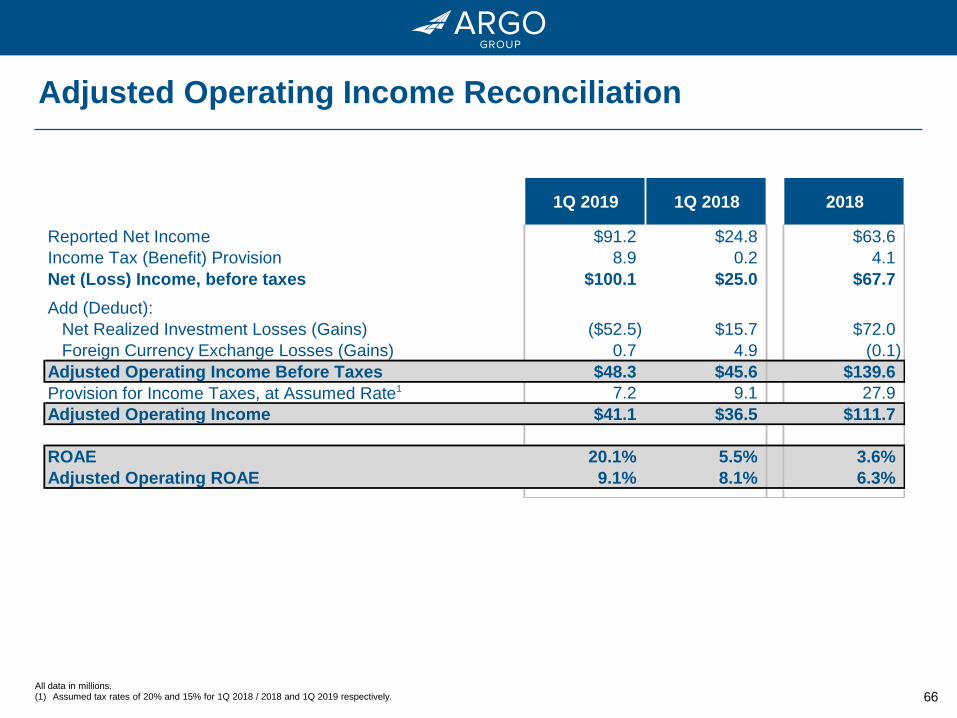
66
Adjusted Operating Income Reconciliation
All data in millions.(1) Assumed tax rates of 20% and 15% for 1Q 2018 / 2018 and 1Q 2019 respectively.
1Q 2019 1Q 2018 2018
Reported Net Income $91.2 $24.8 $63.6
Income Tax (Benefit) Provision 8.9 0.2 4.1
Net (Loss) Income, before taxes $100.1 $25.0 $67.7
Add (Deduct):
Net Realized Investment Losses (Gains) ($52.5) $15.7 $72.0
Foreign Currency Exchange Losses (Gains) 0.7 4.9 (0.1)
Adjusted Operating Income Before Taxes $48.3 $45.6 $139.6
Provision for Income Taxes, at Assumed Rate1 7.2 9.1 27.9
Adjusted Operating Income $41.1 $36.5 $111.7
ROAE 20.1% 5.5% 3.6%
Adjusted Operating ROAE 9.1% 8.1% 6.3%
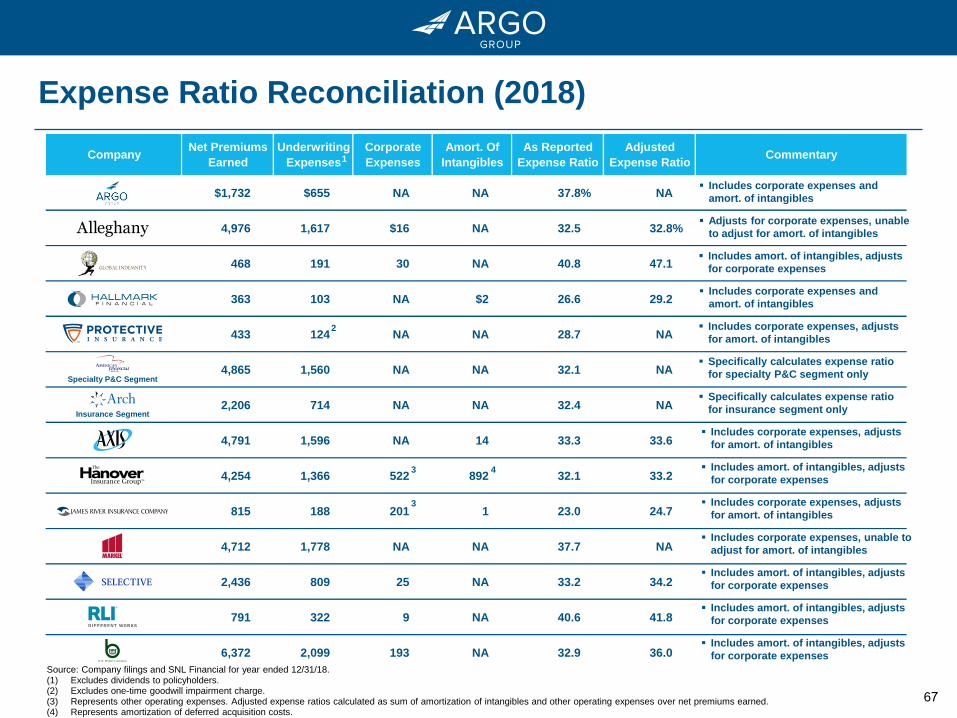
67
Expense Ratio Reconciliation (2018)
CompanyNet Premiums
Earned
Underwriting
Expenses
Corporate
Expenses
Amort. Of
Intangibles
As Reported
Expense Ratio
Adjusted
Expense RatioCommentary
$1,732 $655 NA NA 37.8% NA
4,976 1,617 $16 NA 32.5 32.8%
468 191 30 NA 40.8 47.1
363 103 NA $2 26.6 29.2
433 124 NA NA 28.7 NA
4,865 1,560 NA NA 32.1 NA
2,206 714 NA NA 32.4 NA
4,791 1,596 NA 14 33.3 33.6
4,254 1,366 522 892 32.1 33.2
815 188 201 1 23.0 24.7
4,712 1,778 NA NA 37.7 NA
2,436 809 25 NA 33.2 34.2
791 322 9 NA 40.6 41.8
6,372 2,099 193 NA 32.9 36.0
Includes corporate expenses and
amort. of intangibles
Adjusts for corporate expenses, unable
to adjust for amort. of intangibles
Includes amort. of intangibles, adjusts
for corporate expenses
Includes corporate expenses and
amort. of intangibles
Includes corporate expenses, adjusts
for amort. of intangibles
Specifically calculates expense ratio
for specialty P&C segment only
Specifically calculates expense ratio
for insurance segment only
Includes corporate expenses, adjusts
for amort. of intangibles
Includes amort. of intangibles, adjusts
for corporate expenses
Includes corporate expenses, adjusts
for amort. of intangibles
Includes corporate expenses, unable to
adjust for amort. of intangibles
Includes amort. of intangibles, adjusts
for corporate expenses
Includes amort. of intangibles, adjusts
for corporate expenses
Includes amort. of intangibles, adjusts
for corporate expenses
Specialty P&C Segment
Insurance Segment
2
3 4
3
Source: Company filings and SNL Financial for year ended 12/31/18.(1) Excludes dividends to policyholders.(2) Excludes one-time goodwill impairment charge. (3) Represents other operating expenses. Adjusted expense ratios calculated as sum of amortization of intangibles and other operating expenses over net premiums earned.(4) Represents amortization of deferred acquisition costs.
1
68
Notice to Recipient
ABOUT ARGO GROUP INTERNATIONAL HOLDINGS, LTD.
Argo Group International Holdings, Ltd. (NYSE: ARGO) is an international underwriter of specialty insurance and reinsurance products
in the property and casualty market. Argo Group offers a full line of products and services designed to meet the unique coverage and
claims handling needs of businesses in two primary segments: U.S. Operations and International Operations. Argo Group’s insurance
subsidiaries are A. M. Best-rated ‘A’ (Excellent) (third highest rating out of 16 rating classifications) with a stable outlook, and Argo
Group’s U.S. insurance subsidiaries are Standard and Poor’s-rated ‘A-‘(Strong) with a positive outlook. More information on Argo
Group and its subsidiaries is available at www.argolimited.com.
ADDITIONAL INFORMATION
Argo Group International Holdings, Ltd. (“Argo Group”) has filed a definitive proxy statement and WHITE proxy card with the U.S.
Securities and Exchange Commission (the “SEC”) in connection with its solicitation of proxies for its 2019 Annual General Meeting of
Shareholders (the “2019 Annual General Meeting”). ARGO GROUP SHAREHOLDERS ARE STRONGLY ENCOURAGED TO READ
THE DEFINITIVE PROXY STATEMENT (AND ANY AMENDMENTS AND SUPPLEMENTS THERETO) AND ACCOMPANYING
WHITE PROXY CARD AS THEY CONTAIN IMPORTANT INFORMATION. Shareholders may obtain the proxy statement, any
amendments or supplements to the proxy statement and other documents as and when filed by Argo Group with the SEC without
charge from the SEC’s website at www.sec.gov.
CERTAIN INFORMATION REGARDING PARTICIPANTS
Argo Group, its directors and certain of its executive officers may be deemed to be participants in connection with the solicitation of
proxies from Argo Group’s shareholders in connection with the matters to be considered at the 2019 Annual General Meeting.
Information regarding the identity of potential participants, and their direct or indirect interests, by security holdings or otherwise, is set
forth in the proxy statement and other materials to be filed with the SEC. These documents can be obtained free of charge from the
sources indicated above.