Embed Size (px)
Citation preview
1
0
10.000
20.000
30.000
40.000
50.000
60.000
70.000
80.000
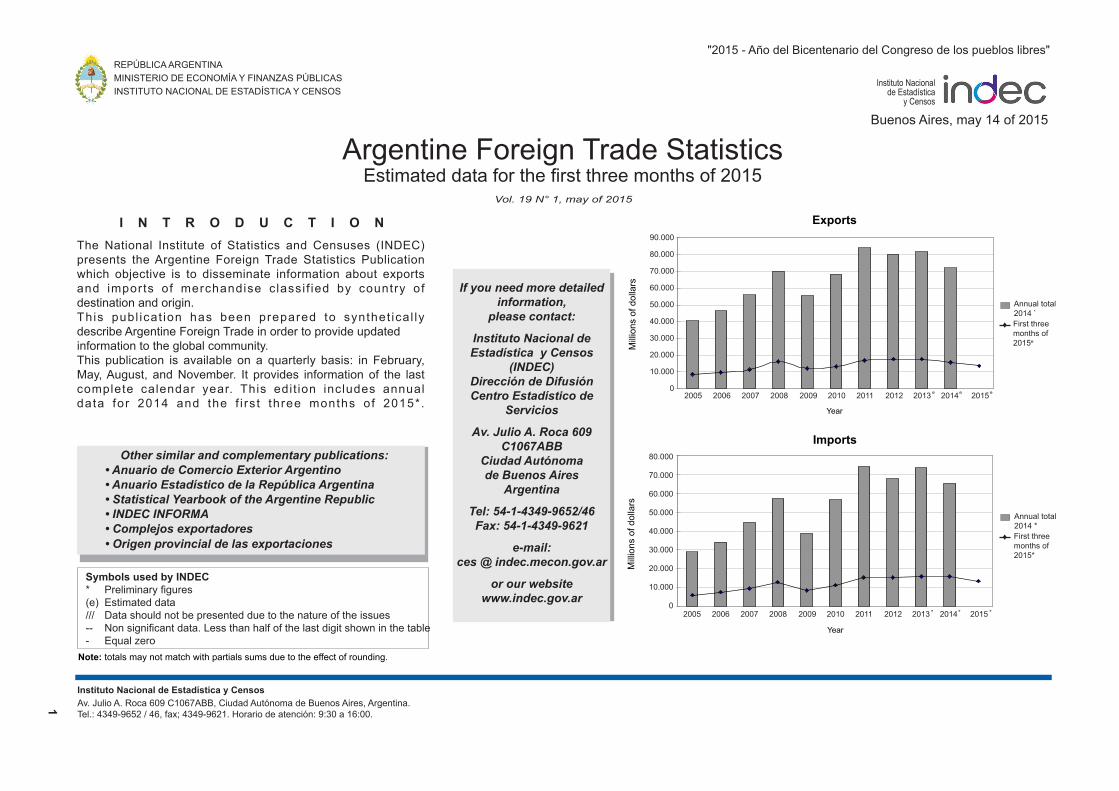
Argentine Foreign Trade StatisticsEstimated data for the first three months of 2015
The National Institute of Statistics and Censuses (INDEC) presents the Argentine Foreign Trade Statistics Publicationwhich objective is to disseminate information about exportsand imports of merchandise classi f ied by country ofdestination and origin.This publ icat ion has been prepared to synthet ica l lydescribe Argentine Foreign Trade in order to provide updated information to the global community.This publication is available on a quarterly basis: in February,May, August, and November. It provides information of the lastcomplete calendar year. This edit ion includes annualdata for 2014 and the f i rs t three months of 2015*.
Other similar and complementary publications:• Anuario de Comercio Exterior Argentino• Anuario Estadístico de la República Argentina• Statistical Yearbook of the Argentine Republic• INDEC INFORMA• Complejos exportadores• Origen provincial de las exportaciones
If you need more detailed information,
please contact:
Instituto Nacional de Estadística y Censos
(INDEC)Dirección de Difusión Centro Estadístico de
Servicios
Av. Julio A. Roca 609 C1067ABB
Ciudad Autónoma de Buenos Aires
Argentina
Tel: 54-1-4349-9652/46Fax: 54-1-4349-9621
e-mail:ces @ indec.mecon.gov.ar
or our websitewww.indec.gov.ar
I N T R O D U C T I O N
Note: totals may not match with partials sums due to the effect of rounding.
Symbols used by INDEC* Preliminary figures(e) Estimated data/// Data should not be presented due to the nature of the issues -- Non significant data. Less than half of the last digit shown in the table- Equal zero
"2015 - Año del Bicentenario del Congreso de los pueblos libres"
Instituto Nacional de Estadística y CensosAv. Julio A. Roca 609 C1067ABB, Ciudad Autónoma de Buenos Aires, Argentina.Tel.: 4349-9652 / 46, fax; 4349-9621. Horario de atención: 9:30 a 16:00.
Buenos Aires, may 14 of 2015
REPÚBLICA ARGENTINAMINISTERIO DE ECONOMÍA Y FINANZAS PÚBLICASINSTITUTO NACIONAL DE ESTADÍSTICA Y CENSOS
Instituto Nacionalde Estadística
y Censos
Imports
YearM
illio
ns o
f dol
lars
Annual total2014 *First threemonths of2015*
Mill
ions
of d
olla
rs
Year
Annual total2014 *
First threemonths of2015e
e
Exports
Vol. 19 N° 1, may of 2015
0
10.000
20.000
30.000
40.000
50.000
60.000
70.000
80.000
90.00090.000
80.000
70.000
60.000
50.000
40.000
30.000
20.000
10.000
0
80.000
70.000
60.000
50.000
40.000
30.000
20.000
10.000
0
2005 2006 2007 2008 2009 2010 2011 2012 2013 2014 2015
*2005 2006 2007 2008 2009 2010 2011 2012 2013 2014 2015
ee
* *
2
C O N C E P T U A L A N DM E T H O D O L O G I C A LN O T E S
- goods in transit- military goods- trade between the continental Argentine territory and Tierra del Fuego, Antártida e Islas del Atlántico sur Special Customs Area.
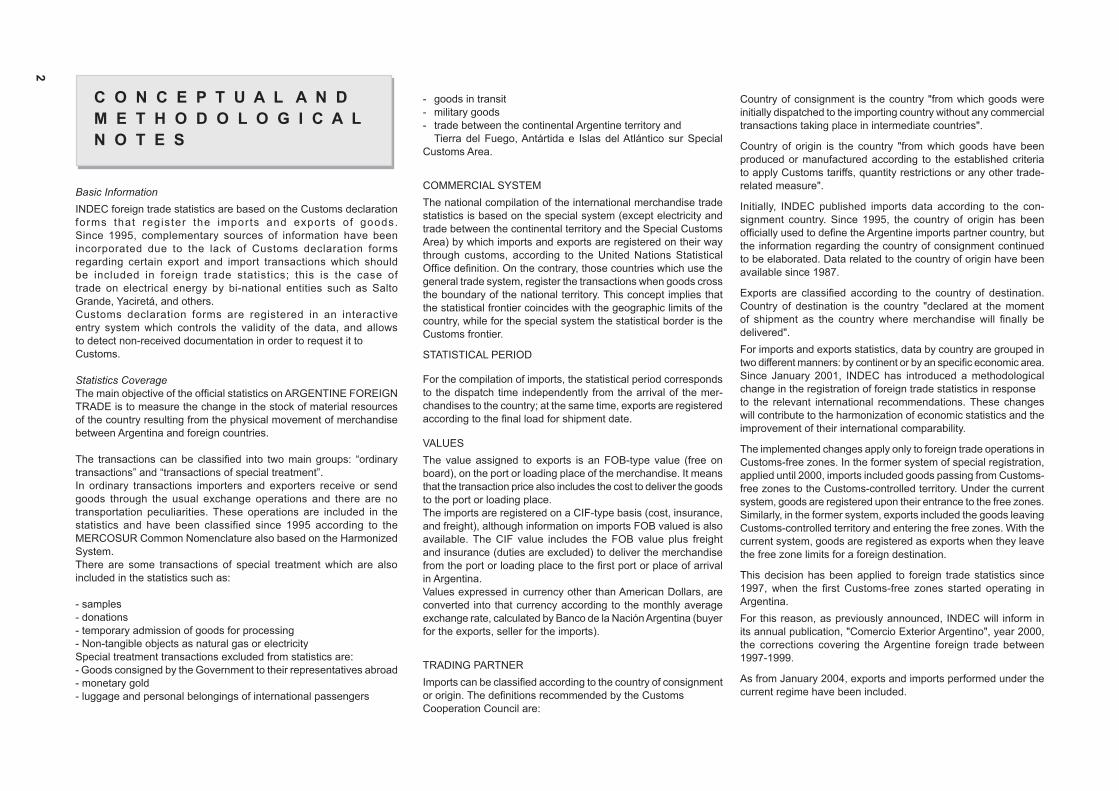
COMMERCIAL SYSTEMThe national compilation of the international merchandise trade statistics is based on the special system (except electricity and trade between the continental territory and the Special Customs Area) by which imports and exports are registered on their way through customs, according to the United Nations Statistical Office definition. On the contrary, those countries which use the general trade system, register the transactions when goods cross the boundary of the national territory. This concept implies that the statistical frontier coincides with the geographic limits of the country, while for the special system the statistical border is the Customs frontier.
STATISTICAL PERIOD
For the compilation of imports, the statistical period corresponds to the dispatch time independently from the arrival of the mer-chandises to the country; at the same time, exports are registered according to the final load for shipment date.
VALUESThe value assigned to exports is an FOB-type value (free onboard), on the port or loading place of the merchandise. It means that the transaction price also includes the cost to deliver the goods to the port or loading place.The imports are registered on a CIF-type basis (cost, insurance, and freight), although information on imports FOB valued is also available. The CIF value includes the FOB value plus freight and insurance (duties are excluded) to deliver the merchandise from the port or loading place to the first port or place of arrival in Argentina.Values expressed in currency other than American Dollars, are converted into that currency according to the monthly average exchange rate, calculated by Banco de la Nación Argentina (buyer for the exports, seller for the imports).
TRADING PARTNERImports can be classified according to the country of consignmentor origin. The definitions recommended by the CustomsCooperation Council are:
Basic InformationINDEC foreign trade statistics are based on the Customs declarationforms that register the imports and exports of goods.Since 1995, complementary sources of information have beenincorporated due to the lack of Customs declaration formsregarding certain export and import transactions which shouldbe included in foreign trade statistics; this is the case oftrade on electrical energy by bi-national entities such as SaltoGrande, Yaciretá, and others.Customs declaration forms are registered in an interactiveentry system which controls the validity of the data, and allowsto detect non-received documentation in order to request it toCustoms.
Statistics CoverageThe main objective of the official statistics on ARGENTINE FOREIGN TRADE is to measure the change in the stock of material resources of the country resulting from the physical movement of merchandise between Argentina and foreign countries.
The transactions can be classified into two main groups: “ordinary transactions” and “transactions of special treatment”.In ordinary transactions importers and exporters receive or sendgoods through the usual exchange operations and there are notransportation peculiarities. These operations are included in thestatistics and have been classified since 1995 according to theMERCOSUR Common Nomenclature also based on the HarmonizedSystem.There are some transactions of special treatment which are alsoincluded in the statistics such as:
- samples- donations- temporary admission of goods for processing- Non-tangible objects as natural gas or electricitySpecial treatment transactions excluded from statistics are:- Goods consigned by the Government to their representatives abroad- monetary gold- luggage and personal belongings of international passengers
Country of consignment is the country "from which goods were initially dispatched to the importing country without any commercial transactions taking place in intermediate countries".
Country of origin is the country "from which goods have been produced or manufactured according to the established criteria to apply Customs tariffs, quantity restrictions or any other trade-related measure".
Initially, INDEC published imports data according to the con-signment country. Since 1995, the country of origin has been officially used to define the Argentine imports partner country, but the information regarding the country of consignment continued to be elaborated. Data related to the country of origin have been available since 1987.
Exports are classified according to the country of destination.Country of destination is the country "declared at the momentof shipment as the country where merchandise will finally be delivered".For imports and exports statistics, data by country are grouped in two different manners: by continent or by an specific economic area.Since January 2001, INDEC has introduced a methodological change in the registration of foreign trade statistics in responseto the relevant international recommendations. These changes will contribute to the harmonization of economic statistics and the improvement of their international comparability.
The implemented changes apply only to foreign trade operations in Customs-free zones. In the former system of special registration, applied until 2000, imports included goods passing from Customs-free zones to the Customs-controlled territory. Under the current system, goods are registered upon their entrance to the free zones. Similarly, in the former system, exports included the goods leaving Customs-controlled territory and entering the free zones. With thecurrent system, goods are registered as exports when they leave the free zone limits for a foreign destination.
This decision has been applied to foreign trade statistics since 1997, when the first Customs-free zones started operating in Argentina.For this reason, as previously announced, INDEC will inform in its annual publication, "Comercio Exterior Argentino", year 2000, the corrections covering the Argentine foreign trade between 1997-1999.
As from January 2004, exports and imports performed under the current regime have been included.
3
AccumulatedJan-Mar
2015*
AccumulatedJan-Mar
2015*
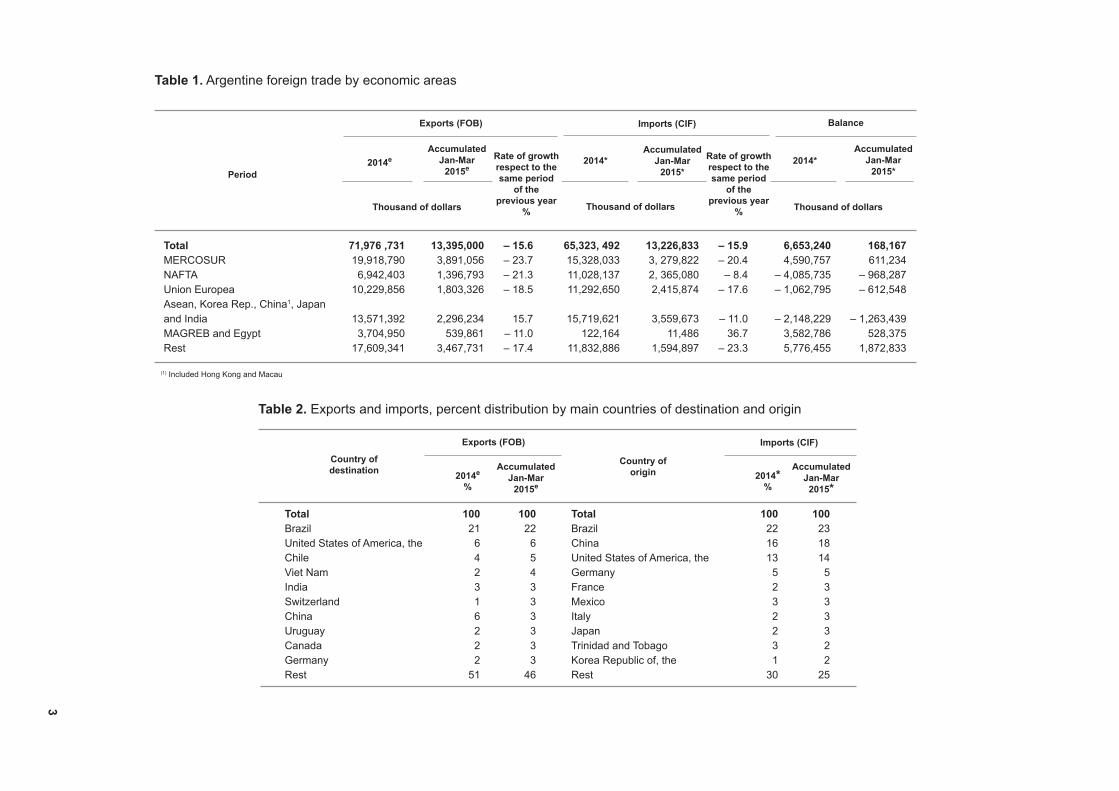
Total 71,976 ,731 13,395,000 – 15.6 65,323, 492 13,226,833 – 15.9 6,653,240 168,167MERCOSUR 19,918,790 3,891,056 – 23.7 15,328,033 3, 279,822 – 20.4 4,590,757 611,234NAFTA 6,942,403 1,396,793 – 21.3 11,028,137 2, 365,080 – 8.4 – 4,085,735 – 968,287Union Europea 10,229,856 1,803,326 – 18.5 11,292,650 2,415,874 – 17.6 – 1,062,795 – 612,548Asean, Korea Rep., China1, Japanand India 13,571,392 2,296,234 15.7 15,719,621 3,559,673 – 11.0 – 2,148,229 – 1,263,439MAGREB and Egypt 3,704,950 539,861 – 11.0 122,164 11,486 36.7 3,582,786 528,375Rest 17,609,341 3,467,731 – 17.4 11,832,886 1,594,897 – 23.3 5,776,455 1,872,833
Imports (CIF)
Thousand of dollars
Table 1. Argentine foreign trade by economic areas
Thousand of dollarsThousand of dollars
Rate of growthrespect to the same period
of theprevious year
%
Period
Table 2. Exports and imports, percent distribution by main countries of destination and origin
Exports (FOB) Imports (CIF)
Country oforigin
Country ofdestination
Total 100 100 Total 100 100Brazil 21 22 Brazil 22 23United States of America, the 6 6 China 16 18Chile 4 5 United States of America, the 13 14Viet Nam 2 4 Germany 5 5India 3 3 France 2 3Switzerland 1 3 Mexico 3 3China 6 3 Italy 2 3Uruguay 2 3 Japan 2 3Canada 2 3 Trinidad and Tobago 3 2Germany 2 3 Korea Republic of, the 1 2Rest 51 46 Rest 30 25
BalanceExports (FOB)
2014eAccumulated
Jan-Mar2015e
2014e
%2014*
%
2014* 2014*
AccumulatedJan-Mar
2015e
AccumulatedJan-Mar2015*
(1) Included Hong Kong and Macau
Rate of growthrespect to the same period
of theprevious year
%
4
AccumulatedJan-Mar
2015*
AccumulatedJan-Mar
2015*
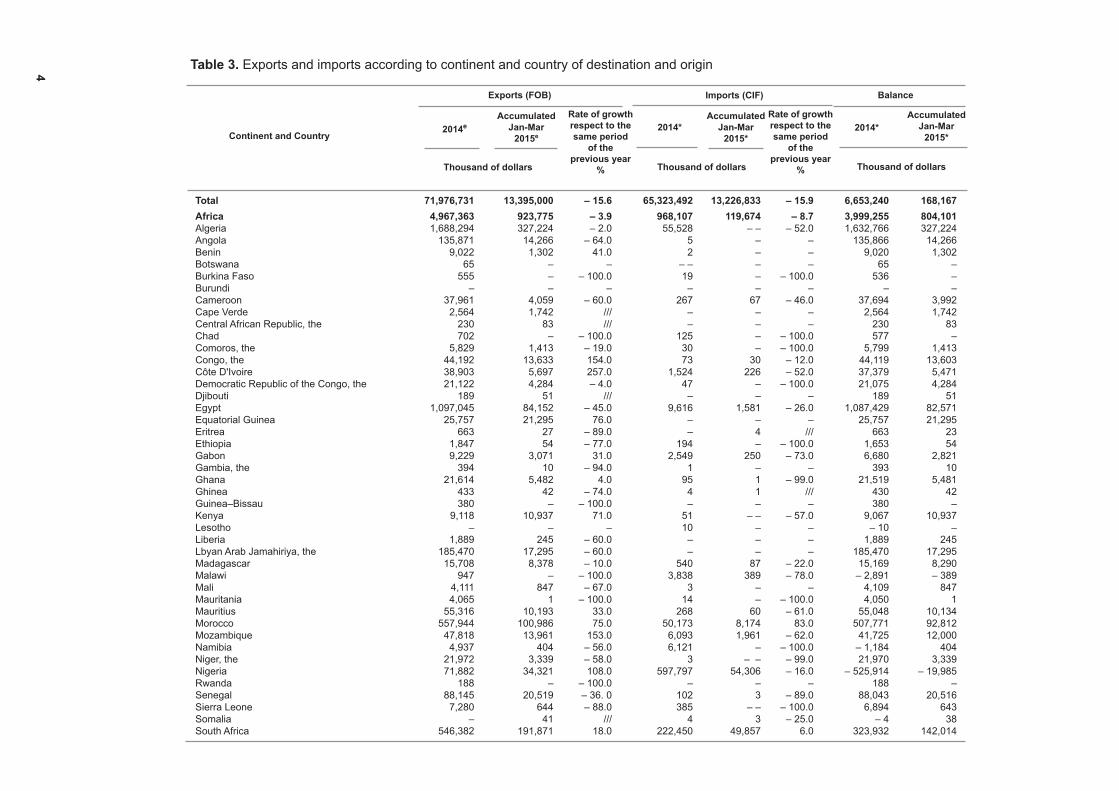
Total 71,976,731 13,395,000 – 15.6 65,323,492 13,226,833 – 15.9 6,653,240 168,167Africa 4,967,363 923,775 – 3.9 968,107 119,674 – 8.7 3,999,255 804,101Algeria 1,688,294 327,224 – 2.0 55,528 – – – 52.0 1,632,766 327,224Angola 135,871 14,266 – 64.0 5 – – 135,866 14,266Benin 9,022 1,302 41.0 2 – – 9,020 1,302Botswana 65 – – – – – – 65 –Burkina Faso 555 – – 100.0 19 – – 100.0 536 –Burundi – – – – – – – –Cameroon 37,961 4,059 – 60.0 267 67 – 46.0 37,694 3,992Cape Verde 2,564 1,742 /// – – – 2,564 1,742Central African Republic, the 230 83 /// – – – 230 83Chad 702 – – 100.0 125 – – 100.0 577 –Comoros, the 5,829 1,413 – 19.0 30 – – 100.0 5,799 1,413Congo, the 44,192 13,633 154.0 73 30 – 12.0 44,119 13,603Côte D'Ivoire 38,903 5,697 257.0 1,524 226 – 52.0 37,379 5,471Democratic Republic of the Congo, the 21,122 4,284 – 4.0 47 – – 100.0 21,075 4,284Djibouti 189 51 /// – – – 189 51Egypt 1,097,045 84,152 – 45.0 9,616 1,581 – 26.0 1,087,429 82,571Equatorial Guinea 25,757 21,295 76.0 – – – 25,757 21,295Eritrea 663 27 – 89.0 – 4 /// 663 23Ethiopia 1,847 54 – 77.0 194 – – 100.0 1,653 54Gabon 9,229 3,071 31.0 2,549 250 – 73.0 6,680 2,821Gambia, the 394 10 – 94.0 1 – – 393 10Ghana 21,614 5,482 4.0 95 1 – 99.0 21,519 5,481Ghinea 433 42 – 74.0 4 1 /// 430 42Guinea–Bissau 380 – – 100.0 – – – 380 –Kenya 9,118 10,937 71.0 51 – – – 57.0 9,067 10,937Lesotho – – – 10 – – – 10 –Liberia 1,889 245 – 60.0 – – – 1,889 245Lbyan Arab Jamahiriya, the 185,470 17,295 – 60.0 – – – 185,470 17,295Madagascar 15,708 8,378 – 10.0 540 87 – 22.0 15,169 8,290Malawi 947 – – 100.0 3,838 389 – 78.0 – 2,891 – 389Mali 4,111 847 – 67.0 3 – – 4,109 847Mauritania 4,065 1 – 100.0 14 – – 100.0 4,050 1Mauritius 55,316 10,193 33.0 268 60 – 61.0 55,048 10,134Morocco 557,944 100,986 75.0 50,173 8,174 83.0 507,771 92,812Mozambique 47,818 13,961 153.0 6,093 1,961 – 62.0 41,725 12,000Namibia 4,937 404 – 56.0 6,121 – – 100.0 – 1,184 404Niger, the 21,972 3,339 – 58.0 3 – – – 99.0 21,970 3,339Nigeria 71,882 34,321 108.0 597,797 54,306 – 16.0 – 525,914 – 19,985Rwanda 188 – – 100.0 – – – 188 –Senegal 88,145 20,519 – 36. 0 102 3 – 89.0 88,043 20,516Sierra Leone 7,280 644 – 88.0 385 – – – 100.0 6,894 643Somalia – 41 /// 4 3 – 25.0 – 4 38South Africa 546,382 191,871 18.0 222,450 49,857 6.0 323,932 142,014
Balance
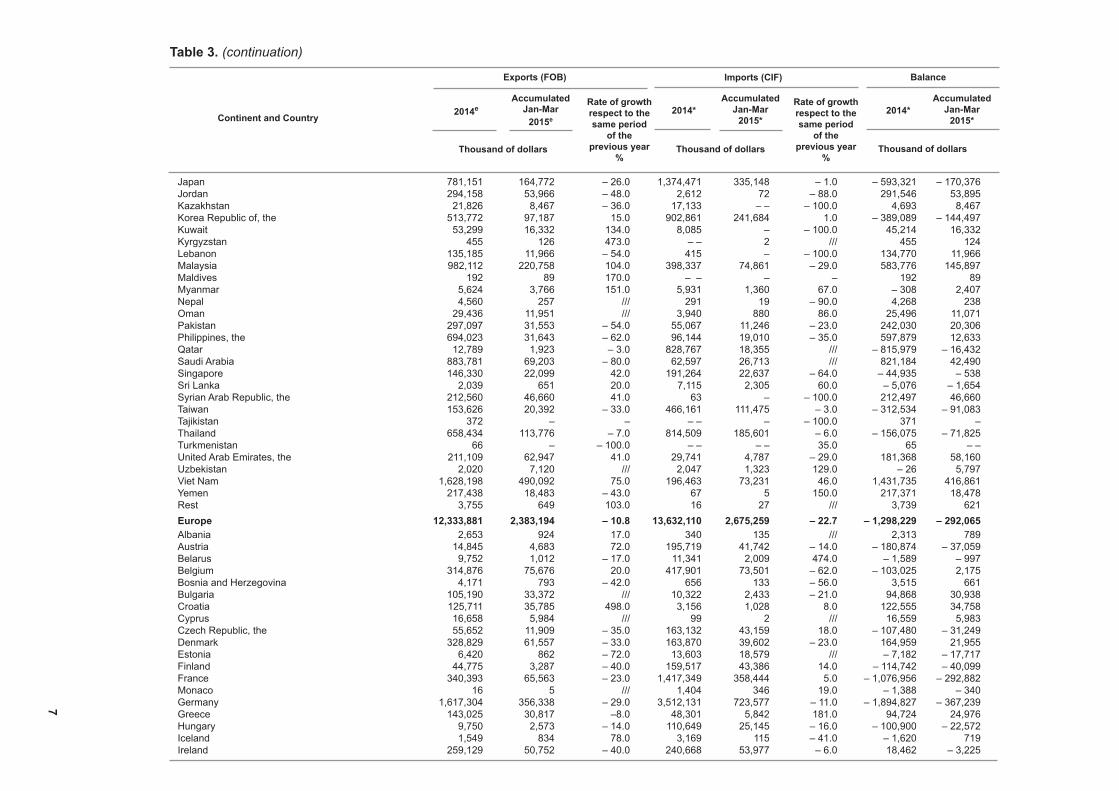
Table 3. Exports and imports according to continent and country of destination and origin
Continent and Country
Exports (FOB) Imports (CIF)
Thousand of dollars Thousand of dollars
2014e 2014*Accumulated
Jan-Mar2015e
Thousand of dollars
2014*Rate of growthrespect to the same period
of theprevious year
%
Rate of growthrespect to the same period
of theprevious year
%
5
AccumulatedJan-Mar
2015*
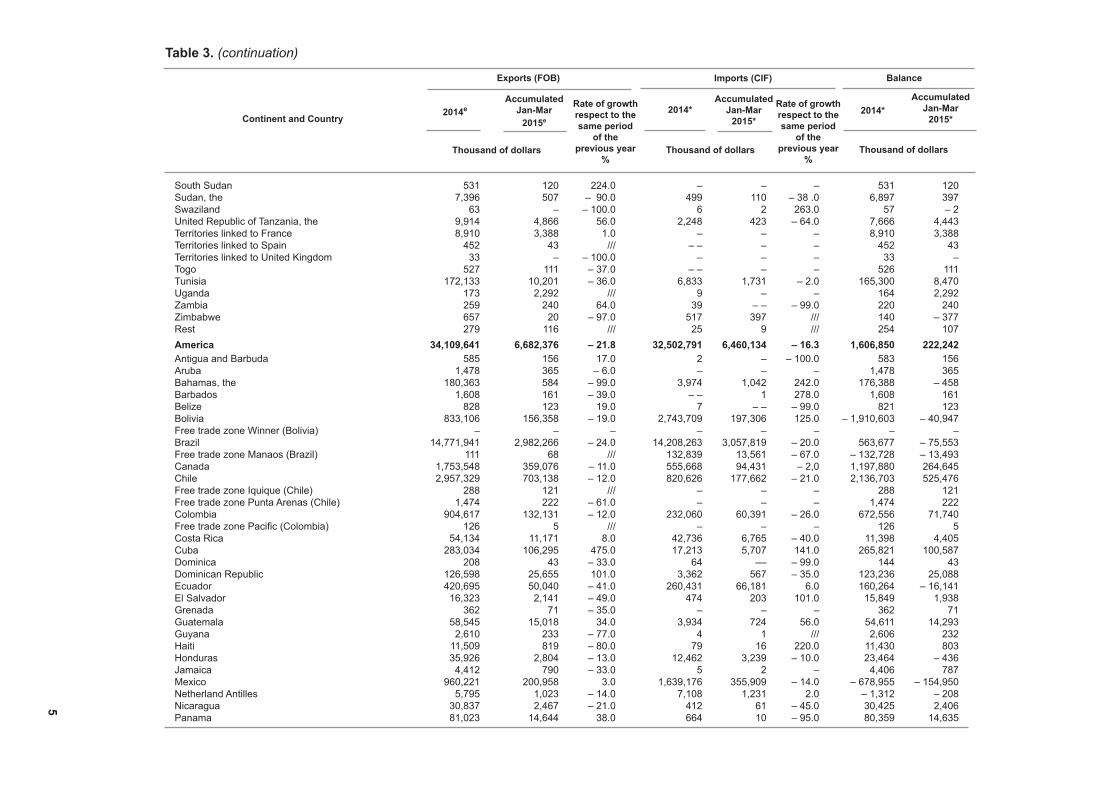
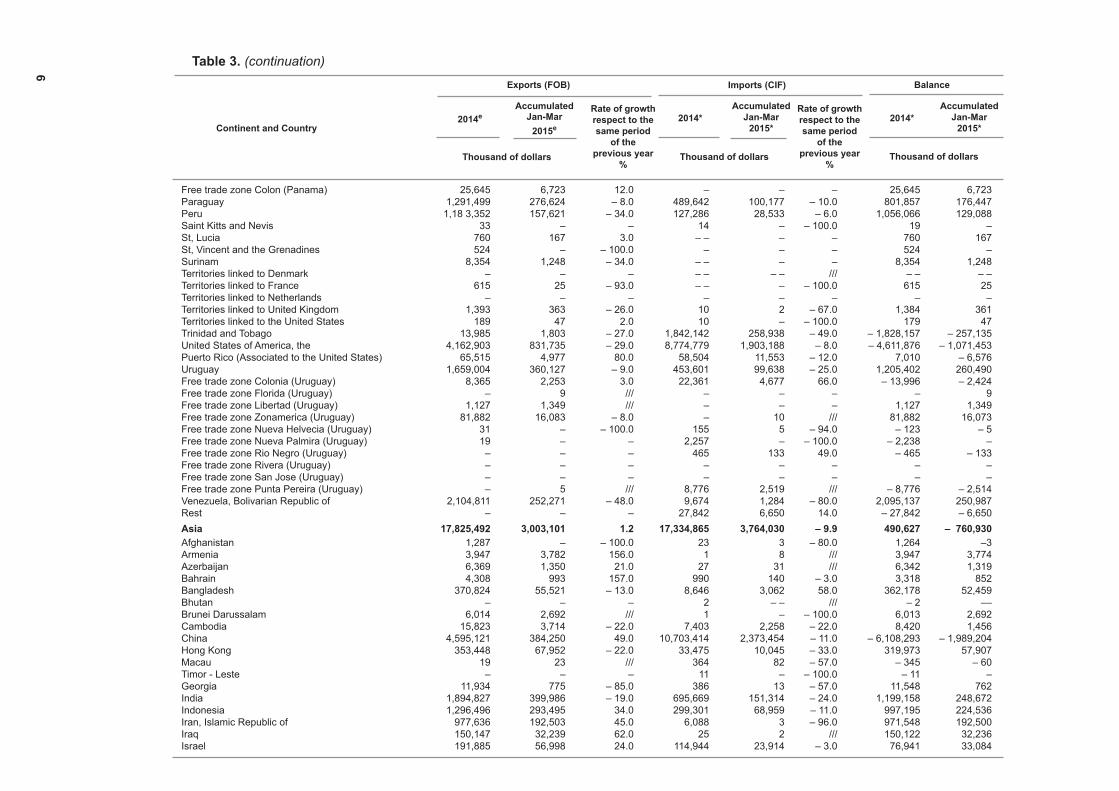
Table 3. (continuation)
Balance
Continent and Country
Exports (FOB) Imports (CIF)
Thousand of dollars Thousand of dollars
2014e 2014*Accumulated
Jan-Mar2015e
Thousand of dollars
2014*Rate of growthrespect to the same period
of theprevious year
%
Rate of growthrespect to the same period
of theprevious year
%
AccumulatedJan-Mar
2015*
South Sudan 531 120 224.0 – – – 531 120Sudan, the 7,396 507 – 90.0 499 110 – 38 .0 6,897 397Swaziland 63 – – 100.0 6 2 263.0 57 – 2United Republic of Tanzania, the 9,914 4,866 56.0 2,248 423 – 64.0 7,666 4,443Territories linked to France 8,910 3,388 1.0 – – – 8,910 3,388Territories linked to Spain 452 43 /// – – – – 452 43Territories linked to United Kingdom 33 – – 100.0 – – – 33 –Togo 527 111 – 37.0 – – – – 526 111Tunisia 172,133 10,201 – 36.0 6,833 1,731 – 2.0 165,300 8,470Uganda 173 2,292 /// 9 – – 164 2,292Zambia 259 240 64.0 39 – – – 99.0 220 240Zimbabwe 657 20 – 97.0 517 397 /// 140 – 377Rest 279 116 /// 25 9 /// 254 107America 34,109,641 6,682,376 – 21.8 32,502,791 6,460,134 – 16.3 1,606,850 222,242Antigua and Barbuda 585 156 17.0 2 – – 100.0 583 156Aruba 1,478 365 – 6.0 – – – 1,478 365Bahamas, the 180,363 584 – 99.0 3,974 1,042 242.0 176,388 – 458Barbados 1,608 161 – 39.0 – – 1 278.0 1,608 161Belize 828 123 19.0 7 – – – 99.0 821 123Bolivia 833,106 156,358 – 19.0 2,743,709 197,306 125.0 – 1,910,603 – 40,947Free trade zone Winner (Bolivia) – – – – – – – –Brazil 14,771,941 2,982,266 – 24.0 14,208,263 3,057,819 – 20.0 563,677 – 75,553Free trade zone Manaos (Brazil) 111 68 /// 132,839 13,561 – 67.0 – 132,728 – 13,493Canada 1,753,548 359,076 – 11.0 555,668 94,431 – 2,0 1,197,880 264,645Chile 2,957,329 703,138 – 12.0 820,626 177,662 – 21.0 2,136,703 525,476Free trade zone Iquique (Chile) 288 121 /// – – – 288 121Free trade zone Punta Arenas (Chile) 1,474 222 – 61.0 – – – 1,474 222Colombia 904,617 132,131 – 12.0 232,060 60,391 – 26.0 672,556 71,740Free trade zone Pacific (Colombia) 126 5 /// – – – 126 5Costa Rica 54,134 11,171 8.0 42,736 6,765 – 40.0 11,398 4,405Cuba 283,034 106,295 475.0 17,213 5,707 141.0 265,821 100,587Dominica 208 43 – 33.0 64 –– – 99.0 144 43Dominican Republic 126,598 25,655 101.0 3,362 567 – 35.0 123,236 25,088Ecuador 420,695 50,040 – 41.0 260,431 66,181 6.0 160,264 – 16,141El Salvador 16,323 2,141 – 49.0 474 203 101.0 15,849 1,938Grenada 362 71 – 35.0 – – – 362 71Guatemala 58,545 15,018 34.0 3,934 724 56.0 54,611 14,293Guyana 2,610 233 – 77.0 4 1 /// 2,606 232Haiti 11,509 819 – 80.0 79 16 220.0 11,430 803Honduras 35,926 2,804 – 13.0 12,462 3,239 – 10.0 23,464 – 436Jamaica 4,412 790 – 33.0 5 2 – 4,406 787Mexico 960,221 200,958 3.0 1,639,176 355,909 – 14.0 – 678,955 – 154,950Netherland Antilles 5,795 1,023 – 14.0 7,108 1,231 2.0 – 1,312 – 208Nicaragua 30,837 2,467 – 21.0 412 61 – 45.0 30,425 2,406Panama 81,023 14,644 38.0 664 10 – 95.0 80,359 14,635
6
Table 3. (continuation)
Balance
Continent and Country
Exports (FOB) Imports (CIF)
Thousand of dollars Thousand of dollarsThousand of dollars
Rate of growthrespect to the same period
of theprevious year
%
Rate of growthrespect to the same period
of theprevious year
%
2014e 2014* 2014*Accumulated
Jan-Mar2015e
AccumulatedJan-Mar
2015*
AccumulatedJan-Mar
2015*
Free trade zone Colon (Panama) 25,645 6,723 12.0 – – – 25,645 6,723Paraguay 1,291,499 276,624 – 8.0 489,642 100,177 – 10.0 801,857 176,447Peru 1,18 3,352 157,621 – 34.0 127,286 28,533 – 6.0 1,056,066 129,088Saint Kitts and Nevis 33 – – 14 – – 100.0 19 –St, Lucia 760 167 3.0 – – – – 760 167St, Vincent and the Grenadines 524 – – 100.0 – – – 524 –Surinam 8,354 1,248 – 34.0 – – – – 8,354 1,248Territories linked to Denmark – – – – – – – /// – – – –Territories linked to France 615 25 – 93.0 – – – – 100.0 615 25Territories linked to Netherlands – – – – – – – –Territories linked to United Kingdom 1,393 363 – 26.0 10 2 – 67.0 1,384 361Territories linked to the United States 189 47 2.0 10 – – 100.0 179 47Trinidad and Tobago 13,985 1,803 – 27.0 1,842,142 258,938 – 49.0 – 1,828,157 – 257,135United States of America, the 4,162,903 831,735 – 29.0 8,774,779 1,903,188 – 8.0 – 4,611,876 – 1,071,453Puerto Rico (Associated to the United States) 65,515 4,977 80.0 58,504 11,553 – 12.0 7,010 – 6,576Uruguay 1,659,004 360,127 – 9.0 453,601 99,638 – 25.0 1,205,402 260,490Free trade zone Colonia (Uruguay) 8,365 2,253 3.0 22,361 4,677 66.0 – 13,996 – 2,424Free trade zone Florida (Uruguay) – 9 /// – – – – 9Free trade zone Libertad (Uruguay) 1,127 1,349 /// – – – 1,127 1,349Free trade zone Zonamerica (Uruguay) 81,882 16,083 – 8.0 – 10 /// 81,882 16,073Free trade zone Nueva Helvecia (Uruguay) 31 – – 100.0 155 5 – 94.0 – 123 – 5Free trade zone Nueva Palmira (Uruguay) 19 – – 2,257 – – 100.0 – 2,238 –Free trade zone Rio Negro (Uruguay) – – – 465 133 49.0 – 465 – 133Free trade zone Rivera (Uruguay) – – – – – – – –Free trade zone San Jose (Uruguay) – – – – – – – –Free trade zone Punta Pereira (Uruguay) – 5 /// 8,776 2,519 /// – 8,776 – 2,514Venezuela, Bolivarian Republic of 2,104,811 252,271 – 48.0 9,674 1,284 – 80.0 2,095,137 250,987Rest – – – 27,842 6,650 14.0 – 27,842 – 6,650Asia 17,825,492 3,003,101 1.2 17,334,865 3,764,030 – 9.9 490,627 – 760,930Afghanistan 1,287 – – 100.0 23 3 – 80.0 1,264 –3Armenia 3,947 3,782 156.0 1 8 /// 3,947 3,774Azerbaijan 6,369 1,350 21.0 27 31 /// 6,342 1,319Bahrain 4,308 993 157.0 990 140 – 3.0 3,318 852Bangladesh 370,824 55,521 – 13.0 8,646 3,062 58.0 362,178 52,459Bhutan – – – 2 – – /// – 2 ––Brunei Darussalam 6,014 2,692 /// 1 – – 100.0 6,013 2,692Cambodia 15,823 3,714 – 22.0 7,403 2,258 – 22.0 8,420 1,456China 4,595,121 384,250 49.0 10,703,414 2,373,454 – 11.0 – 6,108,293 – 1,989,204Hong Kong 353,448 67,952 – 22.0 33,475 10,045 – 33.0 319,973 57,907Macau 19 23 /// 364 82 – 57.0 – 345 – 60Timor - Leste – – – 11 – – 100.0 – 11 –Georgia 11,934 775 – 85.0 386 13 – 57.0 11,548 762India 1,894,827 399,986 – 19.0 695,669 151,314 – 24.0 1,199,158 248,672Indonesia 1,296,496 293,495 34.0 299,301 68,959 – 11.0 997,195 224,536Iran, Islamic Republic of 977,636 192,503 45.0 6,088 3 – 96.0 971,548 192,500Iraq 150,147 32,239 62.0 25 2 /// 150,122 32,236Israel 191,885 56,998 24.0 114,944 23,914 – 3.0 76,941 33,084
7
Table 3. (continuation)
Balance
Continent and Country
Exports (FOB) Imports (CIF)
Thousand of dollars Thousand of dollarsThousand of dollars
Rate of growthrespect to the same period
of theprevious year
%
Rate of growthrespect to the same period
of theprevious year
%
2014e 2014* 2014*Accumulated
Jan-Mar2015e
AccumulatedJan-Mar
2015*
AccumulatedJan-Mar
2015*
Japan 781,151 164,772 – 26.0 1,374,471 335,148 – 1.0 – 593,321 – 170,376Jordan 294,158 53,966 – 48.0 2,612 72 – 88.0 291,546 53,895Kazakhstan 21,826 8,467 – 36.0 17,133 – – – 100.0 4,693 8,467Korea Republic of, the 513,772 97,187 15.0 902,861 241,684 1.0 – 389,089 – 144,497Kuwait 53,299 16,332 134.0 8,085 – – 100.0 45,214 16,332Kyrgyzstan 455 126 473.0 – – 2 /// 455 124Lebanon 135,185 11,966 – 54.0 415 – – 100.0 134,770 11,966Malaysia 982,112 220,758 104.0 398,337 74,861 – 29.0 583,776 145,897Maldives 192 89 170.0 – – – – 192 89Myanmar 5,624 3,766 151.0 5,931 1,360 67.0 – 308 2,407Nepal 4,560 257 /// 291 19 – 90.0 4,268 238Oman 29,436 11,951 /// 3,940 880 86.0 25,496 11,071Pakistan 297,097 31,553 – 54.0 55,067 11,246 – 23.0 242,030 20,306Philippines, the 694,023 31,643 – 62.0 96,144 19,010 – 35.0 597,879 12,633Qatar 12,789 1,923 – 3.0 828,767 18,355 /// – 815,979 – 16,432Saudi Arabia 883,781 69,203 – 80.0 62,597 26,713 /// 821,184 42,490Singapore 146,330 22,099 42.0 191,264 22,637 – 64.0 – 44,935 – 538Sri Lanka 2,039 651 20.0 7,115 2,305 60.0 – 5,076 – 1,654Syrian Arab Republic, the 212,560 46,660 41.0 63 – – 100.0 212,497 46,660Taiwan 153,626 20,392 – 33.0 466,161 111,475 – 3.0 – 312,534 – 91,083Tajikistan 372 – – – – – – 100.0 371 –Thailand 658,434 113,776 – 7.0 814,509 185,601 – 6.0 – 156,075 – 71,825Turkmenistan 66 – – 100.0 – – – – 35.0 65 – –United Arab Emirates, the 211,109 62,947 41.0 29,741 4,787 – 29.0 181,368 58,160Uzbekistan 2,020 7,120 /// 2,047 1,323 129.0 – 26 5,797Viet Nam 1,628,198 490,092 75.0 196,463 73,231 46.0 1,431,735 416,861Yemen 217,438 18,483 – 43.0 67 5 150.0 217,371 18,478Rest 3,755 649 103.0 16 27 /// 3,739 621Europe 12,333,881 2,383,194 – 10.8 13,632,110 2,675,259 – 22.7 – 1,298,229 – 292,065Albania 2,653 924 17.0 340 135 /// 2,313 789Austria 14,845 4,683 72.0 195,719 41,742 – 14.0 – 180,874 – 37,059Belarus 9,752 1,012 – 17.0 11,341 2,009 474.0 – 1,589 – 997Belgium 314,876 75,676 20.0 417,901 73,501 – 62.0 – 103,025 2,175Bosnia and Herzegovina 4,171 793 – 42.0 656 133 – 56.0 3,515 661Bulgaria 105,190 33,372 /// 10,322 2,433 – 21.0 94,868 30,938Croatia 125,711 35,785 498.0 3,156 1,028 8.0 122,555 34,758Cyprus 16,658 5,984 /// 99 2 /// 16,559 5,983Czech Republic, the 55,652 11,909 – 35.0 163,132 43,159 18.0 – 107,480 – 31,249Denmark 328,829 61,557 – 33.0 163,870 39,602 – 23.0 164,959 21,955Estonia 6,420 862 – 72.0 13,603 18,579 /// – 7,182 – 17,717Finland 44,775 3,287 – 40.0 159,517 43,386 14.0 – 114,742 – 40,099France 340,393 65,563 – 23.0 1,417,349 358,444 5.0 – 1,076,956 – 292,882Monaco 16 5 /// 1,404 346 19.0 – 1,388 – 340Germany 1,617,304 356,338 – 29.0 3,512,131 723,577 – 11.0 – 1,894,827 – 367,239Greece 143,025 30,817 –8.0 48,301 5,842 181.0 94,724 24,976Hungary 9,750 2,573 – 14.0 110,649 25,145 – 16.0 – 100,900 – 22,572Iceland 1,549 834 78.0 3,169 115 – 41.0 – 1,620 719Ireland 259,129 50,752 – 40.0 240,668 53,977 – 6.0 18,462 – 3,225
8
AccumulatedJan-Mar
2015*
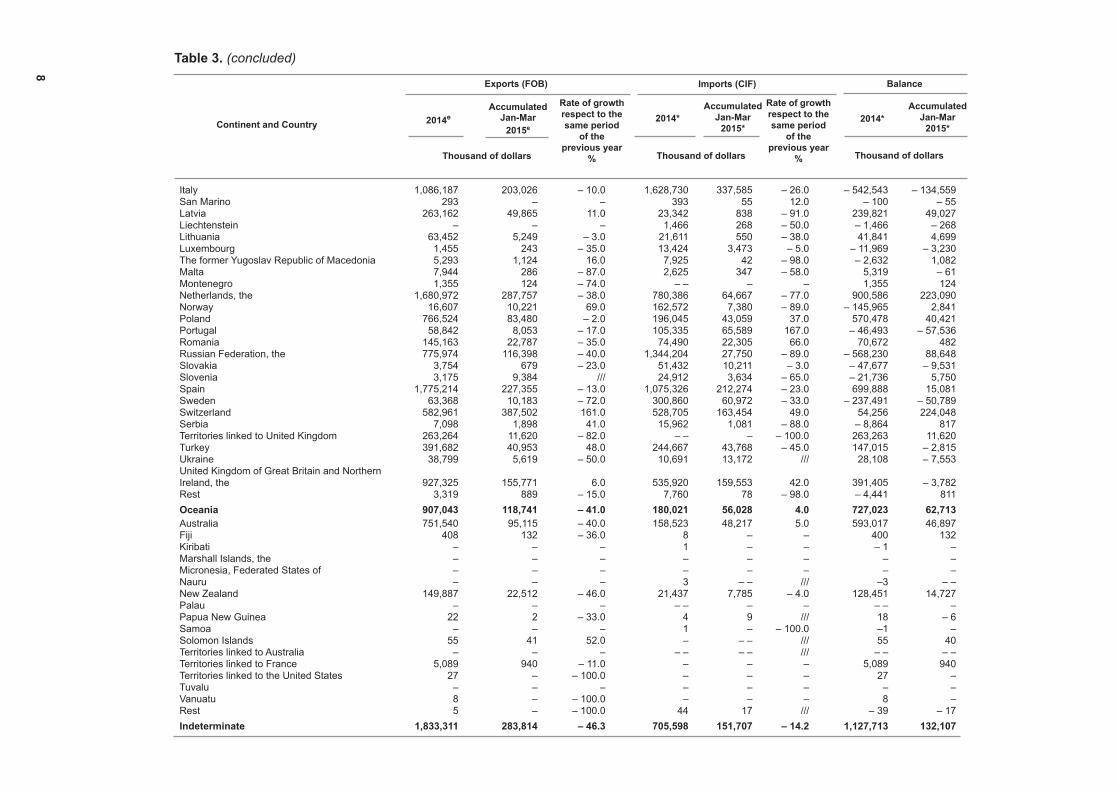
Table 3. (concluded)
Balance
Continent and Country
Exports (FOB) Imports (CIF)
Thousand of dollars Thousand of dollarsThousand of dollars
Rate of growthrespect to the same period
of theprevious year
%
Rate of growthrespect to the same period
of theprevious year
%
2014e 2014* 2014*Accumulated
Jan-Mar2015e
AccumulatedJan-Mar
2015*
Italy 1,086,187 203,026 – 10.0 1,628,730 337,585 – 26.0 – 542,543 – 134,559San Marino 293 – – 393 55 12.0 – 100 – 55Latvia 263,162 49,865 11.0 23,342 838 – 91.0 239,821 49,027Liechtenstein – – – 1,466 268 – 50.0 – 1,466 – 268Lithuania 63,452 5,249 – 3.0 21,611 550 – 38.0 41,841 4,699Luxembourg 1,455 243 – 35.0 13,424 3,473 – 5.0 – 11,969 – 3,230The former Yugoslav Republic of Macedonia 5,293 1,124 16.0 7,925 42 – 98.0 – 2,632 1,082Malta 7,944 286 – 87.0 2,625 347 – 58.0 5,319 – 61Montenegro 1,355 124 – 74.0 – – – – 1,355 124Netherlands, the 1,680,972 287,757 – 38.0 780,386 64,667 – 77.0 900,586 223,090Norway 16,607 10,221 69.0 162,572 7,380 – 89.0 – 145,965 2,841Poland 766,524 83,480 – 2.0 196,045 43,059 37.0 570,478 40,421Portugal 58,842 8,053 – 17.0 105,335 65,589 167.0 – 46,493 – 57,536Romania 145,163 22,787 – 35.0 74,490 22,305 66.0 70,672 482Russian Federation, the 775,974 116,398 – 40.0 1,344,204 27,750 – 89.0 – 568,230 88,648Slovakia 3,754 679 – 23.0 51,432 10,211 – 3.0 – 47,677 – 9,531Slovenia 3,175 9,384 /// 24,912 3,634 – 65.0 – 21,736 5,750Spain 1,775,214 227,355 – 13.0 1,075,326 212,274 – 23.0 699,888 15,081Sweden 63,368 10,183 – 72.0 300,860 60,972 – 33.0 – 237,491 – 50,789Switzerland 582,961 387,502 161.0 528,705 163,454 49.0 54,256 224,048Serbia 7,098 1,898 41.0 15,962 1,081 – 88.0 – 8,864 817Territories linked to United Kingdom 263,264 11,620 – 82.0 – – – – 100.0 263,263 11,620Turkey 391,682 40,953 48.0 244,667 43,768 – 45.0 147,015 – 2,815Ukraine 38,799 5,619 – 50.0 10,691 13,172 /// 28,108 – 7,553United Kingdom of Great Britain and NorthernIreland, the 927,325 155,771 6.0 535,920 159,553 42.0 391,405 – 3,782Rest 3,319 889 – 15.0 7,760 78 – 98.0 – 4,441 811Oceania 907,043 118,741 – 41.0 180,021 56,028 4.0 727,023 62,713Australia 751,540 95,115 – 40.0 158,523 48,217 5.0 593,017 46,897Fiji 408 132 – 36.0 8 – – 400 132Kiribati – – – 1 – – – 1 –Marshall Islands, the – – – – – – – –Micronesia, Federated States of – – – – – – – –Nauru – – – 3 – – /// –3 – –New Zealand 149,887 22,512 – 46.0 21,437 7,785 – 4.0 128,451 14,727Palau – – – – – – – – – –Papua New Guinea 22 2 – 33.0 4 9 /// 18 – 6Samoa – – – 1 – – 100.0 –1 –Solomon Islands 55 41 52.0 – – – /// 55 40Territories linked to Australia – – – – – – – /// – – – –Territories linked to France 5,089 940 – 11.0 – – – 5,089 940Territories linked to the United States 27 – – 100.0 – – – 27 –Tuvalu – – – – – – – –Vanuatu 8 – – 100.0 – – – 8 –Rest 5 – – 100.0 44 17 /// – 39 – 17Indeterminate 1,833,311 283,814 – 46.3 705,598 151,707 – 14.2 1,127,713 132,107
9
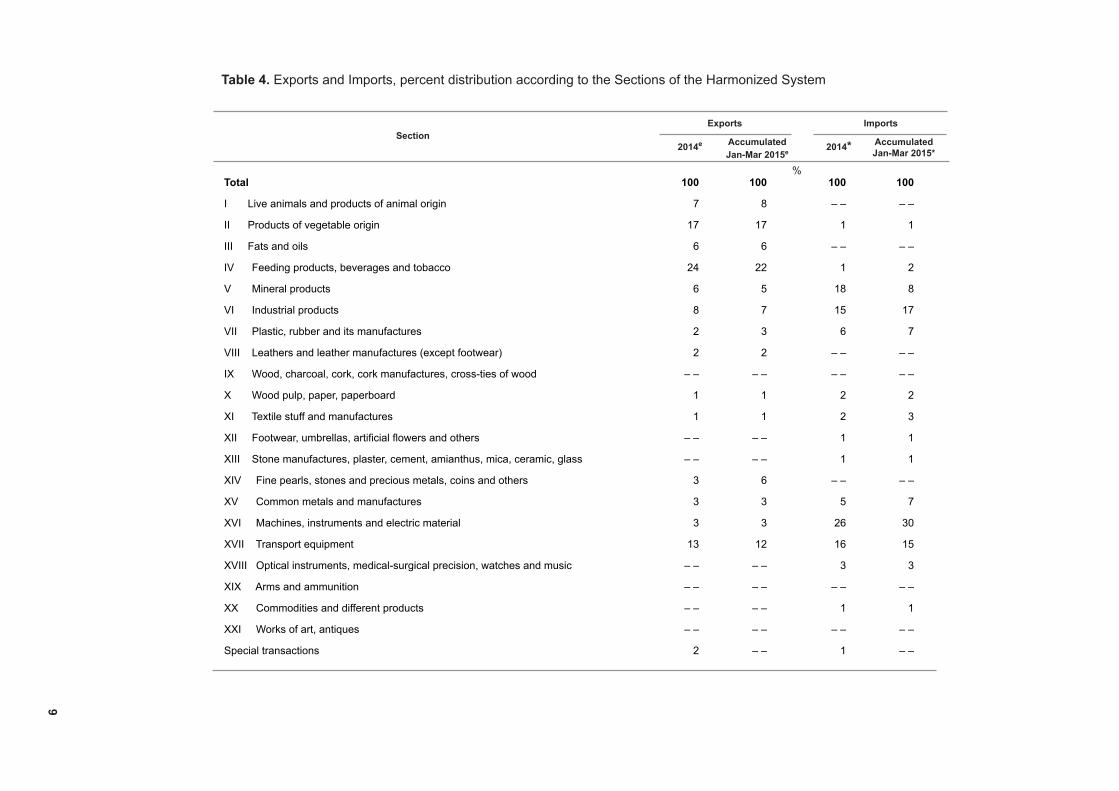
Table 4. Exports and Imports, percent distribution according to the Sections of the Harmonized System
Section2014e
ImportsExports
2014*
Total 100 100 100 100
I Live animals and products of animal origin 7 8 – – – –
II Products of vegetable origin 17 17 1 1
III Fats and oils 6 6 – – – –
IV Feeding products, beverages and tobacco 24 22 1 2
V Mineral products 6 5 18 8
VI Industrial products 8 7 15 17
VII Plastic, rubber and its manufactures 2 3 6 7
VIII Leathers and leather manufactures (except footwear) 2 2 – – – –
IX Wood, charcoal, cork, cork manufactures, cross-ties of wood – – – – – – – –
X Wood pulp, paper, paperboard 1 1 2 2
XI Textile stuff and manufactures 1 1 2 3
XII Footwear, umbrellas, artificial flowers and others – – – – 1 1
XIII Stone manufactures, plaster, cement, amianthus, mica, ceramic, glass – – – – 1 1
XIV Fine pearls, stones and precious metals, coins and others 3 6 – – – –
XV Common metals and manufactures 3 3 5 7
XVI Machines, instruments and electric material 3 3 26 30
XVII Transport equipment 13 12 16 15
XVIII Optical instruments, medical-surgical precision, watches and music – – – – 3 3
XIX Arms and ammunition – – – – – – – –
XX Commodities and different products – – – – 1 1
XXI Works of art, antiques – – – – – – – –
Special transactions 2 – – 1 – –
AccumulatedJan-Mar 2015e
AccumulatedJan-Mar 2015*
%
10
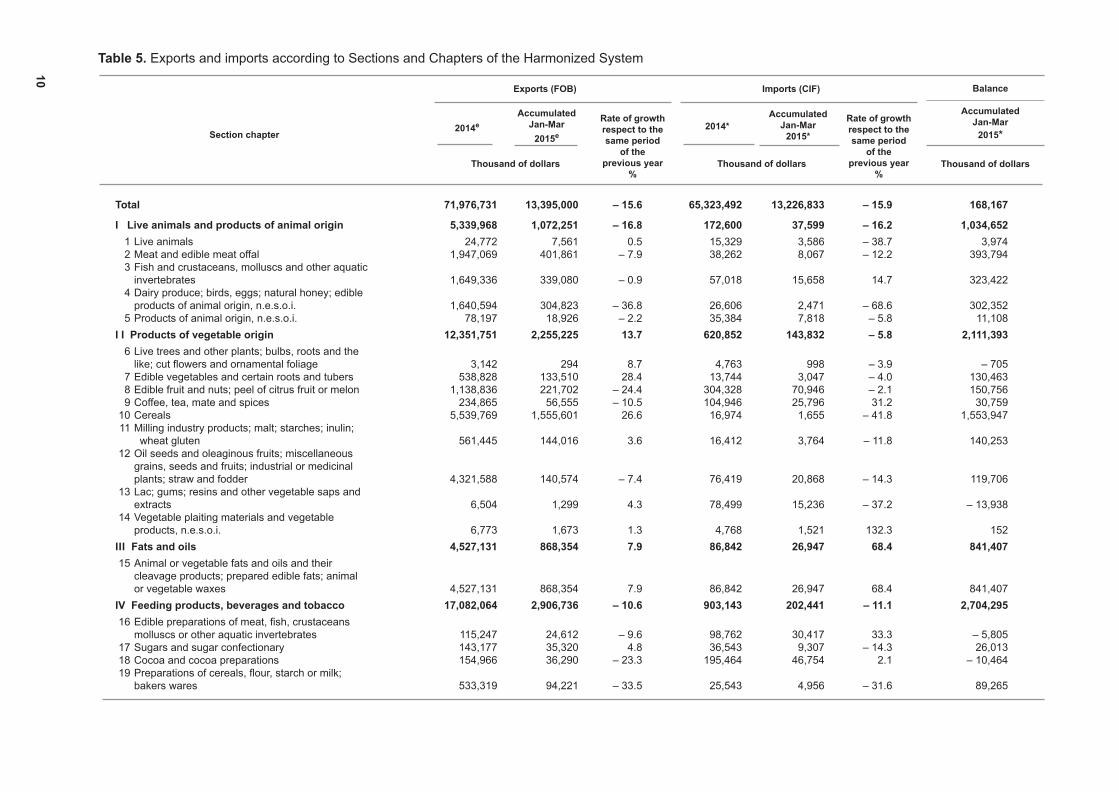
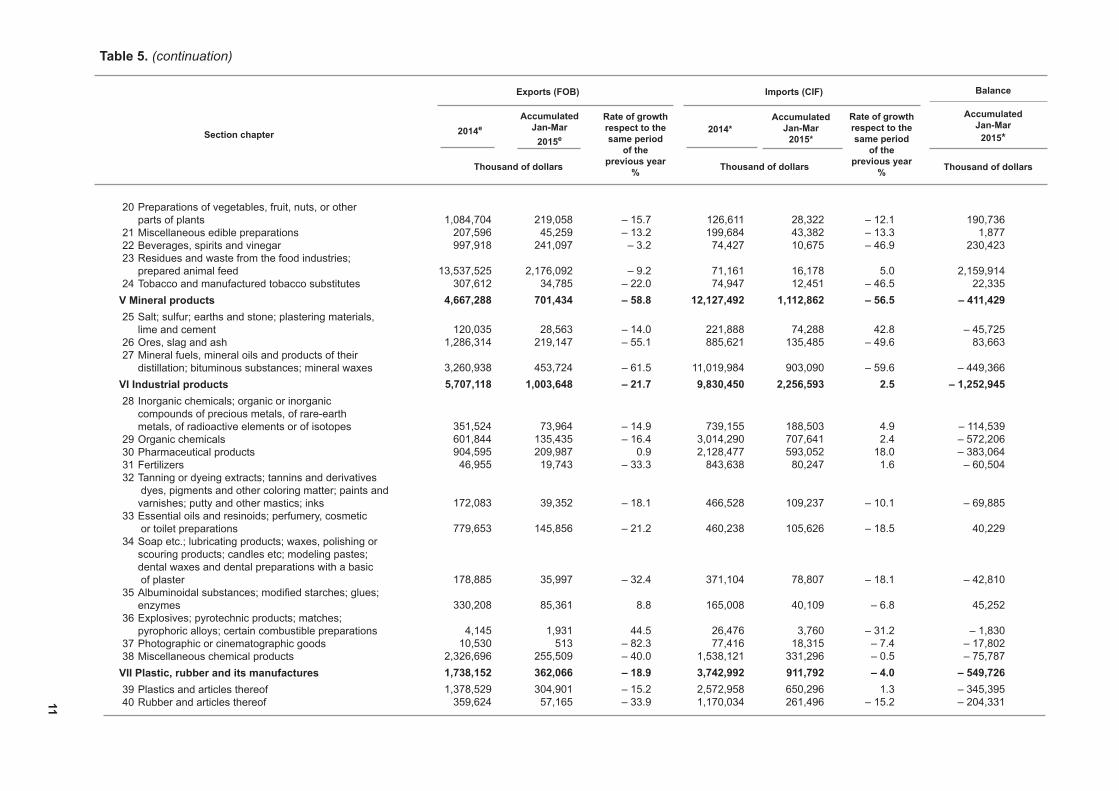
Table 5. Exports and imports according to Sections and Chapters of the Harmonized System
Total
I Live animals and products of animal origin 1 Live animals 2 Meat and edible meat offal 3 Fish and crustaceans, molluscs and other aquatic invertebrates 4 Dairy produce; birds, eggs; natural honey; edible products of animal origin, n.e.s.o.i. 5 Products of animal origin, n.e.s.o.i.I I Products of vegetable origin 6 Live trees and other plants; bulbs, roots and the like; cut flowers and ornamental foliage 7 Edible vegetables and certain roots and tubers 8 Edible fruit and nuts; peel of citrus fruit or melon 9 Coffee, tea, mate and spices 10 Cereals 11 Milling industry products; malt; starches; inulin;
wheat gluten 12 Oil seeds and oleaginous fruits; miscellaneous grains, seeds and fruits; industrial or medicinal
plants; straw and fodder 13 Lac; gums; resins and other vegetable saps and extracts 14 Vegetable plaiting materials and vegetable
products, n.e.s.o.i.III Fats and oils 15 Animal or vegetable fats and oils and their
cleavage products; prepared edible fats; animal or vegetable waxesIV Feeding products, beverages and tobacco 16 Edible preparations of meat, fish, crustaceans molluscs or other aquatic invertebrates 17 Sugars and sugar confectionary 18 Cocoa and cocoa preparations 19 Preparations of cereals, flour, starch or milk;
bakers wares
71,976,731 13,395,000 – 15.6 65,323,492 13,226,833 – 15.9 168,167
5,339,968 1,072,251 – 16.8 172,600 37,599 – 16.2 1,034,652 24,772 7,561 0.5 15,329 3,586 – 38.7 3,974 1,947,069 401,861 – 7.9 38,262 8,067 – 12.2 393,794 1,649,336 339,080 – 0.9 57,018 15,658 14.7 323,422 1,640,594 304,823 – 36.8 26,606 2,471 – 68.6 302,352 78,197 18,926 – 2.2 35,384 7,818 – 5.8 11,108 12,351,751 2,255,225 13.7 620,852 143,832 – 5.8 2,111,393
3,142 294 8.7 4,763 998 – 3.9 – 705 538,828 133,510 28.4 13,744 3,047 – 4.0 130,463 1,138,836 221,702 – 24.4 304,328 70,946 – 2.1 150,756 234,865 56,555 – 10.5 104,946 25,796 31.2 30,759 5,539,769 1,555,601 26.6 16,974 1,655 – 41.8 1,553,947 561,445 144,016 3.6 16,412 3,764 – 11.8 140,253 4,321,588 140,574 – 7.4 76,419 20,868 – 14.3 119,706 6,504 1,299 4.3 78,499 15,236 – 37.2 – 13,938 6,773 1,673 1.3 4,768 1,521 132.3 152 4,527,131 868,354 7.9 86,842 26,947 68.4 841,407 4,527,131 868,354 7.9 86,842 26,947 68.4 841,407 17,082,064 2,906,736 – 10.6 903,143 202,441 – 11.1 2,704,295 115,247 24,612 – 9.6 98,762 30,417 33.3 – 5,805 143,177 35,320 4.8 36,543 9,307 – 14.3 26,013 154,966 36,290 – 23.3 195,464 46,754 2.1 – 10,464
533,319 94,221 – 33.5 25,543 4,956 – 31.6 89,265
Section chapter
Balance
Thousand of dollars
Exports (FOB)
Thousand of dollars
Rate of growthrespect to the same period
of theprevious year
%
2014eAccumulated
Jan-Mar2015e
Imports (CIF)
Thousand of dollars
Rate of growthrespect to the same period
of theprevious year
%
2014*Accumulated
Jan-Mar2015*
AccumulatedJan-Mar
2015*
11
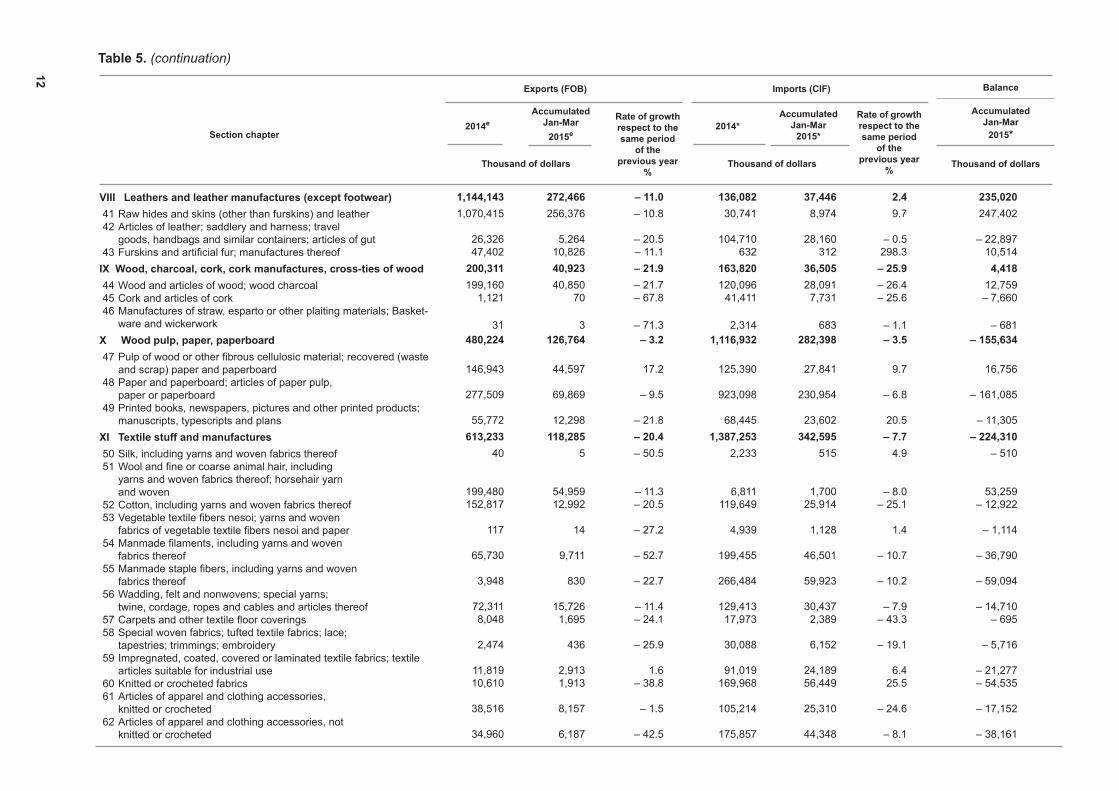
Table 5. (continuation)
20 Preparations of vegetables, fruit, nuts, or other parts of plants 21 Miscellaneous edible preparations 22 Beverages, spirits and vinegar 23 Residues and waste from the food industries;
prepared animal feed 24 Tobacco and manufactured tobacco substitutesV Mineral products 25 Salt; sulfur; earths and stone; plastering materials,
lime and cement 26 Ores, slag and ash 27 Mineral fuels, mineral oils and products of their
distillation; bituminous substances; mineral waxesVI Industrial products 28 Inorganic chemicals; organic or inorganic
compounds of precious metals, of rare-earth metals, of radioactive elements or of isotopes
29 Organic chemicals 30 Pharmaceutical products 31 Fertilizers 32 Tanning or dyeing extracts; tannins and derivatives
dyes, pigments and other coloring matter; paints and varnishes; putty and other mastics; inks 33 Essential oils and resinoids; perfumery, cosmetic
or toilet preparations 34 Soap etc.; lubricating products; waxes, polishing or
scouring products; candles etc; modeling pastes; dental waxes and dental preparations with a basic of plaster
35 Albuminoidal substances; modified starches; glues; enzymes
36 Explosives; pyrotechnic products; matches; pyrophoric alloys; certain combustible preparations
37 Photographic or cinematographic goods 38 Miscellaneous chemical productsVII Plastic, rubber and its manufactures 39 Plastics and articles thereof 40 Rubber and articles thereof
Section chapter
Balance
Thousand of dollars
Exports (FOB)
Thousand of dollars
Rate of growthrespect to the same period
of theprevious year
%
2014eAccumulated
Jan-Mar2015e
Imports (CIF)
Thousand of dollars
Rate of growthrespect to the same period
of theprevious year
%
2014*Accumulated
Jan-Mar2015*
AccumulatedJan-Mar
2015*
1,084,704 219,058 – 15.7 126,611 28,322 – 12.1 190,736 207,596 45,259 – 13.2 199,684 43,382 – 13.3 1,877 997,918 241,097 – 3.2 74,427 10,675 – 46.9 230,423
13,537,525 2,176,092 – 9.2 71,161 16,178 5.0 2,159,914 307,612 34,785 – 22.0 74,947 12,451 – 46.5 22,335 4,667,288 701,434 – 58.8 12,127,492 1,112,862 – 56.5 – 411,429
120,035 28,563 – 14.0 221,888 74,288 42.8 – 45,725 1,286,314 219,147 – 55.1 885,621 135,485 – 49.6 83,663
3,260,938 453,724 – 61.5 11,019,984 903,090 – 59.6 – 449,366 5,707,118 1,003,648 – 21.7 9,830,450 2,256,593 2.5 – 1,252,945
351,524 73,964 – 14.9 739,155 188,503 4.9 – 114,539 601,844 135,435 – 16.4 3,014,290 707,641 2.4 – 572,206 904,595 209,987 0.9 2,128,477 593,052 18.0 – 383,064 46,955 19,743 – 33.3 843,638 80,247 1.6 – 60,504
172,083 39,352 – 18.1 466,528 109,237 – 10.1 – 69,885
779,653 145,856 – 21.2 460,238 105,626 – 18.5 40,229
178,885 35,997 – 32.4 371,104 78,807 – 18.1 – 42,810
330,208 85,361 8.8 165,008 40,109 – 6.8 45,252
4,145 1,931 44.5 26,476 3,760 – 31.2 – 1,830 10,530 513 – 82.3 77,416 18,315 – 7.4 – 17,802 2,326,696 255,509 – 40.0 1,538,121 331,296 – 0.5 – 75,787 1,738,152 362,066 – 18.9 3,742,992 911,792 – 4.0 – 549,726 1,378,529 304,901 – 15.2 2,572,958 650,296 1.3 – 345,395 359,624 57,165 – 33.9 1,170,034 261,496 – 15.2 – 204,331
12
VIII Leathers and leather manufactures (except footwear) 41 Raw hides and skins (other than furskins) and leather 42 Articles of leather; saddlery and harness; travel
goods, handbags and similar containers; articles of gut 43 Furskins and artificial fur; manufactures thereofIX Wood, charcoal, cork, cork manufactures, cross-ties of wood 44 Wood and articles of wood; wood charcoal 45 Cork and articles of cork 46 Manufactures of straw, esparto or other plaiting materials; Basket-
ware and wickerwork X Wood pulp, paper, paperboard 47 Pulp of wood or other fibrous cellulosic material; recovered (waste
and scrap) paper and paperboard 48 Paper and paperboard; articles of paper pulp,
paper or paperboard 49 Printed books, newspapers, pictures and other printed products;
manuscripts, typescripts and plansXI Textile stuff and manufactures 50 Silk, including yarns and woven fabrics thereof 51 Wool and fine or coarse animal hair, including
yarns and woven fabrics thereof; horsehair yarn and woven
52 Cotton, including yarns and woven fabrics thereof 53 Vegetable textile fibers nesoi; yarns and woven
fabrics of vegetable textile fibers nesoi and paper 54 Manmade filaments, including yarns and woven fabrics thereof 55 Manmade staple fibers, including yarns and woven
fabrics thereof 56 Wadding, felt and nonwovens; special yarns;
twine, cordage, ropes and cables and articles thereof 57 Carpets and other textile floor coverings 58 Special woven fabrics; tufted textile fabrics; lace;
tapestries; trimmings; embroidery 59 Impregnated, coated, covered or laminated textile fabrics; textile
articles suitable for industrial use 60 Knitted or crocheted fabrics 61 Articles of apparel and clothing accessories,
knitted or crocheted 62 Articles of apparel and clothing accessories, not
knitted or crocheted
Table 5. (continuation)
Section chapter
Balance
Thousand of dollars
Exports (FOB)
Thousand of dollars
Rate of growthrespect to the same period
of theprevious year
%
2014eAccumulated
Jan-Mar2015e
Imports (CIF)
Thousand of dollars
Rate of growthrespect to the same period
of theprevious year
%
2014*Accumulated
Jan-Mar2015*
AccumulatedJan-Mar
2015*
1,144,143 272,466 – 11.0 136,082 37,446 2.4 235,020 1,070,415 256,376 – 10.8 30,741 8,974 9.7 247,402 26,326 5,264 – 20.5 104,710 28,160 – 0.5 – 22,897 47,402 10,826 – 11.1 632 312 298.3 10,514 200,311 40,923 – 21.9 163,820 36,505 – 25.9 4,418 199,160 40,850 – 21.7 120,096 28,091 – 26.4 12,759 1,121 70 – 67.8 41,411 7,731 – 25.6 – 7,660
31 3 – 71.3 2,314 683 – 1.1 – 681 480,224 126,764 – 3.2 1,116,932 282,398 – 3.5 – 155,634
146,943 44,597 17.2 125,390 27,841 9.7 16,756
277,509 69,869 – 9.5 923,098 230,954 – 6.8 – 161,085
55,772 12,298 – 21.8 68,445 23,602 20.5 – 11,305 613,233 118,285 – 20.4 1,387,253 342,595 – 7.7 – 224,310 40 5 – 50.5 2,233 515 4.9 – 510
199,480 54,959 – 11.3 6,811 1,700 – 8.0 53,259 152,817 12,992 – 20.5 119,649 25,914 – 25.1 – 12,922 117 14 – 27.2 4,939 1,128 1.4 – 1,114
65,730 9,711 – 52.7 199,455 46,501 – 10.7 – 36,790
3,948 830 – 22.7 266,484 59,923 – 10.2 – 59,094
72,311 15,726 – 11.4 129,413 30,437 – 7.9 – 14,710 8,048 1,695 – 24.1 17,973 2,389 – 43.3 – 695
2,474 436 – 25.9 30,088 6,152 – 19.1 – 5,716 11,819 2,913 1.6 91,019 24,189 6.4 – 21,277 10,610 1,913 – 38.8 169,968 56,449 25.5 – 54,535
38,516 8,157 – 1.5 105,214 25,310 – 24.6 – 17,152
34,960 6,187 – 42.5 175,857 44,348 – 8.1 – 38,161
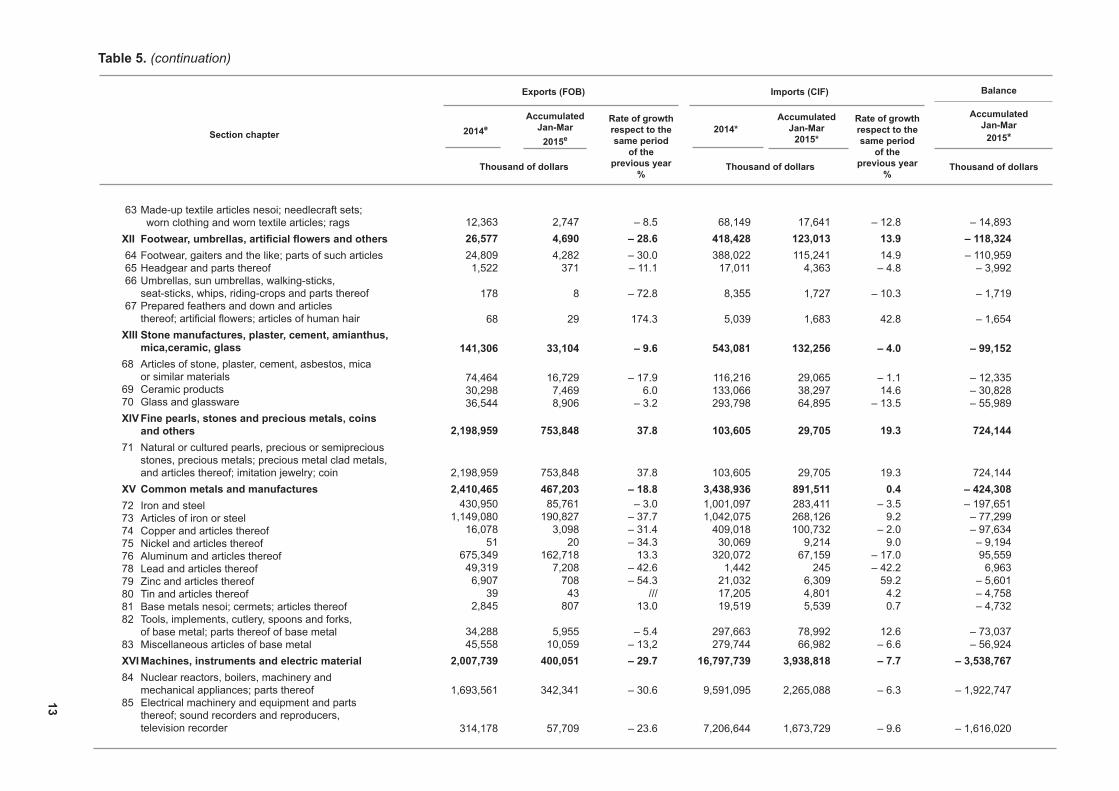
13
63 Made-up textile articles nesoi; needlecraft sets; worn clothing and worn textile articles; rags
XIIFootwear,umbrellas,artificialflowersandothers 64 Footwear, gaiters and the like; parts of such articles 65 Headgear and parts thereof 66 Umbrellas, sun umbrellas, walking-sticks, seat-sticks, whips, riding-crops and parts thereof 67 Prepared feathers and down and articles
thereof; artificial flowers; articles of human hairXIII Stone manufactures, plaster, cement, amianthus,
mica,ceramic, glass 68 Articles of stone, plaster, cement, asbestos, mica
or similar materials 69 Ceramic products70 Glass and glasswareXIV Fine pearls, stones and precious metals, coins
and others 71 Natural or cultured pearls, precious or semiprecious
stones, precious metals; precious metal clad metals, and articles thereof; imitation jewelry; coin
XV Common metals and manufactures72 Iron and steel73 Articles of iron or steel74 Copper and articles thereof 75 Nickel and articles thereof 76 Aluminum and articles thereof78 Lead and articles thereof79 Zinc and articles thereof80 Tin and articles thereof81 Base metals nesoi; cermets; articles thereof 82 Tools, implements, cutlery, spoons and forks, of base metal; parts thereof of base metal83 Miscellaneous articles of base metalXVI Machines, instruments and electric material84 Nuclear reactors, boilers, machinery and
mechanical appliances; parts thereof85 Electrical machinery and equipment and parts
thereof; sound recorders and reproducers, television recorder
Table 5. (continuation)
Section chapter
Balance
Thousand of dollars
Exports (FOB)
Thousand of dollars
Rate of growthrespect to the same period
of theprevious year
%
2014eAccumulated
Jan-Mar2015e
Imports (CIF)
Thousand of dollars
Rate of growthrespect to the same period
of theprevious year
%
2014*Accumulated
Jan-Mar2015*
AccumulatedJan-Mar
2015*
12,363 2,747 – 8.5 68,149 17,641 – 12.8 – 14,893 26,577 4,690 – 28.6 418,428 123,013 13.9 – 118,324 24,809 4,282 – 30.0 388,022 115,241 14.9 – 110,959 1,522 371 – 11.1 17,011 4,363 – 4.8 – 3,992 178 8 – 72.8 8,355 1,727 – 10.3 – 1,719 68 29 174.3 5,039 1,683 42.8 – 1,654 141,306 33,104 – 9.6 543,081 132,256 – 4.0 – 99,152 74,464 16,729 – 17.9 116,216 29,065 – 1.1 – 12,335 30,298 7,469 6.0 133,066 38,297 14.6 – 30,828 36,544 8,906 – 3.2 293,798 64,895 – 13.5 – 55,989 2,198,959 753,848 37.8 103,605 29,705 19.3 724,144
2,198,959 753,848 37.8 103,605 29,705 19.3 724,144 2,410,465 467,203 – 18.8 3,438,936 891,511 0.4 – 424,308 430,950 85,761 – 3.0 1,001,097 283,411 – 3.5 – 197,651 1,149,080 190,827 – 37.7 1,042,075 268,126 9.2 – 77,299 16,078 3,098 – 31.4 409,018 100,732 – 2.0 – 97,634 51 20 – 34.3 30,069 9,214 9.0 – 9,194 675,349 162,718 13.3 320,072 67,159 – 17.0 95,559 49,319 7,208 – 42.6 1,442 245 – 42.2 6,963 6,907 708 – 54.3 21,032 6,309 59.2 – 5,601 39 43 /// 17,205 4,801 4.2 – 4,758 2,845 807 13.0 19,519 5,539 0.7 – 4,732 34,288 5,955 – 5.4 297,663 78,992 12.6 – 73,037 45,558 10,059 – 13,2 279,744 66,982 – 6.6 – 56,924 2,007,739 400,051 – 29.7 16,797,739 3,938,818 – 7.7 – 3,538,767 1,693,561 342,341 – 30.6 9,591,095 2,265,088 – 6.3 – 1,922,747
314,178 57,709 – 23.6 7,206,644 1,673,729 – 9.6 – 1,616,020
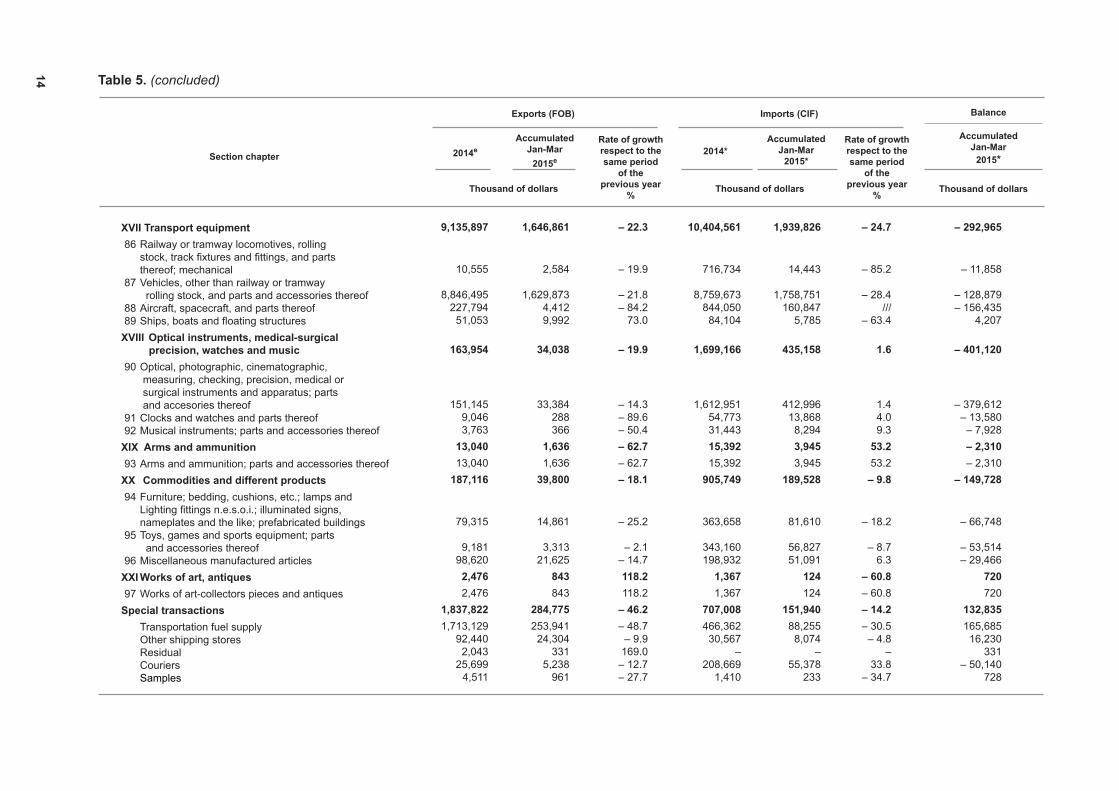
14
XVII Transport equipment 86 Railway or tramway locomotives, rolling
stock, track fixtures and fittings, and parts thereof; mechanical
87 Vehicles, other than railway or tramway rolling stock, and parts and accessories thereof
88 Aircraft, spacecraft, and parts thereof 89 Ships, boats and floating structuresXVIII Optical instruments, medical-surgical
precision, watches and music 90 Optical, photographic, cinematographic,
measuring, checking, precision, medical or surgical instruments and apparatus; parts and accesories thereof
91 Clocks and watches and parts thereof 92 Musical instruments; parts and accessories thereofXIX Arms and ammunition 93 Arms and ammunition; parts and accessories thereofXX Commodities and different products 94 Furniture; bedding, cushions, etc.; lamps and
Lighting fittings n.e.s.o.i.; illuminated signs, nameplates and the like; prefabricated buildings
95 Toys, games and sports equipment; parts and accessories thereof
96 Miscellaneous manufactured articlesXXI Works of art, antiques 97 Works of art-collectors pieces and antiquesSpecial transactions Transportation fuel supply Other shipping stores Residual Couriers Samples
Table 5. (concluded)
Section chapter
Balance
Thousand of dollars
Exports (FOB)
Thousand of dollars
Rate of growthrespect to the same period
of theprevious year
%
2014eAccumulated
Jan-Mar2015e
Imports (CIF)
Thousand of dollars
Rate of growthrespect to the same period
of theprevious year
%
2014*Accumulated
Jan-Mar2015*
AccumulatedJan-Mar
2015*
9,135,897 1,646,861 – 22.3 10,404,561 1,939,826 – 24.7 – 292,965
10,555 2,584 – 19.9 716,734 14,443 – 85.2 – 11,858 8,846,495 1,629,873 – 21.8 8,759,673 1,758,751 – 28.4 – 128,879 227,794 4,412 – 84.2 844,050 160,847 /// – 156,435 51,053 9,992 73.0 84,104 5,785 – 63.4 4,207 163,954 34,038 – 19.9 1,699,166 435,158 1.6 – 401,120
151,145 33,384 – 14.3 1,612,951 412,996 1.4 – 379,612 9,046 288 – 89.6 54,773 13,868 4.0 – 13,580 3,763 366 – 50.4 31,443 8,294 9.3 – 7,928 13,040 1,636 – 62.7 15,392 3,945 53.2 – 2,310 13,040 1,636 – 62.7 15,392 3,945 53.2 – 2,310 187,116 39,800 – 18.1 905,749 189,528 – 9.8 – 149,728
79,315 14,861 – 25.2 363,658 81,610 – 18.2 – 66,748 9,181 3,313 – 2.1 343,160 56,827 – 8.7 – 53,514 98,620 21,625 – 14.7 198,932 51,091 6.3 – 29,466 2,476 843 118.2 1,367 124 – 60.8 720 2,476 843 118.2 1,367 124 – 60.8 720 1,837,822 284,775 – 46.2 707,008 151,940 – 14.2 132,835 1,713,129 253,941 – 48.7 466,362 88,255 – 30.5 165,685 92,440 24,304 – 9.9 30,567 8,074 – 4.8 16,230 2,043 331 169.0 – – – 331 25,699 5,238 – 12.7 208,669 55,378 33.8 – 50,140 4,511 961 – 27.7 1,410 233 – 34.7 728
15
Groups of commodities
Rate ofgrowth res-
pectto the sameperiod of theprevious year
%
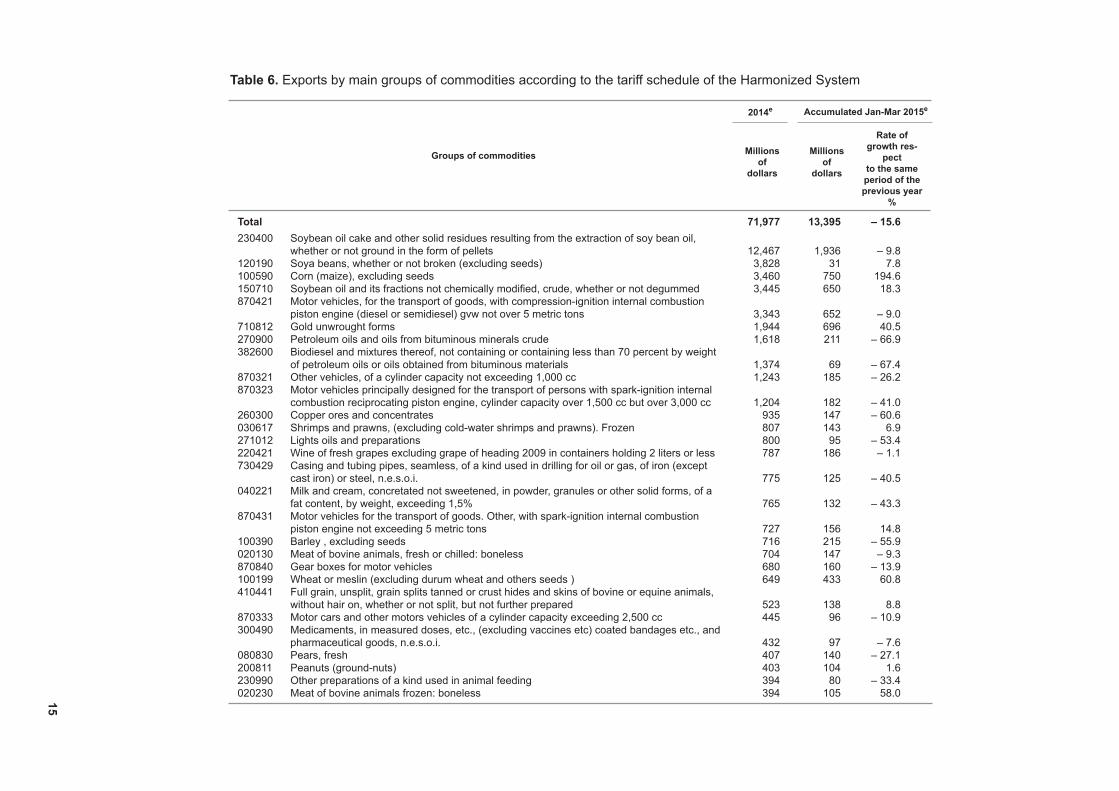
Table 6. Exports by main groups of commodities according to the tariff schedule of the Harmonized System
2014e
Millionsof
dollars
Accumulated Jan-Mar 2015e
Total 71,977 13,395 – 15.6230400 Soybean oil cake and other solid residues resulting from the extraction of soy bean oil, whether or not ground in the form of pellets 12,467 1,936 – 9.8120190 Soya beans, whether or not broken (excluding seeds) 3,828 31 7.8100590 Corn (maize), excluding seeds 3,460 750 194.6150710 Soybean oil and its fractions not chemically modified, crude, whether or not degummed 3,445 650 18.3870421 Motor vehicles, for the transport of goods, with compression-ignition internal combustion piston engine (diesel or semidiesel) gvw not over 5 metric tons 3,343 652 – 9.0710812 Gold unwrought forms 1,944 696 40.5270900 Petroleum oils and oils from bituminous minerals crude 1,618 211 – 66.9382600 Biodiesel and mixtures thereof, not containing or containing less than 70 percent by weight of petroleum oils or oils obtained from bituminous materials 1,374 69 – 67.4870321 Other vehicles, of a cylinder capacity not exceeding 1,000 cc 1,243 185 – 26.2870323 Motor vehicles principally designed for the transport of persons with spark-ignition internal combustion reciprocating piston engine, cylinder capacity over 1,500 cc but over 3,000 cc 1,204 182 – 41.0260300 Copper ores and concentrates 935 147 – 60.6030617 Shrimps and prawns, (excluding cold-water shrimps and prawns). Frozen 807 143 6.9271012 Lights oils and preparations 800 95 – 53.4220421 Wine of fresh grapes excluding grape of heading 2009 in containers holding 2 liters or less 787 186 – 1.1730429 Casing and tubing pipes, seamless, of a kind used in drilling for oil or gas, of iron (except cast iron) or steel, n.e.s.o.i. 775 125 – 40.5040221 Milk and cream, concretated not sweetened, in powder, granules or other solid forms, of a fat content, by weight, exceeding 1,5% 765 132 – 43.3870431 Motor vehicles for the transport of goods. Other, with spark-ignition internal combustion piston engine not exceeding 5 metric tons 727 156 14.8100390 Barley , excluding seeds 716 215 – 55.9020130 Meat of bovine animals, fresh or chilled: boneless 704 147 – 9.3870840 Gear boxes for motor vehicles 680 160 – 13.9100199 Wheat or meslin (excluding durum wheat and others seeds ) 649 433 60.8410441 Full grain, unsplit, grain splits tanned or crust hides and skins of bovine or equine animals, without hair on, whether or not split, but not further prepared 523 138 8.8870333 Motor cars and other motors vehicles of a cylinder capacity exceeding 2,500 cc 445 96 – 10.9300490 Medicaments, in measured doses, etc., (excluding vaccines etc) coated bandages etc., and pharmaceutical goods, n.e.s.o.i. 432 97 – 7.6080830 Pears, fresh 407 140 – 27.1200811 Peanuts (ground-nuts) 403 104 1.6230990 Other preparations of a kind used in animal feeding 394 80 – 33.4020230 Meat of bovine animals frozen: boneless 394 105 58.0
Millionsof
dollars
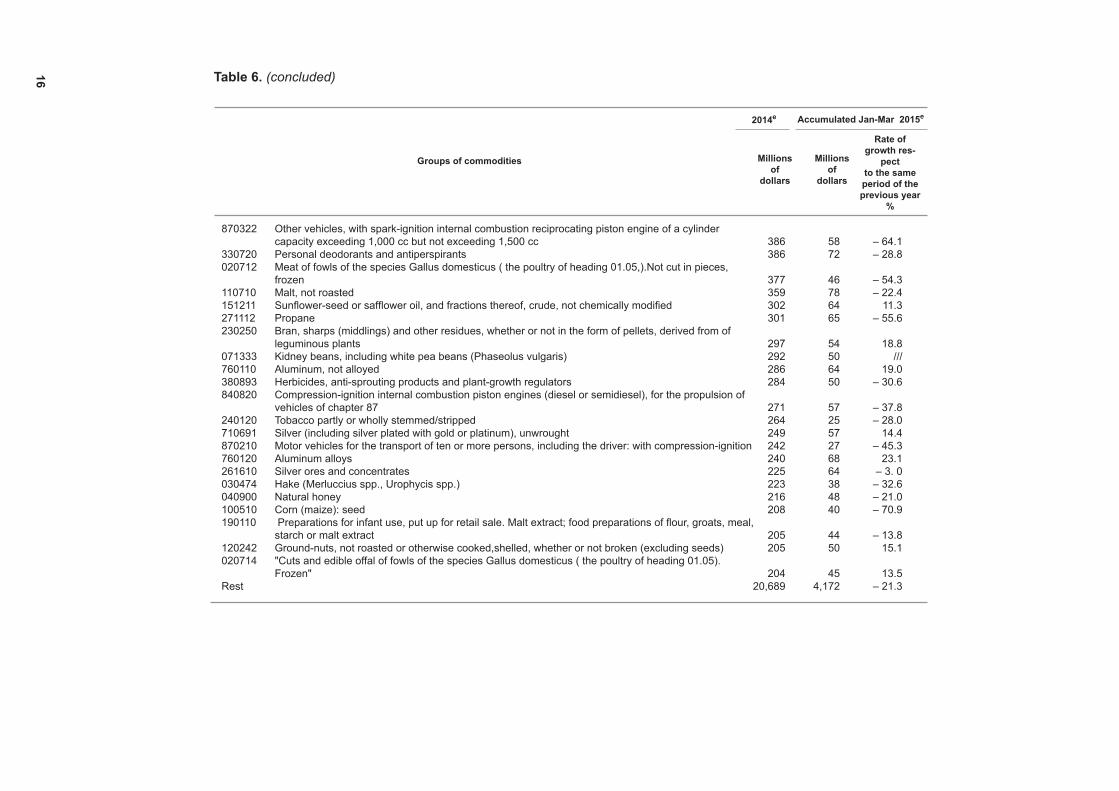
16 Table 6. (concluded)
Groups of commodities
Accumulated Jan-Mar 2015e
Rate ofgrowth res-
pectto the sameperiod of theprevious year
%
2014e
Millionsof
dollars
Millionsof
dollars
870322 Other vehicles, with spark-ignition internal combustion reciprocating piston engine of a cylinder capacity exceeding 1,000 cc but not exceeding 1,500 cc 386 58 – 64.1330720 Personal deodorants and antiperspirants 386 72 – 28.8020712 Meat of fowls of the species Gallus domesticus ( the poultry of heading 01.05,).Not cut in pieces, frozen 377 46 – 54.3110710 Malt, not roasted 359 78 – 22.4151211 Sunflower-seed or safflower oil, and fractions thereof, crude, not chemically modified 302 64 11.3271112 Propane 301 65 – 55.6230250 Bran, sharps (middlings) and other residues, whether or not in the form of pellets, derived from of leguminous plants 297 54 18.8071333 Kidney beans, including white pea beans (Phaseolus vulgaris) 292 50 ///760110 Aluminum, not alloyed 286 64 19.0380893 Herbicides, anti-sprouting products and plant-growth regulators 284 50 – 30.6840820 Compression-ignition internal combustion piston engines (diesel or semidiesel), for the propulsion of vehicles of chapter 87 271 57 – 37.8240120 Tobacco partly or wholly stemmed/stripped 264 25 – 28.0710691 Silver (including silver plated with gold or platinum), unwrought 249 57 14.4870210 Motor vehicles for the transport of ten or more persons, including the driver: with compression-ignition 242 27 – 45.3760120 Aluminum alloys 240 68 23.1261610 Silver ores and concentrates 225 64 – 3. 0030474 Hake (Merluccius spp., Urophycis spp.) 223 38 – 32.6040900 Natural honey 216 48 – 21.0100510 Corn (maize): seed 208 40 – 70.9190110 Preparations for infant use, put up for retail sale. Malt extract; food preparations of flour, groats, meal, starch or malt extract 205 44 – 13.8120242 Ground-nuts, not roasted or otherwise cooked,shelled, whether or not broken (excluding seeds) 205 50 15.1020714 "Cuts and edible offal of fowls of the species Gallus domesticus ( the poultry of heading 01.05). Frozen" 204 45 13.5Rest 20,689 4,172 – 21.3
17
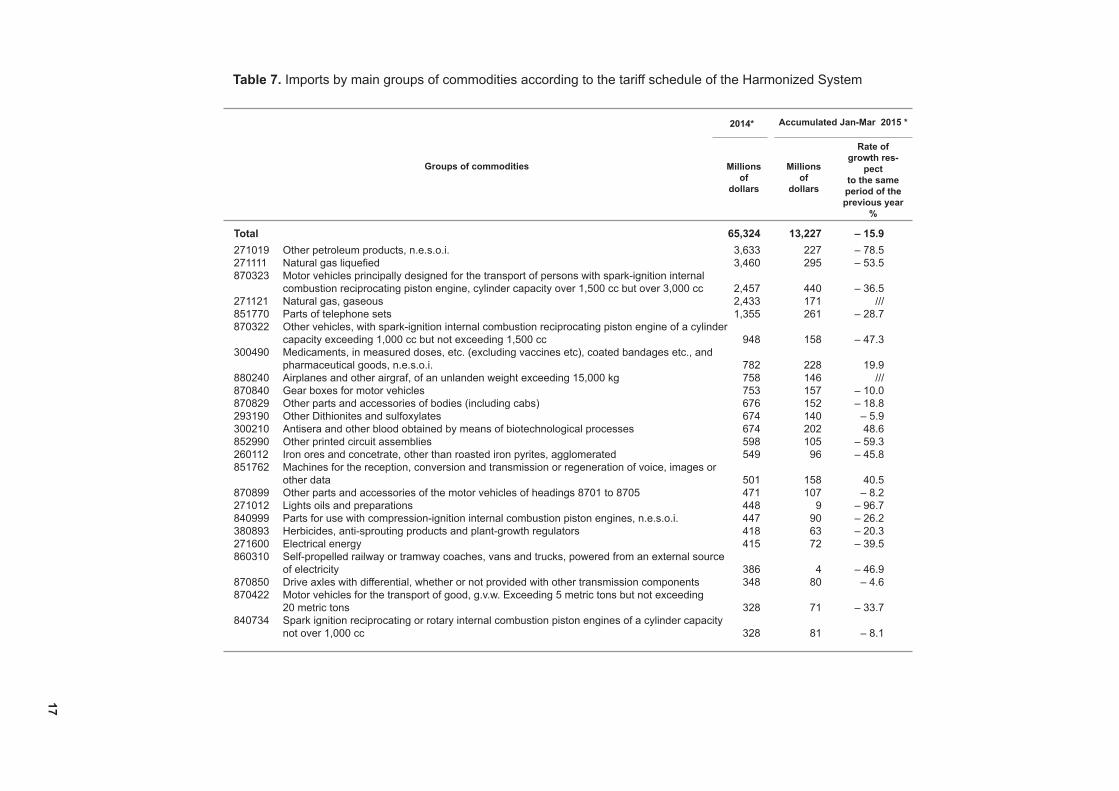
Table 7. Imports by main groups of commodities according to the tariff schedule of the Harmonized System
Groups of commodities
Rate ofgrowth res-
pectto the sameperiod of theprevious year
%
2014*
Total 65,324 13,227 – 15.9271019 Other petroleum products, n.e.s.o.i. 3,633 227 – 78.5271111 Natural gas liquefied 3,460 295 – 53.5870323 Motor vehicles principally designed for the transport of persons with spark-ignition internal combustion reciprocating piston engine, cylinder capacity over 1,500 cc but over 3,000 cc 2,457 440 – 36.5271121 Natural gas, gaseous 2,433 171 ///851770 Parts of telephone sets 1,355 261 – 28.7870322 Other vehicles, with spark-ignition internal combustion reciprocating piston engine of a cylinder capacity exceeding 1,000 cc but not exceeding 1,500 cc 948 158 – 47.3300490 Medicaments, in measured doses, etc. (excluding vaccines etc), coated bandages etc., and pharmaceutical goods, n.e.s.o.i. 782 228 19.9880240 Airplanes and other airgraf, of an unlanden weight exceeding 15,000 kg 758 146 ///870840 Gear boxes for motor vehicles 753 157 – 10.0870829 Other parts and accessories of bodies (including cabs) 676 152 – 18.8293190 Other Dithionites and sulfoxylates 674 140 – 5.9300210 Antisera and other blood obtained by means of biotechnological processes 674 202 48.6852990 Other printed circuit assemblies 598 105 – 59.3260112 Iron ores and concetrate, other than roasted iron pyrites, agglomerated 549 96 – 45.8851762 Machines for the reception, conversion and transmission or regeneration of voice, images or other data 501 158 40.5870899 Other parts and accessories of the motor vehicles of headings 8701 to 8705 471 107 – 8.2271012 Lights oils and preparations 448 9 – 96.7840999 Parts for use with compression-ignition internal combustion piston engines, n.e.s.o.i. 447 90 – 26.2380893 Herbicides, anti-sprouting products and plant-growth regulators 418 63 – 20.3 271600 Electrical energy 415 72 – 39.5860310 Self-propelled railway or tramway coaches, vans and trucks, powered from an external source of electricity 386 4 – 46.9870850 Drive axles with differential, whether or not provided with other transmission components 348 80 – 4.6870422 Motor vehicles for the transport of good, g.v.w. Exceeding 5 metric tons but not exceeding 20 metric tons 328 71 – 33.7840734 Spark ignition reciprocating or rotary internal combustion piston engines of a cylinder capacity not over 1,000 cc 328 81 – 8.1
Millionsof
dollars
Millionsof
dollars
Accumulated Jan-Mar 2015 *
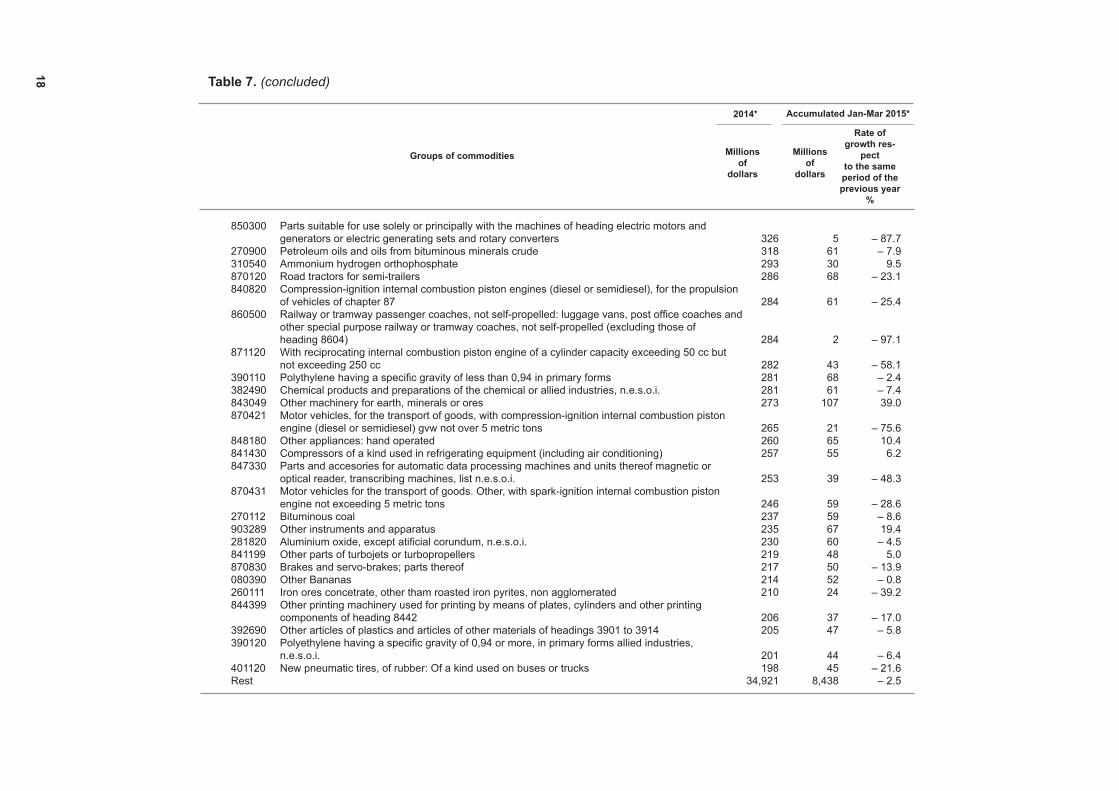
18 Table 7. (concluded)
Groups of commodities
Rate ofgrowth res-
pectto the sameperiod of theprevious year
%
2014* Accumulated Jan-Mar 2015*
Millionsof
dollars
Millionsof
dollars
850300 Parts suitable for use solely or principally with the machines of heading electric motors and generators or electric generating sets and rotary converters 326 5 – 87.7270900 Petroleum oils and oils from bituminous minerals crude 318 61 – 7.9310540 Ammonium hydrogen orthophosphate 293 30 9.5870120 Road tractors for semi-trailers 286 68 – 23.1840820 Compression-ignition internal combustion piston engines (diesel or semidiesel), for the propulsion of vehicles of chapter 87 284 61 – 25.4860500 Railway or tramway passenger coaches, not self-propelled: luggage vans, post office coaches and other special purpose railway or tramway coaches, not self-propelled (excluding those of heading 8604) 284 2 – 97.1871120 With reciprocating internal combustion piston engine of a cylinder capacity exceeding 50 cc but not exceeding 250 cc 282 43 – 58.1390110 Polythylene having a specific gravity of less than 0,94 in primary forms 281 68 – 2.4382490 Chemical products and preparations of the chemical or allied industries, n.e.s.o.i. 281 61 – 7.4843049 Other machinery for earth, minerals or ores 273 107 39.0870421 Motor vehicles, for the transport of goods, with compression-ignition internal combustion piston engine (diesel or semidiesel) gvw not over 5 metric tons 265 21 – 75.6848180 Other appliances: hand operated 260 65 10.4841430 Compressors of a kind used in refrigerating equipment (including air conditioning) 257 55 6.2847330 Parts and accesories for automatic data processing machines and units thereof magnetic or optical reader, transcribing machines, list n.e.s.o.i. 253 39 – 48.3870431 Motor vehicles for the transport of goods. Other, with spark-ignition internal combustion piston engine not exceeding 5 metric tons 246 59 – 28.6270112 Bituminous coal 237 59 – 8.6903289 Other instruments and apparatus 235 67 19.4281820 Aluminium oxide, except atificial corundum, n.e.s.o.i. 230 60 – 4.5841199 Other parts of turbojets or turbopropellers 219 48 5.0870830 Brakes and servo-brakes; parts thereof 217 50 – 13.9080390 Other Bananas 214 52 – 0.8260111 Iron ores concetrate, other tham roasted iron pyrites, non agglomerated 210 24 – 39.2844399 Other printing machinery used for printing by means of plates, cylinders and other printing components of heading 8442 206 37 – 17.0392690 Other articles of plastics and articles of other materials of headings 3901 to 3914 205 47 – 5.8390120 Polyethylene having a specific gravity of 0,94 or more, in primary forms allied industries, n.e.s.o.i. 201 44 – 6.4401120 New pneumatic tires, of rubber: Of a kind used on buses or trucks 198 45 – 21.6Rest 34,921 8,438 – 2.5