Embed Size (px)
Citation preview
1 Argentina | Country reports | Trends in global energy efficiency 2011
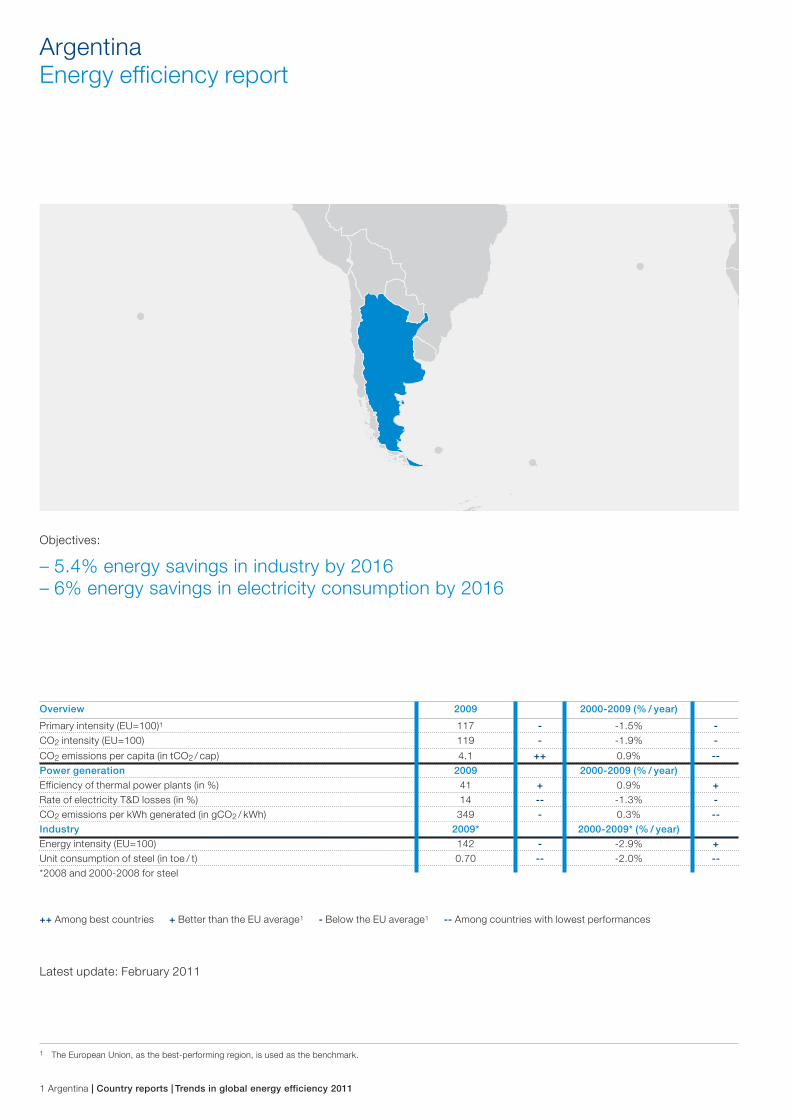
ArgentinaEnergy efficiency report
Objectives:
– 5.4% energy savings in industry by 2016– 6% energy savings in electricity consumption by 2016
Overview 2009 2000-2009 (% / year)
Primary intensity (EU=100)1 117 - -1.5% -CO2 intensity (EU=100) 119 - -1.9% -
CO2 emissions per capita (in tCO2 / cap) 4.1 ++ 0.9% --Power generation 2009 2000-2009 (% / year)Efficiency of thermal power plants (in %) 41 + 0.9% +Rate of electricity T&D losses (in %) 14 -- -1.3% -CO2 emissions per kWh generated (in gCO2 / kWh) 349 - 0.3% --Industry 2009* 2000-2009* (% / year)Energy intensity (EU=100) 142 - -2.9% +Unit consumption of steel (in toe / t) 0.70 -- -2.0% --*2008 and 2000-2008 for steel
++ Among best countries + Better than the EU average1 - Below the EU average1 -- Among countries with lowest performances
1 The European Union, as the best-performing region, is used as the benchmark.
Latest update: February 2011
Trends in global energy efficiency 2011 | Country reports | Argentina 2
1. Overview1.1. Policies: energy savings targets by sector In December 2007 the government launched the National Program for Rational and Efficient Use of Energy (PRONUREE). The PRONUREE includes short- and long-term objectives to improve energy efficiency in industry, transport, the household sector (10 percent energy savings target for 2016) and the services sector (12 percent energy savings target for 2016), as well as in public buildings (10 percent energy savings target for 2016). PRONUREE aims to decrease electricity consumption by 6 percent compared with a reference projection and to save 1,500 MW by 2016.
It also supports educational programs on energy efficiency, regulations to expand cogeneration activities, labeling of appliances, energy efficiency regulations, and broader utiliza-tion of the Clean Development Mechanism (CDM) to support the development of energy efficiency projects.
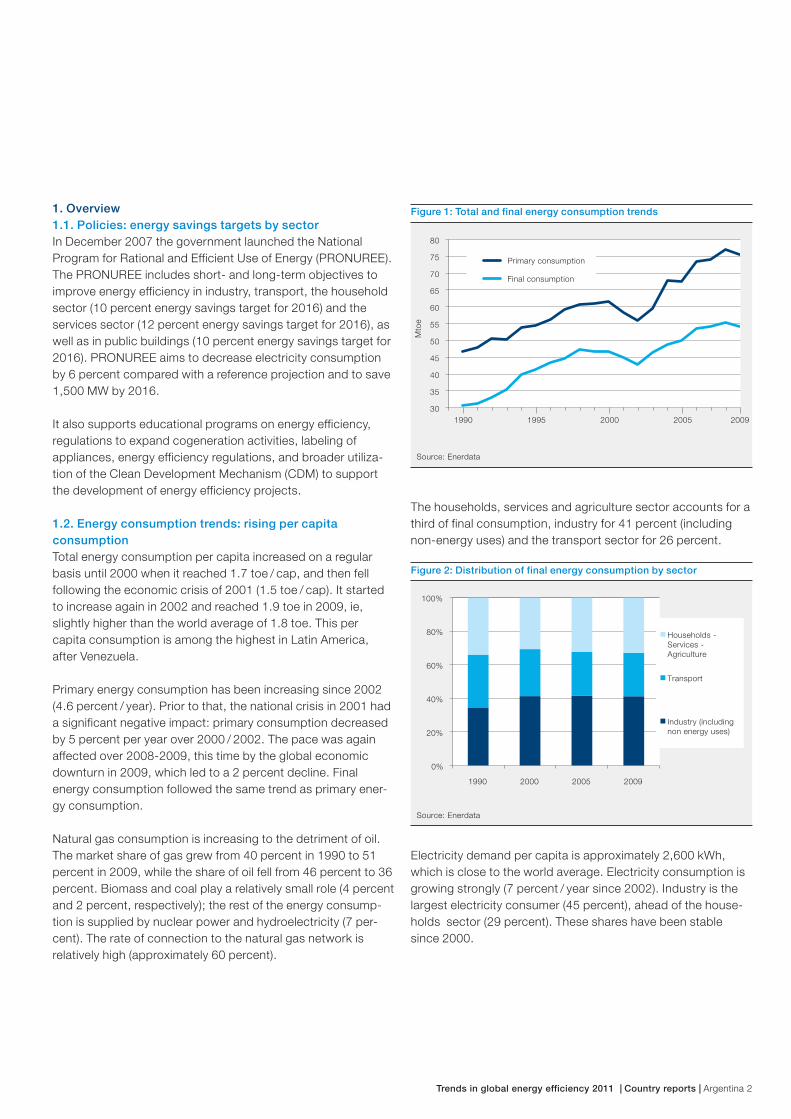
1.2. Energy consumption trends: rising per capita consumptionTotal energy consumption per capita increased on a regular basis until 2000 when it reached 1.7 toe / cap, and then fell following the economic crisis of 2001 (1.5 toe / cap). It started to increase again in 2002 and reached 1.9 toe in 2009, ie, slightly higher than the world average of 1.8 toe. This per capita consumption is among the highest in Latin America, after Venezuela.
Primary energy consumption has been increasing since 2002 (4.6 percent / year). Prior to that, the national crisis in 2001 had a significant negative impact: primary consumption decreased by 5 percent per year over 2000 / 2002. The pace was again affected over 2008-2009, this time by the global economic downturn in 2009, which led to a 2 percent decline. Final energy consumption followed the same trend as primary ener-gy consumption.
Natural gas consumption is increasing to the detriment of oil. The market share of gas grew from 40 percent in 1990 to 51 percent in 2009, while the share of oil fell from 46 percent to 36 percent. Biomass and coal play a relatively small role (4 percent and 2 percent, respectively); the rest of the energy consump-tion is supplied by nuclear power and hydroelectricity (7 per-cent). The rate of connection to the natural gas network is relatively high (approximately 60 percent).
Source: Enerdata
30
35
40
45
50
55
60
65
70
75
80
Mto
e1990 1995 2000 2005 2009
Primary consumption
Final consumption
Figure 1: Total and final energy consumption trends
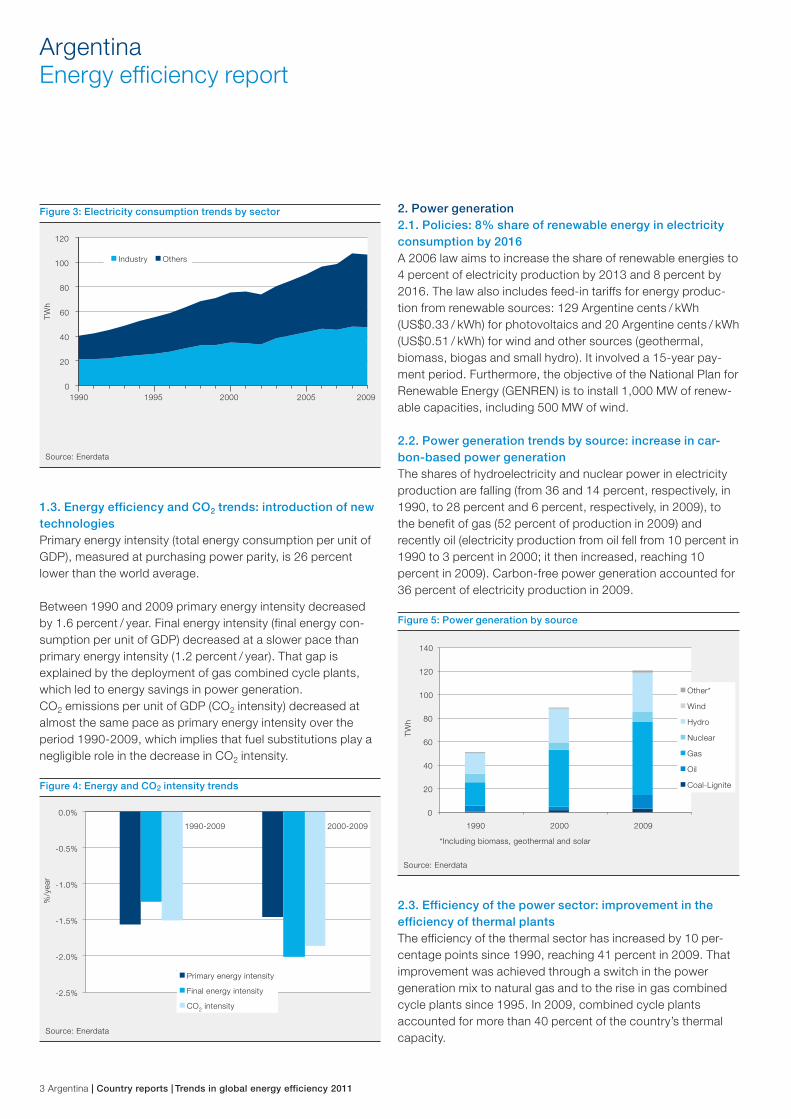
The households, services and agriculture sector accounts for a third of final consumption, industry for 41 percent (including non-energy uses) and the transport sector for 26 percent.
Source: Enerdata
0%
20%
40%
60%
80%
100%
1990 2000 2005 2009
Households - Services -Agriculture
Transport
Industry (including non energy uses)
Figure 2: Distribution of final energy consumption by sector
Electricity demand per capita is approximately 2,600 kWh, which is close to the world average. Electricity consumption is growing strongly (7 percent / year since 2002). Industry is the largest electricity consumer (45 percent), ahead of the house-holds sector (29 percent). These shares have been stable since 2000.
3 Argentina | Country reports | Trends in global energy efficiency 2011
ArgentinaEnergy efficiency report
Source: Enerdata
0
20
40
60
80
100
120
TWh
Industry Others
1990 1995 2000 2005 2009
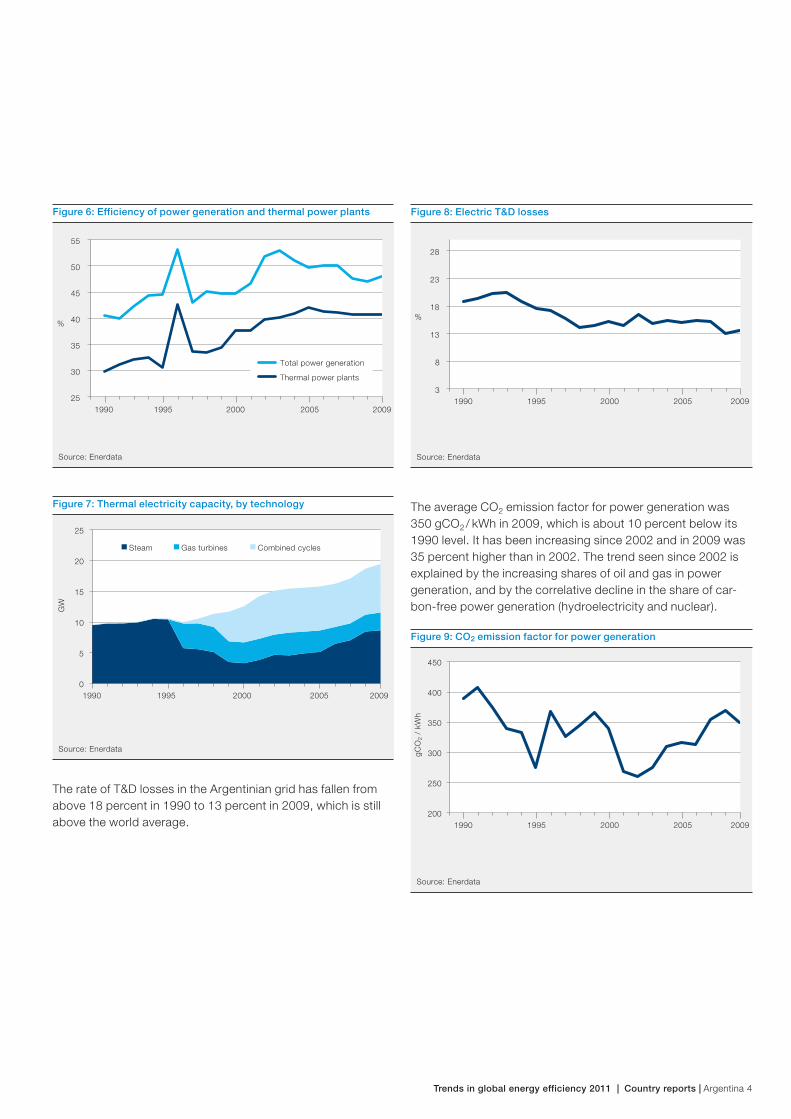
Figure 3: Electricity consumption trends by sector
1.3. Energy efficiency and CO2 trends: introduction of new technologies Primary energy intensity (total energy consumption per unit of GDP), measured at purchasing power parity, is 26 percent lower than the world average.
Between 1990 and 2009 primary energy intensity decreased by 1.6 percent / year. Final energy intensity (final energy con-sumption per unit of GDP) decreased at a slower pace than primary energy intensity (1.2 percent / year). That gap is explained by the deployment of gas combined cycle plants, which led to energy savings in power generation.CO2 emissions per unit of GDP (CO2 intensity) decreased at almost the same pace as primary energy intensity over the period 1990-2009, which implies that fuel substitutions play a negligible role in the decrease in CO2 intensity.
Source: Enerdata
1990-2009 2000-2009
%/y
ear
Primary energy intensity
Final energy intensity
CO2 intensity
-2.5%
-2.0%
-1.5%
-1.0%
-0.5%
0.0%
Figure 4: Energy and CO2 intensity trends
2. Power generation2.1. Policies: 8% share of renewable energy in electricity consumption by 2016A 2006 law aims to increase the share of renewable energies to 4 percent of electricity production by 2013 and 8 percent by 2016. The law also includes feed-in tariffs for energy produc-tion from renewable sources: 129 Argentine cents / kWh (US$0.33 / kWh) for photovoltaics and 20 Argentine cents / kWh (US$0.51 / kWh) for wind and other sources (geothermal, biomass, biogas and small hydro). It involved a 15-year pay-ment period. Furthermore, the objective of the National Plan for Renewable Energy (GENREN) is to install 1,000 MW of renew-able capacities, including 500 MW of wind.
2.2. Power generation trends by source: increase in car-bon-based power generationThe shares of hydroelectricity and nuclear power in electricity production are falling (from 36 and 14 percent, respectively, in 1990, to 28 percent and 6 percent, respectively, in 2009), to the benefit of gas (52 percent of production in 2009) and recently oil (electricity production from oil fell from 10 percent in 1990 to 3 percent in 2000; it then increased, reaching 10 percent in 2009). Carbon-free power generation accounted for 36 percent of electricity production in 2009.
Source: Enerdata
0
20
40
60
80
100
120
140
1990 2000 2009
TWh
Other*
Wind
Hydro
Nuclear
Gas
Oil
Coal-Lignite
*Including biomass, geothermal and solar
Figure 5: Power generation by source
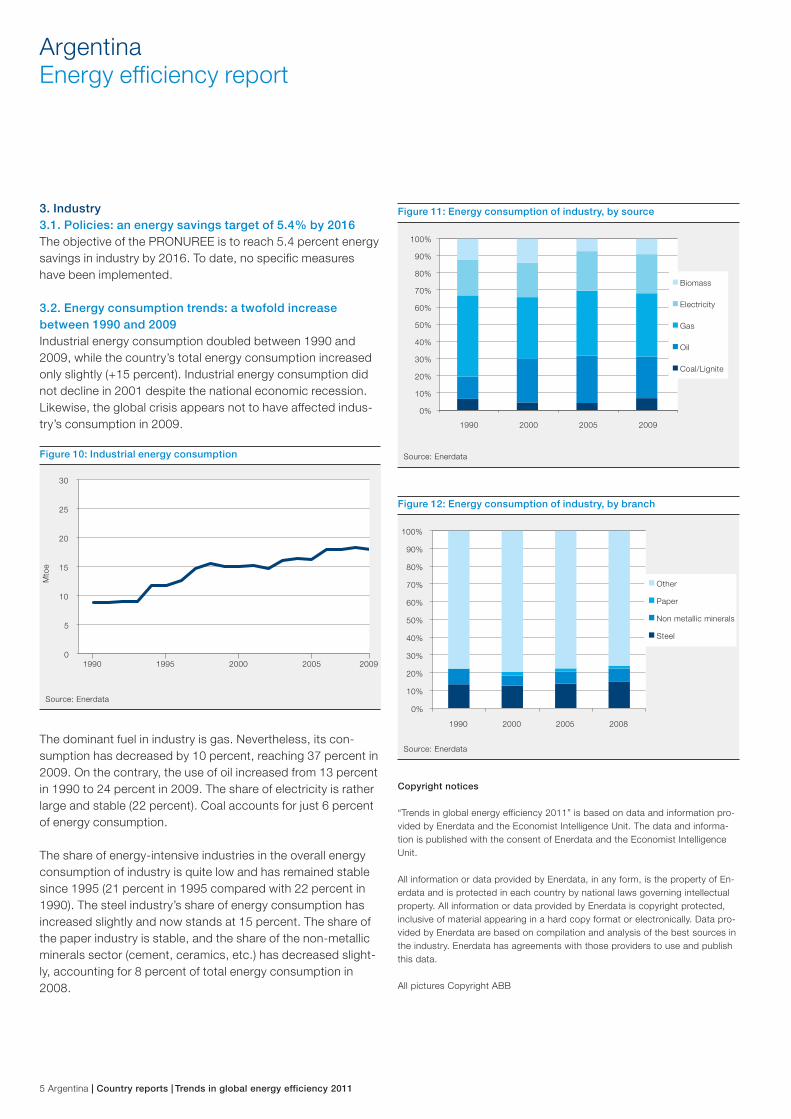
2.3. Efficiency of the power sector: improvement in the efficiency of thermal plants The efficiency of the thermal sector has increased by 10 per-centage points since 1990, reaching 41 percent in 2009. That improvement was achieved through a switch in the power generation mix to natural gas and to the rise in gas combined cycle plants since 1995. In 2009, combined cycle plants accounted for more than 40 percent of the country’s thermal capacity.
Trends in global energy efficiency 2011 | Country reports | Argentina 4
Source: Enerdata
25
30
35
40
45
50
55
%
1990 1995 2000 2005 2009
Total power generation
Thermal power plants
Figure 6: Efficiency of power generation and thermal power plants
Source: Enerdata
GW
0
5
10
15
20
25
Steam Gas turbines Combined cycles
1990 1995 2000 2005 2009
Figure 7: Thermal electricity capacity, by technology
The rate of T&D losses in the Argentinian grid has fallen from above 18 percent in 1990 to 13 percent in 2009, which is still above the world average.
Source: Enerdata
3
8
13
18
23
28
%
1990 1995 2000 2005 2009
Figure 8: Electric T&D losses
The average CO2 emission factor for power generation was 350 gCO2 / kWh in 2009, which is about 10 percent below its 1990 level. It has been increasing since 2002 and in 2009 was 35 percent higher than in 2002. The trend seen since 2002 is explained by the increasing shares of oil and gas in power generation, and by the correlative decline in the share of car-bon-free power generation (hydroelectricity and nuclear).
Source: Enerdata
200
250
300
350
400
450
gCO
2 /
kWh
1990 1995 2000 2005 2009
Figure 9: CO2 emission factor for power generation
5 Argentina | Country reports | Trends in global energy efficiency 2011
ArgentinaEnergy efficiency report
3. Industry3.1. Policies: an energy savings target of 5.4% by 2016The objective of the PRONUREE is to reach 5.4 percent energy savings in industry by 2016. To date, no specific measures have been implemented.
3.2. Energy consumption trends: a twofold increase between 1990 and 2009Industrial energy consumption doubled between 1990 and 2009, while the country’s total energy consumption increased only slightly (+15 percent). Industrial energy consumption did not decline in 2001 despite the national economic recession. Likewise, the global crisis appears not to have affected indus-try’s consumption in 2009.
Source: Enerdata
0
5
10
15
20
25
30
Mto
e
1990 1995 2000 2005 2009
Figure 10: Industrial energy consumption
The dominant fuel in industry is gas. Nevertheless, its con-sumption has decreased by 10 percent, reaching 37 percent in 2009. On the contrary, the use of oil increased from 13 percent in 1990 to 24 percent in 2009. The share of electricity is rather large and stable (22 percent). Coal accounts for just 6 percent of energy consumption.
The share of energy-intensive industries in the overall energy consumption of industry is quite low and has remained stable since 1995 (21 percent in 1995 compared with 22 percent in 1990). The steel industry’s share of energy consumption has increased slightly and now stands at 15 percent. The share of the paper industry is stable, and the share of the non-metallic minerals sector (cement, ceramics, etc.) has decreased slight-ly, accounting for 8 percent of total energy consumption in 2008.
Source: Enerdata
0%
10%
20%
30%
40%
50%
60%
70%
80%
90%
100%
1990 2000 2005 2009
Biomass
Electricity
Gas
Oil
Coal/Lignite
Figure 11: Energy consumption of industry, by source
Source: Enerdata
0%
10%
20%
30%
40%
50%
60%
70%
80%
90%
100%
1990 2000 2005 2008
Other
Paper
Non metallic minerals
Steel
Figure 12: Energy consumption of industry, by branch
Copyright notices
“Trends in global energy efficiency 2011” is based on data and information pro-vided by Enerdata and the Economist Intelligence Unit. The data and informa-tion is published with the consent of Enerdata and the Economist Intelligence Unit.
All information or data provided by Enerdata, in any form, is the property of En-erdata and is protected in each country by national laws governing intellectual property. All information or data provided by Enerdata is copyright protected, inclusive of material appearing in a hard copy format or electronically. Data pro-vided by Enerdata are based on compilation and analysis of the best sources in the industry. Enerdata has agreements with those providers to use and publish this data.
All pictures Copyright ABB