Embed Size (px)
Citation preview
SANDIA REPORT
arlg
.y. .. ... ... . . . . . .. .. .---‘<::a%~~~erque, New Mexico 87185 and Livermore, California 94550
Sandia is a multipt&j& Ffaboratory operated by Sandia Corporation,a Lockheed &@$$@-rnpany, for the United States Department ofEnergy und,&&#ra& DE-AC04-94AL85000.
. .....,:’,.:”‘:.., ..:.,’
‘ge Control forSystems
RECEIVED
~ Sandia National Laboratories
Issued by Sandia National Labomtories, operatedfor theUnited StatesDepart-meritof Energyby Sandia Corporation.
NOTICE: This reportwas preparedas an account of work sponsored by an agency of theUnited StatesOovemment. Neitherthe United StatesGovem-ment, nor any agency thereo~nor any of their employees, nor any of their contmctom, subcontractors, or their employees,make any warmnty, express or implied, or assume any legal liability or responsibility for theaccuracy, completeness, or usefulness of any information, apparatus, product, or processdisclosed, or represent that its use would not inhinge privately owned rights. Referenceherein to any specific commercial. product, process, or service by trade name, trade-manufacturer, or otherwise, does not necessarily constitute or imply its endorsement,recommendation, or favoring by the United StatesGovernment, any agency thereof, or anyof their contractors or subcontmctors. The views and opinions expressed herein do notnecessarily state or reflect those of the United States Government, any agency thereo~ orany of their contractors,
Printed in the United Statesof America. This report has been reproduced directly ffom thebest available copy.
Available to DOE and DOE contractorsfromOffice of Scientific and Techuical InformationP.O. BOX 62
Oak Ridge, TN 37831
Prices available from (703) 605-6000Web site: http://www.ntis.gov/ordering.htm
Available to the public ii-emNational Technical Information ServiceU.S. Departmentof Commerce5285 port Royal RdSpringfield, VA 22161
NTIS price codesPrinted copy: A04Microfiche copy AOI

DISCLAIMER
Portions of this document may be illegiblein electronic image products. Images areproduced from the best available originaldocument.
SAND99-0935Unlimited ReleasePrinted April 1999
System and Battery Charge Control forPV-powered AC Lighting Systems
Greg KernAscension Technology, Inc.4700 Sterling Drive, Suite E
Boulder, CO 80301
Abstract
This report reviews a number of issues specific to stand-alone AC lightingsystems. A review of AC lighting technology is presented, which discusses theadvantages and disadvantages of various lamps. The best lamps for small lightingsystems are compact fluorescent. The best lamps for intermediate-size systems arehigh- or low-pressure sodium. Specifications for battery charging and load controlare provided with the goal of achieving lamp lifetimes on the order of 16,000 to24,000 hours and battery lifetimes of 4 to 5 years. A rough estimate of thepotential domestic and global markets for stand-alone AC lighting systems ispresented. DC current injection tests were performed on high-pressure sodiumlamps and the test results are presented. Finally, a prototype system was designedand a prototype system controller (with battery charger and DC/AC inverter) wasdeveloped and built.
The work described in this report was performed for Sandia National Laboratories underContract No. BD-0005B.

Intentionally left blank.
ii
Acknowledgments
The author would like to thank the Energy Storage Systems Program at Sandia NationalLaboratories and the Department of Energy’s Office of Power Technologies forsponsoring this work.
Patent Pending
On November 20th, 1998, a patent application was filed with the United States Patent andTrademark Office. Some of the features detailed in the patent are described in this report.Therefore, public disclosure of this report is allowed after November 20th, 1998. Below isthe abstract of the patent application.
A system for delivering power to a battery and to a load includes a powersource that supplies energy to the battery and the load. l%e battery can becharged by the power source and used to supply energy or power to theload when the power source is unable to provide sufficient energy andpower to the load. The system reduces injection of DC current into theload and, as a result, extends the operation lfe of the load, particularly fthe load is an AC lighting or lamp system. The system operates the load inan optimal manner such that batte~ storage is maintained at nearfullcharge, yet the lighting load operates for a maximum number of how-s pernight. The beneftt of the system is to prevent early failure of either thelighting load or the battery.
.. .111

Intentionally left blank.
iv
Contents
1.
2.
3.
Application Requtiementi...........................................................................................................................1TheApplicationDefined.............................................................................................................................lSummaryof Lamp Technologies................................................................................................................2
A
Incandescent ................. ...... .......... ............ ............................. .... ................... ........................................... 3
Halogen ....... ................. ...... ....................................................... .. ............................................................3Compact Fluorescent .... ...... ...... .. ..................................................... .. ......................................................4Fluorescent .......... ......... ...... .......................... ........ ....................... ............................................................ 4
Mercury Vapor .... ................................................. ................................................................................... 4
Metal Halide ....................................................... .. ......... .................... .............................................. ........ 4
Low-pressure Sodium ......................... .......................... ...................... .............................................. ......5High-pressure Sodium ....................... .... .......................................................................................... ........5Simple Life-cycle Cost Analysis of Lamp Techologies ...................... ..................................................7
System Specifications ............................. .................................................... ..............................................lOSystem Design Day and System Sizing ....................................................... .............................. .... ...........-Battery Charging Requirements ............................................. ................... ................................................l.
Bulk Charging ......... .... .......................................................................... .......................................... ...... 11
Regulation Voltage Charging ................................................................ ................................................llFloat Voltage Charging.. ......... .................. .............................................. .................................. ............ 11
Constant-voltage Limited-current Charging ........................... ................. ............................ ...... ............l2High-power Input ............ ........................................................................ .................................. ............ 12
Temperature Compensation ........................ ............ ................. ............... .. ............................................l2Battery Technology Selection ................................. ....................... ............... .. .............. .... ........ ............l2
Load Control Requirements ................. ............................................................... ......................................l3Low-voltage Disconnect ....................................... ................... .......... ............. ............ .. ........................l3Soft Stafi .......................................................... .. .............................................. ......................................l3Open Lamp Detect and Shutdown ..................... ............................... ............... .......... ........ .............. ......l3Automatic Load Control .................................. ............................... ........................................... ............ 14
Standards .................... ......................................... ..................................... ........... ......................................l4Definition of User Needs ...................... .................................................... ........... ...................................... 15
Gaps in Existing Technology ............... .... ........... ................................... .. ........... ..................................... . 15
Renewable Power Sources ............... ...... .................... .......................... ........................................ .........l5Batteries .... ........... ..... .................. ...... .................................................. .. ................................................. 15
Lighting Hardware ....... .............. .............. .................. ........................................................................... 15
AC Lighting System Controls ............................................... ................. ...............................................Proposed System Design ........ ........ ................................ ........... ................................................................ . .
Features of the Charge Controller .............................. ........... ................. ...................................... ......... 16
Features of the Load Controller .................................. ........... ....................................................... .........l7Features of the DC/AC Invefier .......................................... .. .... ............................................................l7Common Features of the Integrated Controller ........................... ......................................................... . 17
Drawbacks of This Approach ...................................................... ..........................................................18A Prototype Con&oiler ............................................. ....................... .. ........................................................l8
Features of the Battery Charger ...................... ...... ......................... ............... .......................... ............... 19
Features of the DC/AC Inverter .......... ................. ............................. ........... ........................ .. .. .... ...... ...l9How the Proposed System Addresses the Gaps in Technology ............ ........... ...... ........ ............ ...... .. .......2O
Reliabili~ ................................... ........... ......... ............... .................... ......... ...........................................2OCost—Level of Product Integration .............................. ............................. .. ........................ .. .............. .20
Potential Buyers .......................... ...... ....................... ......... .................... ......... .. .........................................2OWhy Install Stand-alone AC Lighting Systems vs. Other Lighting Systems? ................................. .........20Market Potential Estimate ........... .... .. .................................................... ......... ............................ ...............2lProof of Concept Testing .... ........ ............................. ......... .................. ........... ............................ ...............23Failure Mode Testing of AC Lamps .............. ......... ........................................ ...........................................23
The Failure Mode..................................................................................................................................z3
v
Test 2 ........................................... ...... .............. .......................... ................... ........... ..................................25Can Conclusions be Drawn from these Tests? .......................... ................................................................26
4. Conclusions ....... .................................. ...... .......................... ................. ............................ .........................275. References ......... .............................................................. ................................ ............. .............................29
FiguresFigure 1. Incandescent lamp ....................................................... .......................... ................. ..........................3Figure 2. Halogen lmp . ...... .................................................................................. .......................... .................3Figure 3. Compact fluorescent lamp. ................................................................................. ..............................4Figure 4. Mercury vapor lamp ....................................................... ................... ............... ................................4Figure 5. Metal halide lamp. ................................. ........................ .. ............... ........... ...... ................................5Figure 6. High-pressure sodium lamp. .......... ...... .......................... .............................. ...................... ..............5Figure 7. GE HPS lamp lifetties . ..... ............ ...................... ..................... .. ......... ............................ ................6Figure 8. GE HPS lamp efficiencies. .................................................................. ................. ......... ..................6Figure 9. Case A comparison of lamp technologies’ life-cycle costs ........................... ................. ..................8Figure 10. Case B comparison of lamp technologies’ life-cycle costs . .................. ...... ...................... .............8Figure 11. Cost comparison groupings for Cases A mdB ......... ................. ......... ................. .. ........... .............9Figure 12. Proposed system design. ..................................................................... ................. ........................l6Figure 13. Prototype controller. ............................................................ .......................... ..............................l8Figure 14. System controller. ................ ............................................ ............. .. ............... ......... ........... ..........l9Figure 15. Test circuit. .................... ........ .. .......... ........................................... .......................... .....................24Figure 16. Lamps 6 and 9 during Test 2 .............. .............. ...... ............................ ..........................................26
TablesTable 1. Summary of Lamp Technologies [22] .... ............................ ............. ....... .. ............... ........... ...............2Table 2. AC PV Lighting System Life-cycle Cost Assumptions ...................................... ..............................7
Table 3. Example Battery Charging and Load Control Set Points for 12-V Batteries at 25°C ..................... 13Table 4. Estimate of Market Potential ................................................... ......... .......................... .....................22Table 5. Test 1 Results .............. .............. ............ .. ............................................................... .........................24Table 6. Test 2 Results ..... ............... ...................................... ................... ......... ............................................25
AC
CF
CRI
CVLC
DC
F
HAL
HALT
HID
HPS
I
K
LED
LPS
LVD
LIW
MH
MPT
MTBF
MV
Pv
PWM
.
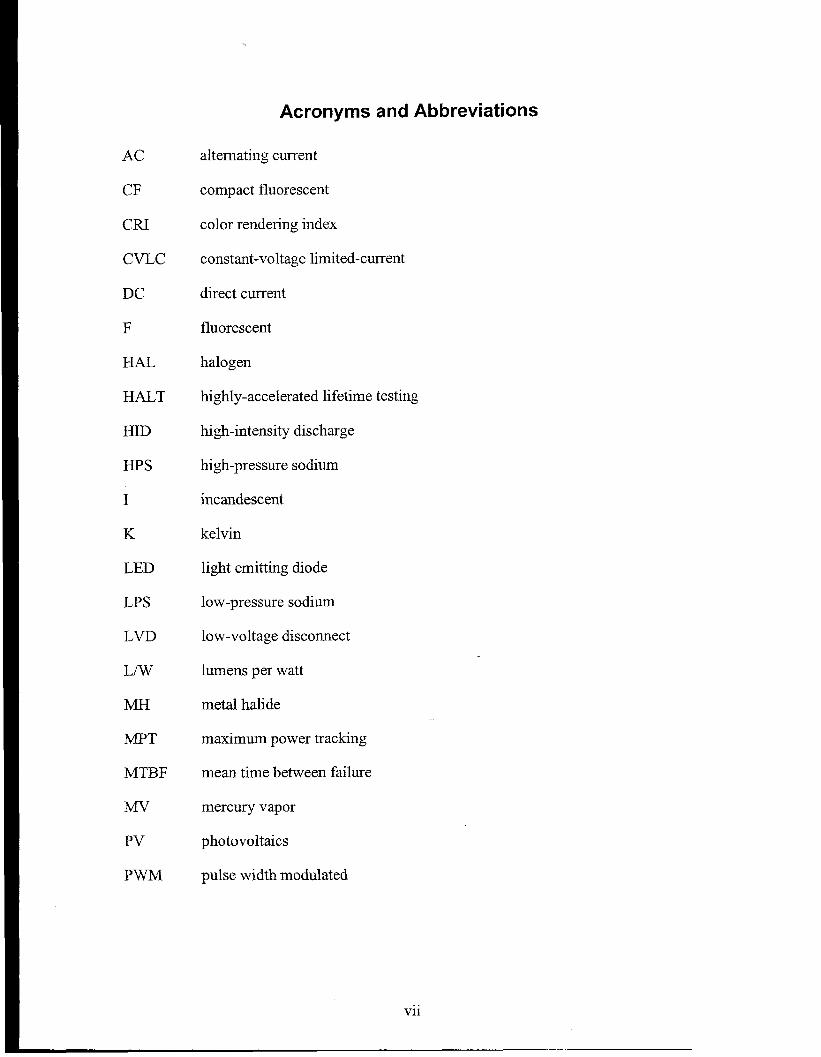
Acronyms and Abbreviations
alternating current
compact fluorescent
color rendering index
constant-voltage limited-cun-ent
direct current
fluorescent
halogen
highly-accelerated lifetime testing
high-intensity discharge
high-pressure sodium
incandescent
kelvin
light emitting diode
low-pressure sodium
low-voltage disconnect
lumens per watt
metal halide
maximum power tracking
mean time between failure
mercury vapor
photovoltaics
pulse width modulated
vii
Intentionally left blank.
.. .Vm
Executive Summary
This report reviews a number of issues specific to stand-alone AC lighting systems.Photovoltaics (PV) can be the power source for such systems. It is also possible to powersuch lighting systems using small wind turbines. A review of AC lighting technology ispresented. The pros and cons of various lamps are discussed, the best of which arecompact-fluorescent for small lighting systems and high-pressure sodium or low-pressuresodium for intermediate-size systems.
Specifications for both the PV and wind generated battery charging and load controls arepresented. Some of the specifications are directed towards achieving the maximumbattery and light fixture lifetimes. Lamp lifetimes on the order of 16,000 to 24,000 hoursshould be achievable, which corresponds to 5 to 10 years between lamp replacements. Itis also a goal to achieve battery lifetimes up to 4 to 5 years, in line with manufacturerspecifications.
The application requirements of intermediate-size (35 to 100 W) lighting systems arepresented. Some estimates of market potential are made, with the world market predictedto be as large as $2 billion per year, but it is understood that there maybe significanterrors in the market estimates.
Test results of DC current injected into 70-W high-pressure sodium lamp fixtures arepresented. Further testing is needed to reach broad conclusions, but our estimate is that ifthe DC/AC inverter injects less than a 0.56% DC to AC voltage ratio into this fixture, weshould expect to achieve operation to 16,000 hours.
ix
Finally, a prototype system controller with a battery charger and DC/AC inverter hasbeen built. Ascension Technology intends to continue developing this controllerspecifically for use in intermediate-size stand-alone AC lighting systems.

Intentionally left blank.
x
1. Application Requirements
The Application Defined
The application that is targeted for this study is for intermediate-size (35-to 1OO-W)ACarea lighting systems that are powered from a renewable resource such as photovoltaics(PV) or a small wind turbine. Because the power source and lighting loads are notcoincident, some form of energy storage is required, in this case battery storage.
These systems are typically stand-alone; they are not connected to any other source ofpower. Such systems are needed in remote locations where getting a source of power canbean expensive proposition. Such sites exist both in developed and undevelopedcountries for outdoor area lighting. In the United States, electric utilities are oftenexpected or asked to provide area lighting.
Area lighting may be used to light a dark crossroads out in the country, or to providelighting at a boat ramp so that at the end of the day, boaters can safely see to pull theirboat out of a lake. Rural fmers and landowners use area lighting to help deter theft orvandalism. A typical light used at many rural locations is a 70-W high-pressure sodiumlamp. Area lighting systems may be used to light the streets in villages or a town squarefor small villages without access to power.
Area lighting systems can also be used to supplement security lighting systems, such asfence perimeters. These systems each have their own power supply and battery backupand can operate without the main power source. Area lighting provides orientation anddirection finding capability in the dark but is not always sufficient for specific task work.
Area lighting is distinct from street lighting requirements, particularly in the U.S. Streetlights in the U.S. typically start at 100 W and get larger. A common street light size in aresidential neighborhood in Colorado is 100 or 250 W. Traffic lighting and railroadcrossing power requirements in the U.S. are large compared to area lighting systems, withpower requirements in the hundreds of watts to kilowatts. Billboard lighting systems arealso considered large lighting systems.
Standard billboards across the United States use 400-W Halophane light fixtures. Anormal billboard uses from two to eight such fixtures, for a total load of 800 to 3200 W.The amount of billboard lighting needed depends upon the amount of ambient light in thearea. Because one of the purposes of a billboard is to catch a viewer’s attention, it needsto be brighter than ambient. Because of these reasons, the best locations for PV-poweredbillboards tend to be remote locations, where AC power is not available and ambientlighting is low or non-existent.
PV has not sufficiently penetrated these large-load markets because the cost of PV topower such large loads is considered prohibitively high. The cost of PV lighting systemsis directly related to the power rating and energy consumption of the lighting loads.
On the other end of the spectrum, hardware is readily available for small PV lightingsystems. Systems as small as a few watts are used for pathway lighting and can be found
in hardware stores. Most distributors of PV lighting equipment sell lights with integralDC ballasts for these lower-power applications. However, these small lighting systemsoften do not produce enough light to provide outdoor area lighting for all applications.
For the purpose of defining system size, systems with lighting loads less than 35 W areconsidered small systems, and can typically be powered by off-the-shelf DC equipment.Systems with lighting loads greater than 100 W are considered large lighting systems.Reliable, rugged equipment is not readily available for intermediate-sized lightingsystems (35 to 100 W).
Summary of Lamp Technologies
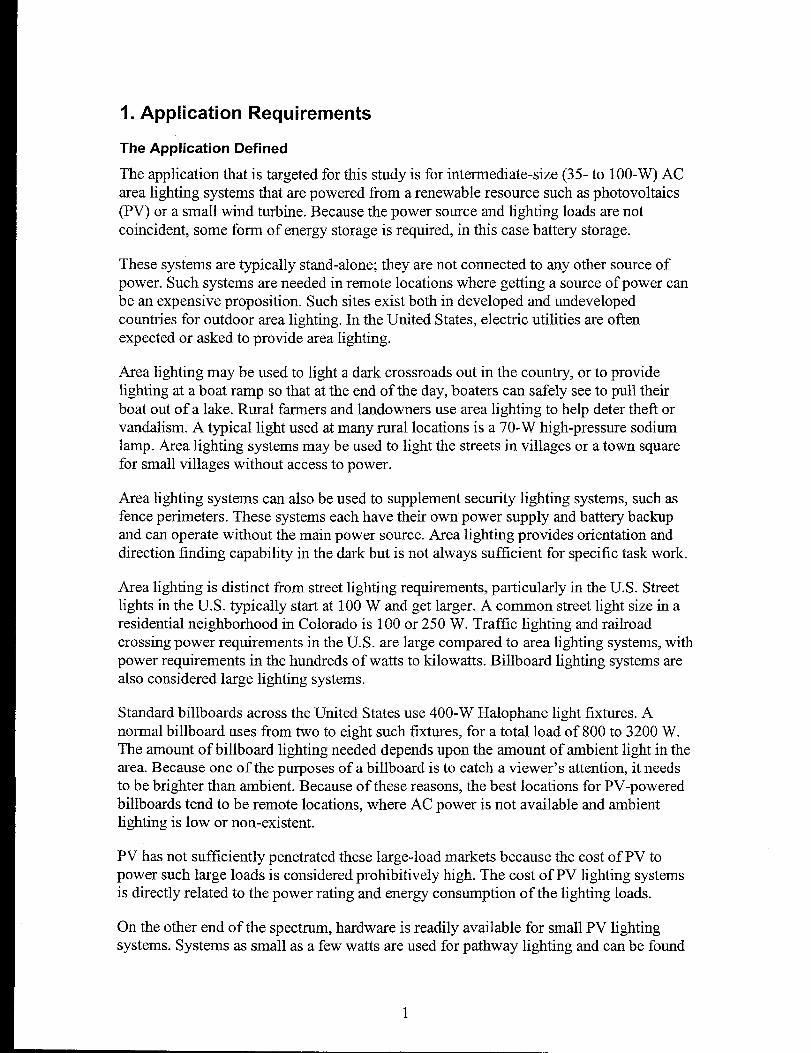
Table 1 lists the lamp technologies that were investigated in the 35-to 100-W powerrange. Some lamps above and below that range were also investigated.
The color rendering index (CRI) is a measure of the ability of a light source to representcolors in objects. It is a scale fi-om Oto 100. A CRI of 100 has the rendering capabilities
of incandescent light (for sources below 5000°K) or “daylight” for sources above5000”K). The most common measure of lamp efficiency is lumens per watt (L/W).Lumens is a measure of the light output of the lamp.
Table 1. Summary of Lamp Technologies [22]
Technology CRI Efficiency Lifetime Power(L/W) (hours) Rating
(wIncandescent 100 4 to 25 75 to 8760 3 to 1500Halogen 100 loto25 1,000 to 4000 15 to 750Com~act Fluorescent 75 to 82 48 to 86 7000 to 20.000 5 to 50Fluorescent 51t095 34 to 104 6000 to 24,000 4t0215Mercury Vapor 20 to 50 18t063 12,000 to 24,000 50 to 1000Metal Halide 65 to 85 59 to 125 3000 to 20,000 39 to 1800Low-pressure Sodium o 100 to 183 14,000 to 18,000 18to 180High-pressure Sodium 20 to 85 35 to 150 10,000 to 24,000 35 to 1000
Incandescent
Incandescent (I) lamps (see Figure 1) are common for indoor household use and arerather inexpensive. It is well known that incandescent lamps are not very efficient.Incandescent lamps turn on instantly when power is applied. Incandescent lamps providea “warm” color rendition. As an example, a series of lamps used for street lightingapplications was found [23]. In this series, the lamps ranged from 92 to 448 W at120/125 V. The initial lamp output ranged fi-om 1000 to 6000 L. The lamp efficiencyranged from 9.5 to 14.8 L/W. The rated lamp lifetimes were 3000, 6000, and12,000 hours.
Figure 1. Incandescent lamp.
Lamps with longer lifetimes had lower efficiency. The lamps with higher power outputhad higher efficiency. An example is a GE 105A23/12/125V lamp, rated for 125 V,1000 L, 105 W, 9.5 L/W, 12,000 hour lifetime, A-23 style lamp.
Halogen
Halogen (HAL) lamps (see Figure 2) are also common in household and outdoor lightingapplications. They are somewhat more expensive and not very good in efficiency.Halogen lamps provide a white-light color rendition, but in most other respects aresimilar to incandescent lamps.
Figure 2. Halogen lamp.
3
Compact Fluorescent
Compact fluorescent (CF) lamps are only available in small sizes. These units require aballast to drive the lamp from the power source. The ballast is found either in the lampbase for socket mounting or maybe separate. CF lamps found in hardware storestypically come with AC ballasts. DC ballasts maybe obtained from specialized PVsupply distributors.
Figure 3. Compact fluorescent lamp.
Fluorescent
Other fluorescent lamps are also available, and perform similarly to CF lamps.Fluorescent lamps require a ballast sized for each lamp type or combination of lamps.
Mercury Vapor
“Mercury vapor [MV] lamps, with their blue-green color and long life, are the preferredsource for landscape and sign lighting, and are also used in a broad range of streetlighting and industrial applications. Featuring very long lifetimes of over 24,000 hours,mercury vapor lamps have a CRI of up to 45 and efficacies ranging from 32 to 63 lumensper watt.” [22] MV lamps require a ballast sized for each lamp size.
Figure 4. Mercury vapor lamp.
Metal Halide
“Metal halide [(MH)] lamps, best known for the cool white light that so dramaticallyhighlights architecture, bridges and monuments, are also used in sports and streetlighting, and indoors in industrial, commercial and retail applications. They have the bestoverall color rendering properties (2-92 CRI) among HID [high-intensity discharge]lamps, and now MasterColorTM metal halide, Philips’ most recent technologicaladvancement, offer impressive color consistency improvements as well. In addition,Metal Halide lamps provide high efficacies of 80 to 125 lumens per watt and life
4
expectancies of 4500 to 20,000 hours.” [22] MH lamps are one of several types of HIDlamps. MH lamps also require a ballast sized specifically for each lamp type.
Figure 5. Metal halide lamp.
Low-pressure Sodium
Low-pressure sodium (LPS) lamps are the most efficient lighting source available whenmeasured in L/W. LPS lamps generate a monochromatic yellow light that does not givevery good color rendition, and which is considered objectionable by some people. LPSlamps have a CRI of O. Two typical lamp sizes are 18 W and 35 W, rated at 1800 and4800 L, respectively. LPS lamps are not HID lamps.
High-pressure Sodium
High-pressure sodium (HPS) lamps (see Figure 6) %-ea form of HID lamp. Ballasts forHPS lamps must include a starting circuit that generates a high-voltage pulse to ignite thearc in the lamp. When the lamp is operating, it presents a low impedance to the ballast,and the lamp operates at 52, 55, or 100 V nominal, depending upon its rating.
“High pressure sodium lamps offer average life expectancies of 24,000 hours andoutstanding efficacies of 40 to 140 lumens per watt. Originally associated with a poorCFU of 22, HPS lamps now have color rendering indices as high as 85 and include lampswith features designed for enhanced energy savings, visual comfort and instant restrike instreet, outdoor, industrial, security, retail and office lighting applications.” [22]
Figure 6. High-pressure sodium lamp.
5
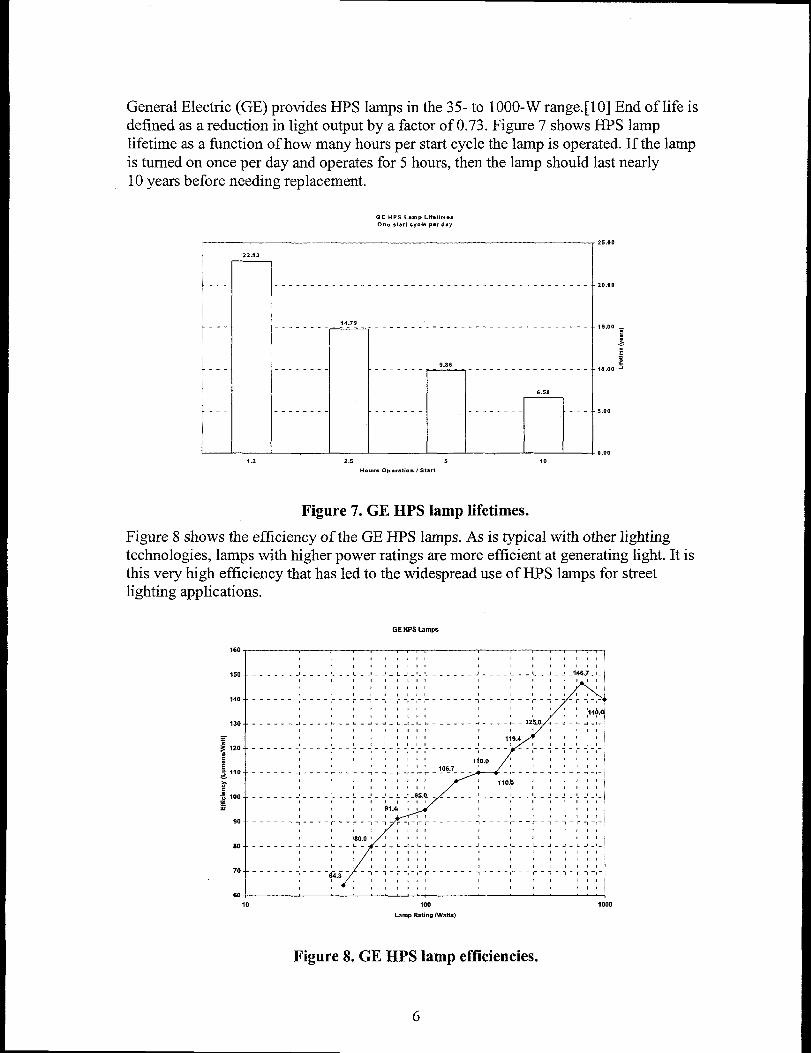
General Electric (GE) provides HPS lamps in the 35-to 1000-W range.[1 O] End of life isdefined as a reduction in light output by a factor of 0.73. Figure 7 shows HPS lamplifetime as a function of how many hours per start cycle the lamp is operated. If the lampis turned on once per day and operates for 5 hours, then the lamp should last nearly10 years before needing replacement,
GE HPS LamP Llfet,me,One ,tart oyol. P., dey
.-
22.83
.- ---- . . . ---- . . . . . . . . ---- ---- . . . . ---- .
1.2
--
----- .
14.79-
2.5
-. . . . . . . . . . . . . . . . . . .
9.86.- -. ---- . . . . -.
6.58
-- . . . . . .
5 10
Ho”., 00.,.$ [.” 1 Start
25.00
20.00
15.00 =
;_.
?:
10.00 ~
5.00
0.00
Figure 7,,GE HPS lamp lifetimes.
Figure 8 shows the efficiency of the GE HI% lamps. As is typical with other lightingtechnologies, lamps with higher power ratings are more efficient at generating light. It isthis very high efficiency that has led to the widespread use of HPS lamps for streetlighting applications.
GE IIPSLamps
‘“[140 ------
,,, ,,, ,!
,,, ,, ,,,
,,, ,,, ,,___
-, ----,---!-- -1--!,,-,!- ----.— -
!,, ,, ,,
A,,, , ,:!,, ,, ,
-- ! ---,---,---, ---,--, -,-
,, !,,
,14, ,. . .-
,, !- -! -,-,!(!!
,! 1,!
.- .-..-,-
,, ),!
,,, ,,.,.<-,--,-,-;
,!, !,,
!, !,,:,! !,,’
,-7-r m-,-rrrr,
+ Y’,W3.o,f,,l, ,,, ,,, !
80 -------I----8---L- - J - L -1- 8----------- --’--- ~- J- J-. ~-,-,, !,,, ,, ,!, ,!! ,
60 j
10 100 1000
l-amp Rating Walt5)
Figure 8. GE HPS lamp efficiencies.
6
A Simple Life-cycle Cost Analysis of Lamp Technologies
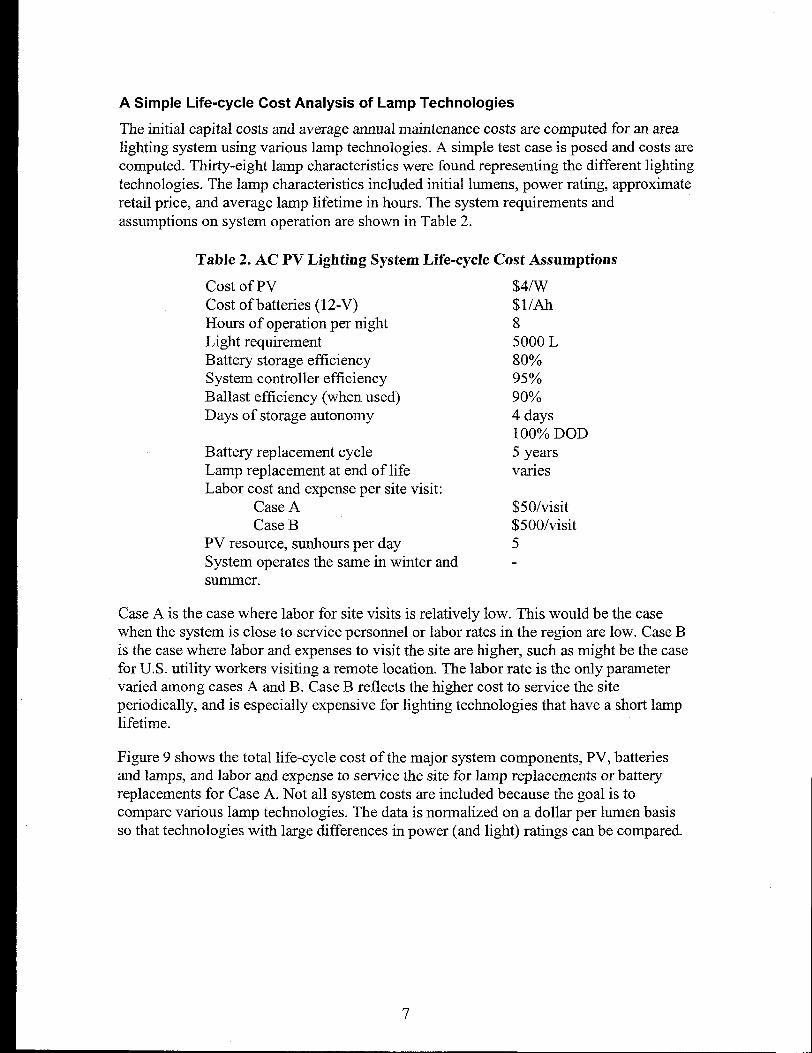
The initial capital costs and average annual maintenance costs are computed for an arealighting system using various lamp technologies. A simple test case is posed and costs arecomputed. Thirty-eight lamp characteristics were found representing the different lightingtechnologies. The lamp characteristics included initial lumens, power rating, approximateretail price, and average lamp lifetime in hours. The system requirements andassumptions on system operation are shown in Table 2.
Table 2. AC PV Lighting System Life-cycle Cost Assumptions
cost of PvCost of batteries (12-V)Hours of operation per nightLight requirementBatte~ storage efficiencySystem controller efficiencyBallast efficiency (when used)Days of storage autonomy
Battery replacement cycleLamp replacement at end of lifeLabor cost and expense per site visit:
Case ACase B
PV resource, sunhours per daySystem operates the same in winter andsummer.
$4/W$1/Ah85000L80%957(090’%04 days100’XODOD5 yearsvanes
$50/visit$5001visit5
Case A is the case where labor for site visits is relatively low. This would be the casewhen the system is close to service personnel or labor rates in the region are low. Case Bis the case where labor and expenses to visit the site are higher, such as might be the casefor U.S. utility workers visiting a remote location. The labor rate is the only parametervaried among cases A and B. Case B reflects the higher cost to service the siteperiodically, and is especially expensive for lighting technologies that have a short lamplifetime.
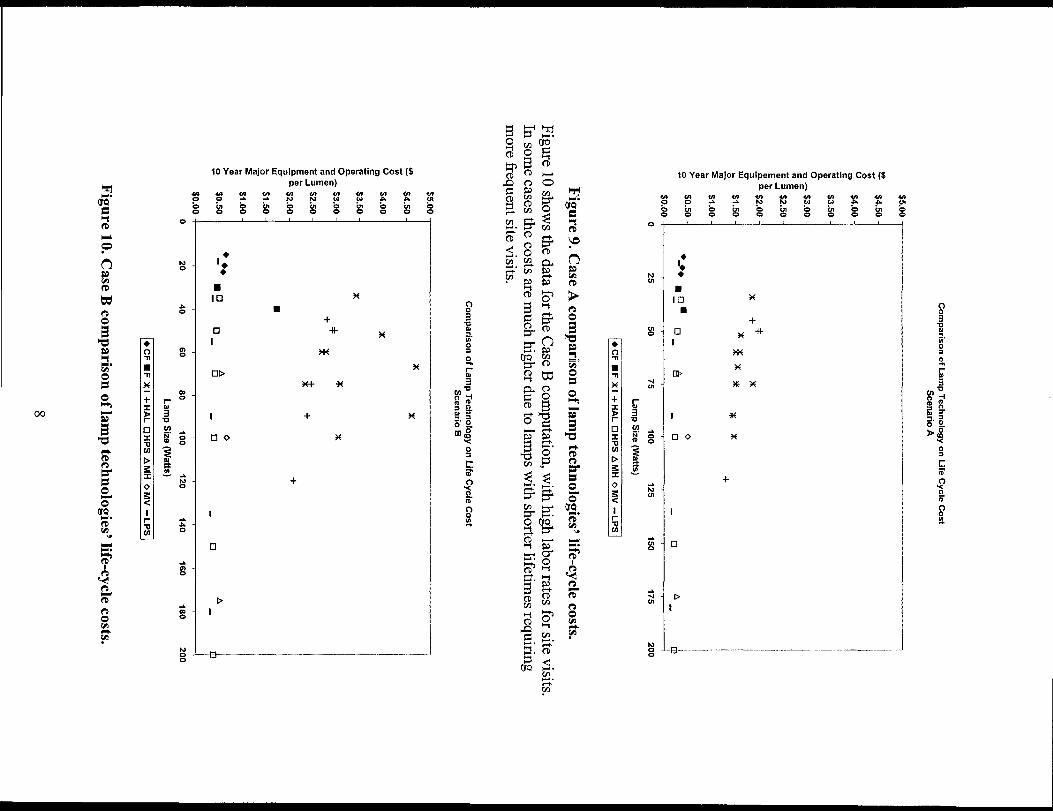
Figure 9 shows the total life-cycle cost of the major system components, PV, batteriesand lamps, and labor and expense to service the site for lamp replacements or batte~replacements for Case A. Not all system costs are included because the goal is tocompare various lamp technologies. The data is normalized on a dollar per lumen basisso that technologies with large differences in power (and light) ratings can be compared.
7
.-
m
10 Year Major Equipment and OperatingCost ($per Lumen)
❑
1
❑ lb
1
❑ o
+
I
❑
–+----- “-----
10 Year Major Equipment and Operating Cost ($
per Lumen)
{
■
In9
❑
I
UP
1
❑ O
I
❑
b
El .-------..- ””- -—.-–- --- ““”--””-” ------ ---- –--——---
.
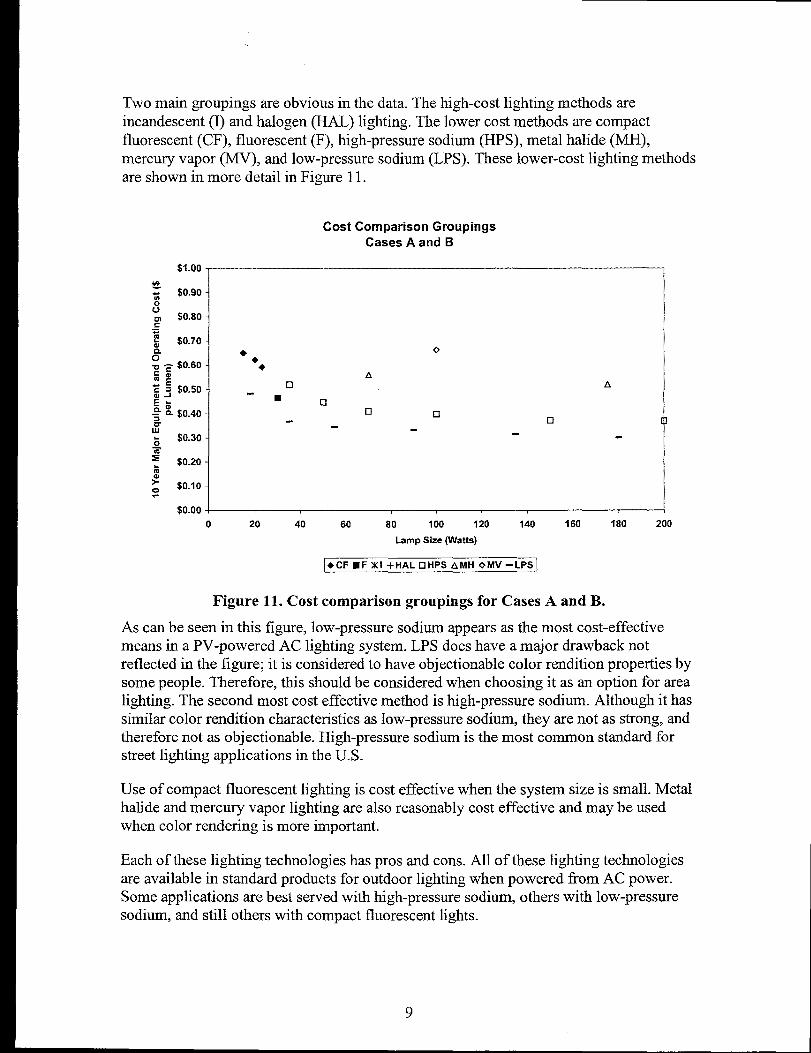
Two main groupings are obvious in the data. The high-cost lighting methods areincandescent (I) and halogen (HAL) lighting. The lower cost methods are compactfluorescent (CF), fluorescent (F), high-pressure sodium (HPS), metal halide (MH),mercury vapor (NIV), and low-pressure sodium (LPS). These lower-cost lighting methodsare shown in more detail in Figure 11.
Cost Comparison GroupingsCases A and B
$1.00 ,
0
0 20 40 60 80 100 120 140 160 180 200
Lamp Size (Watts)
A
❑
● CFm FXl +HAL13HPSAMH oMV-LPS
Figure 11. Cost comparison groupings for Cases A and B.
As can be seen in this figure, low-pressure sodium appears as the most cost-effectivemeans in a PV-powered AC lighting system. LPS does have a major drawback notreflected in the figure; it is considered to have objectionable color rendition properties bysome people. Therefore, this should be considered when choosing it as an option for arealighting. The second most cost effective method is high-pressure sodium. Although it hassimihr color rendition characteristics as low-pressure sodium, they are not as strong, andtherefore not as objectionable. High-pressure sodium is the most common standard forstreet lighting applications in the U. S.
Use of compact fluorescent lighting is cost effective when the system size is small. Metalhalide and mercury vapor lighting are also reasonably cost effective and may be usedwhen color rendering is more important.
Each of these lighting technologies has pros and cons. All of these lighting technologiesare available in standard products for outdoor lighting when powered from AC power.Some applications are best served with high-pressure sodium, others with low-pressuresodium, and still others with compact fluorescent lights.
9
System Specifications
A PV-powered AC lighting system should have the following features:
● Capable of utilizing any AC lighting technology, ultimately giving the customerthe greatest choice in quality of lighting.
. Designed and produced well enough to achieve the limits of technology in termsof performance and reliability. Systems that are not properly designed and testedprior to market introduction do not serve the industry’s long term interests. Once asystem is properly installed and operational, system failures should be limited tolamps reaching fill end of life and maintenance and replacement of batteries attheir design lifetime.
. An indication of the expected lamp and battery replacement cycle and procedures.A maintenance log provided with each system would help the operator to keeptrack of when battery and lamp replacement is due.
. Good aesthetics—aesthetics of the system are important to some customers. Inthese cases it is important to provide a well-integrated system.
System Design Day and System Sizing
Most locations have different solar resources from winter to summer months. Systemsizing and orientation depend upon the energy usage required of the load at differenttimes of year. In North America, systems that have constant load requirementsthroughout the year will typically have a system “design day” in a winter month.
A system designed for use at a recreational area that is only open from spring to fall mayhave a design day in April or October. Such a system, which is not required to operate inthe winter, still needs to maintain battery health during that time even if the load isswitched off.
● If the system will have loads that are switched off or not operating for longperiods of time, then the charge controller part of the system should include floatvoltage operation to prevent excessive overcharging of the batteries. A three-stage(bulk, regulation, and float) charge controller will accomplish that. [20]
. If the system is expected to operate continuously throughout the year, then a two-stage (bulk and regulation) battery charger may be acceptable.
● If the system will have periods of time when the PV (or wind) resource will beinsufficient to operate the load for a fixed number of hours per night, then the loadcontrol part of the system should be capable of “automatic load operation.” Inautomatic operation, the load’s hours of operation are reduced automatically toprevent excessive deep discharge of the batteries.
10
Battery Charging Requirements
The requirements below apply to the charging of batteries from PV for standaloneapplications. These requirements may or may not apply to other applications.
Bulk Charging
Bulk charging is the first phase of charging a battery, where the battery voltage is lowerthan the regulation voltage set point. Typically, the maximum power available from thePV is less than the maximum amount of power the battery can accept, so maximumpower tracking (MPT) is possible during this phase of charging. If the PV and battery arewell matched with respect to the maximum power point voltage during charging, then amaximum power point controller provides minimal added benefit. The temperaturecoefficients of both the battery and PV should be accounted for to ensure the best matchfor the specific conditions of the system’s design day. Other benefits of MPT are asfollows:
. MPT of the input power source allows less exact matching of the power sourcevoltage characteristics to the battery characteristics.
● MPT can reduce the power source’s size requirement due to gains in bulkcharging efficiency for the design day.
Regulation Voltage Charging
During regulation voltage charging, as long as power is available from the power source,battery voltage is held at a fixed regulation voltage set point. The voltage regulation setpoint should be temperature compensated based on battery temperature and chemistry,otherwise, over or undercharging of the battery will occur resulting in shorter batterylifetime. When selecting a charge controller, the following items should be considered:
●
●
●
On/off charge controllers achieve voltage regulation by using two set points,disconnect and reconnect.
Constant voltage pulse width modulated (PWIvf) charge controllers are typicallyon/off charge controllers that operate at a higher frequency, usually 100 to500 Hz. The battery voltage averages to the regulation voltage set point.
Both ordoff and constant-voltage PWM charge controllers run the risk ofdamaging batteries and load-c&nected equipment if the battery bank develops ahigh resistance condition, as might occur in some lower quality batteries at end oflife. This condition may also occur if the charge controller continues to try tocharge the batteries when they have been disconnected and the controller keepsthe load connected. Open-circuit voltage of the power source must be preventedfrom being connected directly to the load in this fault condition, otherwisedamage to the load may occur due to the higher-than-normal voltage.
Float Voltage Charging
Three-stage charge controllers include float voltage operation. This is the same mode ofoperation as regulation voltage operation, except that the set point is lower. This preventsa fully charged battery from excessive overcharging.
11
“Proper@oat voltage minimizes positive grid corrosion. Long termji?oating ofa batte~ either below the recommendedjloat range (undercharging) or overthe recommendedjloat range (overcharging) [discharges the battery or]increases the positive grid corrosion and decreases llfe. “[l 6]
When selecting the proper set point, it is important to remember:
. The float voltage set point depends upon battery chemistry,
. The float voltage set point must also be temperature compensated as permanufacturer’s recommendations.
Constant-voltageLimited-current Charging
Constant-voltage limited-current (CVLC) charging provides the greatest control over thebattery charging process. CVLC charging is similar to constant-voltage PWM charging,but with the added ability to control the charging current fi-om zero to the maximumavaiIable charging current. This control is achieved by filtering the PWM output with aninductor and a capacitor, which creates a true DC/DC converter in the process. Feedbackof the output current is used to control charging current into the battery.
High-power Input
The battery charge controller must be able to handle over-imadiance conditions, or thesystem must be designed such that those conditions will never occur. Anecdotal stories ofcharge controllers that fail during operation in cold conditions with high (> 1100 W/m2)irradiance occur. Either enough design margin must be included in the charger design, ora means to prevent excessive battery charge current should be included.
Temperature Compensation
Adjustment of the regulation and float voltage set points must be included to prevent overor undercharging the battery. The slope of temperature compensation depends uponbattery chemistry (see Table 3).
Battery Technology Selection
The two most common battery technologies in use today in standalone PV systems areflooded lead-acid and sealed gel-type batteries. These two technologies have differentcharging set points, as shown in Table 3.
12
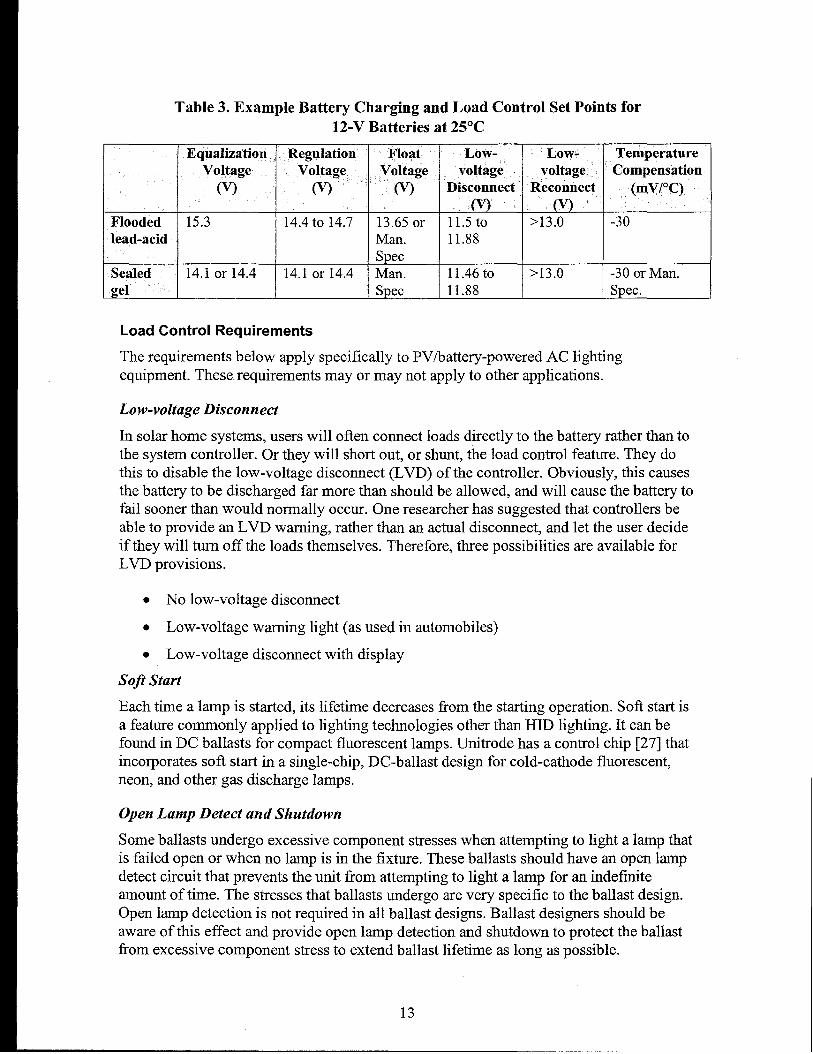
Table 3. Example Battery Charging and Load Control Set Points for12-V Batteries at 25°C
Equalization Regulation Float Low- Low- TemperatureVoltage Voltage Voltage voltage voltage Compensation
0’) (Y) (w Disconnect Reconnect (mV/”C)
Flooded 15.3 14.4to 14.7 13.65or 11.5to >13.() -30lead-acid Man. 11.88
SpecSealed 14.1or 14.4 14.1or 14.4 Man. 11.46to >13.() -30 or Man.
gel Spec 11.88 Spec.
Load Control Requirements
The requirements below apply specifically to PV/battery-powered AC lightingequipment. These requirements may or may not apply to other applications.
Low-voltage Disconnect
In solar home systems, users will often connect loads directly to the battery rather than tothe system controller. Or they will short out, or shunt, the load control feature. They dothis to disable the low-voltage disconnect (LVD) of the controller. Obviously, this causesthe battery to be discharged far more than should be allowed, and will cause the battery tofail sooner than would normally occur. One researcher has suggested that controllers beable to provide an LVD warning, rather than an actual disconnect, and let the user decideif they will turn off the loads themselves. Therefore, three possibilities are available forLVD provisions.
. No low-voltage disconnect
. Low-voltage warning light (as used in automobiles)
. Low-voltage disconnect with display
SOD Start
Each time a lamp is started, its lifetime decreases fi-om the starting operation. Soft start isa feature commonly applied to lighting technologies other than HID lighting. It can befound in DC ballasts for compact fluorescent lamps. Unitrode has a control chip [27] thatincorporates soft start in a single-chip, DC-ballast design for cold-cathode fluorescent,neon, and other gas discharge lamps.
Open Lamp Detect and Shutdown
Some ballasts undergo excessive component stresses when attempting to light a lamp thatis failed open or when no lamp is in the fixture. These ballasts should have an open lampdetect circuit that prevents the unit from attempting to light a lamp for an indefiniteamount of time. The stresses that ballasts undergo are very specific to the ballast design.Open lamp detection is not required in all ballast designs. Ballast designers should beaware of this effect and provide open lamp detection and shutdown to protect the ballastfrom excessive component stress to extend ballast lifetime as long as possible.
13
Automatic Load Control
See the section “Battery Charging Requirements,” above.
Standards
UL 1741 – Proposed First Edition of the Standard for Static Invertem and ChargeControllers for Use in Photovoltaic Power System. Although not commonly known orapplied, Underwriter’s Laboratories, Inc. does have a standard that applies to PV batterycharge controllers and inverters used in PV systems. UL is primarily concerned withproduct safety and fire prevention and generally does not address performance, meantime between failure (MTBF), or product reliability.
14
2. Definition of User Needs
Gaps in Existing Technology
The major components in self-powered AC lighting systems are listed below. In eachcase, a determination is made as to whether or not a gap in technology exists that islimiting implementation of these AC lighting systems.
Renewable Power Sources
PV and or small wind turbines maybe used to power self-powered AC lighting systems.If there is any gap at all in this area, it would be the relatively high cost of PV and windcompared to other means of providing power. This gap tends to limit the size of lightingsystems to small systems only. It is not the intent of this project to directly address thisissue. The cost of PV and wind power sources continues to decline, in good part due tothe support of the U.S. Department of Energy. As the costs of PV and wind generationdecline, the cost-effective size of AC lighting systems will increase. With present pricingof PV and wind, there is a sufficient market for small- and intermediate-size AC lightingsystems.
Batteries
Batteries are a very mature technology, but also are improving with time. Althoughbattery failures are a problem to be avoided in stand-alone systems, it is generally not thefault of the battery hardware, Sources of suitable quality batteries do not appear to be alimiting factor when implementing self-powered AC lighting systems.
Lighting Hardware
AC-powered lighting hardware is commonly available. It comes in a wide variety ofsizes, ratings, shapes, colors, technologies, and prices. It is available for service inindustrial, commercial, or residential locations. Architectural poles and fixtures are usedwhere appearance is important. AC lighting is manufactured in huge volumes relative tothe size of the PV industry, and constitutes a significant portion of the total energyconsumption in the U.S. It does not appear that there are any limiting factors in AClighting hardware when implementing self-powered AC lighting systems.
AC Lighting System Controls
AC lighting system controls must provide battery charging control and properly regulatedpower to the load. Although one could build a self-powered AC lighting system with off-the-shelf components today, such a system would have the following drawbacks:
. Low level of integration of the battery charger and inverter components for loadssized from 35 to 100 W.
. Low quality of inverters, leading to potential reliability problems. One inverterfound in a computer supply store, designed to operate from a 12-V battery, wasfound to have paper insulation between the power circuits and chassis. Thisinverter cost about $60 and could power up to 140 W continuous, but clearly itwould not survive long-term operation in a stand-alone AC lighting system.
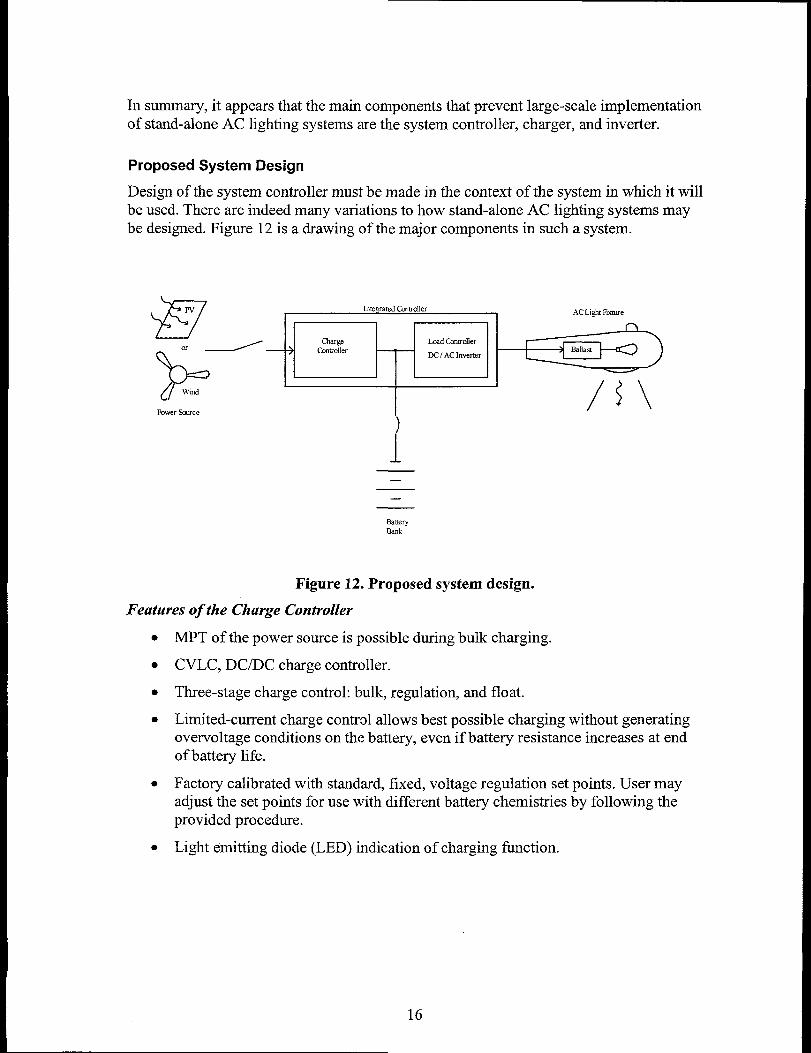
In summary, it appears that the main components that prevent large-scale implementationof stand-alone AC lighting systems are the system controller, charger, and inverter.
Proposed System Design
Design of the system controller must be made in the context of the system in which it willbe used. There are indeed many variations to how stand-alone AC lighting systems maybe designed. Figure 12 is a drawing of the major components in such a system.
Power kurce
In@gratedComollerI ACL@t Ftie
n(largeCcimoller
/’\
—
—
ELmryBank
Figure 12. Proposed system design.
Features of the Charge Controller
. MPT of the power source is possible during bulk charging.
. CVLC, DCIDC charge controller.
. Three-stage charge control: bulk, regulation, and float.
. Limited-current charge control allows best possible charging without generatingovervoltage conditions on the battery, even if battery resistance increases at endof battery life.
. Factory calibrated with standard, fixed, voltage regulation set points. User mayadjust the set points for use with different battery chemistries by following theprovided procedure.
. Light emitting diode (LED) indication of charging function.
16
Features of theLoad Controller
●
●
●
●
●
●
●
●
LED indications of LVD.
Factory-calibrated LVD.
Selection switch for setting hours of operation of the lighting load, including off,on 24 hours, and split evening/dawn operation.
Automatic/fixed hours of operation selection switch. In the automatic setting, theunit will modifi the battery’s selected hours of operation depending upon thebattery’s state of charge and the availability of power resources to prevent thebattery fi-om operating in a continuous low state of charge.
Continuous operation of AC loads up to 100 W, with a power factor as low as 0.4in ambient temperatures up to 60°C.
Means to prevent cycling of the LVD until battery charging resumes.
PV/wind selector switch. In the PV position, the PV is used to determine nightand day operation and the light does not need a light sensor to control itsoperation. In the wind position, the light must have a light sensor switch in theAC circuit. This sensor can be provided separately or is sometimes integrated intothe light fixture. The controller can intelligently determine sunrise and sunsetfrom operation of the load and the controller’s internal clock.
Simple TEST push-button switch to turn on the AC output for testing the light,even during the day.
Features of theDC/AC Inverter
. LED indication of AC power output.
. Non-isolated converter. No transformer, high or low frequency, is used in theinverter, allowing for a very compact size and efficient operation.
● Power stage uses surface-mounted components to achieve the highest possibleenergy density, hence a small, easy-to-produce, low-cost package.
. Designed to specifically prevent DC injection into the li~ting load.
● Designed to eliminate the need for electrolytic capacitors, a component that canimpact long term reliability.
Common Features of the Integrated Controller
. The charger, load control, and inverter are all controlled by the microprocessor.
● Full protection against reverse connection of either the power source or battery.Reverse protection of the load is not required because the load is AC.
. DesiWed for operation in harsh environments and for rugged, long-termoperation.
. Design MTBF greater than 10 years.
. Internal thermal protection.
17
. Operating temperature range 40 to +85”C, Oto 100% relative humidity.
. Crystal clock operation for keeping track of time of day and accurate 60-Hzinverter output frequency.
Drawbacks of This Approach
. The AC output does not have a grounded conductor as is typical in 120-V, line-neutral systems. If a grounded conductor must be provided in a particularinstallation, then an isolation transformer will need to be added to the system.Product labeling will be required to indicate that both AC output wires are liverelative to ground (60 V).
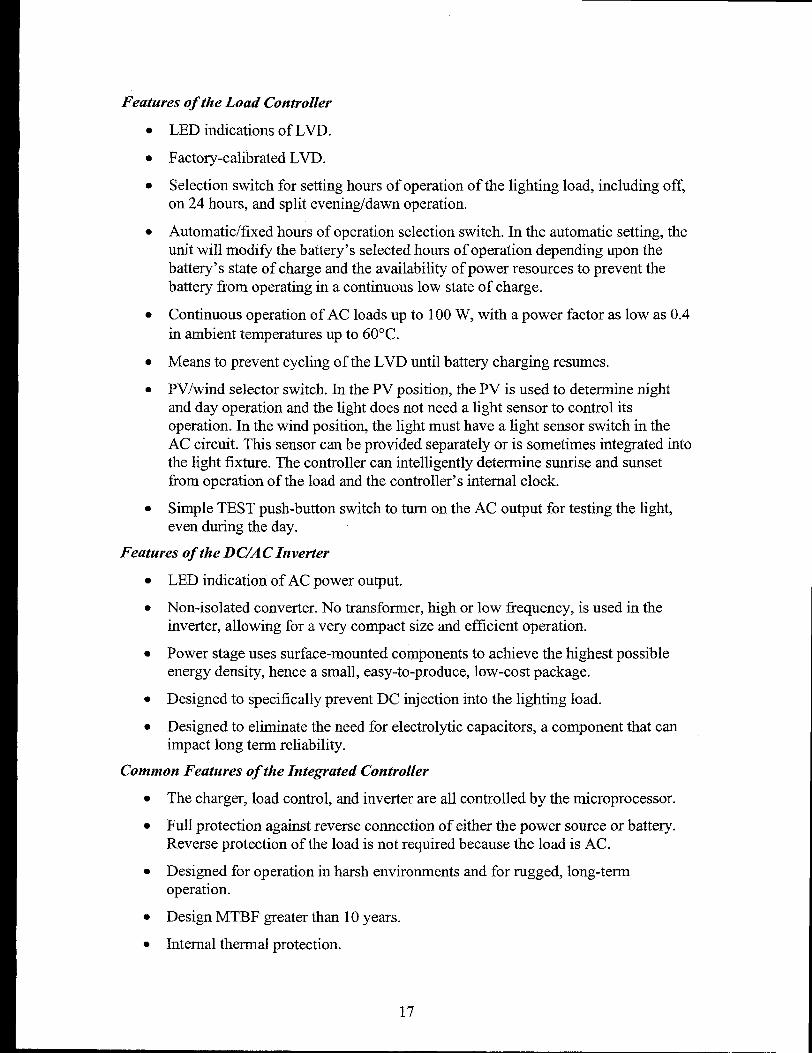
A Prototype Controller
Figure 13 shows a prototype of the system controller. One more revision of the designwill be made before beta units are sent out for testing. It is expected that the final unitwill be slightly smaller than the unit shown in the figure.
Figure 13. Prototype controller.
18
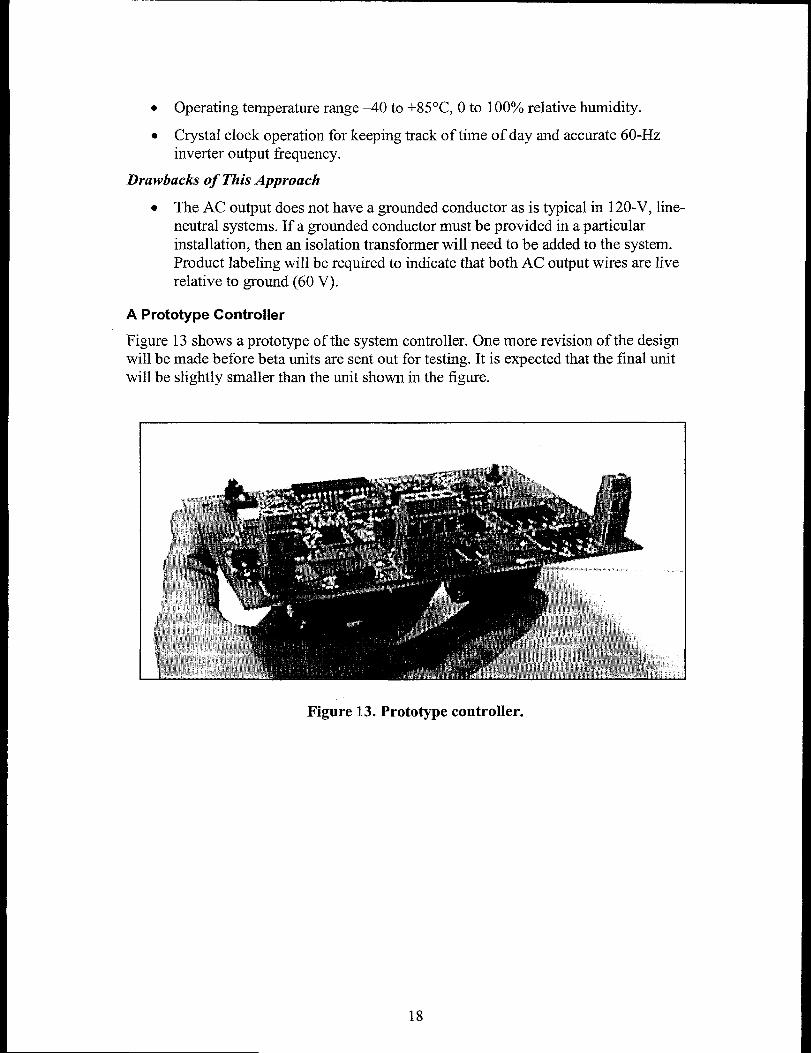
The final design of the controller will utilize surface-mounted components for compactdesign and lower-cost production. The controller above includes a dip switch for settingthe type of systems in which it is installed. The system controller’s appearance maybesimilar to that shown in Figure 14.
Stand-Alone AC Lighting ControllerCHARGING O LC-100
AC. ON c) Ascension Technology, Inc. TESTn
Flccded
u
cd - Bat&y TypeAutOmahc FKei - Nw13 of Operdcm
Wnd - %wer Scarce1;; 24V - Bamy Voltage
5tZ24Dusk(0 Dam4i208311~ 6
Calibration
nwVrq
u
Push to turn light onfor fO minute test
——— —-.X?Iw X ———————
Pv Constant-Voltage Batte~ Semi Square-wave AC Output
+. Limited-CurTent + . :::5 Non-isolated 120V60HZFiltered PWM
. . ..-
EI
● O
El
● O**
L1
● *
WARNING Both wireslive relative to GND
8
Figure 14. System controller.
Features of the Battery Charger
. Uses a true DC/DC 100-kHz PWM converter with output filtering to controlbattery charging current.
● Full protection against reverse connection of battery or power source.
. Three-stage charging profile
. Periodic equalization charging
Features of the DC/AC Inverter
●
●
●
●
Uses anon-isolated DC/DC 100-kHz PWM boost converter with a low-loss,60-Hz DC/AC inverter for shaping the output AC voltage.
A semi-square-wave output is generated that is sufficient for powering AClighting loads.
Continuous operation for lamps up to 100 W at 60”C ambient, short-term surgerating is higher (to be determined).
Designed to eliminate DC output, thereby preventing one of the potential failuremodes in AC lamps.
19
How the Proposed System Addresses the Gaps in Technology
Reliability
The product will be thoroughly tested before introduction to the market. This testing willinclude beta testing at selected independent sites across the U.S. Testing will also includehighly-accelerated lifetime testing (HALT) to ensure the design will meet the limits ofelectronic technology for performance and reliability.
The product will be protected against damage from moisture and other contaminants byusing conformal coating or by encapsulating the circuit. The method of protection has notbeen determined yet. Because they are the least reliable system component, electrolyticcapacitors will not be used in the design of the controller if possible.
The goal is to achieve a design with a MBTF greater than 10 years in field operation.Design for test is included in the design of the product to allow automated testing, bothpassive and active. All products shipped will be tested in the factory.
Cost—Level of Product Integration
This product is highly integrated for volume manufacture. There are no wires or cables orconnectors used in the internal components of the product. All assembly is accomplishedon a single circuit board. The charger and inverter share a single microcontroller.
Potential Buyers
Anyone who needs lighting in a remote location is a potential buyer. In the domesticmarket, electric utilities, local, state and federal government agencies, local communities,and property owners are some of the entities who would purchase systems for thefollowing applications: parks, beaches, recreation areas, campgrounds, and remote streetlighting. In the global market, electric utilities, local, state and federal governmentagencies, local communities, and property owners are some of the entities who mightpurchase systems for applications such as village lighting.
One customer who contacted Ascension Technology has an existing street lightingapplication for a village, but the diesel generator and electric distribution system has notbeen reliable enough to ensure operation of the lighting. They are considering using PVlighting to avoid the downtime caused by the diesel generator and distribution system.
Why Install Stand-alone AC Lighting Systems vs. Other Lighting Systems?
. Installation cost economics. The cost of extending power service exceeds that ofinstalling a stand-alone system.
. Desire for reliable operation, independent of an unreliable power grid.
. Desire to use clean renewable energy, rather than fossil fiels.
. Lack of electric power infrastructure.
20
Market Potential Estimate
Estimating the potential market size of stand-alone lighting systems is difficult. Part ofthe difficulty is that a stable market has not yet been developed; creation of the market isstill in its infancy. Many people have heard the anecdotal statement from IBM that thepotential worldwide market for computers was about four. We know how accurate thatearly prediction was.
In 1995, the U.S. spent about $37 billion annually in electricity to power lightingloads. [7] This was about one quarter of the total energy consumption of the nation. Ifonly 1YOof that were diverted to the purchase and maintenance of stand-alone lightingsystems, that would be $370 million per year domestically. Approximately 2 billionpeople worldwide are without electricity. If we assume the potential market is onelighting system per 1000 people per year, then the potential global market could be$2 billion per year.
There are approximately 416 National Parks, National Monuments, National HistoricSites, and National Recreation Areas. If we assume that these national locations represent10 percent of all the parks and recreation areas in the United States, then there would be4160 total such locations. If we assume that the average initial cost of a stand-alone AClighting system is $1000, and that each of these sites purchases an average of one systemper year, this would constitute $4.16 million annually. In 1990 there were 1.39 millionfarms in the United States. If we assume that 10’%oof those farms would purchase onestand-alone AC lighting system and would replace that system every 20 years, an annualmarket of $6.95 million per year would exist.
In the first nine months of 1998, Ascension Technology received inquiries for a total ofabout 2500 PV lighting systems. These customers were either told we were not preparedto provide systems at this time or are waiting for development of the stand-alone AClighting system product. If we assume that one out of every five inquiries results in asystem sale, and annualize the above inquiries, this would yield an immediate market of$670,000 annually.
Consequently, the short-term potential market is estimated to be between the hundreds ofthousands to tens of millions of dollars annually for stand-alone AC lighting systems.Clearly there are some major assumptions in the numbers above. Certainly the actualmarket size will depend upon the cost, availability, and financing of such systems.Hopefully, these estimates will establish some boundaries on the potential markets forstand-alone AC lighting systems.
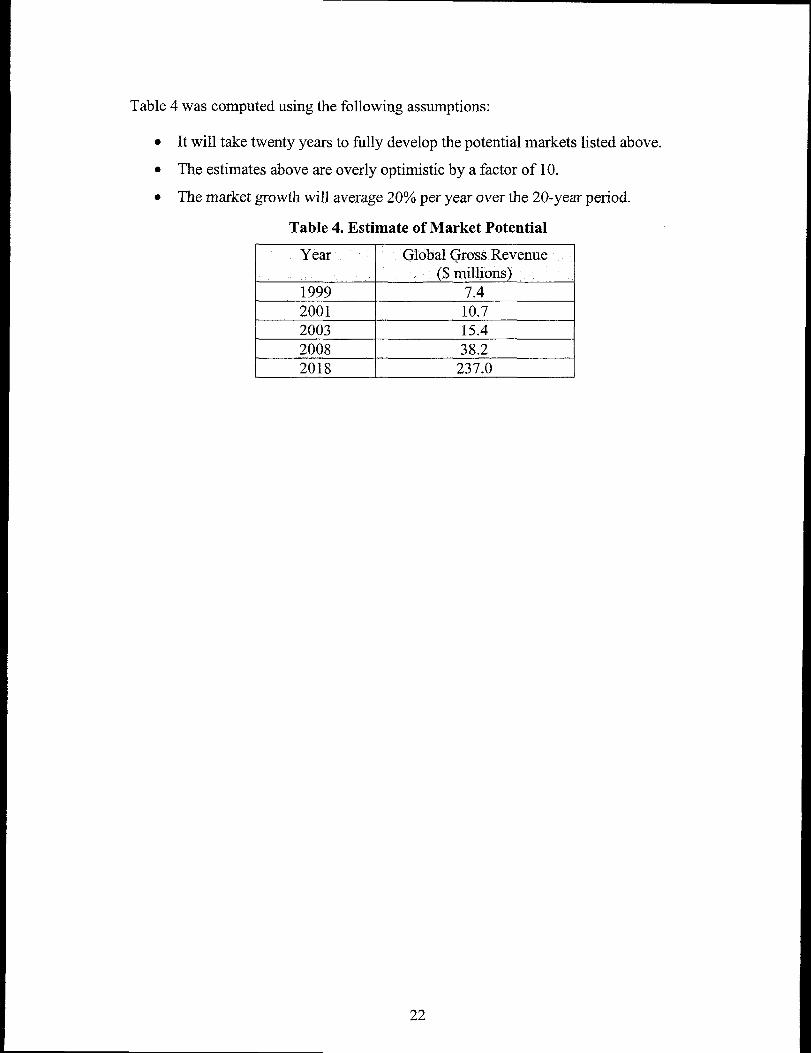
Table 4 was computed using the following assumptions:
. It will take twenty years to fully develop the potential markets listed above.
. The estimates above are overly optimistic by a factor of 10.
● The market growth will average 20% per year over the 20-year period.
Table 4. Estimate of Market Potential
~
1 2003 15.4
2008 38.2
1 2018 237.0
22
3. Proof of Concept Testing
Failure Mode Testing of AC Lamps
The Failure Mode
The specific failure mode that has been investigated is that of DC current injection intoan AC powered lamp causing early failure of the lamp. One reference suggests this modeof failure but does not quantify the effect:
“The AC lamps contain symmetrical electrodes. They are non-polar andmust be driven by an A C voltage with a zero DC average current. If forcedto carry a DC current, one electrode etches or erodes vey quickly, andthe lamp fails prematurely. “[13]
Another reference makes similar claims to problems with DC injection in AC lamps:
“Furthermore, the hot arc tube may sufler electrolysis problems over timein the presence of sodium ions and a DC electric field. “[12]
TestSetup
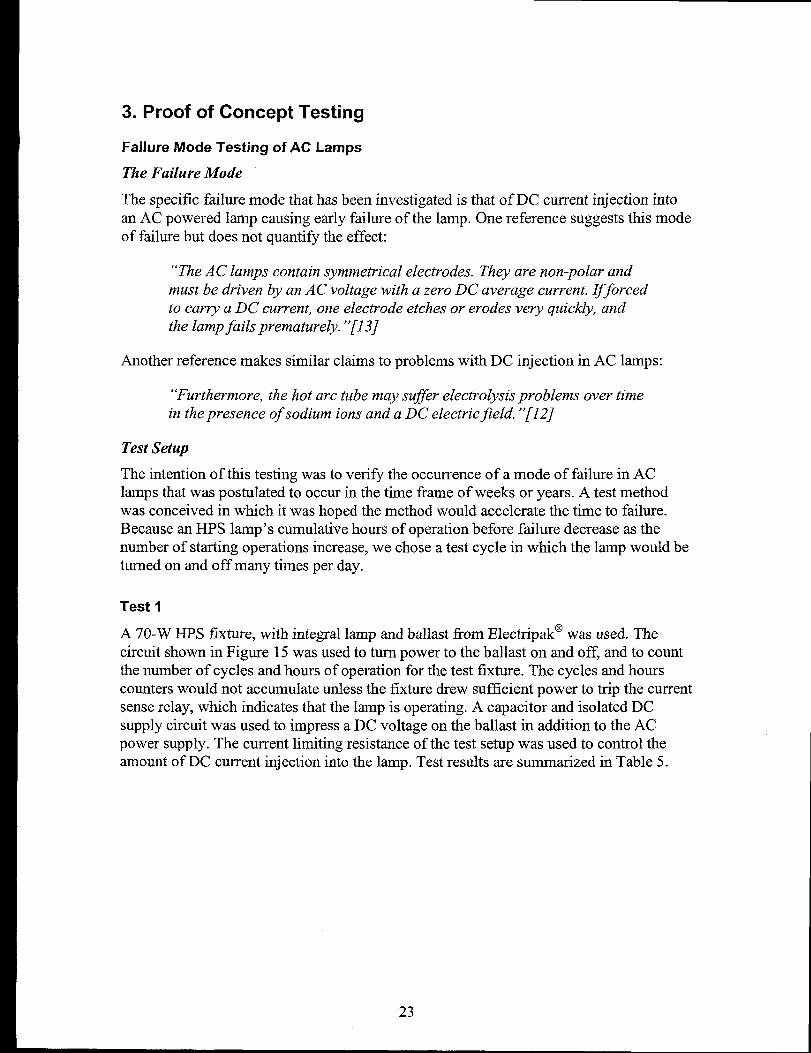
The intention of this testing was to veri~ the occurrence of a mode of failure in AClamps that was postulated to occur in the time frame of weeks or years. A test methodwas conceived in which it was hoped the method would accelerate the time to failure.Because an HPS lamp’s cumulative hours of operation before failure decrease as thenumber of starting operations increase, we chose a test cycle in which the lamp would beturned on and off many times per day.
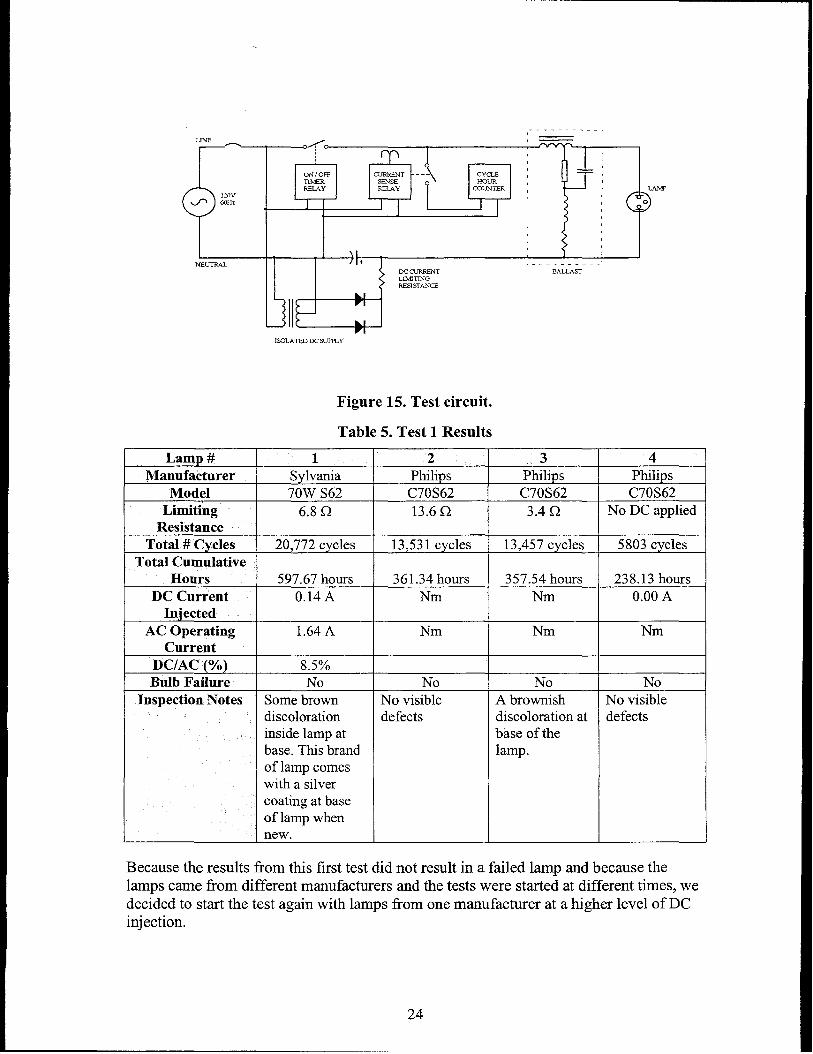
Test 1
A 70-W HPS fixture, with integral lamp and ballast fi-omElectripalc” was used. Thecircuit shown in Figure 15 was used to turn power to the ballast on and off, and to countthe number of cycles and hours of operation for the test fixture. The cycles and hourscounters would not accumulate urdess the fixture drew sufficient power to trip the currentsense relay, which indicates that the lamp is operating. A capacitor and isolated DCsupply circuit was used to impress a DC voltage on the ballast in addition to the ACpower supply. The current limiting resistance of the test setup was used to control theamount of DC current injection into the lamp. Test results are summarized in Table 5.
-.
NEUIR4L
—;l—
:—
ON/OFF — ----
TIMER SENSE
1
RELAY RELAY
1 I I1
t
!E&g -
/1+
Lx TLIMITINGRESTSCANCE
]WLATED EC suwLy
Figure 15. Test circuit.
Table 5. Test 1 Results
. . . . . . . . . ..!
BALLAST
Lamp # 1 2 3 4Manufacturer Sylvania Philips Philips Philips
Model 70W S62 C70S62 C70S62 C70S62Limiting 6.8 Cl 13.6Q 3.40 No DC applied
ResistanceTotal # Cycles 20,772cycles 13,531cycles 13,457cycles 5803 cycles
Total CumulativeHours 597.67hours 361.34hours 357.54hours 238.13hours
DC Current 0.14A Nm Nm 0.00 AInjected
AC Operating 1.64A Nm Nm NmCurrent
DC/AC (0/0) 8.5Y’o
Bulb FaiIure No No No NoInspectionNotes Somebrown No visible A brownish No visible
discoloration defects discolorationat defectsinsidelampat base of thebase.Thisbrand lamp.of lampcomeswitha silvercoatingatbaseof lampwhennew.
Because the results from this first test did not result in a failed lamp and because thelamps came from different manufacturers and the tests were started at different times, wedecided to start the test again with lamps from one manufacturer at a higher level of DCinjection.
24
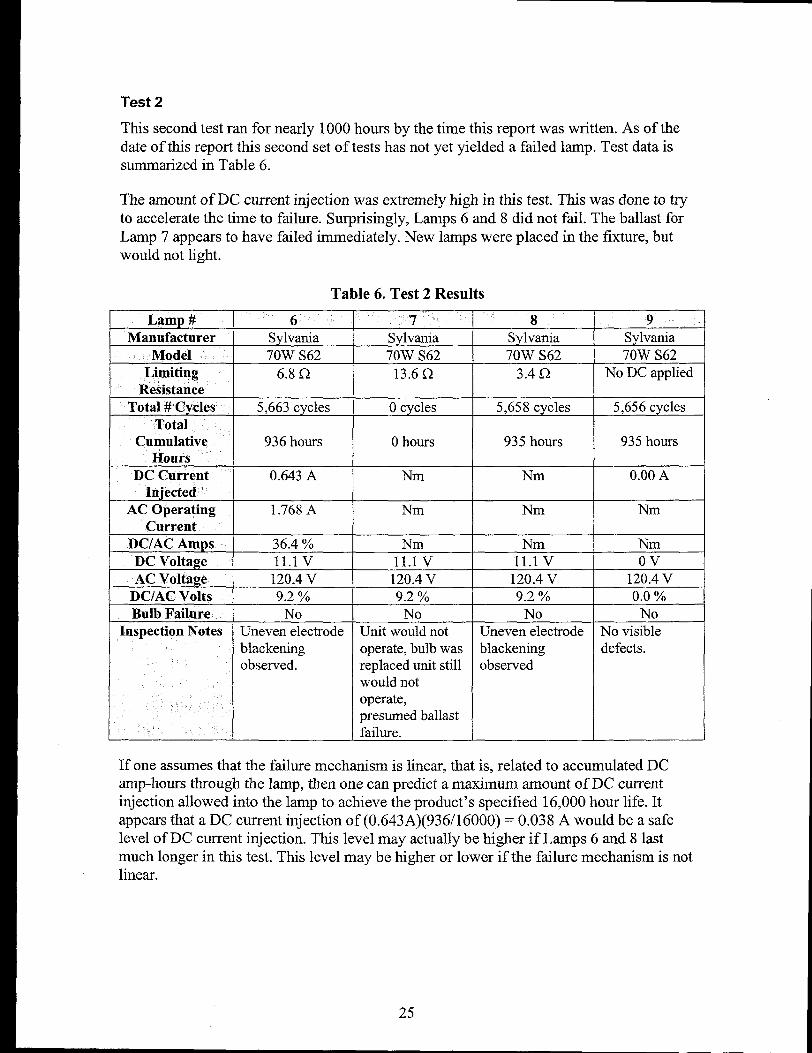
Test 2
This second test ran for nearly 1000 hours by the time this report was written.As of thedate of this report this second set of testshas not yet yielded a failed lamp. Test dataissummarizedin Table 6.
The amount of DC current injection was extremely high in this test. This was done to tryto accelerate the time to failure. Surprisingly, Lamps 6 and 8 did not fail. The ballast forLamp 7 appears to have failed immediately. New lamps were placed in the fixture, butwould not light.
Table 6. Test 2 Results
Lamp # 6Manufacturer Sylvania
Model 70W S62Lhniting 6.8 f-l
Cumulative 936 hoursHours
DC Current 0.643AInjected
AC Operating 1.768ACurrent
DC/AC Amps 36.4 ~0
DC Voltage 11.1v
InspectionNotes Uneven electrodeblackeningobserved.
7Sylvania70W S62
13.6Q
Ocycles
Ohours
Nm
Nm
Nm11.1 v
120.4 V9.2 Yo
NoUnit would notoperate, bulb wasreplaced unit stillwould notoperate,presumed ballastfailure.
8Sylvania
70W S62
3.4f2
5,658 cycles
935 hours
Nm
Nm
Nm11.1 v
120.4 V9.2 ‘%0
NoUneven electrodeblackeningobserved
9
Sylvania70W S62
No DC applied
5,656 cycles
935 hours
0.00 A
Nm
Nm
Ov120.4 V0.0Y.
No
No visibledefects.
If one assumes that the failure mechanism is linear, that is, related to accumulated DC
25
amp-hours through the lamp, then one can predict a maximum amount of DC currentinjection allowed into the lamp to achieve the product’s specified 16,000 hour life. Itappears that a DC current injection of (0.643 A)(936/l 6000) = 0.038 A would be a safelevel of DC current injection. This level may actually be higher if Lamps 6 and 8 lastmuch longer in this test. This level maybe higher or lower if the failure mechanism is notlinear.
The amount of current injection must be related to the DC and AC voltages applied to thelight fixture so that requirements for preventing DC voltage output of the inverter maybedetermined. The combined operating DC resistance of the ballast ph.Is lamp is measured
as 17.7 Q. To keep the DC current injection below 0.038 A, the DC voltage must be keptbelow 0.673 V for this ballast and lamp. This voltage represents 0.56% of the ACvoltage, and the inverter must be designed to prevent a DC voltage above this level underall lighting load conditions.
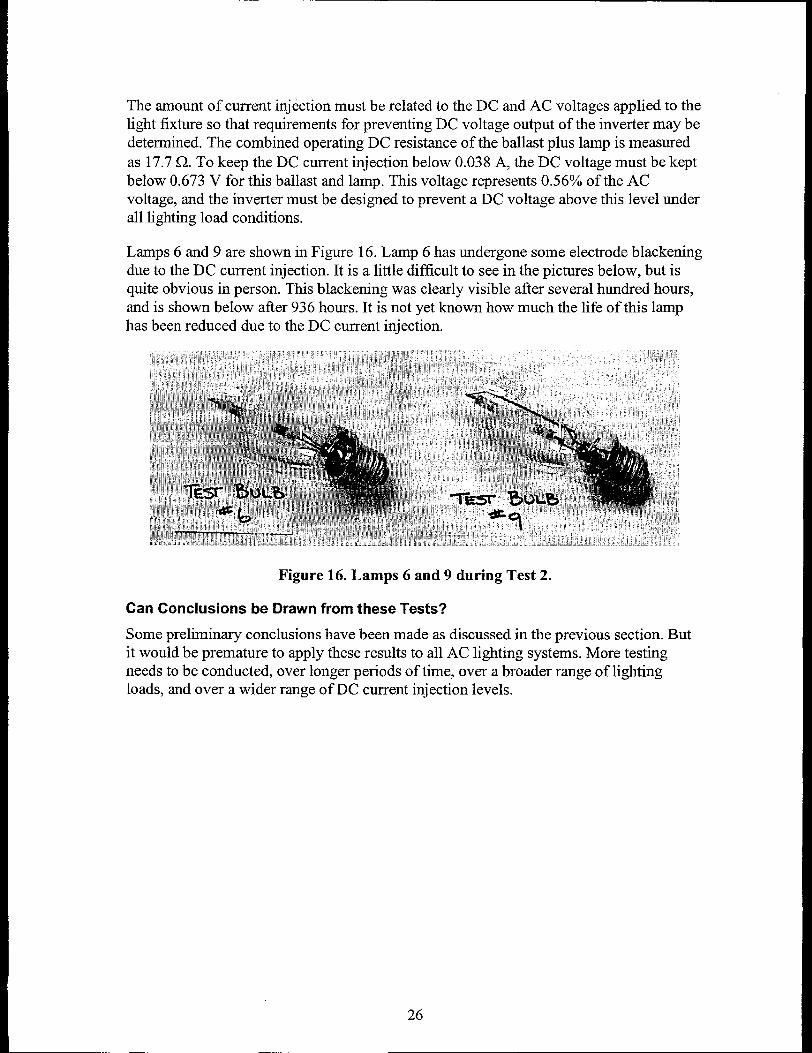
Lamps 6 and 9 are shown in Figure 16. Lamp 6 has undergone some electrode blackeningdue to the DC current injection. It is a little difficult to see in the pictures below, but isquite obvious in person. This blackening was clearly visible after several hundred hours,and is shown below afier 936 hours. It is not yet known how much the life of this lamphas been reduced due to the DC current injection.
Figure 16. Lamps 6 and 9 during Test 2.
Can Conclusions be Drawn from these Tests?
Some preliminary conclusions have been made as discussed in the previous section. Butit would be premature to apply these results to all AC lighting systems. More testingneeds to be conducted, over longer periods of time, over a broader range of lightingloads, and over a wider range of DC current injection levels.
26
4. Conclusions
Development of a controller for intermediate-size stand-alone AC lighting systemsappears viable, and would benefit U.S. industry in providing larger outdoor lightingsystems than are commonly available today.
More testing is needed on lamp failure modes to determine specific requirements on theDC/AC inverter portion of the system.
27
Intentionally left blank.
28
5(
1.
2.
3.
4.
5.
6.
7.
8.
9.
10.
11.
12.
13.
14.
15.
16.
References
1990 U.S. Census Data, http://venus.census. gov/cdrom/lookup.
ANSI C82.4-1992. American National Standard for Ballasts for High-Intensity-Discharge and Low-pressure Sodium Lamps (Multiple Supply Type).
ANSI C82.6-1 985. Methods of Measurement of High-Intensity-Discharge LampBallasts.
ANSI C136.3-1984. Roadway Lighting Equipment – Luminaire Attachments.
ANSUUL 935-1978. UL 935 Standard for Fluorescent-Lamp Ballasts. June 27, 1978.
Desmettre, D., et al. “Experimental Study of Stratification of Electrolyte inLead/Acid Batteries used for Solar Energy,” i?”dWorld Conference of PhotovoltaicSolar Energy Conversion. July 1998.
EREC. “Energy Efficient Lighting,” DOE/GO-10095-056, December, 1995.
Fiorello, R. Powering a 35WDC Metal Halide High Intensity Discharge (HID) Lampusing the UCC3305 HID Lamp Controller. Application NoteU-161, UnitrodeCorporation.
General Electric Co. Ballast and Luminaire Requirements for General Electric
Medium Based Lucalox@Lamps. October 1, 1982.
General Electric Co. GE Lighting Systems, Technical Data. Pub No. 9050.December 1993.
Gerken, K. and Welsh, D. A Pulse- Width Modulated High Reliability ChargeController, for Small Photovoltaic Systems. SAND97-0329, Sandia NationalLaboratories Contractor Report. Albuquerque, NM. February 1997.
Goldwasser, S.M. and Klipstein, D.L. Gas Discharge Lamps, Ballasts, and Fixtures,Ver. 1.29. July31, 1998, htt~://www.misty. com/-dorddschlamhtmlml
Goodenough, F. “Novel Dc-Dc Converter Keeps Power Constant,” ElectronicDesign. April 1, 1996.
Barrington, S., Hund, T. “Photovoltaic Lighting System Performance;’ Proceedingsof the 25th IEEE PV Specialists Conference. May, 1996.
Himmelstoss, F.A., et al. “Microcontroller Solar Battery Charger,” 2nd WorldConference of Photovoltaic Solar Energy Conversion. July 1998.
Johnson Controls. “The Dynasty Battery,” Specialty Battery Division,Milwaukee, WI.
29
17. Lamoureux, R., et al. “Estimated Energy Gain Provided by an MPPT to a Stand-alonePhotovoltaic System,” 2nd World Conference of Photovoltaic Solar EnergyConversion. July 1998.
18. Loois, G., et al. “Large Scale Market Introduction of PV Public Lighting, ” 2“d WorldConference of Photovoltaic Solar Energy Conversion. July 1998.
19. Lorenzo, E., et al. “A Field Experience with Automotive Batteries in SHS’S,” 2ndWorld Conference of Photovoltaic Solar Energy Conversion. July 1998.
20. McNutt, P. “Comparison of Time Required to Charge a Battery in a Stand-alonePhotovoltaic System Using Different Charge Controller Types,” Presented at theNCPV DOE Program Review Meeting, September 10, 1998, for publication in anAmerican Institute of Physics Proceeding.
21. Nieuwenhout, F.D.J., et al. “Rural Lighting Services: A Comparison of Lamps forDomestic Lighting in Developing Countries,” ?d World Conference of PhotovoitaicSolar Energy Conversion. July 1998.
22. Philips Lighting Company. Lamp Spec@ation and Application Guide. Printed 6/97,available by calling 1.800.555.0050.
23. Ryan Electric Supply Co. Catalog. 1997. Denver, CO.
24. Schmitz, C., et al. “State of Charge and State of Health Determination for Lead Acid
Batteries in PV Power Supply Systems,” 2nd World Conference of Photovoltaic SolarEnergy Conversion. July 1998.
25. Takigawa, K., et al. “A Long Term Cycle Test of Storage Batteries Newly Developedfor Advanced PV Application,” 2nd World Conference of Photovoltaic Solar EnergyConversion. July 1998.
26. UL-1 741, Proposed First Edition of the Standard for Static Invertei-s and ChargeControllers for use in Photovoltaic Power Systems. Underwriters Laboratories Inc.,Northbrook, Illinois. August 1, 1997.
27. Unitrode, Resonant Lamp Ballast Controller, UC1872 data sheet. December 1994.
28. Waymouth, J.F. Electric Discharge Lamps. M.I.T Press, Cambridge, MA.
29. Wiengmoon, B., et al. “PV Battery Charging at Huay Dua Village in Thailand,” 2ndWorld Conference of Photovoltaic Solar Energy Conversion. July 1998.
30
Distribution
Bob Weaver777 Wildwood LanePalo Alto, CA 94303
ABB Pwr. T&D Co., Inc.Hans Weinerich1460 Livingston Ave.P.O. BOX6005North Brunswick, NJ 08902-6005
Advanced Energy SystemsRobert WillsRiverview MillP.O. BOX262Wilton, NH 03086
Alaska State Div. of EnergyPercy Frisbey333 West Fourth Ave.Suite 220Anchorage, AK 99501-2341
American Elec. Pwr. Serv. Corp.C. Shih1 Riverside PlazaColumbus. OH 43215
ABB Power T&D Co., Inc.Per Danfors16250 West Glendale DriveNew Berlin, WI 53151
Active PowerJim Balthazar11525 Stonehollow Dr.Suite 135Austin, TX 78758
Alaska State Div. of EnergyP. Crump333 West Fourth Ave.Suite 220
/
Anchorage, AK 99501-2341
Alaska State Div. of EnergyB. Tiedeman333 West Fourth Ave.Suite 220Anchorage, AK 99501-2341
American Superconductor Corp.Christopher G. StrugTwo Technology DriveWestboroug~ MA 01581
American Superconductor Corp.Michael L. GravelyMadison OffIce2114 Eagle DriveMiddleto~ WI 53562
Applied Power CorporationTim BallSolar Engineering1210 Homann Drive SELacey, WA 98503
ARGO-TECH Productions, Inc.Christian St-PierreSubsidiary of Hydro-Quebec1580 de CoulombBoucherville, QC J4B 7Z7CANADA
Argonne National LaboratoriesBill DeLuca9700 South Cass AvenueCTD, Bldg. 205Argonne, IL 60439
Arizona Public ServiceHerb Hayden400 North Fifth StreetP.O. BOX 5399,MS8931Phoenix, AZ 85072-3999
Anchorage Municipal Light & PwrMeera Kohler1200 East 1st AvenueAnchorage, AK 99501
Applied Energy Group, IncRalph M. Nigro46 Winding Hill DriveHockessin, DE 19707
Argonne National LaboratoriesGary Henriksen9700 South Cass AvenueCTD, Bldg. 205Argonne, IL 60439
Arizona Public ServiceRay Hobbs400 North Fifth StreetP.O. BOX 5399,MS8931Phoenix, AZ 85072-3999
Arizona State University EastRobert Hammond6001 S. Power Rd.Bldg. 539Mesa, AZ 85206
Ascension Technology, IncEdward C. KernP.O. Box 6314Lincoln, MA 01773-6314
Babcock & WilcoxGlenn CampbellP.O. BOX785Lynchburg, VA 24505
Bechtel CorporationWalt StolteP.O. BOX 193965San Francisco, CA 94119-3965
Berliner Kraft und Licht (13EWAG)Klaus KramerStauffenbergstrasse 261000 Berlin 30GERMANY
BoeingSamuel B. WrightInform., Space & Defense Sys.P.0. Box 3999 MS 82-97Seattle, WA 98124-2499
AVO InternationalGary Markle510 Township Line Rd.Blue Bell, PA 19422
Beacon Power Corp.Richard L. Hockney6 Gill St.Woburn Industrial ParkWoburn, MA 01801-1721
Bergey WindpowerMichael L. Bergey2001 Priestley AvenueNorman, OK 73069
BHP Research& Tech Dev.Massoud Assefpour600 Bourke StreetMelbourne Victoria, 3000AUSTRALIA
Business Management ConsultingSalim Jabbour24704 Voorhees DriveLOS Altos Hills, CA 94022
C&D Charter Pwr. Systems,Dr. Les HoldenWash@gton & Cherry Sts.Conshohocken, PA 19428
C&D PowercomLarry S. Meisner1400 Union Meeting RoadP.O. Box 3053Blue Bell, PA 19422-0858
Inc.
California State Air Rest. BoardJ. HolmesResearch DivisionPO. BOX2815Sacramento, CA 95812
Calpine Co~orationRod 130ucher50 W. San FernandoSuite 550San Jose, CA 95113
Chugach Elec. Association, Inc.Tom LovasPO. BOX 196300Anchorage, AK 99519-6300
C&D Charter Pwr. Systems, Inc.Dr. Sudhan S. MisraWashington & Cherry Sts.Conshohocken, PA 19428
California Energy CommissionJon Edwards1516 Ninth Street, MS-46Sacramento, CA 95814
California Energy ComissionPramod P. KulkarniResearch & Dev. OffIce1516 9th Street, MS43Sacramento, CA 95814-5512
Chugach Elec. Association, Inc.John CooleyP.O. BOX 196300Anchorage, AK 99519-6300
Consolidated EdisonM. Lebow4 Irving PlaceNew York NY 10003
Consolidated EdisonN. Tai4 Irving PlaceNew York, NY 10003
Crescent EMCR. B. SloanP.O. BOX 1831Statesville, NC 28687
Delphi Energy & EngineJ. Michael HingaManagement SystemsP.O. BOX 502650Indianapolis, IN 46250
Department of Energy - RetiredAlbert R. LandgrebeB 14 Suffex LaneMillsboro, DE 19966
EA Technology, Ltd.John N. BakerChester CH1 6ESCapenhurst, EnglandUNITED KINGDOM
Corn Belt Electric CooperativeR. StackP.O. Box 816Bloomington, IL 61702
Delphi Energy. & EngineBob GalyenManagement SystemsP.O. BOX 502650Indianapolis, IN 46250
Delphi Energy & EngineBob RiderManagement SystemsP.O. BOX 502650Indianapolis, IN 46250
Distributed Utility AssociatesJoseph J. Iannucci1062 Concannon Blvd.Livermore, CA 94550
Eagle-Picher Industries. Inc.Jim DeGrusonC & Porter StreetJoplin, MO 64802
East Penn Manufact. Co., Inc.M. StantonDeka RoadLyon Statio~ PA 19536
Elec. Pwr. Research InstituteSteve ChapelP.O. BOX 10412Palo Alto, CA 94303-0813
,
Elec. Pwr. Research InstituteRobert SchainkerP.O. BOX 10412Palo Alto, CA 94303-0813
Electrochemical EngineeringPhillip C. SymonsConsultants, Inc.1295 Kelly Park CircleMorgan Hill, CA 95037
Elforsk-Swedish Elec Utilities R&D CoHarald HaegermarkElforsk ABStockholm, S-101 53Sweden
ECG Consulting Group, Inc.Daniel R. Bruck55-6 Woodlake RoadAlbany, NY 12203
Elec. Pwr. Research InstituteSteve EckroadP.O. BOX 10412Palo Alto, CA 94303-0813
Electrochemical EnergyDave FederStorage Systems, Inc.35 Ridgedale AvenueMadison, NJ 07940
ElectrosourceMichael DodgeP.O. Box 7115Loveland, CO 80537
Eltech Research CorporationEric Rudd625 East StreetFairport Harbor, OH 44077
EnergeticPhil DiPietro501 School Street SWSuite 500Washington, DC 20024
EnergeticHoward Lowitt7164 Gateway DriveColumbia, MD 21046
EnergeticJennifer Schilling501 School Street SWSuite 500Washington, DC 20024
Energetic, Inc.Laura Johnson7164 Gateway DriveColumbia, MD 21046
Energy Communications ConsultingAmber Gray-Fenner7204 Marigot Rd. NWAlbuquerque, NM 87120
EnergeticMindi J. Farber-DeAnda501 School Street SWSuite 500Washington, DC 20024
EnergeticRich Scheer501 School Street SWSuite 500Washington, DC 20024
EnergeticPaula A. Taylor7164 Gateway DriveColumbia, MD 21046
Energy & Env. Economics, Inc.Greg J. Ball353 Sacramento StreetSuite 1540San Francisco, CA 94111
Energy Systems ConsultingAI Pivec41 Springbrook RoadLivingston, NJ 07039
EnerTec Pty. Ltd.Dale Butler EnerVision349 Coronation Drive Robert DuvalPO Box 1139, Milton BC Old 4044 P,O, BOX450789Auchenflower, Queensland, 4066 Atlanta, GA 31145-0789AUSTRALIA
Ergenics, Inc.David H. DaCosta247 Margaret King AvenueRingwood, NJ 07456
Exide ElectronicsJohn Breckenridge8609 Six Forks RoadRaleigh, NC 27615
Florida Solar Energy CenterJames P. Dunlop1679 Clearlake RoadCocoa, FL 32922-5703
Frost & SullivanDave Coleman2525 Charleston RoadMountain View, CA 94043
EUS GmbHErik HennigMunscheidstraBe 14Gelsenkirchen, 45886Germany
Firing Circuits, Inc.J. MillsP.O. BOX2007Norwalk, CT 06852-2007
Florida Solar Energy CenterSteven J. Durand1679 Clearlake RoadCocoa, FL 32922-5703
Frost & SullivanSteven Kraft2525 Charleston RoadMountain View, CA 94043
GE Industrial & Pwr. ServicesBob Zrebiec640 Freedom Business CenterKing of Prussia, PA 19046
General Electric CompanyNick Miller1 River RoadBuilding 2, Room 605Schenectady, NY 12345
General Electric Drive SystemsDeclan Daly1501 Roanoke Blvd.Salem, VA 24153
Gerry Woolf AssociatesGerry Woolf17 Westmeston AvenueRottingdea~ East Sussex, BN2 SALUNITED KINGDOM
Giner, Inc.A. “Tony” LaConti14 Spring StreetWaltham, MA 02254-91 47
GNB TechnologiesSanjay Deshpande’Woodlake Corporate Park829 Parkview Blvd.Lombard, IL 60148-3249
GNB Tech. Ind. Battery Co.Joe SzymborskiWoodlake Corporate Park829 Parkview Blvd.Lombard, IL 60148-3249
GNB Tech. Ind. Battery Co.J. BoehmWoodlake Corporate Park829 Parkview Blvd.Lombard, IL 60148-3249
GNB Tech. Ind. Battery Co.George HuntWoodlake Corporate Park829 Parkview Blvd.Lombard, IL 60148-3249
Golden Valley Elec. AssocSteven Haagensen758 Illinois StreetP.O. BOX 71249Fairbanks, AK 99701
., Inc.
Gridwise Engineering CompanyBen Norris121 Starlight PlaceDanville, CA 94526
HL&P Energy ServicesGeorge H. NolinP.O. Box 4300Houston, TX 77210-4300
ILZROJerome F. Cole2525 Meridian ParkwayPO BOX 12036Research Triangle Park, NC 27709
Imperial Oil Resources, Ltd.R. Myers3535 Research Rd. NWCalgary, Alberta, T2L 2K8CANADA
Hawaii Electric Light Co.Clyde NagataP.O. BOX 1027Hilo, HI 96720
Innovative Power SourcesKen Belfer1419 Vla Jon Jose RoadAlamo, CA 94507
Intercon LimitedDavid Warar (2)6865 Lincoln AvenueLincolnwood, IL 60646
KEMA T&D PowerGerard H. C. M. ThijssenUtrechtseweg310P.0. Box 9035ET, Ernhem, 6800The Netherlands
Lawrence Berkeley National LabFrank McLarnonUniversity of CaliforniaOne Cyclotron RoadBerkeley, CA 94720
Lawrence Livermore Nat’1 LabJ. Ray SmithUniversity of CaliforniaP.O. BOX808, L-641Livermore, CA 94551
Lucent TechnologiesCecilia Y. Mak300 Skyline DriveRoom 855Mesquite, TX 75149-1802
Magnet Business GroupA. Kamal Kalafala450 Old Niskayuna RoadP.O. BOX461Latham, NY 12110-0461
Lawrence Berkeley Nat’1 LabElton CairnsUniversity of CaliforniaOne Cyclotron RoadBerkeley, CA 94720
Lawrence Berkeley Nat’1 LabKim KinoshitaUniversity of CaliforniaOne Cyclotron RoadBerkeley, CA 94720
Longitude 122 WestSusan Marie Schoenung1010 Doyle StreetSuite 10Menlo Park, CA 94025
Lucent Technologies, Inc.Joseph Morabito600 Mountain View Ave.P.O. BOX 636Murray Hill, NJ 07974-0636
Massachusetts Inst of TechStephen R. ConnorsThe Energy LaboratoryRm E40-465Cambridge, MA 02139-4307
Metlakatla Power& LightDutch AchenbachP.O. Box 3593.5 Mile Airport RoadMetlakatla, AK 99926
Nat’1 Institute of Standards & Tech.Dr. Christine E. PlattRoom A225 Administration Bldg.Gaithersburg, MD 20899
Nat’1 Renewable Energy LabLarry Flowers1617 Cole BoulevardGolden, CO 80401-3393
Nattl Renewable Energy LabSusan Hock1617 Cole BoulevardGolden, CO 80401-3393
Nat’1 Renewable Energy LabHolly Thomas1617 Cole BoulevardGolden, CO 80401-3393
Micron CorporationD. Nowack158 Orchard LaneWinchester, TN 37398
Nat’1 Renewable Energy LabRichard DeBlasio1617 Cole BoulevardGolden, CO 80401-3393
Nat’1 Renewable Energy LabJim Green1617 Cole BoulevardGolden, CO 80401-3393
Nat’1 Renewable Energy LabByron Stafford1617 Cole BoulevardGolden, CO 80401-3393
National Power PLCAnthony PriceHarwell Int’1Business Ctr.Harwell, Didcot, OXI 1 OQALondon
National Rural Elec Cooperative Assoc.Steven P. Lindenberg4301 Wilson Blvd.SSER9-207Arlington, VA 22203-1860
NC Solar CenterBill BrooksCorner of German & WesternBox 7401 NCSURaleigh, NC 27695-740
New York Power AuthorityBart Chezar1633 BroadwayNew York NY 10019
Northern States Power Co.Denise Zurn414 Nlcollet MallMinneapolis, MN 55401
Oak Ridge National LaboratoryRobert HawseyP.O. Box 2008Bldg. 3025, MS-6040Oak Ridge, TN 37831-6040
National Science FoundationBob Brewer1000 Independence Ave. SWEE-10 FORSTLWashington, DC 20585
New Mexico State UniversityAndrew L. RosenthalSouthwest Tech. Dev. InstituteBox 300011Dept. 3SOLLas Cruces, NM 88003-8001
Northern States Power Co.Gary G. Kam1518 Chestnut Avenue NorthMinneapolis, MN 55403
NPA TechnologyJack BrownTwo University PlaceSuite 700Durham, NC 27707
Oak Ridge National LaboratoryBrendan KirbyP.O. BOX2008Bldg. 3147, MS-6070Oak Ridge, TN 37831-6070
Oak Ridge National LaboratoryJohn StovalP.O. Box 2008Bldg. 3147, MS-6070Oak Ridge, TN 37831-6070
Omnion Pwr. Engineering Corp.Hans Meyer2010 Energy DriveP.O. BOX 879East Troy, WI 53120
Pacific Northwest Nat’1LabDaryl BrownBattelleBlvd. MS K8-07P.O. Box 999Richland, WA 99352
Paul Scherrer InstitutThomas H. SchucanCH -5232 Villigen PSISwitzerland
POWER Engineers, Inc.Stan SostromP.O. Box 7773870 USHwy 16Newcastle, WY 82701
Oak Ridge National LaboratoryJames VanCoeveringP.O. BOX2008Bldg. 3147, MS-6070Oak Ridge, TN 37831-6070
Orion Energy CorporationDoug Danley10087 Tyler Place #5Ijamsville, MD 21754
Pacific Northwest Nat’1 LabJohn DeStreeseBattelle Blvd.P.O. BOX 999, K5-02Richland, WA 99352
PEPCOBrad Johnson1900 Pennsylvania NWWashington, DC 20068
Power Technologies, Inc.P. Prabhakara1482 Erie Blvd.P.O. BOX 1058Schenectady, NY 12301
Power Technologies, Inc.Henry W. Zaininger775 Sunrise AvenueSuite 210Roseville, CA 95661
Powercell CorporationRick Winter101 Main StreetSuite 9Cambridge, MA 02142-1519
Public Service Co. of New MexicoJerry NealAlvarado Square MS-BA52Albuquerque, NM 87158
Queensland Department ofNorman LindsayMines and EnergyG.P.O. BOX 194Brisbane, 4001QLD. AUSTRALIA
Raytheon Eng. & ConstructorsAl Randall700 South Ash StreetP.O. BOX 5888Denver, CO 80217
Powercell CorporationReznor I. Orr101 Main StreetSuite 9Cambridge, MA 02142-1519
Public Service Co. of New MexicoRoger FlynnAlvarado Square MS-2838Albuquerque, NM 87158
Puerto Rico Elec. Pwr. AuthorityWenceslao TorresG.P.O. BOX4267San Juan, PR 00936-426
R&D AssociatesJ. Thompson2100 Washington Blvd.Arlington, VA 22204-5706
RMS CompanyK. Ferris87 Marding AvenuePleasantville, NY 10570
ISAFT America, Inc.Ole Vigerstol711 Industrial Blvd.Valdosta, GA 13601
SAFT Research& Dev. Ctr.Mike Sail107 Beaver CourtCockeysville, MD 21030
Salt River ProjectG. E. “Ernie” PalominoP.O. BOX52025MS PAB 357Phoenix, AZ 85072-2025
Sentech, Inc.Kurt Klunder4733 Bethesda AvenueSuite 608Bethesda, MD 20814
Sentech, Inc.Rajat K. Sen4733 Bethesda AvenueSuite 608Bethesda, MD 20814
SAFT Research& Dev. Ctr.Guy Chagnon107 Beaver CourtCockeysville, MD 21030
Salt River ProjectH. LundstromP.O. BOX 52025MS PAB 357Phoenix, AZ 85072-2025
Santa Clara UniversityDr. Charles FeinsteinDept. of Dec. & Info, SciencesLeavey School of Bus. & Admin.Santa Clara, CA 95053
Sentech, Inc.Robert Reeves9 Eaton RoadTroy, NY 12180
Sentec~ Inc.Nicole Miller4733 Bethesda AvenueSuite 608Bethesd~ MD 20814
Siemens SolarC1ay Aldrich4650 Adohn LaneP.O. BOX6032Camarillo, CA 93011
Solar Electric Specialists Co.Jim Trotter232-Anacapa StreetSanta Barbara, CA 93101
SolarexGerald W. Braun630 Solarex CourtFrederick, MD 21701
Southern California EdisonNaum Pinsky2244 Walnut Grove Ave.P.O. Box 800, Room 418Rosemead, CA 91770
Southern Company Services, Inc.K. Vakhshoorzadeh600 North 18th StreetP.O. BOX2625Birmingham, AL 35202-2625
Soft Switching TechnologiesDeepak Divan I
2224 Evergreen RoadSuite 6 IMiddleton, WI 53562
Solar Energy Ind. Assoc. (SEIA)Scott Sklar122 C Street NW4th FloorWashington, DC 20001-2104
Southern Company Services, Inc.Bruce R. Rauhe, Jr.600 North 18th StreetP.O. BOX2625Birmingham, AL 35202-2625
Southern California EdisonRichard N. Schweinberg6070 N. Irwindale AvenueSuite IIrwindale, CA 91702
SRI InternationalC. Seitz333 Ravenswood AvenueMenlo Park, CA 94025
Stored Energy EngineeringBob Bish7601 E. 88th PlaceIndianapolis, IN 46256
Switch TechnologiesJon Hurwitch4733 Bethesda AvenueSuite 608Bethesda, MD 20814
The Brattle GroupThomas J. Jenkin44 Bratde StreetCambridge, MA 02138-3736
The Pennsylvania State UniversityCharles E. Bakis227 Hammond BuildingUniversity Park, PA 16802
The Technology Group, Inc.Tom Anyos63 Linden AvenueAtherton, CA 94027-2161
Stored Energy EngineeringGeorge Zink7601 E. 88th PlaceIndianapolis, IN 46256
Tampa Electric CompanyTerri HensleyP.O. Box 111Tampa, FL 33601-0111
The Detroit Edison CompanyHaukur Asgeirsson2000 2nd Ave.435 SBDetroit, MI 48226-1279
The Solar ConnectionMichael OriansP.O. EOX 1138Morro Bay, CA 93443
TRACE Engineering DivisionBill Roppenecker5916 195th NortheastArlington, WA 98223
Trace TechnologiesMichael Behnke6952 Preston Ave.Livermore, CA 94550
Trinity Flywheel PowerDonald A. Bender6724D Preston AvenueLivermore, CA 94550
TU ElectricJames FangueR&D ProgramsP.O. Box 970Fort Worth, TX 76101
U.S. Department of EnergyPaul Maupin19901 Germantown RdER- 14 E-422Germantown, MD 20874-1290
U.S. Department of EnergyJ. P. Archibald1000 Independence Ave. SWEE-90 FORSTLWashington, DC 20585
Trace TechnologiesBill Erdman6952 Preston AvenueLivermore, CA 94550
Trojan Battery CompanyJim Drizos12380-Clark StreetSanta Fe Springs, CA 90670
U.S. Agency for Intn’1 DevelopmentPaul C. KlimasCenter for EnvironmentWashington, DC 20523-3800
U.S. Department of CommerceDr. Gerald P. CeasarNIST/ATPBldg 101, Room 623Gaithersburg, MD 20899
U.S. Department of EnergyTien Q. Duong1000 Independence Ave. SWEE-32 FORSTL, Rm. 5G-030Washin@on, DC 20585
.
U.S. Department of EnergyR. Eynon1000 Independence Ave. SWEI-821 FORSTLWashington, DC 20585
U.S. Department of EnergyPandit G. Patil1000 Independence Ave. SWEE-32 FORSTLWashington, DC 20585
U.S. Department of EnergyAlex G. Crawley1000 Independence Ave. SWEE-90 FORSTLWashington, DC 20585
U.S. Department of EnergyAllan Jelacic1000 Independence Ave. SWEE-12 FORSTLWashington, DC 20585
U.S. Department of EnergyDan T. Ton1000 Independence Ave. SWEE-I 1 FORSTLWashington, DC 20585
U.S. Department of EnergyMark B. Ginsberg1000 Independence Ave. SWEE-90 FORSTL 5E-052Washington, DC 20585
U.S. Department of EnergyNeal Rossmeissl1000 Independence Ave. SWEE-13 FORSTLWashington, DC 20585
U.S. Department of EnergyAllan Hoffman1000 Independence Ave. SWEE-10 FORSTLWashingto~ DC 20585
.
U.S. Department of EnergyAlex O. Bulawka1000 Independence Ave. SWEE-11 FORSTLWashingto~ DC 20585
U.S. Department of EnergyJack Cadogan1000 Independence Ave. SWEE-11 FORSTLWashington, DC 20585
U.S. Department of EnergyJ. A. Mazer1000 Independence Ave. SWEE-11 FORSTLWashington, DC 20585
U.S. Department of EnergyJoe Galdo1000 Independence Ave. SWEE-10 FORSTLWashington, DC 20585
U.S. Department of EnergyPhilip N. Overholt1000 Independence Ave. SWEE-11 FORSTLWashington, DC 20585-0121
U.S. Department of EnergyRichard J. King1000 Independence Ave. SWEE-11 FORSTL, 5H-095Washington, DC 20585
U.S. Department of EnergyJames E. Rannels1000 Independence Ave. SWEE-11 FORSTLWashington, DC 20585-0121
U.S. Department of EnergyJim Daley1000 Independence Ave. SWEE-12 FORSTLWashington, DC 20585
U.S. Department of EnergyKenneth L. Heitner1000 Independence Ave. SWEE-32 FORSTLWashington, DC 20585
U.S. Department of EnergyRuss EatonGolden Field OffIce1617 Cole Blvd., Bldg. 17Golden, CO 80401
U.S. Department of EnergyW. Butler1000 Independence Ave. SWPA-3 FORSTLWashington, DC 20585
U.S. Department of EnergyGary A. BuckinghamAlbuquerque Operations OffIceP.O. Box 5400Albuquerque, NM 87185
U.S. Department of EnergyImre Gyuk1000 Independence Ave. SWEE-14 FORSTLWashington, DC 20585
U.S. NavyWayne TaylorCode 83BOOOD,NAWSChina Lake, CA 93555
University of Missouri - RollsMax Anderson112 Electrical Eng. Bldg.Rolls, MO 65401-0249
Urenco (Capenhurst) Ltd.G. Alan PalinCapenhurst, Chester, CH1 6ERUNITED KINGDOM
Utility Power GroupMike Stern9410-G DeSoto AvenueChatsworth, CA 91311-4947
U.S. Flywheel SystemsSteve Bitterly1125 Business Center CircleNewbury Park, CA 91320
UFTOEdward Beardsworth951 Lincoln AvenuePalo Alto, CA 94301-3041
University of Texas at AustinJohn H. PriceJ.J. Pickel Research CampusMail Code R7000Austi~ TX 78712
Utility Photo Voltaic GroupSteve Hester1800 M Street NWWashington, DC 20036-5802
VEDCO EnergyRick Ubaldi12 Agatha LaneWayne, NJ 07470
Virginia Power Virginia Polytechnic Instit. & State UniGary Verno Alex Q. HuangInnsbrook Technical Center Virginia Power Electronics Center5000 Dominion Blvd. 672 Whittemore HallGlen Ellen, VA 23233 Blacksburg, VA 24061
Walt Disney WorldRandy BevinDesign and Eng’gP.O. Box 10,000Lake Buena Vista, FL 32830-1000
WestinghouseTom MattyP.O. BOX 17230Maryland, MD 21023
Yuasa, Inc.Frank Tarantino2366 Bernville RoadP.O. Box 14145Reading, PA 19612-4145
Yuas~ Inc.Nicholas J. Magnani2366 Bernville RoadP.O. Box 14145Reading, PA 19612-4145
Westinghouse Elec. Corp.Gerald J. KeaneEnergy Management Division4400 Alafaya TrailOrlando, FL 32826-2399
Westinghouse STCHoward Saunders1310 Beulah RoadPittsburgh, PA 15235
Yuasa, Inc.Gene Cook2366 Bernville RoadP.O. Box 14145Reading, PA 19612-4145
Yuasa-Exide, Inc.R. Kristiansen35 Loch Lomond LaneMiddleto~ NY 10941-1421
ZBB Technologies, Ltd.Robert J. Parry11607 West Dearbourn Ave.Wauwatosa, WI 53226-3961
MS-05 13, Robert Eagan (1000)MS-0212, Andrew Phillips (10230)MS-0619, Review & Approval For DOE/OSTI (001 11) (1)MS-0953, William E. Alzheimer (1 500)MS-0953, Thomas J. Cutchen (1500)MS-0613, Daniel H. Doughty (1521)MS-0613, Rudy G. Jungst (1521)MS-0613, Terry Unkelhaeuser (1521)MS-0614, Dennis E. Mitchell (1 522)MS-0614, Robert W. Bickes (1 523)MS-0613, John D. Boyes (1525)MS-0613, Paul C. Butler (1525) (10)MS-0613, Nancy H. Clark (1525)MS-0613, Garth P. Corey (1525)MS-06 13, Terry Crow (1525)MS-0613, Imelda Francis (1525)MS-0613, Gus P. Rodriguez (1525)MS-0340, Jeff W. Braithwaite (1832)MS-0537, Stan Atcitty (2314)MS-0899, Technical Library (4916) (2)MS-0741, Sam Vamado (6200)MS-0704, Abbas A. Akhil (6201)MS-0708, Henry M. Dodd (6214)MS-0753, Russell H. Bonn (6218)MS-0753, Ward I. Bower (6218)MS-0753, Christopher Cameron (6218)MS-0753, Tom Hund (6218)MS-0753, John W. Stevens (6218)MS-0455, Marjorie L. Tatro (6231)MS-9403, Jim Wang (8713)MS-901 8, Central Technical Files (8940-2)MS-1 193, Dean C. Rovang (953 1)
ZBB Technologies, Inc.Phillip A. Eidler11607 West Dearboum Ave.Wauwatosa, WI 53226-3961