Embed Size (px)
Citation preview

The Argand Diagram as the world knows it
An Argand diagram is a two-dimensional coordinate system for the presentation of complex numbers as points on the complex plane.
The scaling on the horizontal axis gives the real part and the scaling on the vertical axis gives the imaginary part of a complex number. In the plot above, the dashed circle represents the complex modulus of and the angle represents its complex argument.
While Argand (1806) is generally credited with the discovery, the Argand diagram (also known as the Argand plane) was actually described by C. Wessel or Gauss prior to Argand. Historically, the geometric representation of a complex number as a point in the plane was important because it made the whole idea of a complex number more acceptable. In particular, this visualization helped "imaginary" and "complex" numbers become accepted in mainstream mathematics as a natural extension to negative numbers along the real line.
History of the Argand Diagram
How the Argand diagram evolved into the form that is widely accepted today can be traced back to the roots of complex numbers ages ago when mathematicians were trying to unlock the geometric mysteries of i. in fact, the Argand diagram is a result of the efforts made to sync algebra (in particular complex numbers) with geometry. A fact that is surprising to many is that complex numbers arose from the need to solve cubic equations, and not (as it is commonly believed) quadratic equations.
The methods of algebra known to the Arabs were introduced in Italy by the Latin translation of the algebra of al-Khwarizmi by Gerard of Cremona (1114-1187), and by the work of Leonardo da Pisa (Fibonacci) (1170-1250). About 1225, when Frederick II held court in Sicily, Leonardo da Pisa was presented to the emperor. A local mathematician posed several problems, all of which were solved by Leonardo. One of the problems was the solution of the equation x3 + 2x2 + 10x = 20If only positive coefficients and positive values of x are admitted, there are three cases, all collectively known as depressed cubic:(a) x3 + px = q(b) x3 = px + q(c) x3 + q = px

The first to solve equation (1) (and maybe (2) and (3)) was Scipione del Ferro, professor of Bologna until 1526, when he died. In his deathbed, del Ferro confided the formula to his pupil Antonio Maria Fiore. Fiore challenged Tartaglia to a mathematical contest. The night before the contest, Tartaglia rediscovered the formula and won the contest. Tartaglia in turn told the formula (but not the proof) to Gerolamo Cardano, who signed an oath to secrecy. From knowledge of the formula, Cardano was able to reconstruct the proof. Later, Cardano learned that del Ferro had the formula and verified this by interviewing relatives who gave him access to del Ferro’s papers. Cardano then proceeded to publish the formula for all three cases in his Ars Magna (1545). It is noteworthy that Cardano mentioned del Ferro as first author, and Tartaglia as obtaining the formula later in independent manner. [1]
Cardano was the first to introduce complex numbers into algebra, but had misgivings about it. [2] In Chapter 37 of Ars Magna the following problem is posed: “To divide 10 in two parts, the product of which is 40”.It is clear that this case is impossible. Nevertheless, we shall work thus: We divide 10 into two equal parts, making each 5. These we square, making 25. Subtract 40, if you will, from the 25 thus produced, leaving a remainder of -15, the square root of which added to or subtracted from 5 gives parts the product of which is 40. These will be 5 +( under root −15) and 5 –( under root −15).Putting aside the mental tortures involved, multiply 5 + (under root−15) and 5 –(under root−15) making 25 − (−15) which is +15. Hence this product is 40.
John Wallis (1616-1703) notes in his Algebra that negative numbers, so long viewed with suspicion by mathematicians, had a perfectly good physical explanation, based on a line with a zero mark, and positive numbers being numbers at a distance from the zero point to the right, where negative numbers are a distance to the left of zero. Also, he made some
progress at giving a geometric interpretation to i.
P. Nahin in his book, An imaginary tale writes the following comment on this diagram:“Wallis had stumbled on the idea that, in some sense, the geometrical manifestation of imaginary numbers is vertical movement in the plane. Wallis himself made no

such statement, however, and this is really a retrospective comment made with the benefit of three centuries of hindsight.It would be another century before the now “obvious” representation of complex numbers as points in the plane, with the horizontal and vertical directions being the real and imaginary directions, respectively, would be put forth, but Wallis came very close… Even so, a close miss is still a miss, and Wallis’ work in complex number geometry is remembered today only by historians.” [3]
It took two hundred years to prove that this imaginary number was as powerful as people believed. Eventually it was Gauss who proved in his doctoral thesis that any equation of the
form x6+ x5+3=0 or x4= −1 could be solved by setting x equal to a number a + bi built out of this imaginary number i and two real numbers a and b. This combination a + bi of imaginary and real numbers is called a complex number. For example, setting a and b equal to 1/(underroot2) will give a number of the form a + bi, whose fourth power is −1. If you are brave enough to do some algebra here is why:
So important was this discovery that it became known as the Fundamental Theorem of Algebra. In proving this result, Gauss answered another problem that had been bugging mathematicians: just where were these imaginary numbers, if they were not on the number line? He produced a picture of these new numbers which gave them some semblance of reality and started to hint at the connections that solving equations might have with symmetry. [3]
The idea was that if there were no numbers on the number line whose square is −1, why not create a new direction to represent these new numbers whose squares were negative? A two-dimensional picture emerged in which the regular number line became the horizontal axis, representing the real numbers, and the vertical axis could be used to record the imaginary numbers (Figure 44). So on the Argand diagram the complex number 3 + 4i, for example, is represented as the point (3, 4).

That said, there are two accounts on the real pioneer of this diagram. One account says it was Gauss’ brainchild as mentioned before, and Wessel and Argand probably reproduced it. But some historians credit this work to Wessel, their reasons being that Gauss never published his writings and Wessel was the first to put forth his findings on public forums. Both however, agree that Argand is undeserving of the credit.
In Ho¨uel’s 1876 reprint of Argand’s work the following ironic testimonialwas included in the introductory preface, words quoted from the recently deceased young German mathematician Hermann Hankel (1839–73): “The first to show how to represent the imaginary form A 1 Bi by points in a plane, and to give rules for their geometric addition and multiplication, was Argand. . . unless some older work is discovered, Argand must be regarded as the true founder of the theory of complex quantities in a plane.” Two decades later, of course, Wessel’s “older work” was discovered.
Marcus du Sautoy provides a detailed look into the origin of complex number presentation [1]:
“Gauss [Carl Friedrich, (1777-1855)] had actually used a picture of the imaginary numbers as a mathematical tool in his proof [of the Fundamental Theorem of Algebra], but he kept it hidden for many years, fearing he would be laughed at by a mathematical establishment still wedded to the language of equations and formulae. But because the image was so powerful and gave imaginary numbers a physical reality, it was only a matter of time before others hit upon the idea. Two amateur mathematicians, the Dane [/Norwegian] Caspar Wessel [(1745-1818)] and the Swiss Jean Argand, independently proposed similar pictures in pamphlets they published. Argand, who was the last of the three to have the idea, is the person whose name became attached to the picture we now call the Argand diagram. Credit is rarely just.” [4]
What’s in the diagram?
Once the picture of these complex numbers became known, mathematicians realized how powerful this representation could be. Adding complex numbers was just like following two sets of directions, one after the other. Mathematicians also discovered the beautiful fact that multiplying numbers translated into rotating numbers around the point representing the number 0 which on the Argand diagram is called the origin. To find the direction of the product of two complex numbers, you join the point representing each number to the origin, and then add the angles these two lines make with the horizontal axis. Whereas, centuries before, algebra had thrown off its ties with geometry in order to develop, now progress was being made by moving in the opposite direction. It was like having a dictionary which translated the algebra of these numbers into geometry – two different languages for the same thing. The power of this dictionary was that certain ideas were much more self-evident in one language than in the other.

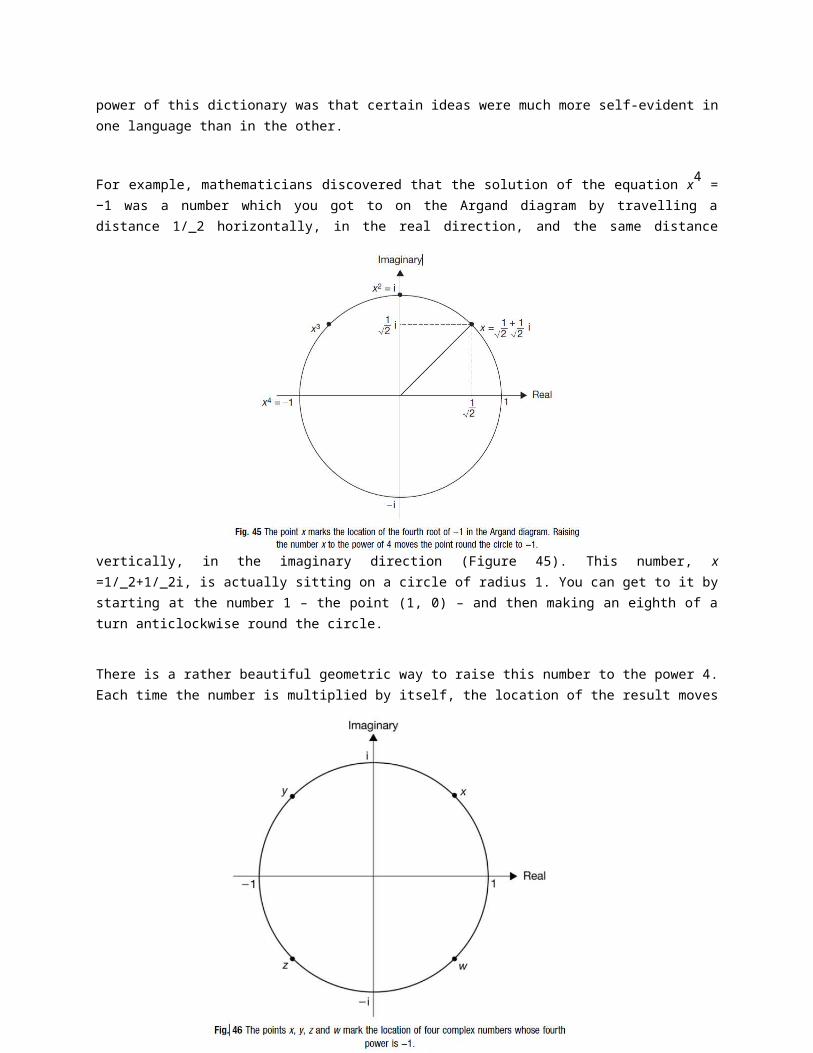
For example, mathematicians discovered that the solution of the equation x4 = −1 was a number which you got to on the Argand diagram by travelling a distance 1/_2 horizontally, in the real direction, and the same distance vertically, in the imaginary direction (Figure 45). This number, x =1/_2+1/_2i, is actually sitting on a circle of radius 1. You can get to it
by starting at the number 1 – the point (1, 0) – and then making an eighth of a turn anticlockwise round the circle.
There is a rather beautiful geometric way to raise this number to the power 4. Each time the number is multiplied by itself, the location of the result moves round the circle by an
eighth of a turn. After four spins we get to the number −1, the point (−1, 0) on the Argand diagram. The geometric language turns out
to be much simpler to play with than the algebra. Not only that, it also reveals that there are actually three other numbers which are solutions of the equation x4= −1. If you take any of the four points x, y, z or w on the circle and spin them in a similar way, they all land
on the number −1 (Figure 46). For example, the number y represents a spin of 3/8 of a turn from the number 1 on the real axis. To locate, repeat this turn four times and you get to the number −1. So there are actually four complex numbers that will solve this equation. The graphical depictions of these solutions and of the spins that get you from one solution
to another start to reveal the geometric symmetry that underlies an equation such as x4 = −1. Articulating this connection more explicitly would ultimately unlock both the secrets of equations and a new language to describe symmetry.
References:1. Orlando Merino: A Short History of Complex Numbers. University of Rhode
Island, 20062. B. L. van der Waerden, A History of Algebra, Springer Verlag, NY 19853. Nahin, Paul J, An Imaginary Tale. Princeton University Press, New Jersey 20074. Marcus du Sautoy: Symmetry. A Journey into the Patterns of Nature. First
Harper Perennial Edition, Harper Collins Publishers, New York, 2009


![Piano Solo] the World God Only Knows OP - God Only Knows](https://img.pdfslide.us/doc/110x75/577d22cf1a28ab4e1e984a78/piano-solo-the-world-god-only-knows-op-god-only-knows.jpg)