Embed Size (px)
Citation preview

Area VII: Global Change
VIIB: Global Warming
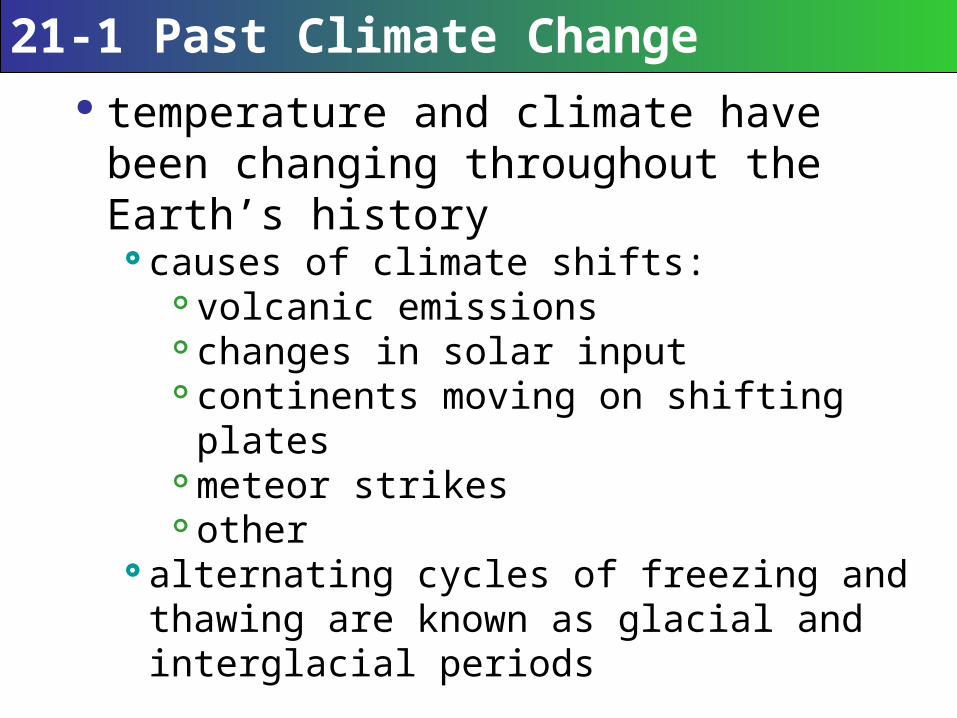
21-1 Past Climate Change temperature and climate have been
changing throughout the Earth’s history causes of climate shifts:
volcanic emissions changes in solar input continents moving on shifting plates meteor strikes other
alternating cycles of freezing and thawing are known as glacial and interglacial periods

Average temperature over past 900,000 years
Thousands of years ago
Ave
rag
e su
rfac
e te
mp
erat
ure
(°C
)
900 800 700 600 500 400 300 200 100 Present9
10
11
12
13
14
15
16
17
Fig. 21-2a Changes in temperature

Temperature change over past 22,000 years
Years ago
Tem
per
atu
re c
han
ge
(°C
)
20,000 10,000 2,000 1,000 200 100 Now
-5
-4
-3
-2
-1
0
1
2
End oflast iceage
Agriculture established
Average temperature over past10,000 years = 15°C (59°F)
Fig. 21-2b Changes in temperature
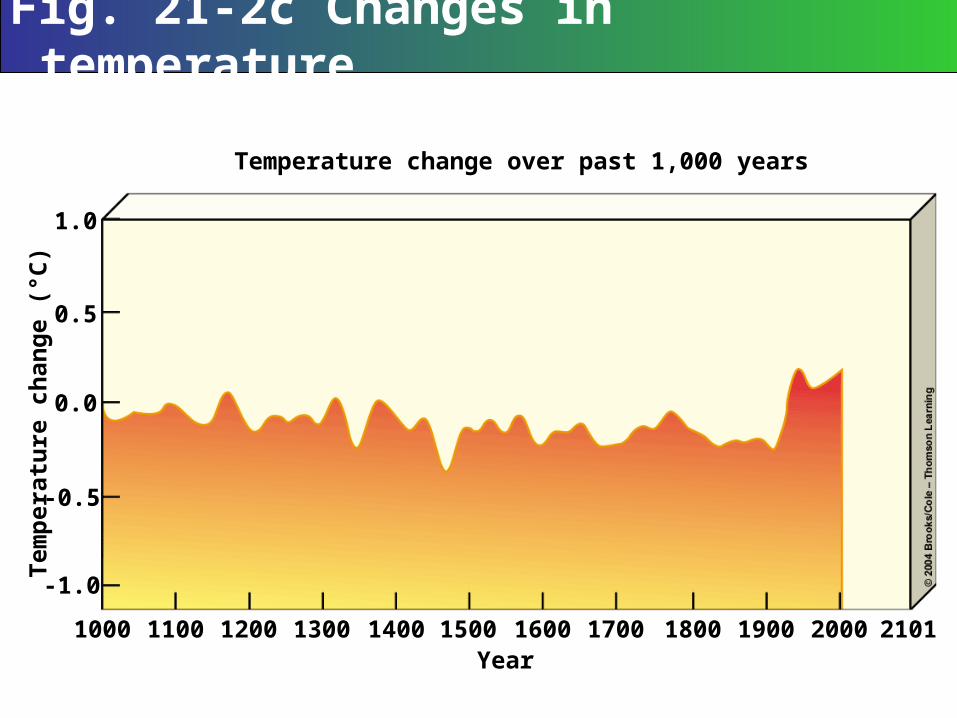
Temperature change over past 1,000 years
Year
Tem
per
atu
re c
han
ge
(°C
)
1000 1100 1200 1300 1400 1500 1600 1700 1800 1900 2000 2101
-1.0
-0.5
0.0
0.5
1.0
Fig. 21-2c Changes in temperature
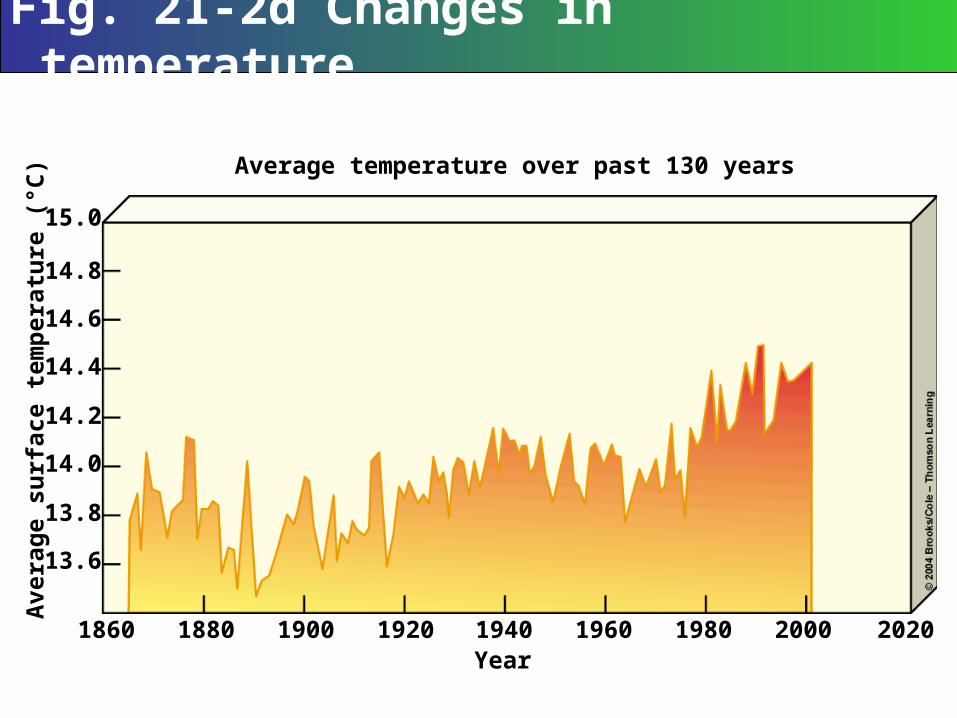
Average temperature over past 130 years
Year
Ave
rag
e su
rfac
e te
mp
erat
ure
(°C
)
1860 1880 1900 1920 1940 1960 1980 2000 2020
13.6
13.8
14.0
14.2
14.4
14.6
14.8
15.0
Fig. 21-2d Changes in temperature

21-1 Past Climate Change geologic records and atmospheric
measurements provide a wealth of information about past atmospheric temperatures and climate
Antarctic ice cores indicate the current interglacial period could last another 15,000 years
sediment cores are also analyzed for pollen, fossils, and other clues about the plant types that lived in the past
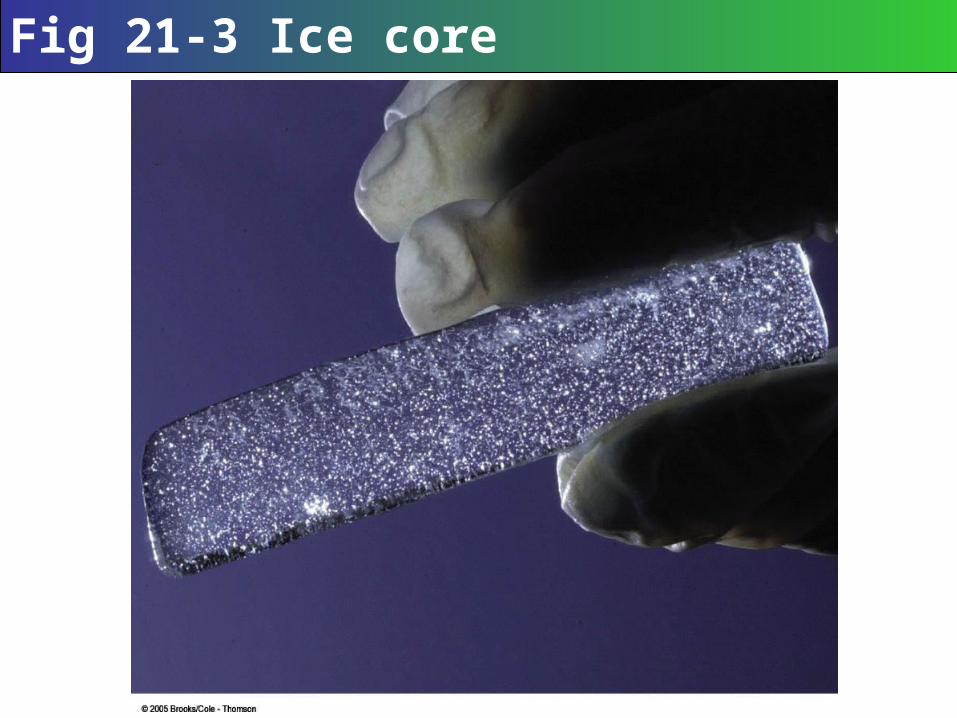
Fig 21-3 Ice core

21-1 Past Climate Change records, cont.
direct temperature records go back to 1861 air samples are collected at different locations
and analyzed for changes in chemical composition in the troposphere.
the Intergovernmental Panel on Climate Change (IPCC) evaluates possible future climate changes; levels of certainty:
virtually certain (more than 99% probability) very likely (90–99% probability) likely (66–90% probability)
21-2 Earth’s Natural Greenhouse Effect certain gases in the atmosphere absorb
heat and warm the lower atmosphere the greenhouse effect warms the lower
troposphere and surface surface water also absorbs heat the Earth’s average surface temperature is
about 15 degrees Celsius two major greenhouse gases: H2O, CO2
measurements of CO2 in glacial ice correlate w/ est. variations in the avg. global surface temperature during past 160,000 years


Fig 21-4 Atmospheric CO2 & temperature

21-3 Climate Change & Human Activities humans have increased levels of
greenhouse gases in the troposphere higher levels than in the past 160,000 years burning of fossil fuels -> CO2 increase deforestation and clearing grasslands release
CO2 and N2O cattle and livestock raising -> methane inorganic fertilizers in rice cultivation -> N2O

Fig 21-5a Carbon dioxide
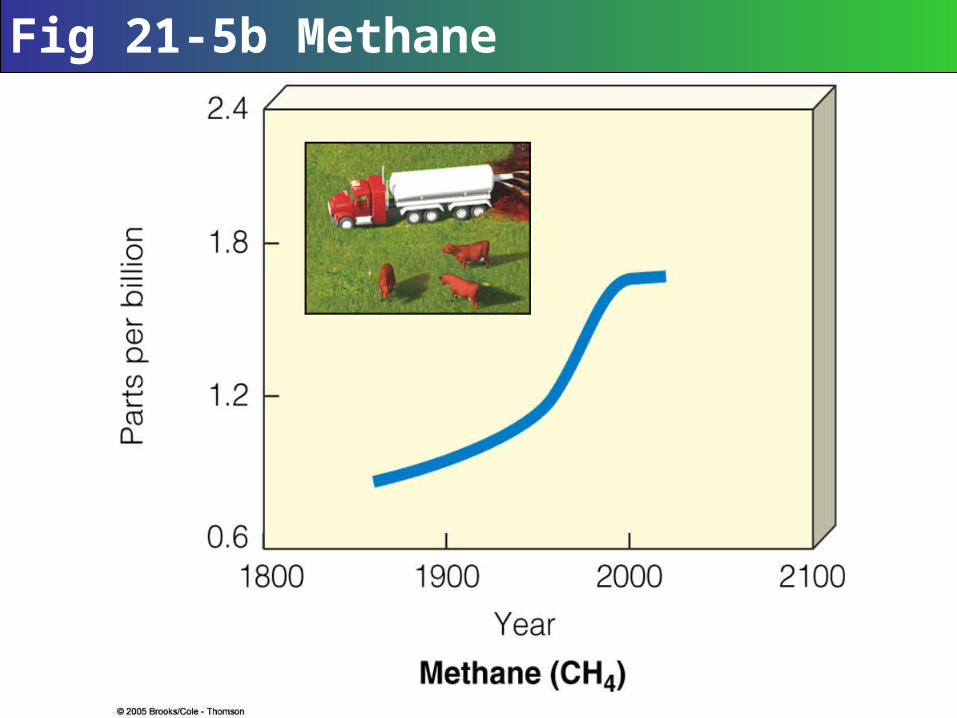
Fig 21-5b Methane
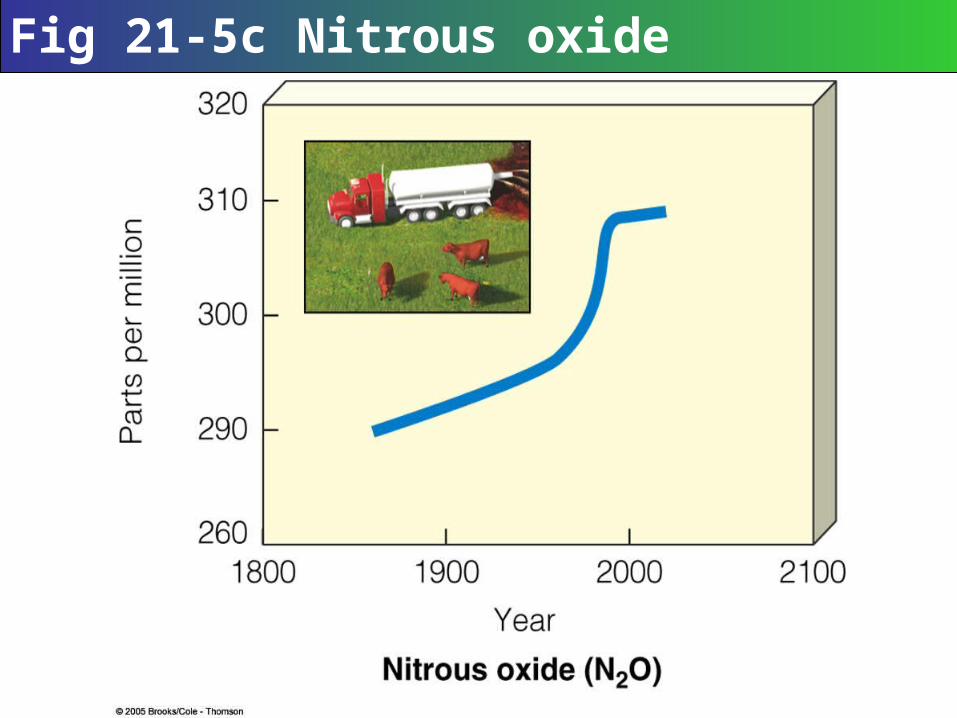
Fig 21-5c Nitrous oxide

21-3 Climate Change & Human Activities the U.S. releases more greenhouse gases
per person than any other country 4.6% of the world’s population, 24% of the total
global emissions the U.S. also emits large quantities of CH4 with
most coming from landfills, domestic livestock, natural gas, and oil and coal mining

21-3 Climate Change & Human Activities evidence of warming
five findings of the IPCC that support idea that the troposphere is very likely getting warmer:
the 20th century was the hottest century in the past 1,000 years
since 1861, the average global temperature has risen 0.6 degrees centigrade
16 warmest years have occurred since 1980 glaciers and floating sea ice in some parts
of the world are melting and shrinking average sea level rose by 0.1–0.2 meter

Fig 21-6a Arctic sea ice in 1979
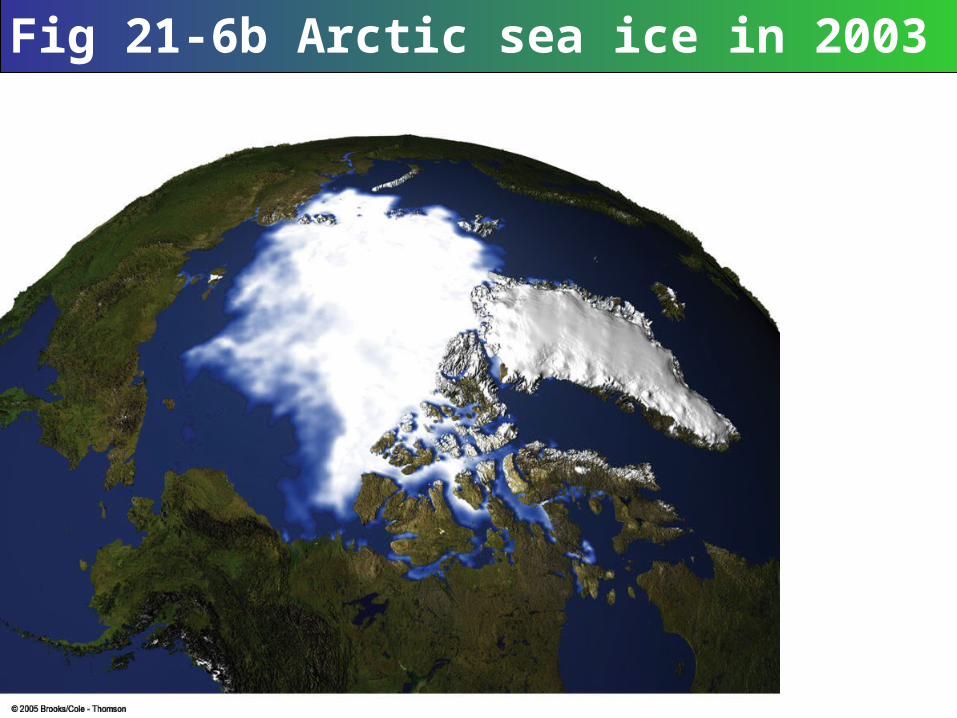
Fig 21-6b Arctic sea ice in 2003
21-3 Climate Change & Human Activities evidence of warming, cont.
global warming refers to temperature increases in the troposphere, which can cause climate change
global climate change is a broader term that refers to changes in any aspects of the Earth’s climate

21-3 Climate Change & Human Activities the melting of some of the world’s ice
results in less sunlight reflected into space, further increasing warming
increasing temperatures tend to be greater in the polar regions; early warning signs
floating ice is melting faster than it is being formed
it is not known whether the shrinkage of ice is a result of natural polar climate fluctuation or caused by man-made increases in greenhouse gases or a combination of these

Fig 21-7 Albedo

21-3 Climate Change & Human Activities melting ice, cont.
melting Arctic sea ice would shift the storm-guiding jet stream northward and change precipitation patterns
melting the Greenland ice sheet would raise sea levels by 7 meters (23 feet)
some glaciers are melting in Alaska there is an increase in infestation of the spruce
bark beetle loss of ice means a loss of reservoirs of water
for warmer months of the year
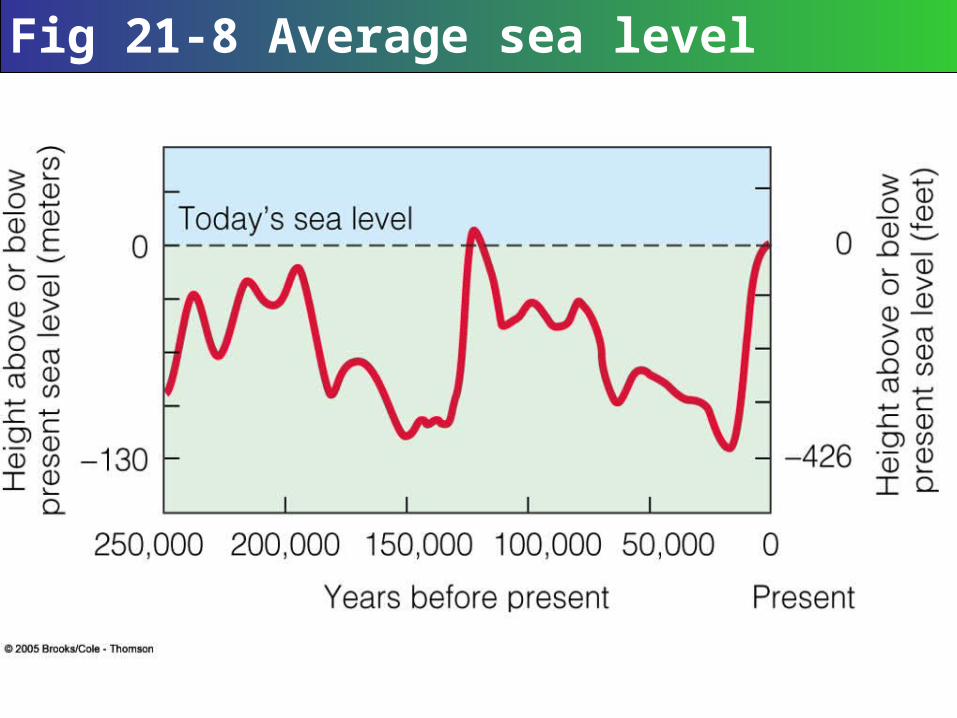
Fig 21-8 Average sea level
21-4 Projecting Future Changes scientists use complex mathematical
models to project future changes in the Earth’s average temperature
scientist develop global climate models called coupled global circulation models
develop a 3-D representation of how energy, air masses, and moisture flow through the atmosphere
models provide scenarios of what is very likely or likely to happen based on various assumptions and data fed into the model

Fig 21-9 Factors in warming, gases

Fig 21-10 Global circulation model

21-4 Projecting Future Changes many agree that human activities have and
will continue to affect Earth’s temperature three major findings of the IPCC 2001 report:
the latest climate models match the records of global temperature changes since 1850, very closely
“warming observed over the last 50 years is attributable to human activities.”
Earth’s mean surface temperature will increase by 1.4–5.8 degrees Celsius between 2000 and 2100

Fig 21-11 Projected temperature change

21-5 Factors Affecting Earth’s Temp. multiple natural and human-influenced
factors can affect projected changes in the average temperature of the troposphere
oceans help moderate Earth’s average surface temperature by absorbing both CO2 and heat
ocean currents are also important for storage of CO2 and transfer of heat
movement and speed of the ocean currents can alter temp. patterns in the N-hemisphere
changes in the hydrologic cycle may affect global precipitation patterns

Fig 21-12 Ocean circulation

21-5 Factors Affecting Earth’s Temp. change in the distribution of clouds is
largely unknown additional clouds may have a warming or
cooling effect factors:
amount of water vapor in the troposphere cloud thickness coverage altitude size and number of water droplets ice crystals formed in clouds
21-5 Factors Affecting Earth’s Temp. aerosol pollutants and soot can warm or
cool the troposphere some clouds have a high albedo and reflect
more sunlight back into space during the day warmer nights are due to clouds that prevent
stored heat from dissipating into space black carbon aerosols may be responsible for
15–30% of global warming during the past 50 years
aerosol pollutants not a major factor in global warming
21-5 Factors Affecting Earth’s Temp. increased CO2 in the troposphere could
increase photosynthesis and remove more CO2, but several factors can limit or offset this effect
CO2 can affect species composition in Amazon death of larger trees could lead to a decrease
in the amount of CO2 absorbed acceleration of global warming can occur
due to methane release from bogs and wetlands and from methane hydrates

21-6 Possible Effects of a Warmer World a warmer troposphere could have both
beneficial and harmful effects temperate countries might benefit tropical and subtropical countries might be
harmed possible changes/effects:
expand ranges and populations of plant and animal species that can adapt to warmer climates
threaten plants and animal species that can’t migrate rapidly enough to new areas
21-6 Possible Effects of a Warmer World possible changes/effects, cont.
loss of biodiversity increased tree diseases and pests more wildfires (?) ecosystem disruption (coral reefs, polar seas,
coastal wetlands, arctic and alpine tundra, and high-elevation mountaintops)
locations of food production (further north) less snow pack -> increasing water shortages

21-6 Possible Effects of a Warmer World possible changes/effects, cont.
crop and fish production could be reduced in some areas by rising sea levels that would flood river deltas
global sea level rise (88 cm?) threatening half the world’s estuaries,
wetlands, and coral reefs disrupting many of the world’s coastal
fisheries erosion of low-lying barrier islands and
gently sloping coastlines

21-6 Possible Effects of a Warmer World possible changes/effects, cont.
global sea level rise, cont. flooding in agricultural lowlands and deltas
where much of the world’s rice is grown contamination of freshwater coastal aquifers
with saltwater submergence of some low-lying islands in
the Pacific Ocean and Indian Ocean

21-7 Dealing with the Threat of Warming there is disagreement over what we should
do about the threat of global warming causes speed effects responses
economists and policymakers disagree on: economic costs vs. benefits responsibility voluntary or required reductions in emissions

21-7 Dealing with the Threat of Warming four schools of thought:
do nothing do more research before acting (precautionary) act now to reduce risks (precautionary) act now as part of a no-regrets strategy (?)
three major strategies to slow warming: improve energy efficiency shift to a mix of carbon-free renewable energy
resources sequester or store CO2

21-7 Dealing with the Threat of Warming we can remove and store some CO2
biomass soil sequestration is a possibility reduce release of CO2 and nitrous oxide from
soil by altering agriculture practices to include no-till cultivation and letting fields lie fallow
remove CO2 from smokestacks and pump it deep underground or inject it into the deep ocean
add iron to the oceans to increase production of algae to increase photosynthesis
21-7 Dealing with the Threat of Warming governments can:
tax emissions and energy use (bad idea) increase subsidies (bad idea) and tax breaks
for saving energy (good idea) decrease subsidies (good idea) and tax breaks
for using fossil fuels (bad idea) establish global emissions trading program
agree to global and national limits on greenhouse gas emissions and encourage its use by selling and trading greenhouse gas permits in the marketplace
21-7 Dealing with the Threat of Warming costs:
costs of global warming: $300 billion annually worldwide by 2050
costs of preventing global warming: $600 billion annually in the U.S. alone $7 trillion by 2029 in the U.S. 800,000 lost jobs every year for several
years “some economic models…do not include the
huge cost savings of the strategies and they underestimate the ability of the marketplace”

21-8 What Is Being Done? the Kyoto Protocol, developed in 1997,
would require 39 developed countries to cut emissions of some gases by about 5.2% below 1990 levels by 2012
developing countries would not have to make cuts until a later date
> 120 countries ratified it by mid-2004 in 2001, President George W. Bush withdrew
the U.S. from the Kyoto Protocol Scott Barnett believes the Kyoto Protocol is a
badly thought out agreement that won’t work

21-8 What Is Being Done? countries could work together to develop a
new international approach support and action is needed by the world’s
largest greenhouse gas emitters the U.S., China, Russia, and India
set technological goals and standards, not targets and timetables

21-8 What Is Being Done? many countries, companies, cities, states,
and provinces are reducing greenhouse gas emissions, improving energy efficiency, and increasing their use of carbon-free renewable energy
Great Britain reduced its CO2 emissions to its 1990 level by the year 2000
China reduced CO2 emissions by 17% between 1997 and 2000
some companies have established targets to reduce their greenhouse gas emissions

21-8 What Is Being Done? a growing number of countries and cities
are looking for ways to cope with the harmful effects of climate change
estimates are that current emissions of greenhouse gases must be cut by at least 50% by 2018 to stabilize concentrations at their present levels
for political and economic reasons, such a reduction is extremely unlikely
we should begin to prepare for possible effects of long-term atmospheric warming