Embed Size (px)
Citation preview


Area of Review and Corrective Action Plan for FutureGen Alliance Page B1 of 46
Permit Number: IL-137-6A-0003 (Well #3)
ATTACHMENT B: AREA OF REVIEW AND CORRECTIVE ACTION PLAN
Facility Information
Facility Name: FutureGen 2.0 Morgan County CO2 Storage Site
IL-137-6A-0003 (Well #3)
Facility Contacts: Kenneth Humphreys, Chief Executive Officer,
FutureGen Industrial Alliance, Inc., Morgan County Office,
73 Central Park Plaza East, Jacksonville, IL 62650, 217-243-8215
Location of Injection Well: Morgan County, IL; 26−16N−9W; 39.800266ºN and 90.07469ºW
Computational Modeling
Model Name: STOMP-CO2 (Subsurface Transport Over Multiple Phases-CO2) simulator
Model Authors/Institution: White et al. 2013; White and Oostrom 2006; White and McGrail
2005/Pacific Northwest National Laboratory (PNNL)
Description of Model:
The simulations conducted for this investigation were executed using the STOMP-CO2
simulator (White et al. 2013; White and Oostrom 2006; White and Oostrom 2000). STOMP-CO2
was verified against other codes used for simulation of geologic disposal of CO2 as part of the
GeoSeq code intercomparison study (Pruess et al. 2002).
Partial differential conservation equations for fluid mass, energy, and salt mass compose the
fundamental equations for STOMP-CO2. Coefficients within the fundamental equations are
related to the primary variables through a set of constitutive relationships. The salt transport
equations are solved simultaneously with the component mass and energy conservation
equations. The solute and reactive species transport equations are solved sequentially after the
coupled flow and transport equations. The fundamental coupled flow equations are solved using
an integral volume finite-difference approach with the nonlinearities in the discretized equations
resolved through Newton-Raphson iteration. The dominant nonlinear functions within the
STOMP-CO2 simulator are the relative permeability-saturation-capillary pressure (k-s-p)
relationships.
The STOMP-CO2 simulator allows the user to specify these relationships through a large variety
of popular and classic functions. Two-phase (gas-aqueous) k-s-p relationships can be specified
with hysteretic or nonhysteretic functions or nonhysteretic tabular data. Entrapment of CO2 with
imbibing water conditions can be modeled with the hysteretic two-phase k-s-p functions. Two-
phase k-s-p relationships span both saturated and unsaturated conditions. The aqueous phase is
assumed to never completely disappear through extensions to the s-p function below the residual
Area of Review and Corrective Action Plan for FutureGen Alliance Page B2 of 46
Permit Number: IL-137-6A-0003 (Well #3)
saturation and a vapor pressure lowering scheme. Supercritical CO2 has the function of a gas in
these two-phase k-s-p relationships.
For the range of temperature and pressure conditions present in deep saline reservoirs, four
phases are possible: 1) water-rich liquid (aqueous), 2) CO2-rich vapor (gas), 3) CO2-rich liquid
(liquid-CO2), and 4) crystalline salt (precipitated salt). The equations of state express 1) the
existence of phases given the temperature, pressure, and water, CO2, and salt concentration; 2)
the partitioning of components among existing phases; and 3) the density of the existing phases.
Thermodynamic properties for CO2 are computed via interpolation from a property data table
stored in an external file. The property table was developed from the equation of state for CO2
published by Span and Wagner (1996). Phase equilibria calculations in STOMP-CO2 use the
formulations of Spycher et al. (2003) for temperatures below 100°C and Spycher and Pruess
(2010) for temperatures above 100°C, with corrections for dissolved salt provided in Spycher
and Pruess (2010). The Spycher formulations are based on the Redlich-Kwong equation of state
with parameters fitted from published experimental data for CO2-H2O systems. Additional
details regarding the equations of state used in STOMP-CO2 can be found in the guide by White
et al. (2013).
A well model is defined as a type of source term that extends over multiple grid cells, where the
well diameter is smaller than the grid cell. A fully coupled well model in STOMP-CO2 was used
to simulate the injection of supercritical CO2 (scCO2) under a specified mass injection rate,
subject to a pressure limit. When the mass injection rate can be met without exceeding the
specified pressure limit, the well is considered to be flow controlled. Conversely, when the mass
injection rate cannot be met without exceeding the specified pressure limit, the well is considered
to be pressure controlled and the mass injection rate is determined based on the injection
pressure. The well model assumes a constant pressure gradient within the well and calculates the
injection pressure at each cell in the well. The CO2 injection rate is proportional to the pressure
gradient between the well and surrounding formation in each grid cell. By fully integrating the
well equations into the reservoir field equations, the numerical convergence of the nonlinear
conservation and constitutive equations is greatly enhanced.
Model Inputs and Assumptions:
Conceptual Model
Site Stratigraphy
The regional geology of Illinois is well known from wells and borings drilled in conjunction with
hydrocarbon exploration, aquifer development and use, and coal and commercial mineral
exploration. Related data are largely publicly available through the Illinois State Geological
Survey (ISGS)1
and the U.S. Geological Survey.2 In addition, the U.S. Department of Energy has
sponsored a number of studies by the Midwest Geologic Sequestration Consortium3 to evaluate
subsurface strata in Illinois and adjacent states as possible targets for the containment of
anthropogenic CO2.
1 http://www.isgs.uiuc.edu/
2 http://www.usgs.gov/
3 http://sequestration.org/

Area of Review and Corrective Action Plan for FutureGen Alliance Page B3 of 46
Permit Number: IL-137-6A-0003 (Well #3)
To support the evaluation of the Morgan County site as a potential carbon storage site, a deep
stratigraphic well was drilled and extensively characterized. The FutureGen 2.0 stratigraphic
well, located at longitude 90.05298W, latitude 39.80681N, is approximately 1.24 mi (2 km)
northeast of the planned injection site. The stratigraphic well reached a total depth of 4,826 ft
(1,471 m) bgs within the Precambrian basement (Figure 1). The well penetrated 479 ft (146 m)
of the Eau Claire Formation and 512 ft (156 m) of the Mount Simon Sandstone. The stratigraphic
well was extensively characterized, sampled, and geophysically logged during drilling. A total of
177 ft of whole core were collected from the lower Eau Claire Formation and upper Mount
Simon Sandstone and 34 ft were collected from lower Mount Simon Sandstone and Precambrian
basement interval. In addition to whole drill core, a total of 130 side-wall core plugs were
obtained from the combined interval of the Eau Claire Formation, Mount Simon Sandstone, and
the Precambrian basement. In Figure 2, cored intervals are indicated with red bars; rotary side-
wall core and core-plug locations are indicated to the left of the lithology panel. Standard gamma
ray and resistivity curves are shown in the second panel.

Area of Review and Corrective Action Plan for FutureGen Alliance Page B4 of 46
Permit Number: IL-137-6A-0003 (Well #3)
Figure 1. Stratigraphic Column of FutureGen 2.0 Stratigraphic Well

Area of Review and Corrective Action Plan for FutureGen Alliance Page B5 of 46
Permit Number: IL-137-6A-0003 (Well #3)
Figure 2. Lithology, Mineralogy, and Hydrologic Units of the Proposed Injection Zone (Mount Simon,
Elmhurst and Lower Lombard member) and Lower Primary Confining Zone (Upper Lombard), as
Encountered Within the Stratigraphic Well
Geologic Structures
Two orthogonal two-dimensional (2D) surface seismic lines, shown in Figure 3, were acquired
along public roads near the site and processed in January and February 2011. Surface seismic
data were acquired as single-component data. The seismic data are not of optimal quality due to
loss of frequency and resolution below a two-way time depth of about 300 milliseconds (ms),
approximately coincident with the top of the Galena limestone at a depth of 1,400 ft. However,
they do not indicate the presence of obvious faults or large changes in thickness of the injection
or confining zones. Both profiles indicate a thick sequence of Paleozoic-aged rocks with a
contact between Precambrian and Mount Simon at 640 ms and a contact between Eau Claire and
Mount Simon at 580 ms.
Some vertical disruptions, which extend far below the sedimentary basin, remain after
reprocessing in 2012, but their regular spatial periodicity has a high probability of being an
artifact during data acquisition and processing and is unlikely related to faults.
No discernable faults have been identified on the 2D data within the immediate area. A small
growth fault that affects the Mount Simon and Eau Claire formations is interpreted in the eastern
part of the L201 profile at an offset 28,000 ft. This growth fault is more than 1.5 miles away
from the outermost edge of the CO2 plume and does not extend far upward in the overburden.
For these reasons, it is highly unlikely that it could affect the integrity of the injection zone.

Area of Review and Corrective Action Plan for FutureGen Alliance Page B6 of 46
Permit Number: IL-137-6A-0003 (Well #3)
Figure 3. Locations of Two 2D Seismic Survey Lines, L101 and L201, Vertical Seismic Profile Locations, and
the Knox Line Near the Proposed Morgan County CO2 Storage Site
A three-component vertical seismic profiling (VSP) data set (Figure 3) was acquired in the
FutureGen stratigraphic well in March 2013, and processed by Schlumberger Carbon Services.
No discernable faults are present in the 15 short 2D seismic lines formed by the offset VSP
locations. These lines represent a lateral interrogation extent of 800−1600 ft radially from the
stratigraphic well. The high-resolution, low-noise VSP data also do not contain the vertical
disruptions observed in the 2D surface seismic profiles (Hardage 20134).
The ISGS recently shot a 120-mi long seismic reflection survey (the Knox Line) across central
Illinois as part of a Department of Energy-sponsored research project to characterize rock units
for geologic storage of CO2. The continuous east-west line extends from Meredosia to
southwestern Champaign County (Figure 3). FutureGen Industrial Alliance, Inc., (FutureGen
Alliance) acquired these data from the ISGS with the intention of reprocessing the data, if
needed, to identify regional faults that might impact the proposed FutureGen 2.0 Morgan County
CO2 Storage Site (FutureGen 2.0 Site). A review of the data by a geophysical expert on Illinois
reflection seismic data5, indicated that there was no discernable faulting west of Ashland,
4 Bob Hardage. Personal Communication with Charlotte Sullivan, August 1, 2013.
5 John McBride. Personal Communication with Charlotte Sullivan, October 29, 2013.

Area of Review and Corrective Action Plan for FutureGen Alliance Page B7 of 46
Permit Number: IL-137-6A-0003 (Well #3)
Illinois; and that current plans to reprocess the ISGS Knox line would not likely result in a
greatly improved image.
The closest known earthquake to the FutureGen 2.0 Site (Intensity VII, magnitude 4.8 – non-
instrumented record) occurred on July 19, 1909, approximately 28 mi (45 km) north of the site; it
caused slight damage. Most of the events in Illinois occurred at depths greater than 1.9 mi (3
km).
Conceptual Model Domain
A stratigraphic conceptual model of the geologic layers from the Precambrian basement to
ground surface was constructed using the EarthVision® software package. The geologic setting
and site characterization data described in the Underground Injection Control (UIC) Permit
Supporting Documentation and later in this section were the basis for the Morgan County CO2
storage site computational model. Borehole data from the FutureGen 2.0 stratigraphic well and
data from regional boreholes and published regional contour maps were used as input data
(Figure 4, step 1). There is a regional dip of approximately 0.25 degrees in the east-southeast
direction (Figure 4, step 2). The model domain consists of the injection zone (the Mount Simon,
the Elmhurst, and the lower part of the Lombard), the primary confining zone (the upper part of
the Lombard and the Proviso), the Ironton-Galesville, and the secondary confining zone (Davis-
Ironton and the Franconia). The tops of the Mount Simon and the Franconia and the bottom of
Mount Simon in the simulation domain were gridded in EarthVision® based on borehole data
and regional contour maps and make up the stratigraphic layers of the computational model. The
formations above the Mount Simon top were further divided into multiple finer layers, whose
thicknesses are proportional to those of the corresponding layers at the stratigraphic well. The
Mount Simon formation was divided into multiple layers and any intrusion of the Precambrian
was considered inactive. The boundary-fitted numerical model grid in the horizontal directions
was designed to have constant grid spacing with higher resolution in the area influenced by the
CO2 injection (3- by 3-mi area), with increasingly larger grid spacing moving out toward the
domain boundary.
The conceptual model hydrogeologic layers were defined for each stratigraphic layer based on
zones of similar hydrologic properties. The hydrologic properties (permeability, porosity) were
deduced from geophysical well logs and side-wall cores. The lithology, deduced from wireline
logs and core data, was also used to subdivide each stratigraphic layer of the model. Based on
these data, the Mount Simon Sandstone was subdivided into 17 layers, and the Elmhurst
Sandstone (member of the Eau Claire Formation) was subdivided into 7 layers (Figure 4). The
Lombard and Proviso members of the Eau Claire Formation were subdivided respectively into
14 and 5 layers. The Ironton Sandstone was divided into four layers, the Davis Dolomite into
three layers, and the Franconia Formation into one layer. Some layers (“split” label in Figure 4,
step 2) have similar properties but have been subdivided to maintain a reasonable thickness of
layers within the injection zone as represented in the computational model. The thickness of the
layers varies from 4 to 172 ft, with an average of 26 ft.
Based on knowledge of the regional and local geology, the Mount Simon Sandstone and the
Elmhurst form the main part of the injection zone. However, the computational model results
indicate that the Model Layer “Lombard 5” is the top unit containing a fraction of injected CO2

Area of Review and Corrective Action Plan for FutureGen Alliance Page B8 of 46
Permit Number: IL-137-6A-0003 (Well #3)
during the 100-year simulation. Based on these results, the lower part of the Lombard (layers
Lombard 1 to 5 of the Computational Model), is considered to be part of the injection zone
(Figure 4). The top of the injection zone is set at 3,785 ft below ground surface (-3,153 ft
elevation MSL) in the stratigraphic well. The upper part of the Lombard and the Proviso
members form the primary confining zone.
Figure 4, step 3, shows the numerical model grid for the entire 100- by 100-mi domain and also
for the 3- by 3-mi area with higher grid resolution and uniform grid spacing of 200 ft by 200 ft.
The model grid contains 125 nodes in the x-direction, 125 nodes in the y-direction, and 51 nodes
in the z-direction for a total number of nodes equal to 796,875. The expanded geologic model
was queried at the node locations of the numerical model to determine the elevation of each
surface for the stratigraphic units at the numerical model grid cell centers (nodes) and cell edges.
Then each of those layers was subdivided into the model layers by scaling the thickness to
preserve the total thickness of each stratigraphic unit. Once the vertical layering was defined,
material properties were mapped to each node in the model.

Area of Review and Corrective Action Plan for FutureGen Alliance Page B9 of 46
Permit Number: IL-137-6A-0003 (Well #3)
Figure 4. Implementation of the Numerical Model: From the Geological Conceptual Model to the Numerical
Model

Area of Review and Corrective Action Plan for FutureGen Alliance Page B10 of 46
Permit Number: IL-137-6A-0003 (Well #3)
Processes Modeled
Physical processes modeled in the reservoir simulations included isothermal multi-fluid flow and
transport for a number of components (e.g., water, salt, and CO2) and phases (e.g., aqueous and
gas). Isothermal conditions were modeled because it was assumed that the temperature of the
injected CO2 will be similar to the formation temperature. Formation salinity is considered
because salt precipitation can occur near the injection well in higher permeability layers as the
rock dries out during CO2 injection. Porosity reduction due to salt precipitation is considered in
the model. However, permeability reduction was not modeled because the salinity is relatively
low in the injection formations at this site, resulting in low levels of salt precipitation.
Injected CO2 partitions in the injection zone between the free (or mobile) gas, entrapped gas, and
aqueous phases. Sequestering CO2 in deep saline formations occurs through four mechanisms: 1)
structural trapping; 2) aqueous dissolution; 3) hydraulic trapping; and 4) mineralization.
Structural trapping is the long-term retention of the buoyant gas phase in the pore space of the
permeable formation rock held beneath one or more impermeable or near impermeable confining
zones. Aqueous dissolution occurs when CO2 dissolves in the brine resulting in an aqueous-
phase density greater than the ambient conditions. Hydraulic trapping is the pinch-off trapping of
the gas phase in pores as the brine re-enters pore spaces previously occupied by the gas phase.
Generally, hydraulic trapping only occurs upon the cessation of CO2 injection. Mineralization is
the chemical reaction that transforms formation minerals to carbonate minerals. In the Mount
Simon Sandstone, the most likely precipitation reaction is the formation of iron carbonate
precipitates. A likely reaction between CO2 and shale is the dewatering of clays. Laboratory
investigations are currently quantifying the importance of these reactions at the Morgan County
CO2 storage site. Based on its experiments, the FutureGen Alliance expects to see a small mass
of precipitates (KCl, NaCl) forming near the injection well from the scCO2 displacement of
water, and does not expect to see the formation of any significant carbonate precipitates in the
year (or years) time scale. Iron does precipitate, but concentrations are too low (<0.6 mmol/L)
relative to carbonate mass to be a precipitate issue. Simulations by others (White et al. 2005) of
scCO2 injection in a similar sandstone (also containing iron oxides) shows that over significantly
longer time scales (1000+ years), alumino silicate dissolution and alumino silicate precipitation
incorporating significant carbonate (dawsonite) is predicted, as well as precipitation of some
calcite. That predicted mineral trapping did permanently sequester 21 percent of the carbonate
mass, thus decreasing scCO2 transport risk. Therefore, the simulations described here did not
include mineralization reactions. However, the STOMP-CO2 simulator does account for
precipitation of salt during CO2 injection. The CO2 stream provided by the plant to the storage
site is no less than 97 percent dry basis CO2. Because the amount of impurities is small, for the
purposes of modeling the CO2 injection and redistribution for this project, it was assumed that
the injectate was pure CO2.
Area of Review and Corrective Action Plan for FutureGen Alliance Page B11 of 46
Permit Number: IL-137-6A-0003 (Well #3)
Rock Properties
Intrinsic Permeability
Site Characterization Data
Permeability in the sandstones, as measured in rotary side-wall cores and plugs from whole core,
appears to be dominantly related to grain size and abundance of clay. In Figure 2, ELAN
(Elemental Log Analysis)-calculated permeability (red curve) is in the third panel, along with
two different lab measurements of permeability for each rotary side-wall core. Horizontal
permeability (Kh) data in the stratigraphic well outnumber vertical permeability (Kv) data,
because Kh could not be determined from rotary side-wall cores. However, Kv/Kh ratios were
successfully determined for 20 vertical/horizontal siliciclastic core-plug pairs cut from intervals
of whole core. Within the Mount Simon Sandstone, the horizontal permeabilities of the lower
Mount Simon alluvial fan lithofacies range from 0.005 to 0.006 mD and average ratios of
vertical to horizontal permeabilities range from 0.635 to 0.722 (at the 4,318 to 4,388 ft KB depth
or the elevation of -3,685 to -3,755 ft, Figure 2). Horizontal core-plug permeabilities range from
0.032 to 2.34 mD at the 3,852 to 3,918 ft KB depth (elevation of -3,219 to -3,285 ft); Kv/Kh
ratios for these same samples range from 0.081 to 0.833.
The computed lithology track for the primary confining zone indicates the upward decrease in
quartz silt and increase in carbonate in the Proviso member, along with a decrease in
permeability. The permeabilities of the rotary side-wall cores in the Proviso range from 0.000005
mD to 1 mD. Permeabilities in the Lombard member range from 0.001 mD to 28 mD, reflecting
the greater abundance of siltstone in this interval, particularly in the lowermost part of the
member. Whole core plugs and associated vertical permeabilities are available only from the
lowermost part of the Lombard. Thin (few inches/centimeters), high-permeability sandstone
streaks resemble the underlying Elmhurst; low-permeability siltstone and mudstone lithofacies
have vertical permeabilities of 0.0004 to 0.465 mD, and Kv/Kh ratios of <0.0001 to 0.17.
The ELAN geophysical logs indicated permeabilities are generally less than the wireline tool
limit of 0.01 mD throughout the secondary confining zone. Two rotary side-wall cores were
taken from the Franconia, and three side-wall cores were cut in the Davis member. Laboratory-
measured rotary side-wall core (horizontal) permeabilities are very low (0.000005 to 0.001 mD).
The permeabilities of the two Franconia samples were measured with a special pulse decay
permeameter; the sample from 3,140 ft bgs (-2521 ft elevation) has a permeability less than the
lower instrument limit of 0.000005 mD. Vertical core plugs are required for directly determining
vertical permeability and there are no data from the stratigraphic well for vertical permeability or
for determining vertical permeability anisotropy in the secondary confining zone. However,
Kv/Kh ratios of 0.007 have been reported elsewhere for Paleozoic carbonate mudstones (Saller et
al. 2004).
Area of Review and Corrective Action Plan for FutureGen Alliance Page B12 of 46
Permit Number: IL-137-6A-0003 (Well #3)
Model Parameters
Intrinsic permeability data sources for the FutureGen 2.0 stratigraphic well include computed
geophysical wireline surveys (CMR and ELAN logs), and where available, laboratory
measurements of rotary side-wall cores (SWC), core plugs from the whole core intervals,
hydrologic tests (including wireline [MDT]), and packer tests. For the Mount Simon and
Elmhurst Sandstones model layers (3,852 to 4,432 ft KB depth or elevation of -3219 to -3799 ft
at the stratigraphic well), wireline ELAN permeability model permKCal produced by
Schlumberger (red curve on Figure 2) was used. This model, calibrated by rotary side-wall and
core-plug permeabilities, provides a continuous permeability estimate over the entire injection
zone. This calibrated permeability response was then slightly adjusted, or scaled, to match the
composite results obtained from the hydrologic packer tests over uncased intervals. For injection
zone model layers within the cased well portion of the model, no hydrologic test data are
available, and core-calibrated ELAN log response was used directly in assigning average model
layer permeabilities.
The hydraulic packer tests were conducted in two zones of the Mount Simon portion of the
injection zone. The Upper Zone (3,948 ft to 4,194 ft KB depth or -3,315 to -3,561 ft elevation)
equates to layers 6 through 17 of the model, while the Lower Zone (4,200 ft to 4,512 ft KB depth
or -3,567 to -3,879 ft elevation) equates to layers 1 through 5. The most recent ELAN-based
permeability-thickness product values are 9,524 mD-ft for the 246-ft-thick section of the upper
Mount Simon corresponding to the Upper Zone and 3,139 mD-ft for the 312-ft-thick section of
the lower Mount Simon corresponding to the Lower Zone. The total permeability-thickness
product for the open borehole Mount Simon is 12,663 mD-ft, based on the ELAN logs. Results
of the field hydraulic tests suggest that the upper Mount Simon permeability-thickness product is
9,040 mD-ft and the lower Mount Simon interval permeability-thickness product is 775 mD-ft.
By simple direct comparison, the packer test for the upper Mount Simon is nearly equivalent
(~95 percent) to the ELAN-predicted value, while the lower Mount Simon represents only ~25
percent of the ELAN-predicted value.
Because no hydrologic test has been conducted in the Elmhurst Sandstone interval of the
injection zone, a conservative scaling factor of 1 has been assigned to this interval, based on
ELAN PermKCal data (The permeabilities used for this formation were the ELAN PermKCal
values without applying a scaling factor). The sources of data for confining zones (Franconia to
Upper part of the Lombard Formations) and the Upper part of the Injection zone (Lower part of
the Lombard) are similar to those for the injection zone, with the exception that no hydrologic or
MDT test data are available. ELAN log-derived permeabilities are unreliable below about 0.01
mD (personal communication from Bob Butsch, Schlumberger, 2012). Because the average log-
derived permeabilities (permKCal wireline from ELAN log) for most of the confining zone
layers are at or below 0.01 mD, an alternate approach was applied. For each model layer the core
data were reviewed, and a simple average of the available horizontal Klinkenburg permeabilities
was then calculated for each layer. Core samples that were noted as having potential cracks
and/or were very small were eliminated if the results appeared to be unreasonable based on the
sampled lithology. If no core samples were available and the arithmetic mean of the PermKCal
was below 0.01 mD, a default value of 0.01 mD was applied (Lombard9 is the only layer with a
0.01-mD default value). Because the sandstone intervals of the Ironton-Galesville Sandstone
have higher permeabilities that are similar in magnitude to the modeled injection zone layers, the
Ironton-Galesville Sandstone model layer permeabilities were derived from the arithmetic mean

Area of Review and Corrective Action Plan for FutureGen Alliance Page B13 of 46
Permit Number: IL-137-6A-0003 (Well #3)
of the PermKCal permeability curve. Because no hydraulic test has been conducted in the
primary confining zone and the Upper part of the injection zone (Elmhurst Sandstone layers and
lower part of the Lombard – Lombard 1 to Lombard 5), the scaling factor was assigned to be 100
percent in this interval and the overburden formations. Figure 5 shows the depth profile of the
horizontal permeability assigned to each layer of the model and actual values assigned are listed
in Table 1. Figure 6 shows the distribution of horizontal and vertical permeability as it was
assigned to the numerical model grid.
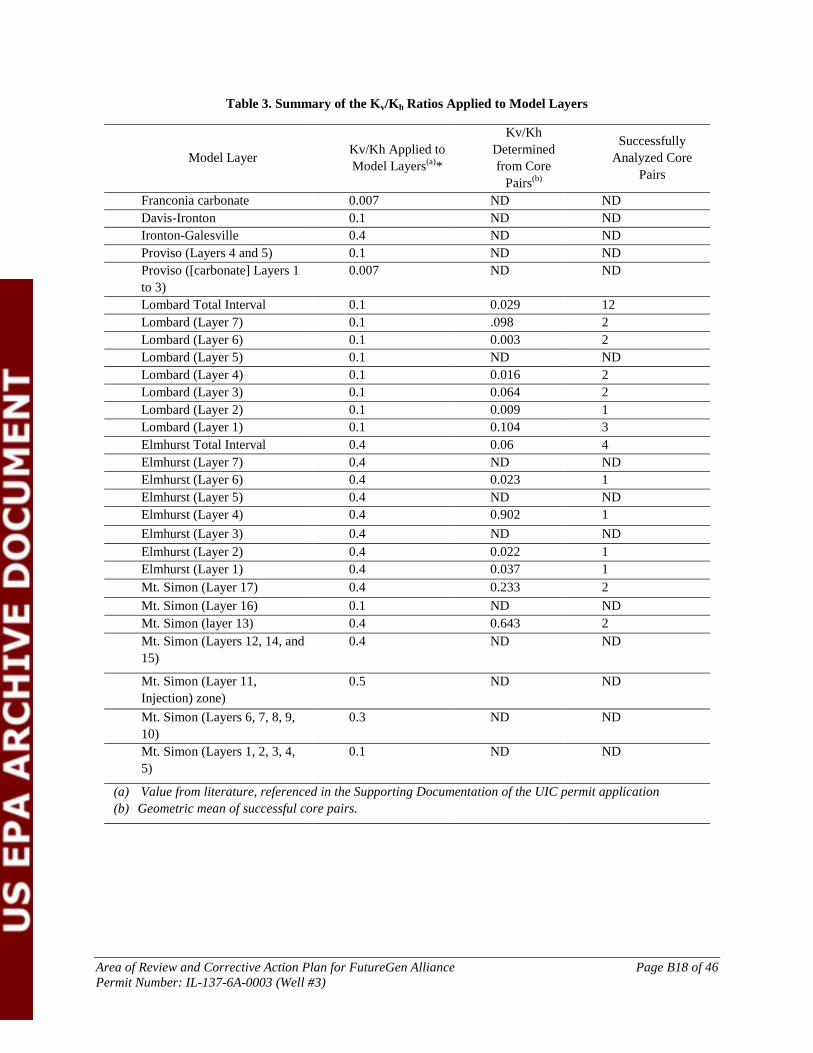
Because the anisotropy of the model layers is not likely to be represented by the sparse data from
the stratigraphic well, the lithology-specific permeability anisotropy averages from literature
studies representing larger sample sizes were used for the model layers (Table 2 and Table 3).
Figure 5. Vertical Distribution of the Horizontal Permeability in the Model Layers at the Stratigraphic Well
Location

Area of Review and Corrective Action Plan for FutureGen Alliance Page B14 of 46
Permit Number: IL-137-6A-0003 (Well #3)
(a) (b)
Figure 6. Permeability Assigned to Numerical Model 1) Horizontal Permeability; b) Vertical Permeability

Area of Review and Corrective Action Plan for FutureGen Alliance Page B15 of 46
Permit Number: IL-137-6A-0003 (well #3)
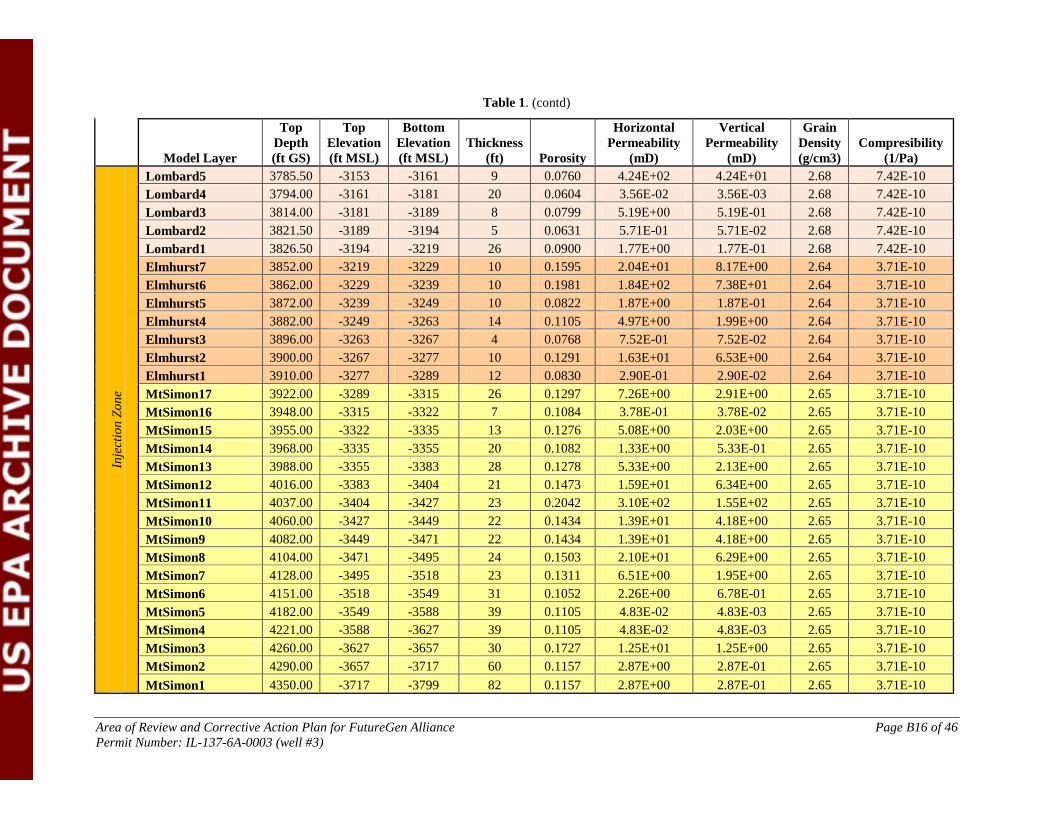
Table 1. Summary of the Hydrologic Properties Assigned to Each Model Layer. Depths and Elevations Correspond to the Location of the Stratigraphic
Well
Simulation -
CM22
Model Layer
Top
Depth
(ft GS)
Top
Elevation
(ft MSL)
Bottom
Elevation
(ft MSL)
Thickness
(ft) Porosity
Horizontal
Permeability
(mD)
Vertical
Permeability
(mD)
Grain
Density
(g/cm3)
Compresibility
(1/Pa)
Sec
on
da
ry
Co
nf.
Zo
ne Franconia 3086.00 -2453 -2625 172 0.0358 5.50E-06 3.85E-08 2.82 7.42E-10
Davis-Ironton3 3258.00 -2625 -2649 24 0.0367 6.26E-02 6.26E-03 2.73 3.71E-10
Davis-Ironton2 3282.00 -2649 -2673 24 0.0367 6.26E-02 6.26E-03 2.73 3.71E-10
Davis-Ironton1 3306.00 -2673 -2697 24 0.0218 1.25E+01 1.25E+00 2.73 3.71E-10
Ironton-
Galesville4 3330.00 -2697 -2725 28 0.0981 2.63E+01 1.05E+01 2.66 3.71E-10
Ironton-
Galesville3 3358.00 -2725 -2752 27 0.0981 2.63E+01 1.05E+01 2.66 3.71E-10
Ironton-
Galesville2 3385.00 -2752 -2779 27 0.0981 2.63E+01 1.05E+01 2.66 3.71E-10
Ironton-
Galesville1 3412.00 -2779 -2806 27 0.0981 2.63E+01 1.05E+01 2.66 3.71E-10
Pri
ma
ry C
on
fin
ing
Zo
ne
Proviso5 3439.00 -2806 -2877 71 0.0972 1.12E-03 1.12E-04 2.72 7.42E-10
Proviso4 3510.00 -2877 -2891 14 0.0786 5.50E-03 5.50E-04 2.72 7.42E-10
Proviso3 3524.00 -2891 -2916 25 0.0745 8.18E-02 5.73E-04 2.77 7.42E-10
Proviso2 3548.50 -2916 -2926 10 0.0431 1.08E-01 7.56E-04 2.77 7.42E-10
Proviso1 3558.50 -2926 -2963 38 0.0361 6.46E-04 4.52E-06 2.77 7.42E-10
Lombard14 3596.00 -2963 -3003 40 0.1754 5.26E-04 5.26E-05 2.68 7.42E-10
Lombard13 3636.00 -3003 -3038 35 0.0638 1.53E-01 1.53E-02 2.68 7.42E-10
Lombard12 3671.00 -3038 -3073 35 0.0638 1.53E-01 1.53E-02 2.68 7.42E-10
Lombard11 3706.00 -3073 -3084 11 0.0878 9.91E+00 9.91E-01 2.68 7.42E-10
Lombard10 3717.00 -3084 -3094 10 0.0851 1.66E+01 1.66E+00 2.68 7.42E-10
Lombard9 3727.00 -3094 -3121 27 0.0721 1.00E-02 1.00E-03 2.68 7.42E-10
Lombard8 3753.50 -3121 -3138 17 0.0663 2.13E-01 2.13E-02 2.68 7.42E-10
Lombard7 3770.50 -3138 -3145 8 0.0859 7.05E+01 7.05E+00 2.68 7.42E-10
Lombard6 3778.00 -3145 -3153 8 0.0459 1.31E+01 1.31E+00 2.68 7.42E-10
Area of Review and Corrective Action Plan for FutureGen Alliance Page B16 of 46
Permit Number: IL-137-6A-0003 (well #3)
Table 1. (contd)
Model Layer
Top
Depth
(ft GS)
Top
Elevation
(ft MSL)
Bottom
Elevation
(ft MSL)
Thickness
(ft) Porosity
Horizontal
Permeability
(mD)
Vertical
Permeability
(mD)
Grain
Density
(g/cm3)
Compresibility
(1/Pa)
Inje
ctio
n Z
on
e
Lombard5 3785.50 -3153 -3161 9 0.0760 4.24E+02 4.24E+01 2.68 7.42E-10
Lombard4 3794.00 -3161 -3181 20 0.0604 3.56E-02 3.56E-03 2.68 7.42E-10
Lombard3 3814.00 -3181 -3189 8 0.0799 5.19E+00 5.19E-01 2.68 7.42E-10
Lombard2 3821.50 -3189 -3194 5 0.0631 5.71E-01 5.71E-02 2.68 7.42E-10
Lombard1 3826.50 -3194 -3219 26 0.0900 1.77E+00 1.77E-01 2.68 7.42E-10
Elmhurst7 3852.00 -3219 -3229 10 0.1595 2.04E+01 8.17E+00 2.64 3.71E-10
Elmhurst6 3862.00 -3229 -3239 10 0.1981 1.84E+02 7.38E+01 2.64 3.71E-10
Elmhurst5 3872.00 -3239 -3249 10 0.0822 1.87E+00 1.87E-01 2.64 3.71E-10
Elmhurst4 3882.00 -3249 -3263 14 0.1105 4.97E+00 1.99E+00 2.64 3.71E-10
Elmhurst3 3896.00 -3263 -3267 4 0.0768 7.52E-01 7.52E-02 2.64 3.71E-10
Elmhurst2 3900.00 -3267 -3277 10 0.1291 1.63E+01 6.53E+00 2.64 3.71E-10
Elmhurst1 3910.00 -3277 -3289 12 0.0830 2.90E-01 2.90E-02 2.64 3.71E-10
MtSimon17 3922.00 -3289 -3315 26 0.1297 7.26E+00 2.91E+00 2.65 3.71E-10
MtSimon16 3948.00 -3315 -3322 7 0.1084 3.78E-01 3.78E-02 2.65 3.71E-10
MtSimon15 3955.00 -3322 -3335 13 0.1276 5.08E+00 2.03E+00 2.65 3.71E-10
MtSimon14 3968.00 -3335 -3355 20 0.1082 1.33E+00 5.33E-01 2.65 3.71E-10
MtSimon13 3988.00 -3355 -3383 28 0.1278 5.33E+00 2.13E+00 2.65 3.71E-10
MtSimon12 4016.00 -3383 -3404 21 0.1473 1.59E+01 6.34E+00 2.65 3.71E-10
MtSimon11 4037.00 -3404 -3427 23 0.2042 3.10E+02 1.55E+02 2.65 3.71E-10
MtSimon10 4060.00 -3427 -3449 22 0.1434 1.39E+01 4.18E+00 2.65 3.71E-10
MtSimon9 4082.00 -3449 -3471 22 0.1434 1.39E+01 4.18E+00 2.65 3.71E-10
MtSimon8 4104.00 -3471 -3495 24 0.1503 2.10E+01 6.29E+00 2.65 3.71E-10
MtSimon7 4128.00 -3495 -3518 23 0.1311 6.51E+00 1.95E+00 2.65 3.71E-10
MtSimon6 4151.00 -3518 -3549 31 0.1052 2.26E+00 6.78E-01 2.65 3.71E-10
MtSimon5 4182.00 -3549 -3588 39 0.1105 4.83E-02 4.83E-03 2.65 3.71E-10
MtSimon4 4221.00 -3588 -3627 39 0.1105 4.83E-02 4.83E-03 2.65 3.71E-10
MtSimon3 4260.00 -3627 -3657 30 0.1727 1.25E+01 1.25E+00 2.65 3.71E-10
MtSimon2 4290.00 -3657 -3717 60 0.1157 2.87E+00 2.87E-01 2.65 3.71E-10
MtSimon1 4350.00 -3717 -3799 82 0.1157 2.87E+00 2.87E-01 2.65 3.71E-10

Area of Review and Corrective Action Plan for FutureGen Alliance Page B17 of 46
Permit Number: IL-137-6A-0003 (Well #3)
Table 2. Lithology-Specific Permeability Anisotropy Averages from Literature
Facies or Lithology Kv/Kh Reference
1. Heterolithic, laminated shale/mudstone/siltstone/sandstone 0.1 Meyer and Krause (2006)
2. Herringbone cross-stratified sandstone. Strat dips to 18 degrees 0.4 Meyer and Krause (2006)
3. Paleo weathered sandstone (coastal flat) 0.4 Meyer and Krause (2006)
4. Accretionary channel bar sandstones with minor shale laminations 0.5 Ringrose et al. (2005);
Meyer and Krause (2006)
6. Alluvial fan, alluvial braided stream plain to shallow marine
sandstones, low clay content 0.3 Kerr et al. (1999)
7. Alluvial fan, alluvial plain sandstones, sheet floods, paleosols,
higher clay content 0.1 Hornung and Aigner (1999)
8. Dolomite mudstone 0.007 Saller et al. (2004)
Area of Review and Corrective Action Plan for FutureGen Alliance Page B18 of 46
Permit Number: IL-137-6A-0003 (Well #3)
Table 3. Summary of the Kv/Kh Ratios Applied to Model Layers
Model Layer Kv/Kh Applied to
Model Layers(a)
*
Kv/Kh
Determined
from Core
Pairs(b)
Successfully
Analyzed Core
Pairs
Franconia carbonate 0.007 ND ND
Davis-Ironton 0.1 ND ND
Ironton-Galesville 0.4 ND ND
Proviso (Layers 4 and 5) 0.1 ND ND
Proviso ([carbonate] Layers 1
to 3)
0.007 ND ND
Lombard Total Interval 0.1 0.029 12
Lombard (Layer 7) 0.1 .098 2
Lombard (Layer 6) 0.1 0.003 2
Lombard (Layer 5) 0.1 ND ND
Lombard (Layer 4) 0.1 0.016 2
Lombard (Layer 3) 0.1 0.064 2
Lombard (Layer 2) 0.1 0.009 1
Lombard (Layer 1) 0.1 0.104 3
Elmhurst Total Interval 0.4 0.06 4
Elmhurst (Layer 7) 0.4 ND ND
Elmhurst (Layer 6) 0.4 0.023 1
Elmhurst (Layer 5) 0.4 ND ND
Elmhurst (Layer 4) 0.4 0.902 1
Elmhurst (Layer 3) 0.4 ND ND
Elmhurst (Layer 2) 0.4 0.022 1
Elmhurst (Layer 1) 0.4 0.037 1
Mt. Simon (Layer 17) 0.4 0.233 2
Mt. Simon (Layer 16) 0.1 ND ND
Mt. Simon (layer 13) 0.4 0.643 2
Mt. Simon (Layers 12, 14, and
15)
0.4 ND ND
Mt. Simon (Layer 11,
Injection) zone)
0.5 ND ND
Mt. Simon (Layers 6, 7, 8, 9,
10)
0.3 ND ND
Mt. Simon (Layers 1, 2, 3, 4,
5)
0.1 ND ND
(a) Value from literature, referenced in the Supporting Documentation of the UIC permit application
(b) Geometric mean of successful core pairs.
Area of Review and Corrective Action Plan for FutureGen Alliance Page B19 of 46
Permit Number: IL-137-6A-0003 (Well #3)
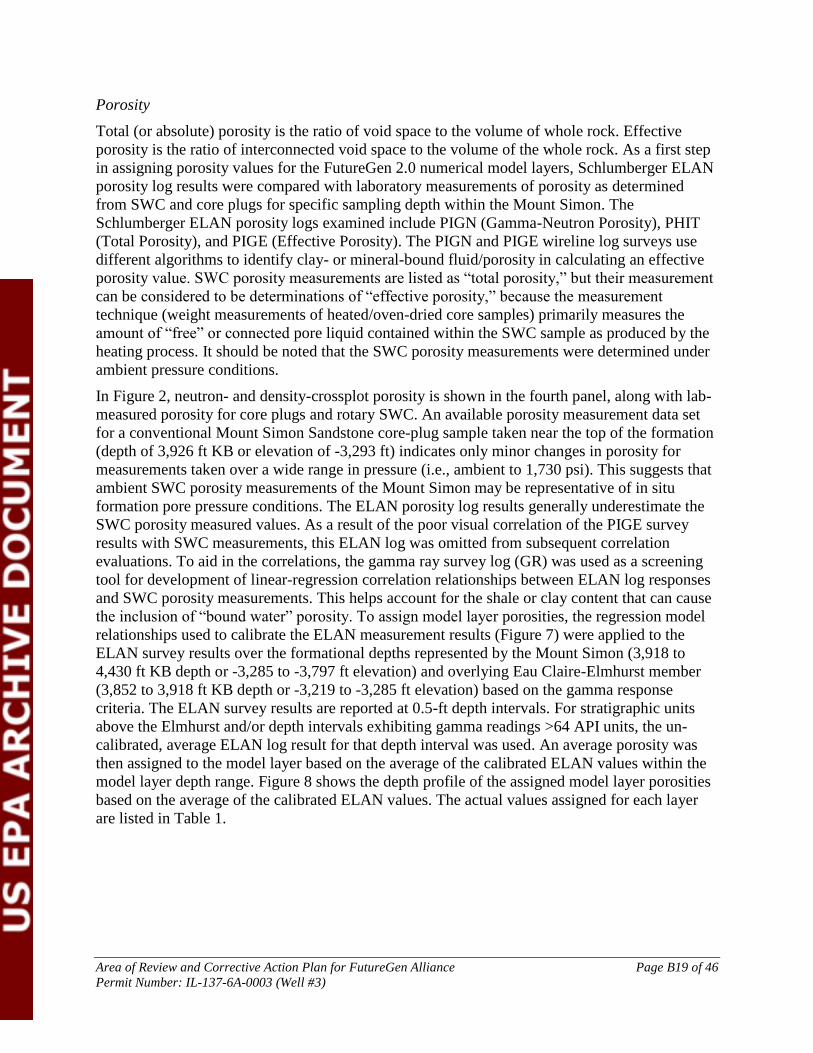
Porosity
Total (or absolute) porosity is the ratio of void space to the volume of whole rock. Effective
porosity is the ratio of interconnected void space to the volume of the whole rock. As a first step
in assigning porosity values for the FutureGen 2.0 numerical model layers, Schlumberger ELAN
porosity log results were compared with laboratory measurements of porosity as determined
from SWC and core plugs for specific sampling depth within the Mount Simon. The
Schlumberger ELAN porosity logs examined include PIGN (Gamma-Neutron Porosity), PHIT
(Total Porosity), and PIGE (Effective Porosity). The PIGN and PIGE wireline log surveys use
different algorithms to identify clay- or mineral-bound fluid/porosity in calculating an effective
porosity value. SWC porosity measurements are listed as “total porosity,” but their measurement
can be considered to be determinations of “effective porosity,” because the measurement
technique (weight measurements of heated/oven-dried core samples) primarily measures the
amount of “free” or connected pore liquid contained within the SWC sample as produced by the
heating process. It should be noted that the SWC porosity measurements were determined under
ambient pressure conditions.
In Figure 2, neutron- and density-crossplot porosity is shown in the fourth panel, along with lab-
measured porosity for core plugs and rotary SWC. An available porosity measurement data set
for a conventional Mount Simon Sandstone core-plug sample taken near the top of the formation
(depth of 3,926 ft KB or elevation of -3,293 ft) indicates only minor changes in porosity for
measurements taken over a wide range in pressure (i.e., ambient to 1,730 psi). This suggests that
ambient SWC porosity measurements of the Mount Simon may be representative of in situ
formation pore pressure conditions. The ELAN porosity log results generally underestimate the
SWC porosity measured values. As a result of the poor visual correlation of the PIGE survey
results with SWC measurements, this ELAN log was omitted from subsequent correlation
evaluations. To aid in the correlations, the gamma ray survey log (GR) was used as a screening
tool for development of linear-regression correlation relationships between ELAN log responses
and SWC porosity measurements. This helps account for the shale or clay content that can cause
the inclusion of “bound water” porosity. To assign model layer porosities, the regression model
relationships used to calibrate the ELAN measurement results (Figure 7) were applied to the
ELAN survey results over the formational depths represented by the Mount Simon (3,918 to
4,430 ft KB depth or -3,285 to -3,797 ft elevation) and overlying Eau Claire-Elmhurst member
(3,852 to 3,918 ft KB depth or -3,219 to -3,285 ft elevation) based on the gamma response
criteria. The ELAN survey results are reported at 0.5-ft depth intervals. For stratigraphic units
above the Elmhurst and/or depth intervals exhibiting gamma readings >64 API units, the un-
calibrated, average ELAN log result for that depth interval was used. An average porosity was
then assigned to the model layer based on the average of the calibrated ELAN values within the
model layer depth range. Figure 8 shows the depth profile of the assigned model layer porosities
based on the average of the calibrated ELAN values. The actual values assigned for each layer
are listed in Table 1.

Area of Review and Corrective Action Plan for FutureGen Alliance Page B20 of 46
Permit Number: IL-137-6A-0003 (Well #3)
Figure 7. Comparison of SWC Porosity Measurements and Regression-Calibrated ELAN Log Porosities: ≤64
Gamma API Units

Area of Review and Corrective Action Plan for FutureGen Alliance Page B21 of 46
Permit Number: IL-137-6A-0003 (Well #3)
Figure 8. Vertical Distribution of Porosity in the Model Layers at the Stratigraphic Well Location
Rock (Bulk) Density and Grain Density
Grain density data were calculated from laboratory measurements of SWCs. The data were then
averaged (arithmetic mean) for each main stratigraphic layer in the model. Only the Proviso
member (Eau Claire Formation) has been divided in two sublayers to be consistent with the
lithology changes. Figure 9 shows the calculated grain density with depth. The actual values
assigned to each layer of the model are listed in Table 1. Grain density is the input parameter
specified in the simulation input file, and STOMP-CO2 calculates the bulk density from the
grain density and porosity for each model layer.

Area of Review and Corrective Action Plan for FutureGen Alliance Page B22 of 46
Permit Number: IL-137-6A-0003 (Well #3)
Figure 9. Vertical Distribution of the Grain Density in the Model Layer at the Stratigraphic Well Location
Formation Compressibility
Limited information about formation (pore) compressibility estimates is available. The best
estimate for the Mount Simon Sandstone (Table 4) is that back-calculated by Birkholzer et al.
(2008) from a pumping test at the Hudson Field natural-gas storage site, found 80 mi (129 km)
northeast of the Morgan County CO2 storage site. The back-calculated pore-compressibility
estimate for the Mount Simon Sandstone of 3.71E−10 Pa−1
was used as a spatially constant value
for their basin-scale simulations. In other simulations, Birkholzer et al. (2008) assumed a pore-
compressibility value of 4.5E−10 Pa−1
for aquifers and 9.0E−10 Pa−1
for aquitards. Zhou et al.
(2010) in a later publication used a pore-compressibility value of 7.42E−10 Pa−1
for both the Eau
Claire Formation and Precambrian granite, which were also used for these initial simulations

Area of Review and Corrective Action Plan for FutureGen Alliance Page B23 of 46
Permit Number: IL-137-6A-0003 (Well #3)
(Table 4). Because the site-specific data are limited to a single reservoir sample, only these two
published values have been used for the model. The first value (3.71E-10 Pa−1
) has been used for
sands that are compressible because of the presence of porosity. The second value (7.42E-10
Pa−1
) is assigned for all other rocks that are less compressible (dolomite, limestone, shale, and
rhyolite). Table 1 lists the hydrologic parameters assigned to each model layer.
Table 4. Formation Compressibility Values Selected from Available Sources
Hydrogeologic Unit Formation (Pore) Compressibility, Pa-1
Franconia 7.42E-10 Pa-1
Davis-Ironton 3.71E-10 Pa-1
Ironton-Galesville 3.71E-10 Pa-1
Eau Claire Formation (Lombard and Proviso) 7.42E-10 Pa-1
Eau Claire Formation (Elmhurst) 3.71E-10 Pa-1
Mount Simon Sandstone 3.71E-10 Pa-1
Constitutive Relationships
Capillary Pressure and Saturation Functions
Capillary pressure is the pressure difference across the interface of two immiscible fluids (e.g.,
CO2 and water). The entry capillary pressure is the minimum pressure required for an immiscible
non-wetting fluid (i.e., CO2) to overcome capillary and interfacial forces and enter pore space
containing the wetting fluid (i.e., saline formation water). Capillary pressure data determined
from site-specific cores were not available at the time the model was constructed. However,
tabulated capillary pressure data were available for several Mount Simon gas storage fields in the
Illinois Basin. The data for the Manlove Hazen well (FutureGen Alliance 2006) were the most
complete. Therefore, these aqueous saturation and capillary pressure values were plotted and a
user-defined curve fitting was performed to generate Brooks-Corey parameters for four different
permeabilities (Figure 10). These parameters were then assigned to layers based on a
permeability range as shown in Table 5.

Area of Review and Corrective Action Plan for FutureGen Alliance Page B24 of 46
Permit Number: IL-137-6A-0003 (Well #3)
Figure 10. Aqueous Saturation Versus Capillary Pressure Based on Mercury Injection Data from the Hazen
No. 5 Well at the Manlove Gas Field in Champagne County, Illinois
Table 5. Permeability Ranges Used to Assign Brooks-Corey Parameters to Model Layers
Permeability (mD) Psi Lambda ()
Residual Aqueous
Saturation
< 41.16 4.116 0.83113 0.059705
41.16 to 231 1.573 0.62146 0.081005
231 to 912.47 1.450 1.1663 0.070762
> 912.47 1.008 1.3532 0.044002
The Brooks-Corey (1964) saturation function is given as
where Sew is effective aqueous saturation, Pc is capillary pressure, Pe is gas entry pressure, and λ
is the pore-size distribution parameter. Combined with the Burdine (1953) relative permeability
model, the relative permeability for the aqueous phase, krw, and that for the non-aqueous phase,
krn, are
Values for the residual aqueous saturation (Srw) and the two other parameters used in the Brooks-
Corey capillary pressure-saturation function (i.e., the non-wetting fluid entry pressure and a
pore-size distribution parameter) were all obtained by fitting mercury (Hg) intrusion-capillary
pressure data from the Manlove gas storage site in Champaign County. The fitting was applied
after scaling the capillary pressures to account for the differences in interfacial tensions and
contact angles for the brine-CO2 fluid pair, relative to vapor-liquid Hg used in the measurements.
otherwise
PPifPPS ecce
ew1
)/(
/23)( ewrw SK
)1()1(/212
ewewrn SSK

Area of Review and Corrective Action Plan for FutureGen Alliance Page B25 of 46
Permit Number: IL-137-6A-0003 (Well #3)
This approach has the major advantage that the three fitted parameters are consistent as they are
obtained from the same original data set. The use of consistent parameter values is not the norm
for brine-CO2 flow simulations in the Mount Simon Sandstone.
The Srw values used in the modeling (Table 2) are indeed lower than the values found in the
literature. The FutureGen Alliance was aware of these differences but opted to use a consistent
data set for all retention parameter values instead of selecting parameter values from different
data sources. An additional reason for using this approach is the considerable uncertainty in Srw
values for Mt. Simon rock in the literature. In general, using a lower Srw value for the injection
zone will possibly result in a somewhat smaller predicted CO2 plume size and a smaller spatial
extent of the pressure front compared to using a higher value of Srw. Variation of Srw in the
confining zone (cap rock) likely has relatively little impact on CO2 transport and pressure
development owing to the typically much lower permeability of this zone relative to the
underlying formation.
Gas Entry Pressure
No site-specific data were available for gas entry pressure; therefore, this parameter was
estimated using the Davies (1991) developed empirical relationships between air entry pressure,
Pe, and intrinsic permeability, k, for different types of rock:
Pe = a kb
where Pe takes the units of MPa and k the units of m2, a and b are constants and are summarized
below for shale, sandstone, and carbonate (Davies 1991; Table 3 ). The dolomite found at the
Morgan County site is categorized as a carbonate. The Pe for the air-water system is further
converted to that for the CO2-brine system by multiplying the interfacial tension ratio of a CO2-
brine system to an air-water system . An approximate value of 30 mN/m was used for
and 72 mN/m for .
Table 6. Values for Constants a and b for Different Lithologies
Shale Sandstone Carbonate
a 7.60E-07 2.50E-07 8.70E-07
b -0.344 -0.369 -0.336
CO2 Entrapment
The entrapment option available in STOMP-CO2 was used to allow for entrapment of CO2 when
the aqueous phase is on an imbibition path (i.e., increasing aqueous saturation). Gas saturation
can be free or trapped:
sg = 1 - sl = sgf + sgt
where the trapped gas is assumed to be in the form of aqueous occluded ganglia and immobile.
The potential effective trapped gas saturation varies between zero and the effective maximum
trapped gas saturation as a function of the historical minimum value of the apparent aqueous
saturation. No site-specific data were available for the maximum trapped gas saturation, so this
value was taken from the literature. Suekane et al. (2009) used micro-focused x-ray CT to image

Area of Review and Corrective Action Plan for FutureGen Alliance Page B26 of 46
Permit Number: IL-137-6A-0003 (Well #3)
a chip of Berea Sandstone to measure the distribution of trapped gas bubbles after injection of
scCO2 and then water, under reservoir conditions. Based on results presented in the literature, a
value of 0.2 was used in the model, representing the low end of measured values for the
maximum trapped gas saturation in core samples.
Formation Properties
Fluid Pressure
An initial fluid sampling event from the Mount Simon formation was conducted on December
14, 2011, in the stratigraphic well during the course of conducting open-hole logging. Sampling
was attempted at 22 discrete depths using the MDT tool in the Quicksilver Probe configuration
and from one location using the conventional (dual-packer) configuration. Pressure data were
obtained at 7 of the 23 attempted sampling points, including one duplicated measurement at a
depth of 4,048 ft KB or elevation of -3415 ft (Table 7).
Figure 11 shows the available regional potentiometric surfaces for the Mount Simon Sandstone.
The figure contains pre-development hydraulic head measurements (e.g., before widespread
pumping from the Mount Simon Sandstone, particularly in Northern Illinois) and simulation
results for predicting the post-development (i.e., 1980) potentiometric surface. As shown in
Figure 11, data are sparse around the area of the FutureGen 2.0 Site, and it is situated in an area
where the regional gradients are very low and the flow directions are not constrained (pre- or
post-development). For these reasons, a regional horizontal flux for the Mount Simon Sandstone
was not specified in the computational model.
Vertical flow potential at the FutureGen 2.0 Site was evaluated based on an analysis of discrete
pressure/depth measurements obtained within the pilot characterization borehole over the depth
interval of 1,148 to 4,263 ft KB depth (-515 to -3,630 ft elevation). The results indicate that there
is a positive head difference in the Mount Simon that ranges from 47.8 to 61.6 ft above the
calculated St. Peter observed static hydraulic head condition (i.e., 491.1 ft above MSL). This
positive head difference suggests a natural vertical flow potential from the Mount Simon to the
overlying St. Peter if hydraulic communication is afforded (e.g., an open communicative well). It
should also be noted, however, that the higher head within the unconsolidated Quaternary aquifer
(~611 ft above MSL), indicates a downward vertical flow potential from this surficial aquifer to
both the underlying St. Peter and Mount Simon bedrock aquifers. The disparity in the calculated
hydraulic head measurements (together with the significant differences in formation fluid
salinity) also suggests that groundwater within the St. Peter and Mount Simon bedrock aquifers
is physically isolated from one another. This is an indication that there are no significant conduits
(open well bores or fracturing) between these two formations and that the Eau Claire forms an
effective confining layer.

Area of Review and Corrective Action Plan for FutureGen Alliance Page B27 of 46
Permit Number: IL-137-6A-0003 (Well #3)
Figure 11. Approximate Pre-Development Potentiometric Surface (a) for the Mount Simon Aquifer (from
Young 1992, modified from Mandel and Kontis 1992) and (b) Simulated 1980 Freshwater Head in
the Mount Simon Aquifer showing Impact of Withdrawals in Northern portion of Illinois
(Mandel and Kontis 1992)

Area of Review and Corrective Action Plan for FutureGen Alliance Page B28 of 46
Permit Number: IL-137-6A-0003 (Well #3)
Table 7. Pressure Data Obtained from the Mount Simon Formation Using the MDT Tool Where the
Red Line Delimits the Samples Within the Injection Zone
Sample Number Sample Depth (ft bkb) Absolute Pressure (psia)
7 4,130 1,828
8 4,131 1,827.7
9 4,110.5 1,818.3
11 4,048 1,790.2
17 4,048 (duplicated) 1,790.3
21 4,248.5 1,889.2
22 4,246 1,908.8
23 4,263 1,896.5(a)
(a) Sample affected by drilling fluids (not representative)
Temperature
The best fluid temperature depth profile was performed on February 9, 2012, as part of the static
borehole flow meter/fluid temperature survey that was conducted prior to the constant-rate
injection flow meter surveys. Two confirmatory discrete probe depth measurements that were
taken prior to the active injection phase (using colder brine) corroborate the survey results. The
discrete static measurement for the depth of 3,712 ft KB (elevation of -3,079 ft) was 95.9°F. The
second discrete static probe temperature measurement is from the MDT probe for the successful
sampling interval of 4,048 ft KB depth (elevation of -3,415 ft). A linear-regression
temperature/depth relationship was developed for use by modeling. The regression data set
analyzed was for temperature data over the depth interval of 1,300 to 4,547 ft KB (elevation of -
667 to -3,914 ft). Based on this regression, a projected temperature for the reference datum at the
top of the Mount Simon (3,918 ft KB depth or -3,285 ft elevation) of 96.60°F is indicated. A
slope (gradient) of 6.72 10-3
°F/ft and intercept of 70.27°F is also calculated from the regression
analysis.
Brine Density
Although this parameter is determined by the simulator using pressure, temperature, and salinity,
based on the upper and lower Mount Simon injection zone tests, the calculated in situ injection
zone fluid density is 1.0315 g/cm3.
Salinity and Water Quality
During the process of drilling the well, fluid samples were obtained from discrete-depth intervals
in the St. Peter Formation and the Mount Simon Formation using wireline-deployed sampling
tools (MDTs) on December 14, 2011. After the well had been drilled, additional fluid samples
were obtained from the open borehole section of the Mount Simon Formation by extensive
pumping using a submersible pump. The assigned salinity value for the Mount Simon (upper
zone) 47,500 ppm is as indicated by both the MDT sample (depth 4,048 ft KB or elevation of -

Area of Review and Corrective Action Plan for FutureGen Alliance Page B29 of 46
Permit Number: IL-137-6A-0003 (Well #3)
3,415 ft) and the multiple samples collected during extensive composite pumping of the open
borehole section.
A total of 20 groundwater samples were collected between October 25 and November 10, 2011,
including duplicate samples and blanks (Dey et al. in press as of 2013). General water-quality
parameters were measured along with organic and major inorganic constituents. Values of pH
ranged from 7.08 to 7.66. Values for specific conductance ranged from 545 to 1,164 μS/cm, with
an average of 773 μS/cm. Values of Eh ranged from 105 to 532 mV with an average of 411 mV.
Values of dissolved oxygen (DO) ranged from below detection limit to 3.3 mg/L O2. Most
dissolved inorganic constituent concentrations are within primary and secondary drinking water
standards. However, the constituent concentration in water is elevated with respect to iron (Fe),
manganese (Mn), nitrate (NO3), and the total dissolved salt (TDS). In some cases these
constituents exceed the U.S. Environmental Protection Agency (EPA) secondary standards.
Fracture Pressure in the Injection Zone
At the time the computational model was developed, no site-specific hydraulic fracturing tests
had been conducted in the stratigraphic well and no site-specific fracture pressure values were
available for the confining zone and the injection zone. Other approaches (listed below) have
thus been chosen to determine an appropriate value for the fracture pressure.
Triaxial tests were conducted on eight samples from the stratigraphic well. Samples 3 to
7 are located within the injection zone. Fracture gradients were estimated to range from
0.647 to 0.682 psi/ft, which cannot directly be compared to the fracture pressure gradient
required for the permit. Triaxial tests alone cannot provide accurate measurement of
fracture pressure.
Existing regional values. Similar carbon storage projects elsewhere in Illinois (in Macon
and Christian counties) provide data for fracture pressure in a comparable geological
context. In Macon County (CCS#1 well at Decatur), about 65 mi east of the FutureGen
2.0 Site, a fracture pressure gradient of 0.715 psi/ft was obtained at the base of the Mount
Simon Sandstone Formation using a step-rate injection test (EPA 2011a). In Christian
County, a “conservative” pressure gradient of 0.65 psi/ft was used for the same injecting
zone (EPA 2011b). No site-specific data were available.
Last, the regulation relating to the “Determination of Maximum Injection Pressure for
Class I Wells” in EPA Region 5 is based on the fracture closure pressure, which has been
chosen to be 0.57 psi/ft for the Mount Simon Sandstone (EPA 1994).
Based on these considerations, a fracture pressure gradient of 0.65 psi/ft was chosen. The EPA
Geologic Sequestration Rule requires that “Except during stimulation, the owner or operator
must ensure that injection pressure does not exceed 90 percent of the fracture pressure of the
injection zone(s) so as to ensure that the injection does not initiate new fractures or propagate
existing fractures in the injection zone(s)…” Therefore, a value of 0.585 psi/ft (90 percent of
0.65 psi/ft) was used in the model to calculate the maximum injection pressure permitted.

Area of Review and Corrective Action Plan for FutureGen Alliance Page B30 of 46
Permit Number: IL-137-6A-0003 (Well #3)
In November and December 2013, hydraulic tests were conducted in the Mount Simon
Sandstone and in the Precambrian basement. The first results of these tests verify that the
fracture gradient used in the model for the injection zone remains conservative and appropriate.
Site Evaluation of Mineral Resources
Other subsurface geochemical considerations include the potential for mineral or hydrocarbon
resources beneath the proposed CO2 storage site. While no significant mineral deposits are
known to exist within Morgan County, natural gas has been recovered in the region, including at
the Prentice and Jacksonville fields located within several miles of the stratigraphic well. ISGS
oil and gas website data indicate that the Prentice Field contained more than 25 wells drilled
during the 1950s; re-exploration occurred in the 1980s. Both oil and gas have been produced
from small stratigraphic traps in the shallow Pennsylvanian targets, at depths of 250 to 350 ft (75
to 105 m) bgs. It is important to note that gas produced from these wells may contain around 16
percent CO2 (Meents 1981). More than 75 wells have been drilled in the Jacksonville Field. Gas
was discovered in the Jacksonville Field as early as 1890 (Bell 1927), but most oil and gas
production from the Prentice and Jacksonville fields occurred between the late 1920s and late
1980s. The most productive formations in the Illinois Basin (lower Pennsylvanian and
Mississippian siliciclastics and Silurian reefs) are not present in Morgan County. Only two
boreholes in the vicinity of the Prentice Field and five boreholes near the Jacksonville Field
penetrate through the New Albany Shale into Devonian and Silurian limestone. Cumulative
production from the Prentice and Jacksonville fields is not available, and both fields are largely
abandoned. The Waverly Storage Field natural-gas storage site in the southeast corner of Morgan
County originally produced oil from Silurian carbonates. This field no longer actively produces
oil, but since 1954 it has been successfully used for natural-gas storage in the St. Peter and the
Galesville/Ironton Sandstone formations (Buschbach and Bond 1974).
The nearest active coal mine is approximately 10 mi (16 km) away in Menard County and does
not penetrate more than 200 ft (61 m) bgs (ISGS 2012). A review of the known coal geology
within a 5-mi (8-km) radius of the proposed drilling site indicates that the Pennsylvanian coals,
the Herrin, Springfield, and Colchester coals, are very thin or are absent from the project area
(ISGS 2010, 2011; Hatch and Affolter 2008). During continuous coring of a shallow
groundwater monitoring well located immediately adjacent to the stratigraphic well, only a
single thin (5-ft [1.5-m]) coal seam was encountered at about 200 ft (61 m) deep.
Initial Conditions
The injection zone is assumed to be under hydrostatic conditions with no regional or local flow
conditions. Therefore the hydrologic flow system is assumed to be at steady state until the start
of injection. To achieve this with the STOMP-CO2 simulator one can either run an initial
simulation (executed for a very long time period until steady-state conditions are achieved) to
generate the initial distribution of pressure, temperature, and salinity conditions in the model
from an initial guess, or one can specify the initial conditions at a reference depth using the
hydrostatic option in the STOMP-CO2 input file, allowing the simulator to calculate and assign
the initial conditions to all the model nodes. Site-specific data were available for pressure,
temperature, and salinity, and therefore the hydrostatic option was used to assign initial
conditions. A temperature gradient was specified based on the geothermal gradient, but the initial

Area of Review and Corrective Action Plan for FutureGen Alliance Page B31 of 46
Permit Number: IL-137-6A-0003 (Well #3)
salinity was considered to be constant for the entire domain. A summary of the initial conditions
is presented in Table 8.
Table 8. Summary of Initial Conditions
Parameter Reference Depth (ft KB) Elevation (ft) Value
Reservoir Pressure 4,048 -3,415 1,790.2 psi
Aqueous Saturation 1.0
Reservoir Temperature 3,918 -3,285 96.6 °F
Temperature Gradient 0.00672 °F/ft
Salinity 47,500 ppm
Boundary Conditions
Boundary conditions were established with the assumption that the injection zone and confining
zone are continuous throughout the region and that the underlying Precambrian unit is
impermeable. Therefore, the bottom boundary was set as a no-flow boundary for aqueous fluids
and for the CO2-rich phase. The lateral and top boundary conditions were set to hydrostatic
pressure using the initial condition with the assumption that each of these boundaries is distant
enough from the injection zone to have minimal to no effect on the CO2 plume migration and
pressure distribution.
Wells within the Survey Area
An initial survey area of 25 mi2 (65 km
2) is in Figure 12. The survey area is centered on the
proposed injection location (labeled “Injection Site”) and encompasses the area of the expected
CO2 plume (within the larger Area of Review (AoR)). Surface bodies of water and other
pertinent surface features, administrative boundaries, and roads are shown. There are no
subsurface cleanup sites, mines, quarries, or Tribal lands within this area.
Although numerous wells are located within the survey area, none but the FutureGen Alliance’s
stratigraphic well penetrates the injection zone (Mount Simon Sandstone and the lower Eau
Claire [Elmhurst Sandstone Member]), the confining zone (Lombard and Proviso members of
the Eau Claire Formation), or the secondary confining zone (Franconia Dolomite).
A total of 129 wells (including the stratigraphic well) are within the survey area. There are 4,386
water wells and 740 oil and gas wells within the larger AoR, but only two penetrate the confining
zone (Table 9). Two wells were identified in the AoR approximately 16 miles from the injection
site, but they are adequately plugged. Twenty four of these 129 wells are only identified with a
general location (center of a section) in the ISWS database. If the section of those wells
intersected the AoR borders, the wells were assumed to be within the AoR even though they
could be beyond the border. Those wells are indicated with a “potentially” label in the last
column of Table 9 but are not shown on the map.
Shallow domestic water wells with depths of less than 50 ft (15 m) are the most common well
type. Five slightly deeper water wells were identified that range in depths from 110 ft (33 m) to
405 ft (123 m). Other wells include stratigraphic test holes, coal test holes, and oil and gas wells
(Figure 12).

Area of Review and Corrective Action Plan for FutureGen Alliance Page B32 of 46
Permit Number: IL-137-6A-0003 (Well #3)
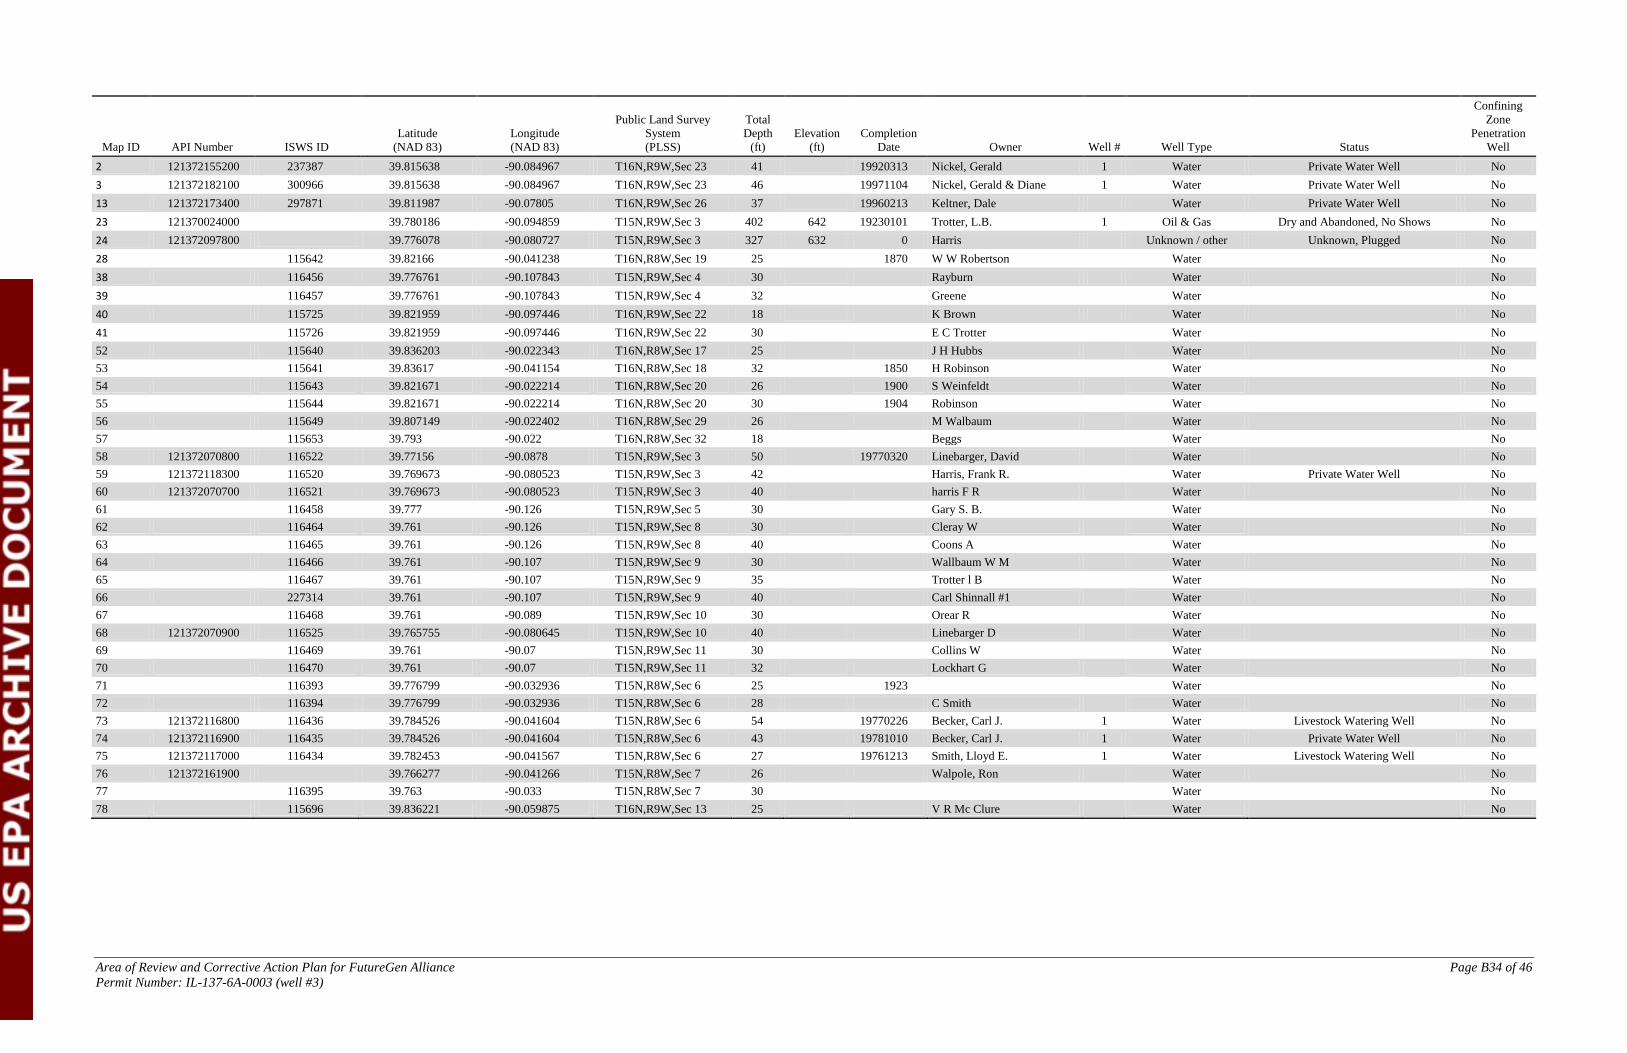
Table 9 lists wells located within the 25 mi2 survey area with their unique API (American
Petroleum Institute) identification number and ISWS well identification (ID), if available, well
location, depth, elevation, completion date, well owner, well type, and identified status.

Area of Review and Corrective Action Plan for FutureGen Alliance Page B33 of 46
Permit Number: IL-137-6A-0003 (well #3)
Table 9. List of Wells Located Within the Survey Area
Map ID API Number ISWS ID
Latitude
NAD1983
Longitude
NAD1983
Public Land Survey
System
Total
Depth ft
Elev
ft
Completion
Date Owner
Well
Num Well Type Status
Confining Zone
Penetration
Well In AoR
0 121372213200 39.806064 -90.052919 T16n,R9w,Sec 25 4812 633 TBD FutureGen Industrial Alliance, Inc. 1 Monitoring Active Yes Yes
1 121372118200 116519 39.778074 -90.078443 T15N,R9W,Sec 2 25 19780712 A.A. Negus Estate 1 Water Private Water Well No Yes
4 121370018700 115778 39.811025 -90.065241 T16N,R9W,Sec 25 115 Beilschmidt, William H. Water No Yes
8 121370028500 115740 39.800661 -90.078386 T16N,R9W,Sec 26 127 1950 Martin, L. E. 1 Water
No Yes
9 115741 39.800661 -90.078386 T16N,R9W,Sec 26 127 Martin, L. E. Water No Yes
10 121372128600 115779 39.801129 -90.07342 T16N,R9W,Sec 26 25 19781213 Martin, Marvin & Jean 1 Water Private Water Well No Yes
14 115763 39.792894 -90.078875 T16N,R9W,Sec 35 28 E Clemons Water No Yes
15
115764 39.792894 -90.078875 T16N,R9W,Sec 35 25
B Sister
Water
No Yes
16 115765 39.792837 -90.060294 T16N,R9W,Sec 36 35 J M Dunlap Water No Yes
17 121370051100 39.792893 -90.078984 T16N,R9W,Sec 35 1056 643
O'Rear, Judge 1 Oil & Gas / Water
No Yes
18 121370009900 39.808545 -90.06614 T16N,R9W,Sec 25 1530 630 19391001 Beilschmidt, Wm. 1 Oil & Gas Dry and Abandoned, No Shows No Yes
19 121370023500 39.779153 -90.077325 T15N,R9W,Sec 2 338 644 19231101 Conklin 1 Oil & Gas Dry and Abandoned, No Shows No Yes
20 121370023600 39.781298 -90.075082 T15N,R9W,Sec 2 348 646 19231101 Conklin 2 Oil & Gas Dry and Abandoned, No Shows No Yes
21 121370023700 39.778057 -90.080754 T15N,R9W,Sec 3 342 645 19231001 Harris, A. J. 1 Oil & Gas Gas Producer No Yes
22 121370023900 39.7779 -90.080756 T15N,R9W,Sec 3 334 644 19231107 Harris, A. J. 3 Oil & Gas Gas Producer No Yes
25 121370036300 39.805251 -90.075597 T16N,R9W,Sec 26 1205 19670330 Martin 1 Oil & Gas Dry and Abandoned, No Shows No Yes
26 121370036301 39.805251 -90.075597 T16N,R9W,Sec 26 1400 19731029 Martin 1 Oil & Gas Junked and Abandoned, Plugged No Yes
27 121372088500 39.800861 -90.073017 T16N,R9W,Sec 26 302 630 Coal Test No Yes
115735 39.807386 -90.060378 T16N,R9W,Sec 25 27 Beilschmidt, William H. Water No Potentially
115736 39.807386 -90.060378 T16N,R9W,Sec 25 30
W R Fowler
Water
No Potentially
115737 39.807386 -90.060378 T16N,R9W,Sec 25 28 Mason Water No Potentially
115739 39.807478 -90.079049 T16N,R9W,Sec 26 25
C H Matin
Water
No Potentially
115738 39.807478 -90.079049 T16N,R9W,Sec 26 22 T Gondall Water No Potentially
115650 39.807193 -90.041413 T16N,R8W,Sec 30 19 1930 R Allison
Water
No Potentially
115651 39.792765 -90.041512 T16N,R8W,Sec 31 28 W J Huston Water No Potentially
115652 39.792765 -90.041512 T16N,R8W,Sec 31 28
E Robinson
Water
No Potentially
116450 39.777005 -90.052023 T15N,R9W,Sec 1 25 A Harris Water No Potentially
116453 39.776968 -90.070521 T15N,R9W,Sec 2 32
A Harris
Water
No Potentially
116451 39.776968 -90.070521 T15N,R9W,Sec 2 22 W R Conklin Water No Potentially
116452 39.776968 -90.070521 T15N,R9W,Sec 2 30
B Negus
Water
No Potentially
116454 39.77688 -90.088996 T15N,R9W,Sec 3 28 C Negus Water No Potentially
116455 39.77688 -90.088996 T15N,R9W,Sec 3 30
L B Trotter
Water
No Potentially
115727 39.821881 -90.078925 T16N,R9W,Sec 23 30 D Flinn Water No Potentially
115728 39.821881 -90.078925 T16N,R9W,Sec 23 30
Hazel Dell School
Water
No Potentially
115729 39.821881 -90.078925 T16N,R9W,Sec 23 35 K Haneline Water No Potentially
115733 39.821811 -90.060168 T16N,R9W,Sec 24 30
J L Icenagle
Water
No Potentially
115734 39.821811 -90.060168 T16N,R9W,Sec 24 30 G Lewis Water No Potentially
115775 39.821811 -90.060168 T16N,R9W,Sec 24 200
1944 E C Lewis
Water
No Potentially
115742 39.807531 -90.097566 T16N,R9W,Sec 27 23 J Stewart Water No Potentially
115743 39.807531 -90.097566 T16N,R9W,Sec 27 23
l J Stewart
Water
No Potentially
115761 39.792917 -90.097513 T16N,R9W,Sec 34 28 T Harrison Water No Potentially
115762 39.792917 -90.097513 T16N,R9W,Sec 34 30 J Mahon Water No Potentially
Area of Review and Corrective Action Plan for FutureGen Alliance Page B34 of 46
Permit Number: IL-137-6A-0003 (well #3)
Map ID API Number ISWS ID
Latitude
(NAD 83)
Longitude
(NAD 83)
Public Land Survey
System
(PLSS)
Total
Depth
(ft)
Elevation
(ft)
Completion
Date Owner Well # Well Type Status
Confining
Zone
Penetration
Well
2 121372155200 237387 39.815638 -90.084967 T16N,R9W,Sec 23 41 19920313 Nickel, Gerald 1 Water Private Water Well No
3 121372182100 300966 39.815638 -90.084967 T16N,R9W,Sec 23 46 19971104 Nickel, Gerald & Diane 1 Water Private Water Well No
13 121372173400 297871 39.811987 -90.07805 T16N,R9W,Sec 26 37 19960213 Keltner, Dale Water Private Water Well No
23 121370024000 39.780186 -90.094859 T15N,R9W,Sec 3 402 642 19230101 Trotter, L.B. 1 Oil & Gas Dry and Abandoned, No Shows No
24 121372097800 39.776078 -90.080727 T15N,R9W,Sec 3 327 632 0 Harris Unknown / other Unknown, Plugged No
28 115642 39.82166 -90.041238 T16N,R8W,Sec 19 25 1870 W W Robertson Water No
38 116456 39.776761 -90.107843 T15N,R9W,Sec 4 30 Rayburn Water No
39 116457 39.776761 -90.107843 T15N,R9W,Sec 4 32 Greene Water No
40 115725 39.821959 -90.097446 T16N,R9W,Sec 22 18 K Brown Water No
41 115726 39.821959 -90.097446 T16N,R9W,Sec 22 30 E C Trotter Water No
52 115640 39.836203 -90.022343 T16N,R8W,Sec 17 25
J H Hubbs
Water
No
53 115641 39.83617 -90.041154 T16N,R8W,Sec 18 32
1850 H Robinson
Water
No
54 115643 39.821671 -90.022214 T16N,R8W,Sec 20 26
1900 S Weinfeldt
Water
No
55 115644 39.821671 -90.022214 T16N,R8W,Sec 20 30
1904 Robinson
Water
No
56 115649 39.807149 -90.022402 T16N,R8W,Sec 29 26
M Walbaum
Water
No
57 115653 39.793 -90.022 T16N,R8W,Sec 32 18
Beggs
Water
No
58 121372070800 116522 39.77156 -90.0878 T15N,R9W,Sec 3 50
19770320 Linebarger, David
Water
No
59 121372118300 116520 39.769673 -90.080523 T15N,R9W,Sec 3 42
Harris, Frank R.
Water Private Water Well No
60 121372070700 116521 39.769673 -90.080523 T15N,R9W,Sec 3 40
harris F R
Water
No
61 116458 39.777 -90.126 T15N,R9W,Sec 5 30
Gary S. B.
Water
No
62 116464 39.761 -90.126 T15N,R9W,Sec 8 30 Cleray W
Water
No
63 116465 39.761 -90.126 T15N,R9W,Sec 8 40 Coons A
Water
No
64 116466 39.761 -90.107 T15N,R9W,Sec 9 30 Wallbaum W M
Water
No
65 116467 39.761 -90.107 T15N,R9W,Sec 9 35 Trotter l B
Water
No
66 227314 39.761 -90.107 T15N,R9W,Sec 9 40 Carl Shinnall #1
Water
No
67 116468 39.761 -90.089 T15N,R9W,Sec 10 30 Orear R
Water
No
68 121372070900 116525 39.765755 -90.080645 T15N,R9W,Sec 10 40 Linebarger D
Water
No
69 116469 39.761 -90.07 T15N,R9W,Sec 11 30 Collins W
Water
No
70 116470 39.761 -90.07 T15N,R9W,Sec 11 32 Lockhart G
Water
No
71 116393 39.776799 -90.032936 T15N,R8W,Sec 6 25 1923
Water
No
72 116394 39.776799 -90.032936 T15N,R8W,Sec 6 28 C Smith
Water
No
73 121372116800 116436 39.784526 -90.041604 T15N,R8W,Sec 6 54 19770226 Becker, Carl J. 1 Water Livestock Watering Well No
74 121372116900 116435 39.784526 -90.041604 T15N,R8W,Sec 6 43 19781010 Becker, Carl J. 1 Water Private Water Well No
75 121372117000 116434 39.782453 -90.041567 T15N,R8W,Sec 6 27 19761213 Smith, Lloyd E. 1 Water Livestock Watering Well No
76 121372161900 39.766277 -90.041266 T15N,R8W,Sec 7 26 Walpole, Ron
Water
No
77 116395 39.763 -90.033 T15N,R8W,Sec 7 30
Water
No
78 115696 39.836221 -90.059875 T16N,R9W,Sec 13 25 V R Mc Clure
Water
No

Area of Review and Corrective Action Plan for FutureGen Alliance Page B35 of 46
Permit Number: IL-137-6A-0003 (well #3)
Map ID API Number ISWS ID
Latitude
(NAD 83)
Longitude
(NAD 83)
Public Land Survey
System (PLSS)
Total
Depth
(ft)
Elevation
(ft)
Completion
Date Owner Well # Well Type Status
Confining
Zone
Penetration
Well
79 115697 39.836221 -90.059875 T16N,R9W,Sec 13 27 U B Fox Water No
80 115698 39.836221 -90.059875 T16N,R9W,Sec 13 27 G W Lewis Water No
81 115699 39.836362 -90.078662 T16N,R9W,Sec 14 30 J Parrat Water No
82 115700 39.836362 -90.078662 T16N,R9W,Sec 14 28 C W Lewis Water No
83 115701 39.836362 -90.078662 T16N,R9W,Sec 14 28 J W Parrat Water No
84 115702 39.836362 -90.078662 T16N,R9W,Sec 14 32 J Hodgeson Water No
85 121372203900 356742 39.830101 -90.102984 T16N,R9W,Sec 15 47 20030910 Lomar Hager Construction Water Private Water Well No
86 115703 39.836486 -90.097369 T16N,R9W,Sec 15 24 G Noulty Water No
87 115704 39.836486 -90.097369 T16N,R9W,Sec 15 30 L Lamkaular Water No
88 115705 39.836486 -90.097369 T16N,R9W,Sec 15 35 E E Hart Water No
89 115706 39.8365 -90.116151 T16N,R9W,Sec 16 23 S Jumper Water No
90 115707 39.8365 -90.116151 T16N,R9W,Sec 16 25 H Wester Water No
91 115722 39.821967 -90.116263 T16N,R9W,Sec 21 30 T J Ward Water No
92 115724 39.821967 -90.116263 T16N,R9W,Sec 21 30 C Trotter Water No
93 216249 39.821967 -90.116263 T16N,R9W,Sec 21 28 1934 Wm Noulty Water No
94 121370028400 39.822767 -90.073164 T16N,R9W,Sec 23 405 19540301 Keltner 1 Water
No
95 121372155100 237377 39.820978 -90.077895 T16N,R9W,Sec 23 42 19920414 Allen, John D. 1 Water Private Water Well No
96 121372207600 365042 39.822764 -90.075515 T16N,R9W,Sec 23 46 20040715 Burton, Larry
Water Private Water Well No
97 121372128400 115776 39.826288 -90.058992 T16N,R9W,Sec 24 40 19760220 Robinson, Leroy A. 1 Water Private Water Well No
98 121372128500 115777 39.828869 -90.059535 T16N,R9W,Sec 24 37 19781214 Romine, Buddy 1 Water Private Water Well No
99 121372211600 420169 39.813876 -90.103667 T16N,R9W,Sec 27 35 20060809 Donnan, Jeff
Water Private Water Well No
100 115744 39.807541 -90.116512 T16N,R9W,Sec 28 110 Noah B Fox
Water
No
101 115745 39.807541 -90.116512 T16N,R9W,Sec 28 28 Noah B Fox
Water
No
102 115746 39.807541 -90.116512 T16N,R9W,Sec 28 30 C Holdbrook
Water
No
103 115723 39.807541 -90.116512 T16N,R9W,Sec 28 28 W Noulty
Water
No
104 121372203000 348692 39.806645 -90.122622 T16N,R9W,Sec 28 42 Kendra Swain
Water
No
105 115759 39.792956 -90.116724 T16N,R9W,Sec 33 30 H Swain
Water
No
106 115760 39.792956 -90.116724 T16N,R9W,Sec 33 28 L L Hart
Water
No
107 121372155000 39.822856 -90.119949 T16N,R9W,Sec 21 Spradlin, Jack
Water
No
108 121370011400 39.833775 -90.10777 T16N,R9W,Sec 16 385 616 19551101 Wolfe, Eliz 1 Oil & Gas Dry and Abandoned, No Shows, Plugged No
109 121370011500 39.80091 -90.040421 T16N,R8W,Sec 30 420 635 19560101 Beilschmidt 1 Oil & Gas Dry and Abandoned, No Shows, Plugged No
110 121370011600 39.815108 -90.028322 T16N,R8W,Sec 20 365 610 19551201 Robinson, Howard 1 Oil & Gas Dry and Abandoned, No Shows, Plugged No
111 121370018900 39.825408 -90.062536 T16N,R9W,Sec 24 200 19440101 Lewis, E. C.
Oil & Gas Dry Hole No
112 121370024100 39.769077 -90.111454 T15N,R9W,Sec 4 580 Rayborn 1 Oil & Gas Gas Producer No
113 121370044200 39.770193 -90.110273 T15N,R9W,Sec 4 350 Rayburn 1 Oil & Gas Gas Producer No
114 121372086900 39.769679 -90.098565 T15N,R9W,Sec 4 301
Coal Test
No
115 121370024200 39.778927 -90.119618 T15N,R9W,Sec 5 423 Green, Laura & Effie 1 Oil & Gas Gas Producer No
116 121370024600 39.764523 -90.098492 T15N,R9W,Sec 9 293 Baxter 2 Oil & Gas Dry and Abandoned, Gas Shows No
117 121372094800 39.767065 -90.11144 T15N,R9W,Sec 9 325 Beilschmidt 1 Oil&Gas Temporarily Abandoned No
118 121372105200 39.763524 -90.104346 T15N,R9W,Sec 9 Leinberger 2 Oil&Gas Permit to Drill Issued No
119 121370007900 39.766464 -90.091366 T15N,R9W,Sec 10 295 Dunlap 8 Oil & Gas Gas Producer No
120 121372084800 39.766422 -90.065678 T15N,R9W,Sec 11 243
Coal Test
No
121 121370030900 39.806625 -90.105838 T16N,R9W,Sec 27 324 610 19591001 Fox, Lyman 1 Oil & Gas Dry and Abandoned, No Shows, Plugged No
122 121370033200 39.788212 -90.03349 T16N,R8W,Sec 31 323 641 19271001 Corrington 1 Oil & Gas Dry and Abandoned, No Shows No

Area of Review and Corrective Action Plan for FutureGen Alliance Page B36 of 46
Permit Number: IL-137-6A-0003 (well #3)
Map ID API Number ISWS ID
Latitude
(NAD 83)
Longitude
(NAD 83)
Public Land Survey
System (PLSS)
Total
Depth
(ft)
Elevation
(ft)
Completion
Date Owner Well # Well Type Status
Confining
Zone
Penetration
Well
123 121370062300 39.828772 -90.06935 T16N,R9W,Sec 24 814 624 19700701 #MA-3 Stratigraphic or
Structure Test
Structure Test, Plugged No
124 121372068000 39.792709 -90.039363 T16N,R8W,Sec 31 142 641 19700518 Flynn, Robert
Coal Test No
125 121372088400 39.829096 -90.098826 T16N,R9W,Sec 22 318 621 0
Coal Test No
126 121372088600 39.801122 -90.108499 T16N,R9W,Sec 28 301 621 0
Coal Test No
127 121372067800 39.814431 -90.023514 T16N,R8W,Sec 20 130 610 19700507 Newberry, Lucille
Coal Test No
128 121372086000 39.83138 -90.055009 T16N,R9W,Sec 13 301 619 0
Coal Test No

Area of Review and Corrective Action Plan for FutureGen Alliance Page B37 of 46 Page B37 of 48
Permit Number: IL-137-6A-0003 (Well #3)
Figure 12. Wells Located Within the Survey Area

Area of Review and Corrective Action Plan for FutureGen Alliance Page B38 of 46 Page B38 of 48
Permit Number: IL-137-6A-0003 (Well #3)
Proposed Operating Data (Operational Information)
Figure 13 and Figure 14 show the well design for the representative case for the refined area of
the model domain in plan view, in 3D view, and in cross section view, respectively. Injection
into four lateral wells with a well-bore radius of 4.5 in. was modeled with the lateral leg of each
well located within the best layer of the injection zone to maximize injectivity. Only the non-
cased open sections of the wells are specified in the model input file because only those sections
are delivering CO2 to the formation. The well design modeled in this case is the open borehole
design 6
, therefore part of the curved portion of each well is open and thereby represented in the
model in addition to the lateral legs. The orientation and lateral length of the wells, as well as
CO2 mass injection rates, were chosen so that the resulting modeled CO2 plume would avoid
sensitive areas. The coordinates of the screened portion of the injection wells are shown in Table
10. The injection rate was assigned to each well according to the values in Table 11 for a total
injection rate of 1.1 MMT/yr for 20 years. A maximum injection pressure of 2,252.3 psi (2,237.6
psig) was assigned at the top of the open interval (depth of 3,850 ft bgs or an elevation of -3,231
ft), based on 90 percent of the fracture gradient described in Section 3.5 (0.65 psi/ft).
3D View Plan View
Figure 13. Operational Well Design for Representative Case Scenario as Implemented in the
Numerical Model (with lateral legs of the injection wells shown in red and the cross section
lines shown in yellow)
6 Despite the models use of an open-hole design, the actual proposed construction is a cased hole with perforations.

Area of Review and Corrective Action Plan for FutureGen Alliance Page B39 of 46 Page B39 of 48
Permit Number: IL-137-6A-0003 (Well #3)
Figure 14. Cross Sections of CO2 Injection Wells
Table 10. Coordinates (NAD1983 UTM Zone 16N) of Open Portions of the Injection Wells
Coordinate 1(ft) Coordinate 2(ft) Coordinate 3(ft) Coordinate 4(ft)
x y z x y z x y z x y z
Well1 777079 14468885 -3220 777263 14468901 -3330 777592 14468929 -3387 779086 14469060 -3394
Well2 776898 14468571 -3220 776976 14468404 -3330 777116 14468105 -3388 778172 14465839 -3396
Well3 776617 14468578 -3220 776530 14468416 -3330 776375 14468124 -3382 775202 14465917 -3377
Well4 776451 14468829 -3220 776267 14468813 -3330 775938 14468785 -3377 774444 14468654 -3368
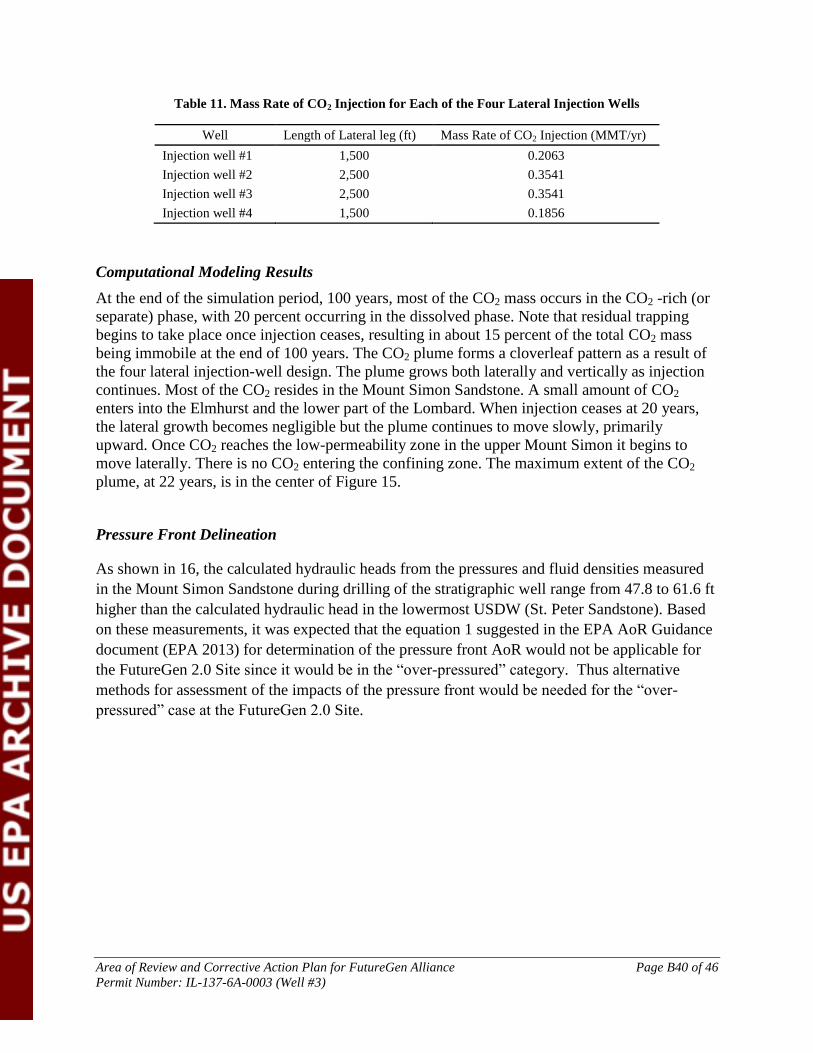
Area of Review and Corrective Action Plan for FutureGen Alliance Page B40 of 46 Page B40 of 48
Permit Number: IL-137-6A-0003 (Well #3)
Table 11. Mass Rate of CO2 Injection for Each of the Four Lateral Injection Wells
Well Length of Lateral leg (ft) Mass Rate of CO2 Injection (MMT/yr)
Injection well #1 1,500 0.2063
Injection well #2 2,500 0.3541
Injection well #3 2,500 0.3541
Injection well #4 1,500 0.1856
Computational Modeling Results
At the end of the simulation period, 100 years, most of the CO2 mass occurs in the CO2 -rich (or
separate) phase, with 20 percent occurring in the dissolved phase. Note that residual trapping
begins to take place once injection ceases, resulting in about 15 percent of the total CO2 mass
being immobile at the end of 100 years. The CO2 plume forms a cloverleaf pattern as a result of
the four lateral injection-well design. The plume grows both laterally and vertically as injection
continues. Most of the CO2 resides in the Mount Simon Sandstone. A small amount of CO2
enters into the Elmhurst and the lower part of the Lombard. When injection ceases at 20 years,
the lateral growth becomes negligible but the plume continues to move slowly, primarily
upward. Once CO2 reaches the low-permeability zone in the upper Mount Simon it begins to
move laterally. There is no CO2 entering the confining zone. The maximum extent of the CO2
plume, at 22 years, is in the center of Figure 15.
Pressure Front Delineation
As shown in 16, the calculated hydraulic heads from the pressures and fluid densities measured
in the Mount Simon Sandstone during drilling of the stratigraphic well range from 47.8 to 61.6 ft
higher than the calculated hydraulic head in the lowermost USDW (St. Peter Sandstone). Based
on these measurements, it was expected that the equation 1 suggested in the EPA AoR Guidance
document (EPA 2013) for determination of the pressure front AoR would not be applicable for
the FutureGen 2.0 Site since it would be in the “over-pressured” category. Thus alternative
methods for assessment of the impacts of the pressure front would be needed for the “over-
pressured” case at the FutureGen 2.0 Site.

Area of Review and Corrective Action Plan for FutureGen Alliance Page B41 of 46 Page B41 of 48
Permit Number: IL-137-6A-0003 (Well #3)
Figure 15. FutureGen Area of Review inclusive of the CO2 plume and the area of elevated pressure
delineated as the 10 psi contour at 60 years

Area of Review and Corrective Action Plan for FutureGen Alliance Page B42 of 46 Page B42 of 48
Permit Number: IL-137-6A-0003 (Well #3)
Figure 16. Observed Hydraulic Head Comparison between the Unconsolidated Quaternary Aquifer, St. Peter
Sandstone, and Mount Simon Sandstone within the FutureGen Stratigraphic Well
Alternative approaches considered for delineation of an AoR inclusive of an area of elevated
pressure
The FutureGen Alliance considered the applicability of and evaluated the project using an
analytical solution (Cihan et al., 2011; 2013, referred to in Table 13 as the “LBNL” approach)
and a range of numerical solutions (Table 13). The objective of these analyses was to assess,
calculate, and account for critical pressure, which is the pressure great enough to mobilize fluids
up an open conduit (i.e., an artificial penetration, fault, or fracture) from the injection zone into
the overlying USDW. Methods evaluated are presented in Table 13.
Table 13. Methods Evaluated for Pressure Front Delineation
Approach Results
AoR Guidance Equation 1 Not applicable
Nicot (2008) 13.76 psi
Birkholzer (2011) 9.65 psi
LBNL Non-Conservative: Assuming thief zones Plume-sized AoR
LBNL Conservative: Assuming no thief zones Large AoR

Area of Review and Corrective Action Plan for FutureGen Alliance Page B43 of 46 Page B43 of 48
Permit Number: IL-137-6A-0003 (Well #3)
Pressure delineated AoR
Acknowledging that each approach is an approximation with a set of assumptions, that there are
applicable components of a number of the approaches considered, and with a focus on adopting a
conservative, protective approach for the pressure-delineated AoR, the FutureGen Alliance, in
consultation with EPA, delineated the AoR as the maximum extent of the 10 psi contour during
the life of the project life (60 years) as shown in Figure 15.
Corrective Action Plan and Schedule
No wells have been identified within the AoR that require corrective action.
Area of Review Reevaluation Plan and Schedule
Reevaluation Cycle
The FutureGen Alliance will reevaluate the AoR on an annual basis for the first 5 years
following the initiation of injection operations (Figure 17). After the fifth year of injection, the
AoR will be updated at a minimum of every 5 years as required by 40 CFR 146.84(b)(2)(i). An
annual reevaluation in the first 5 years is intended to account for any operational variation during
the startup period.
Some conditions will warrant reevaluation prior to the next scheduled cycle. To meet the intent
of the regulations and protect USDWs, the following six conditions will warrant reevaluation of
the AoR:
1. Exceeding Fracture Pressure Conditions: Pressure in any of the injection or monitoring
wells exceeding 90 percent of the geologic formation fracture pressure at the point of
measurement. This would be a violation of the permit conditions. The Testing and
Monitoring Plan provides discussion of pressure monitoring.
Action: The computational model will be calibrated to match measured pressures. Model
outputs that calculate the change in AoR will be provided to EPA.
2. Exceeding Established Baseline Hydrochemical/Physical Parameter Patterns: A
statistically significant difference between observed and baseline hydrochemical/physical
parameter patterns (e.g., fluid conductivity, pressure, temperature) within the Ironton
Formation immediately above the confining zone (ACZ1 and ACZ2 wells). The Student’s t-
test statistical procedure will be used to compare background (baseline) with observed
results. The Testing and Monitoring Plan provides extended information regarding how
pressure, temperature, and fluid conductivity will be monitored within the Ironton Formation.

Area of Review and Corrective Action Plan for FutureGen Alliance Page B44 of 46 Page B44 of 48
Permit Number: IL-137-6A-0003 (Well #3)
Action: In the event that hydrochemical/physical parameter trends suggest that leakage may
be occurring, either the computational model or other models will be used to understand the
observational parameter behavior.
3. Compromise in Injection Well Mechanical Integrity: A significant change in pressure
within the protective annular pressurization system surrounding each injection well that
indicates a loss of mechanical integrity at an injection well.
Action: Injection wells suspected of mechanical integrity issues will be shut down and the
cause of the pressure deviation determined. Mechanical integrity testing will be conducted
and the computational model will be updated with mechanical integrity results to determine
the severity and extent of the loss of containment. The Testing and Monitoring Plan provides
extended information about the mechanical integrity tests that will be conducted in the
injection wells.
4. Departure in Anticipated Surface Deformation Conditions: Surface deformation
measurements that indicate an asymmetric or otherwise heterogeneous evolution of the
injection zone pressure front, resulting in larger than predicted surface deformation outside
the CO2 plume. Areal surface deformation will be monitored using several technologies
including differential synthetic aperture radar interferometry (DInSAR), which is a radar-
based method that can measure very small changes in ground-surface elevation linked to
pressure variations at depth. The area surveyed will extend beyond the predicted maximum
extent of the CO2 plume. If a measurable rise in the ground surface occurs outside the
predicted extent, the AoR will be re-evaluated. The Testing and Monitoring Plan provides
extended information about surface deformation monitoring.
Action: The computational model will be calibrated to match calculated pressures if they
vary from the predicted deformation/pressure calculations.
5. Seismic Monitoring Identification of Subsurface Structural Features: Seismic
monitoring data indicate the possible presence of a fault or fracture near the CO2 injection
zone in the sedimentary cover or in the basement (concentration of microearthquakes of
M<<1 in elongated clusters). The Testing and Monitoring Plan provides extended
information about the microseismic monitoring network.
Action: The cause of the indicated microseismicity patterns will be evaluated. In
conjunction, various operational parameters will be tested using the computational model to
determine if the microseismic activity can be controlled to acceptable levels
6. Seismic Monitoring Identification of Unexpected Plume Pattern: Seismic monitoring
data indicate a CO2 plume migration outside the predicted extent. The observation of
microearthquakes (M<<1) may also help define the actual shape of the maximum pressure
field associated with the plume extensions.
Action: The computational model will be calibrated to match the location of observed
microseismicity patterns indicative of plume extensions.

Area of Review and Corrective Action Plan for FutureGen Alliance Page B45 of 46 Page B45 of 48
Permit Number: IL-137-6A-0003 (Well #3)
7. Other triggers for reevaluation may include: facility operating changes; new injection
activities or other deep wells added in the AoR; new owner/operators; new site
characterization data; a seismic event or other emergency; and unexpected changes in rate,
direction, and extent of plume/pressure front movement.
Reevaluation Strategy
If any of these conditions occurs, the FutureGen Alliance will reevaluate the AoR to comply with
requirements at 40 CFR 146.84 as described below. Ongoing direct and indirect monitoring data,
which provide relevant information for understanding the development and evolution of the CO2
plume, will be used to support reevaluation of the AoR. These data include: 1) the chemical and
physical characteristics of the CO2 injection stream based on sampling and analysis;
2) continuous monitoring of injection mass flow rate, pressure, temperature, and fluid volume;
3) measurements of pressure response at all site monitoring wells; and 4) CO2 arrival and
transport response at all site monitoring wells based on direct aqueous measurements and
selected indirect monitoring method(s). The FutureGen Alliance will compare these
observational data with predicted responses from the computational model and if significant
discrepancies between the observed and predicted responses exist, the monitoring data will be
used to recalibrate the model (Figure 17). In cases where the observed monitoring data agree
with model predictions, an AoR reevaluation will consist of a demonstration that monitoring data
are consistent with modeled predictions. As additional characterization data are collected, the site
conceptual model will be revised and the modeling steps described above will be repeated to
incorporate new knowledge about the site.
The FutureGen Alliance will submit a report notifying the UIC Program Director of the results of
this reevaluation within 90 days of detection. At that time, the FutureGen Alliance will either:
1) submit the monitoring data and modeling results to demonstrate that no adjustment to the AoR
is required; or 2) modify its Corrective Action, Emergency and Remedial Response, and other
plans to account for the revised AoR. All modeling inputs and data used to support AoR
reevaluations will be retained by the FutureGen Alliance for the period of the project.
To the extent that the reevaluated AoR is different from the one identified in this supporting
documentation, the FutureGen Alliance will identify all active and abandoned wells and
underground mines that penetrate the confining zone (the Eau Claire Formation) in the
reevaluated AoR and will perform corrective actions on those wells. As needed, the FutureGen
Alliance will revise all other plans, such as the Emergency and Remedial Response Plan, to take
into account the reevaluated AoR and will submit those plans to the UIC Program Director for
review and approval.
Note that seismic events are covered under the Emergency and Remedial Response Plan. A
tiered approach to responding to seismic events will be based on magnitude and location. A
notification procedure is provided in that plan.
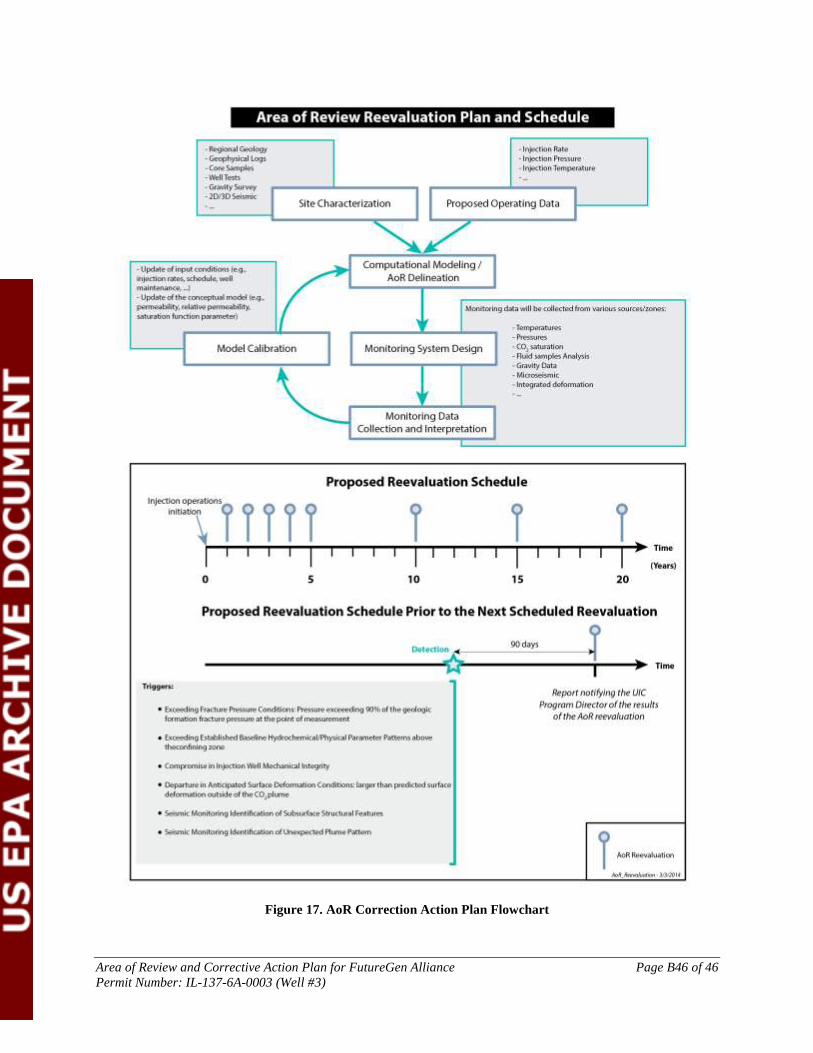
Area of Review and Corrective Action Plan for FutureGen Alliance Page B46 of 46 Page B46 of 48
Permit Number: IL-137-6A-0003 (Well #3)
Figure 17. AoR Correction Action Plan Flowchart