Embed Size (px)
Citation preview
Washington Metropolitan Area Transit Authority
Board Action/Information Summary
Action Information MEAD Number: 201854
Resolution: Yes No
TITLE:
Vital Signs 2016 Annual Report
PRESENTATION SUMMARY:
As a regional transportation system, Metro's systemwide performance is captured inthe Vital Signs Report. The Vital Signs Report provides analysis of a focused set ofKey Performance Indicators (KPIs) that monitor longterm progress in deliveringquality performance.
PURPOSE:
Vital Signs communicates the transit system's performance to the Board of Directorson a quarterly and annual basis. The public and other stakeholders are invited tomonitor Metro's performance using a webbased scorecardwmata.com/about/records/scorecard.
Metro's managers measure what matters and hold themselves accountable tostakeholders via a focused set of KPIs that are reported publicly in Vital Signs. Thereport is organized by the Boardadopted strategic goals that align actions to improveperformance and deliver results.
Vital Signs is different from most public performance reports in that it providessystematic, datadriven analysis of KPIs by answering three questions: Is Metroachieving its four strategic goals? Why did performance change? What actions arebeing taken to improve performance? The answers reveal the challenges andcomplexities of the operation.
DESCRIPTION:
Key Highlights:
For the first time, the Vital Signs report includes benchmarking results withpeer transit agencies. In addition, this 2016 Annual Vital Signs Reportdocuments results for Metro's KPIs, taking a look back at the entirety of 2016compared to target. Performance results show that in the areas of safety andquality service:
Four KPIs were better than or near target:
Page 4 of 54
Bus Fleet ReliabilityRail Fleet ReliabilityElevator AvailabilityEscalator Availability
Five KPIs were worse than target:
Bus OnTime Performance Customer Satisfaction (bus and rail)Customer Injury RateEmployee Injury RateCrime Rate (despite an decrease in actual crime incidents)
This is the fourth quarterly report for the rail customer ontime performance("rail customer OTP") pilot measure. Following completion of the pilot, a targetfor rail customer OTP will be set for 2017.
Background and History:
Metro has established many of the performancebased planning andprogramming elements necessary to become a more strategic, accountableand transparent organization. In 2015, the Vital Signs Report was recognizedby Transportation Research Board’s Special Task Force on Data for DecisionMakers as a best practice in communicating performance information.
Key to progress in becoming a performancebased organization was theestablishment of a standalone Office of Performance in 2010. The office isdedicated to expanding the use of performance information to guide decisions,to promote Metro’s benefits in the region and to unify employees to accomplishagency goals. Since its inception, the office has developed a range ofperformance tools that connect daytoday work of Metro’s employees toagency goals.
Goals and Target-Setting: In its most recent long range plan, Momentum, the Board of Directors definedfour strategic goals:
• Build and Maintain a Premier Safety Culture and System • Meet or Exceed Expectations by Consistently Delivering Quality Service • Improve Regional Mobility and Connect Communities • Ensure Financial Stability and Invest in our People and Assets
These four strategic goals define where Metro wants to go and provideguidance for decisions across the agency. For each goal, the Office ofPerformance has worked with departments across the agency to developbusiness plans with measures and key actions that demonstrate departmentalcontribution to these goals. Additionally, each fall, the Office of Performance
Page 5 of 54
facilitates a work session with executives to determine annual targets for eachKPI.
Discussion:
2016 WMATA KPI Results
As recently announced, the GM/CEO has pledged to return Metro to the worldclass transit system it once was by bringing the same passion andcommitment to our job as our riders bring to theirs through the Back2Goodplan. Some of those initiatives are discussed below in context with the annualresults.
Bus fleet reliability experienced the most improvement since 2013 as a resultof retrofits and proactive replacement of various subsystems and parts,completion of 100 midlife overhauls for the year and replacement of 282buses resulting in a betterthantarget performance. Bus ontimeperformance was 3.4% worse than target of 79% for the year and declined2% compared to 2015 due to buses running ahead of schedule and increasesin weekday peakperiod traffic congestion due to the SafeTrack program thatbegan in the Q2/2016. Bus customer satisfaction remained statisticallyunchanged throughout the year at 77%.
In the area of railcar reliability, immediate parts shortage remedies,revamped mechanic training and the introduction of more 7000series railcarsresulted in 13% fewer railcarrelated delays in 2016 than in 2015, meeting the2016 target of 65,000 miles before causing a delay. These efforts permitted70% of rail customers to be on-time , while 85% of trips were completedwithin five minutes of expected arrival times. Customer perception of railperformance has plateaued over the year resulting in a rail customersatisfaction rating of 66%.
A more rigorous inspection process more than doubled unscheduledmaintenance hours of more complex repairs causing elevator availability tojust meet the 97% target. Likewise, repairs resulting from preventivemaintenance inspections took twice as long to complete; however escalatoravailability was slightly better than target at 93.5%, consistent with theprevious year.
While rail customer injuries declined, bus injuries increased due to more nonpreventable collisions, permitting the overall customer injury rate to remainsteady with 2015 performance, worse than target of 1.75, at 2.0. Employeeinjuries were worse than target of 4.5 per 200,000 hours worked also in partdue to an increase in nonpreventable collisions, stress injuries, and injuriescaused by inattentiveness resulting an annual rate of 5.4. A 9% decrease intotal ridership resulted in a slight increase in the total crime rate, despite 5%fewer Part I crimes committed in 2016 compared to 2015.
Page 6 of 54
On a fiscal year basis, we compare ridership to budget forecast. With Q1 andQ2 completed, we are below forecast by 12.3% overall, led by Rail at 14.9%.Disadvantaged Business Enterprise (DBE) participation came well short ofthe 25% goal, at 11% for FFY16.
In the strategic plan adopted by the Board of Directors in 2013, the Boardidentified performance measures for themselves/the jurisdictions to track andreview annually for the "Improve Regional Mobility and Connect Communities"goal. For bus stop accessibility, the jurisdictions well exceeded the target of100 bus stops made accessible per year. Other Board measures indicateopportunities for jurisdictions to encourage household and job growth neartransit , and make stations more accessible for walk/bike access in order toencourage ridership growth (station walk score).
FUNDING IMPACT:
The actions to improve mentioned in this information are included in the currentyear's budget. Project Manager: Andrea Burnside, Chief Performance Officer
ProjectDepartment/Office: Office of Performance
TIMELINE:
Previous Actions The Q3/2016 Vital Signs Report was presented to thecommittee in November 2016.
Anticipated actionsafter presentation
The Q1/2017 Vital Signs Report will be delivered to theCustomer Service, Operations and Security Committee inMay 2017.
Page 7 of 54
Customer Service, Operations and Security CommitteeMarch 9, 2017
Vital SignsAnnual Report
January-December 2016
Page 8 of 54
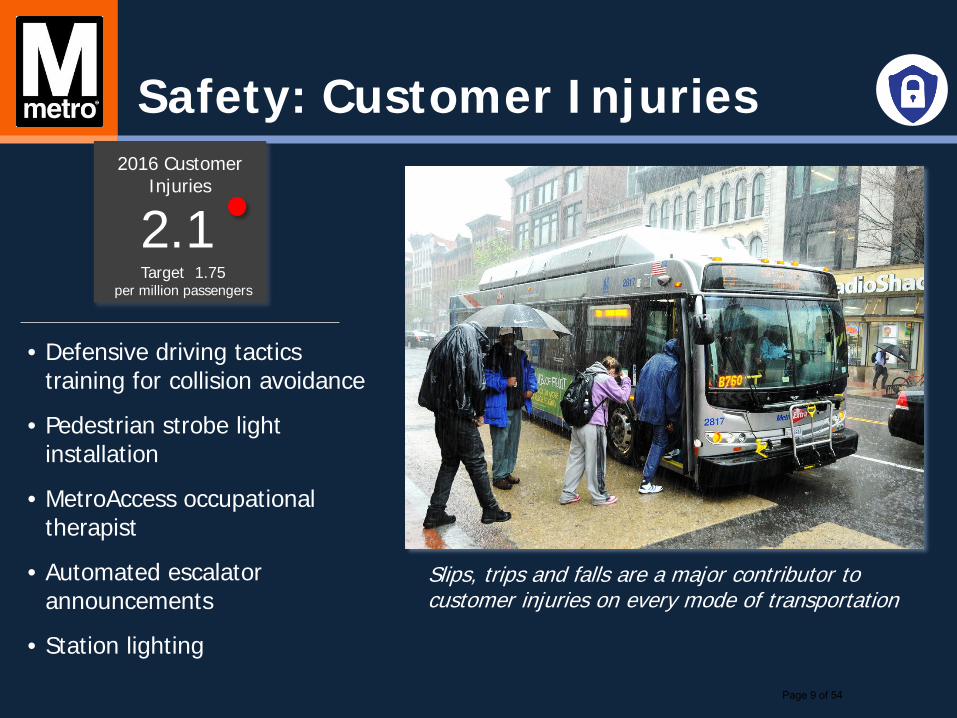
Safety: Customer Injuries
• Defensive driving tactics training for collision avoidance
• Pedestrian strobe light installation
• MetroAccess occupational therapist
• Automated escalator announcements
• Station lighting
Slips, trips and falls are a major contributor to customer injuries on every mode of transportation
2.12016 Customer
Injuries
Target 1.75per million passengers
Page 9 of 54
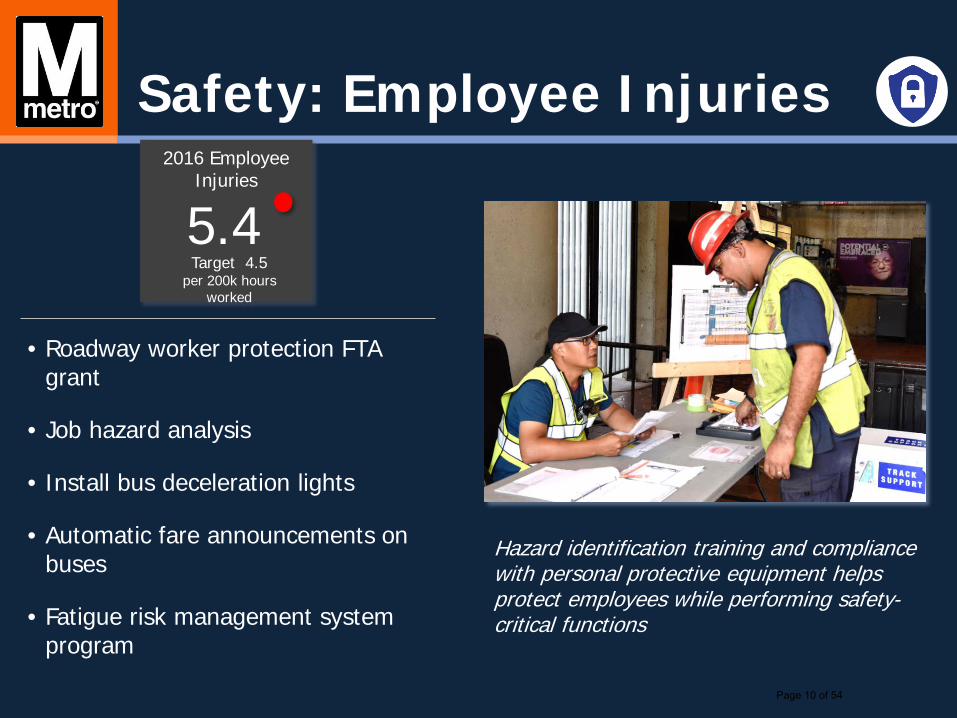
5.42016 Employee
Injuries
Target 4.5per 200k hours
worked
Safety: Employee Injuries
• Roadway worker protection FTA grant
• Job hazard analysis
• Install bus deceleration lights
• Automatic fare announcements on buses
• Fatigue risk management system program
Hazard identification training and compliance with personal protective equipment helps protect employees while performing safety-critical functions
Page 10 of 54
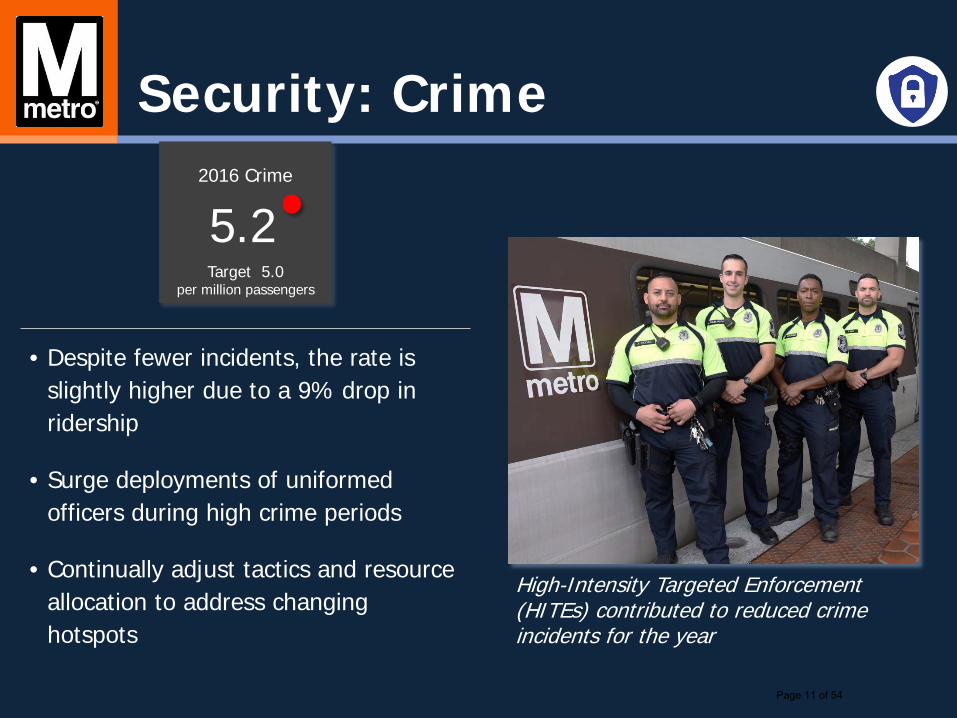
5.22016 Crime
Target 5.0 per million passengers
Security: Crime
• Despite fewer incidents, the rate is slightly higher due to a 9% drop in ridership
• Surge deployments of uniformed officers during high crime periods
• Continually adjust tactics and resource allocation to address changing hotspots
High-Intensity Targeted Enforcement (HITEs) contributed to reduced crime incidents for the year
Page 11 of 54
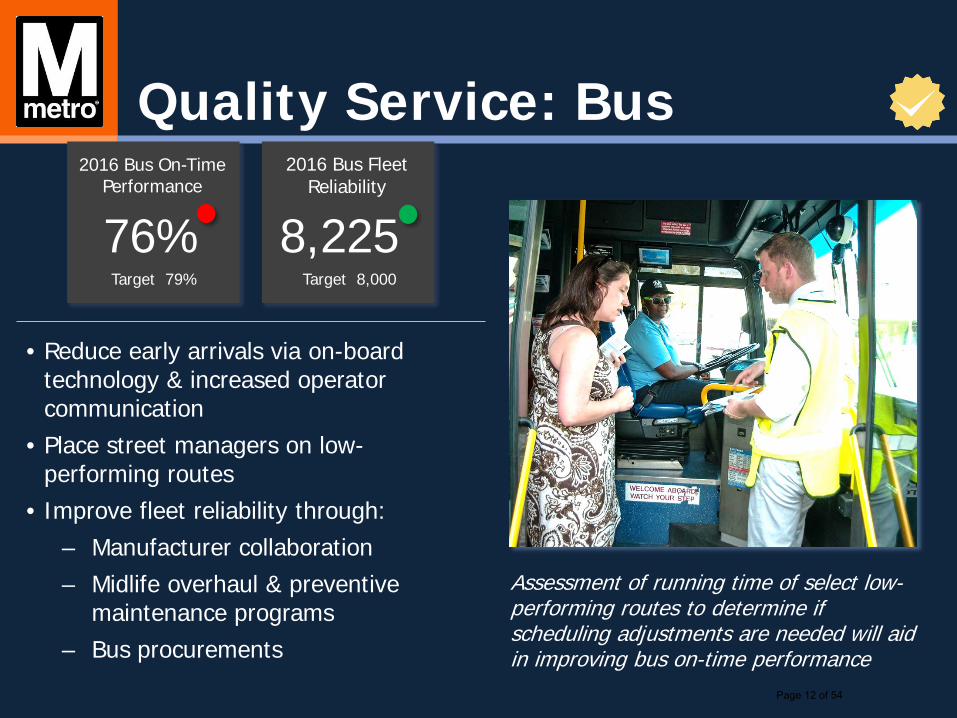
Quality Service: Bus
• Reduce early arrivals via on-board technology & increased operator communication
• Place street managers on low-performing routes
• Improve fleet reliability through:– Manufacturer collaboration– Midlife overhaul & preventive
maintenance programs– Bus procurements
Assessment of running time of select low-performing routes to determine if scheduling adjustments are needed will aid in improving bus on-time performance
76%
2016 Bus On-Time Performance
Target 79%
8,225
2016 Bus FleetReliability
Target 8,000
Page 12 of 54
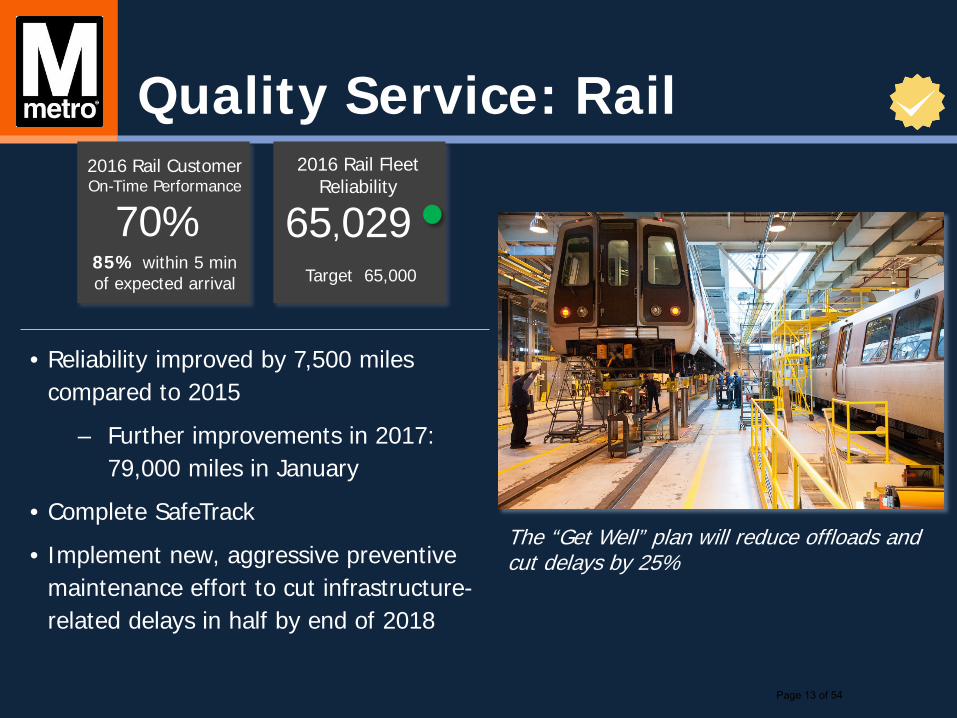
Quality Service: Rail
• Reliability improved by 7,500 miles compared to 2015
– Further improvements in 2017: 79,000 miles in January
• Complete SafeTrack
• Implement new, aggressive preventive maintenance effort to cut infrastructure-related delays in half by end of 2018
65,0292016 Rail Fleet
Reliability
Target 65,000
70%2016 Rail Customer On-Time Performance
85% within 5 min of expected arrival
The “Get Well” plan will reduce offloads and cut delays by 25%
Page 13 of 54
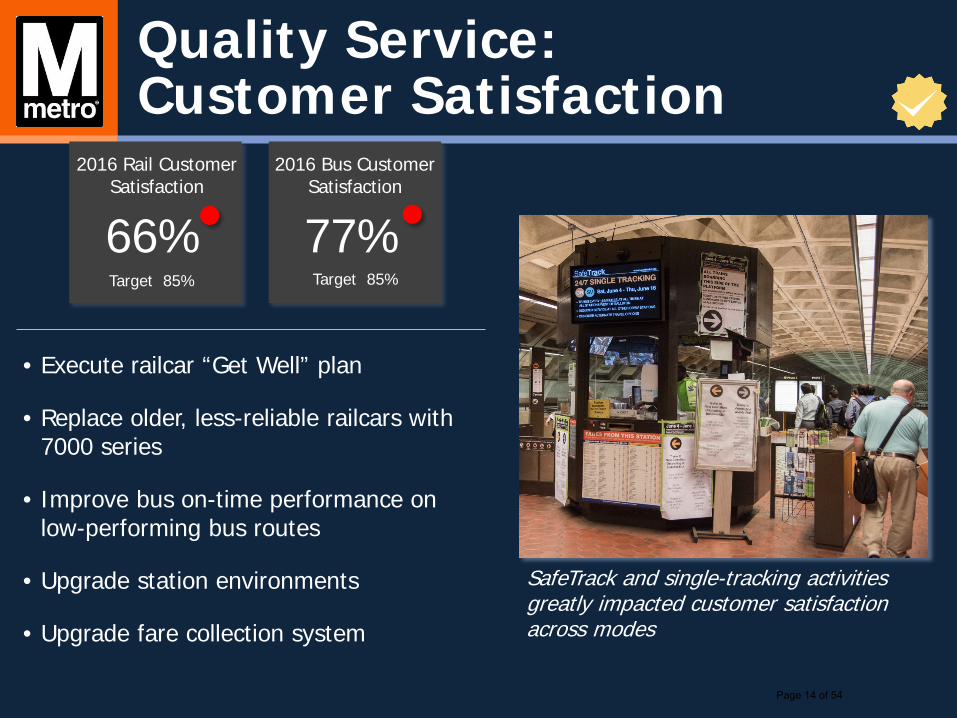
• Execute railcar “Get Well” plan
• Replace older, less-reliable railcars with 7000 series
• Improve bus on-time performance on low-performing bus routes
• Upgrade station environments
• Upgrade fare collection system
SafeTrack and single-tracking activities greatly impacted customer satisfaction across modes
Quality Service: Customer Satisfaction
77%
2016 Bus Customer Satisfaction
Target 85%
66%
2016 Rail Customer Satisfaction
Target 85%
Page 14 of 54
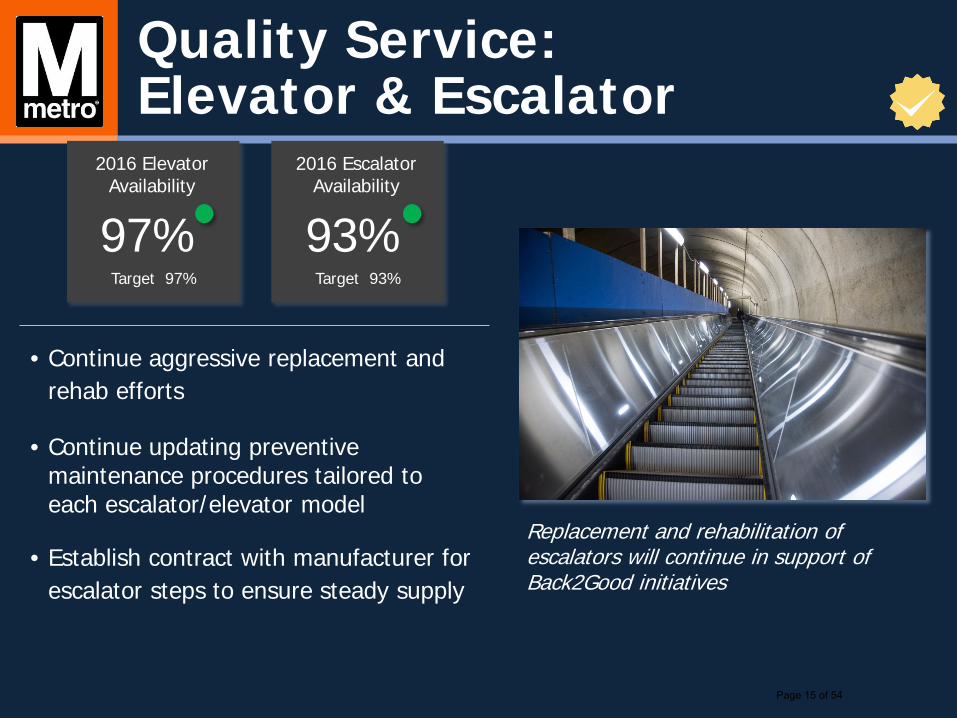
Quality Service:Elevator & Escalator
• Continue aggressive replacement and rehab efforts
• Continue updating preventive maintenance procedures tailored to each escalator/elevator model
• Establish contract with manufacturer for escalator steps to ensure steady supply
Replacement and rehabilitation of escalators will continue in support of Back2Good initiatives
93%
2016 Escalator Availability
Target 93%
97%
2016 Elevator Availability
Target 97%
Page 15 of 54
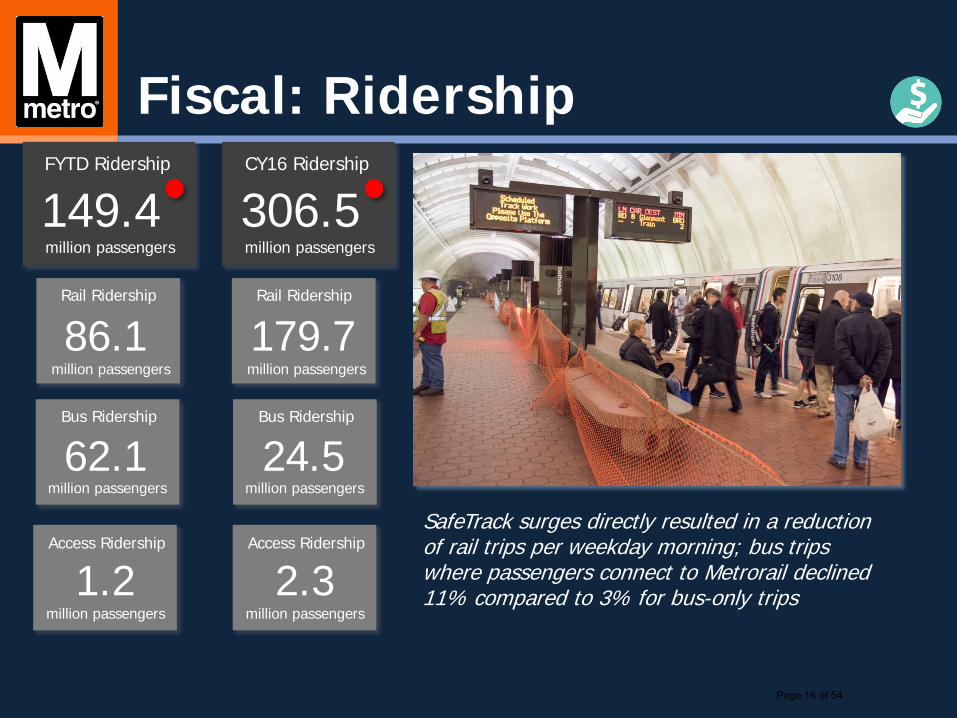
Fiscal: Ridership
SafeTrack surges directly resulted in a reduction of rail trips per weekday morning; bus trips where passengers connect to Metrorail declined 11% compared to 3% for bus-only trips
149.4FYTD Ridership
million passengers
86.1Rail Ridership
million passengers
62.1Bus Ridership
million passengers
1.2Access Ridership
million passengers
306.5CY16 Ridership
million passengers
179.7Rail Ridership
million passengers
24.5Bus Ridership
million passengers
2.3Access Ridership
million passengers
Page 16 of 54
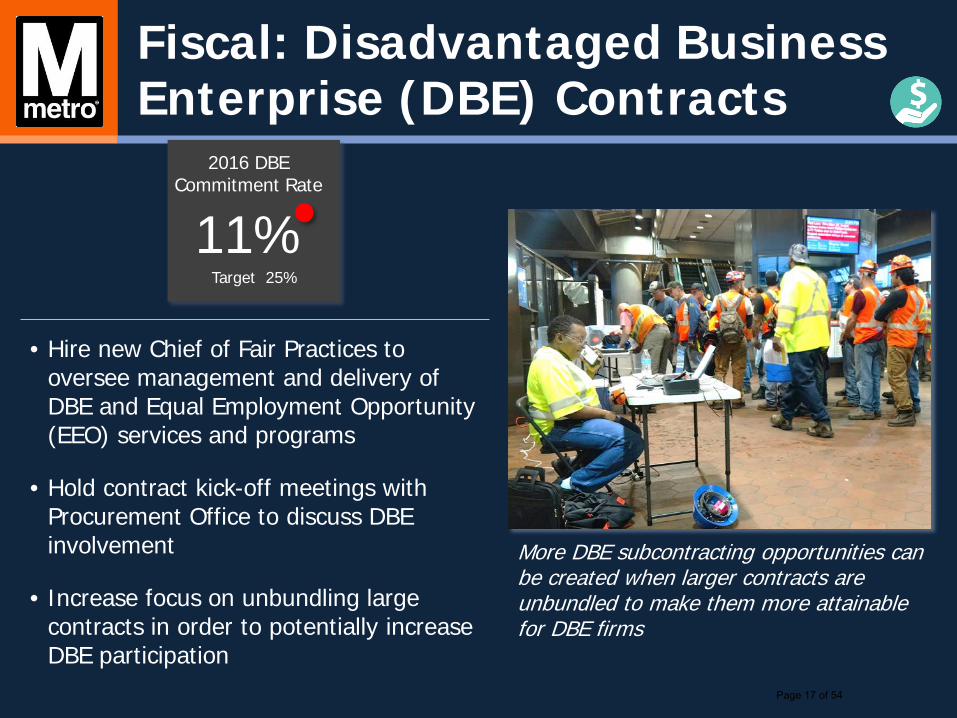
Fiscal: Disadvantaged Business Enterprise (DBE) Contracts
• Hire new Chief of Fair Practices to oversee management and delivery of DBE and Equal Employment Opportunity (EEO) services and programs
• Hold contract kick-off meetings with Procurement Office to discuss DBE involvement
• Increase focus on unbundling large contracts in order to potentially increase DBE participation
More DBE subcontracting opportunities can be created when larger contracts are unbundled to make them more attainable for DBE firms
11%
2016 DBE Commitment Rate
Target 25%
Page 17 of 54
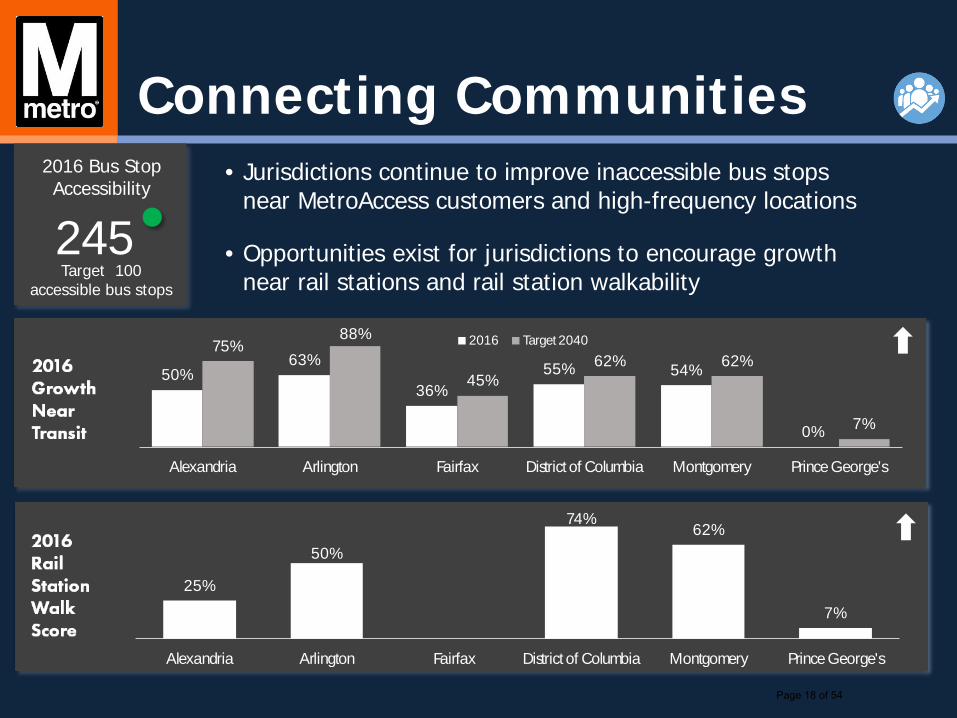
Connecting Communities
245
2016 Bus Stop Accessibility
• Jurisdictions continue to improve inaccessible bus stops near MetroAccess customers and high-frequency locations
• Opportunities exist for jurisdictions to encourage growth near rail stations and rail station walkability
25%
50%
74%62%
7%
Alexandria Arlington Fairfax District of Columbia Montgomery Prince George's
50%63%
36%55% 54%
0%
75%88%
45%62% 62%
7%
Alexandria Arlington Fairfax District of Columbia Montgomery Prince George's
2016 Target 2040
Target 100 accessible bus stops
Page 18 of 54
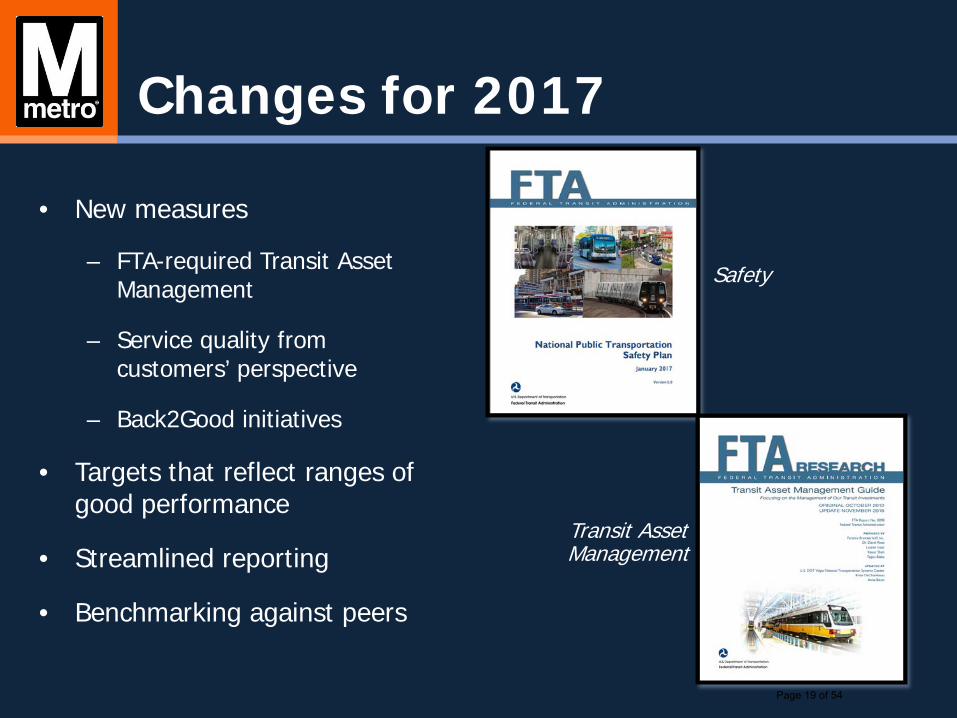
Changes for 2017
• New measures
– FTA-required Transit Asset Management
– Service quality from customers’ perspective
– Back2Good initiatives
• Targets that reflect ranges of good performance
• Streamlined reporting
• Benchmarking against peers
Transit Asset Management
Safety
Page 19 of 54
Performance
SA
FE
TY
& S
EC
UR
ITY
76%
Bus On-Time Performance
Target ≥ 79%
8,225
Bus Fleet Reliability
Target > 8,000 miles between failures
2.1
Customer Injuries
Target ≤ 1.75 per million passengers
70%
Rail Customer On-Time Performance
KPI Pilot
65,029
Rail Fleet Reliability
Target ≥ 65,000 miles between delays
5.4
Employee Injuries
Target ≤ 4.5 per 200,000 hours worked
97%
Elevator Availability
Target ≥ 97%
93%
Escalator Availability
Target ≥ 93%
5.2
Crime
Target ≤ 5.0 per million passengers
77%
Customer Satisfaction—Bus
Target ≥ 85% of surveyed customers
66%
Customer Satisfaction—Rail
Target ≥ 85% of surveyed customers
KEY
TARGET
TARGET NOT MET
TARGET MET
NOTEPercentages are rounded to the nearest whole number
16TABLE OF CONTENTS
Bus . . . . . . . . . . . . . . . . . . . . . . . 3
Rail . . . . . . . . . . . . . . . . . . . . . . . 6
Elevator/Escalator . . . . . . . . . . . 9
Customer Satisfaction . . . . . . . 10
Safety . . . . . . . . . . . . . . . . . . . . 11
Security . . . . . . . . . . . . . . . . . . 13
People and Assets . . . . . . . . . . 14
Connecting Communities . . . . . 19
Definitions . . . . . . . . . . . . . . . . . 20
Performance Data . . . . . . . . . . 26
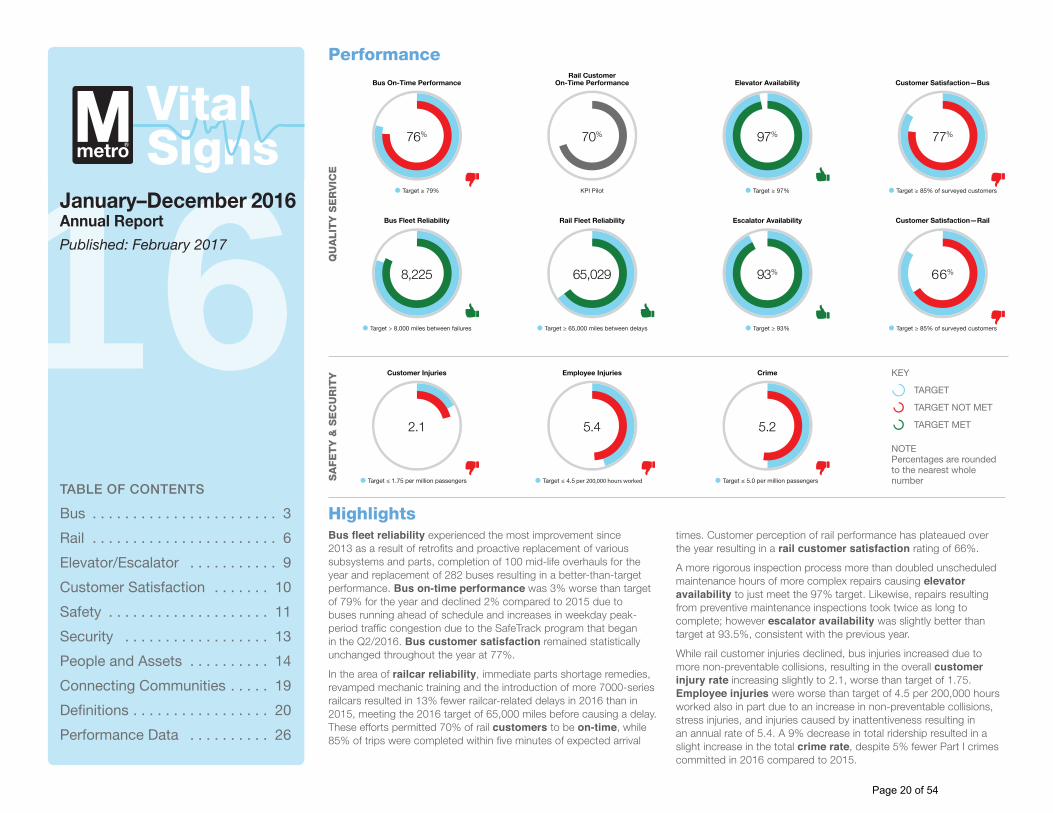
January–December 2016Annual ReportPublished: February 2017
HighlightsBus fleet reliability experienced the most improvement since 2013 as a result of retrofits and proactive replacement of various subsystems and parts, completion of 100 mid-life overhauls for the year and replacement of 282 buses resulting in a better-than-target performance. Bus on-time performance was 3% worse than target of 79% for the year and declined 2% compared to 2015 due to buses running ahead of schedule and increases in weekday peak-period traffic congestion due to the SafeTrack program that began in the Q2/2016. Bus customer satisfaction remained statistically unchanged throughout the year at 77%.
In the area of railcar reliability, immediate parts shortage remedies, revamped mechanic training and the introduction of more 7000-series railcars resulted in 13% fewer railcar-related delays in 2016 than in 2015, meeting the 2016 target of 65,000 miles before causing a delay. These efforts permitted 70% of rail customers to be on-time, while 85% of trips were completed within five minutes of expected arrival
times. Customer perception of rail performance has plateaued over the year resulting in a rail customer satisfaction rating of 66%.
A more rigorous inspection process more than doubled unscheduled maintenance hours of more complex repairs causing elevator availability to just meet the 97% target. Likewise, repairs resulting from preventive maintenance inspections took twice as long to complete; however escalator availability was slightly better than target at 93.5%, consistent with the previous year.
While rail customer injuries declined, bus injuries increased due to more non-preventable collisions, resulting in the overall customer injury rate increasing slightly to 2.1, worse than target of 1.75. Employee injuries were worse than target of 4.5 per 200,000 hours worked also in part due to an increase in non-preventable collisions, stress injuries, and injuries caused by inattentiveness resulting in an annual rate of 5.4. A 9% decrease in total ridership resulted in a slight increase in the total crime rate, despite 5% fewer Part I crimes committed in 2016 compared to 2015.
SignsVital
QU
ALIT
Y S
ER
VIC
E
Page 20 of 54
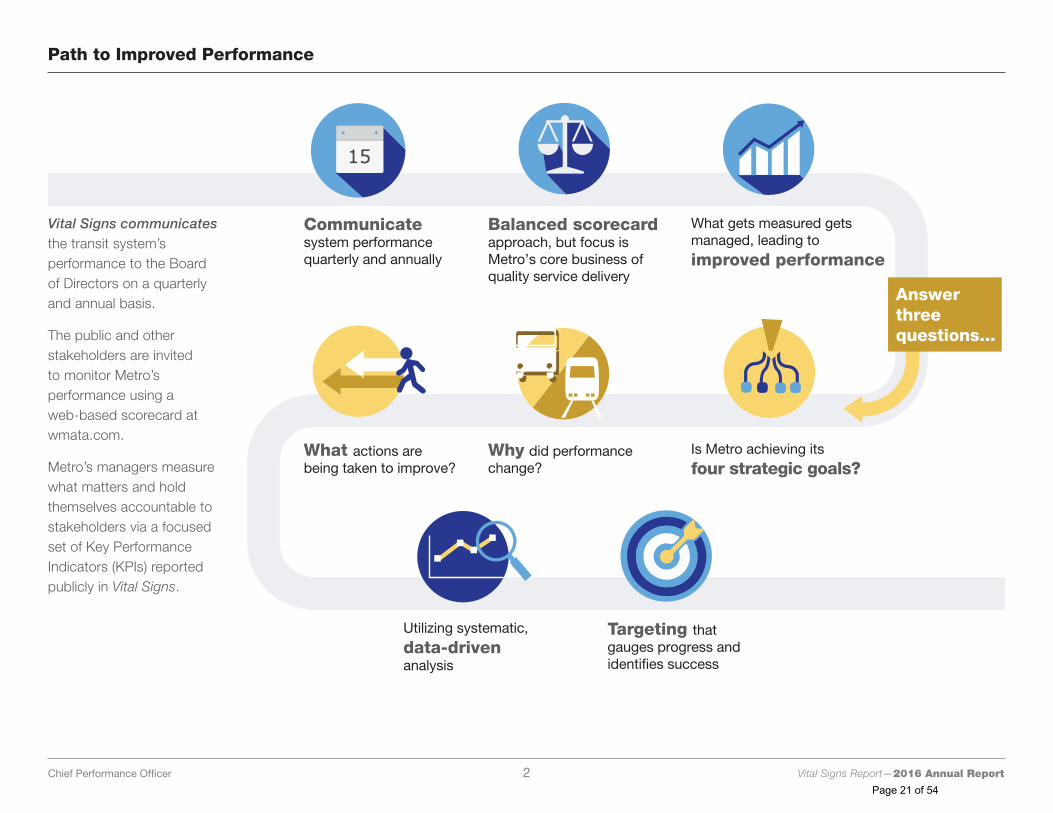
Path to Improved Performance
Utilizing systematic, data-driven analysis
Targeting that gauges progress and identifies success
Why did performance change?
Balanced scorecard approach, but focus is Metro’s core business of quality service delivery
What gets measured gets managed, leading toimproved performance
Communicatesystem performancequarterly and annually
Is Metro achieving itsfour strategic goals?
What actions are being taken to improve?
Answerthreequestions...
Vital Signs communicates the transit system’s performance to the Board of Directors on a quarterly and annual basis.
The public and other stakeholders are invited to monitor Metro’s performance using a web-based scorecard at wmata.com.
Metro’s managers measure what matters and hold themselves accountable to stakeholders via a focused set of Key Performance Indicators (KPIs) reported publicly in Vital Signs.
Chief Performance Officer 2 Vital Signs Report—2016 Annual Report
Page 21 of 54
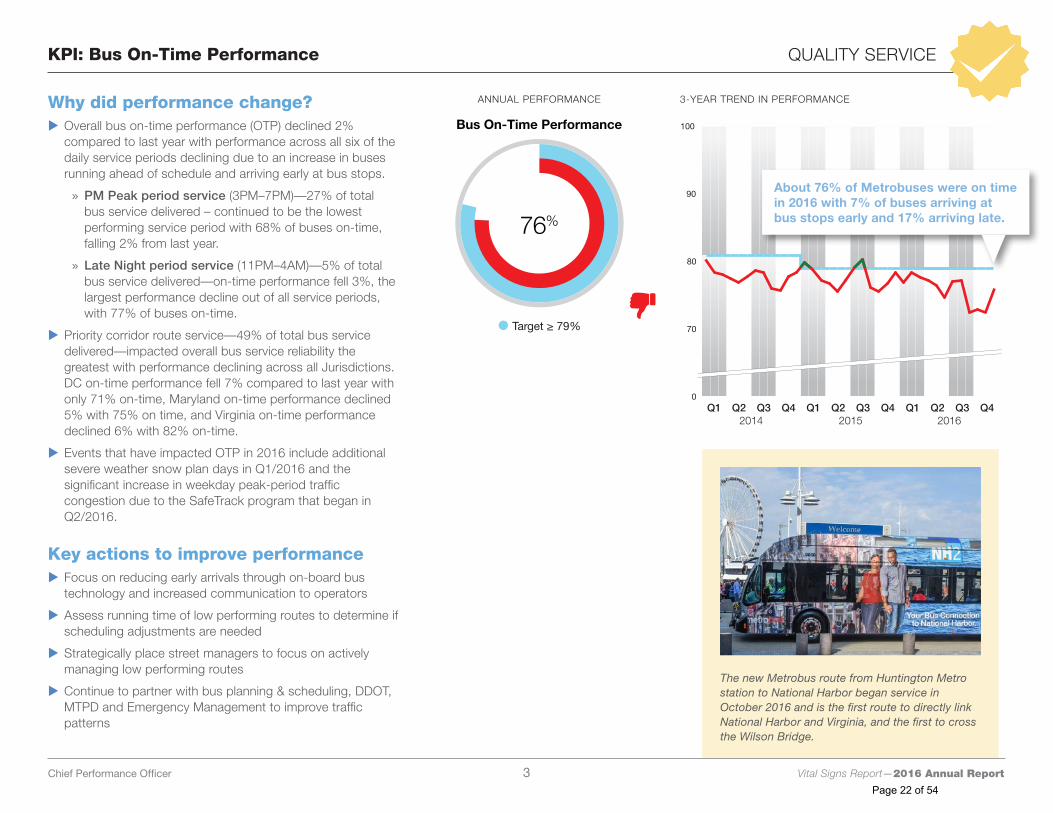
KPI: Bus On-Time Performance QUALITY SERVICE
76%
Bus On-Time Performance
Target ≥ 79%
ANNUAL PERFORMANCE
60
70
80
90
100
DNOQ4SAJQ3JMAQ2MFJ16Q1DNOQ4SAJQ3JMAQ2MFJ15Q1DNOQ4SAJQ3JMAQ2MFJ14Q1
BUS OTP 2014–2016 (complete year)
Q1 Q2 Q3 Q42014
Q1 Q2 Q3 Q42015
Q1 Q2 Q3 Q42016
0
3-YEAR TREND IN PERFORMANCEWhy did performance change? X Overall bus on-time performance (OTP) declined 2% compared to last year with performance across all six of the daily service periods declining due to an increase in buses running ahead of schedule and arriving early at bus stops.
»» PM Peak period service (3PM–7PM)—27% of total bus service delivered – continued to be the lowest performing service period with 68% of buses on-time, falling 2% from last year.
»» Late Night period service (11PM–4AM)—5% of total bus service delivered—on-time performance fell 3%, the largest performance decline out of all service periods, with 77% of buses on-time.
X Priority corridor route service—49% of total bus service delivered—impacted overall bus service reliability the greatest with performance declining across all Jurisdictions. DC on-time performance fell 7% compared to last year with only 71% on-time, Maryland on-time performance declined 5% with 75% on time, and Virginia on-time performance declined 6% with 82% on-time.
X Events that have impacted OTP in 2016 include additional severe weather snow plan days in Q1/2016 and the significant increase in weekday peak-period traffic congestion due to the SafeTrack program that began in Q2/2016.
Key actions to improve performance X Focus on reducing early arrivals through on-board bus technology and increased communication to operators
X Assess running time of low performing routes to determine if scheduling adjustments are needed
X Strategically place street managers to focus on actively managing low performing routes
X Continue to partner with bus planning & scheduling, DDOT, MTPD and Emergency Management to improve traffic patterns
The new Metrobus route from Huntington Metro station to National Harbor began service in October 2016 and is the first route to directly link National Harbor and Virginia, and the first to cross the Wilson Bridge.
About 76% of Metrobuses were on time in 2016 with 7% of buses arriving at bus stops early and 17% arriving late.
Chief Performance Officer 3 Vital Signs Report—2016 Annual Report
Page 22 of 54
4000
6000
8000
10000
DNOQ4SAJQ3JMAQ2MFJ16Q1DNOQ4SAJQ3JMAQ2MFJ15Q1DNOQ4SAJQ3JMAQ2MFJ14Q1
BUS Reliability 2014–2016 (complete year)BUS Reliability 2014–2016 (complete year)
Q1 Q2 Q3 Q42014
Q1 Q2 Q3 Q42015
Q1 Q2 Q3 Q42016
10,000
8,000
6,000
0
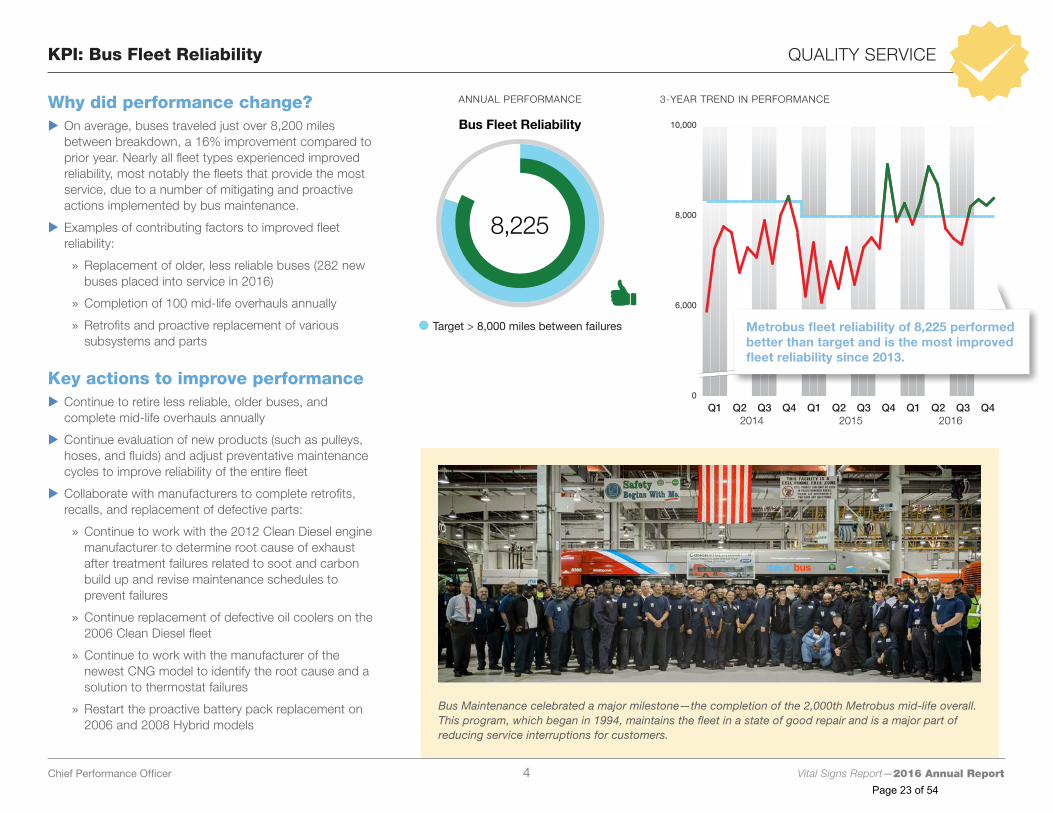
KPI: Bus Fleet Reliability QUALITY SERVICE
8,225
Bus Fleet Reliability
Target > 8,000 miles between failures
3-YEAR TREND IN PERFORMANCEANNUAL PERFORMANCEWhy did performance change? X On average, buses traveled just over 8,200 miles between breakdown, a 16% improvement compared to prior year. Nearly all fleet types experienced improved reliability, most notably the fleets that provide the most service, due to a number of mitigating and proactive actions implemented by bus maintenance.
X Examples of contributing factors to improved fleet reliability:
»» Replacement of older, less reliable buses (282 new buses placed into service in 2016)
»» Completion of 100 mid-life overhauls annually
»» Retrofits and proactive replacement of various subsystems and parts
Key actions to improve performance X Continue to retire less reliable, older buses, and complete mid-life overhauls annually
X Continue evaluation of new products (such as pulleys, hoses, and fluids) and adjust preventative maintenance cycles to improve reliability of the entire fleet
X Collaborate with manufacturers to complete retrofits, recalls, and replacement of defective parts:
»» Continue to work with the 2012 Clean Diesel engine manufacturer to determine root cause of exhaust after treatment failures related to soot and carbon build up and revise maintenance schedules to prevent failures
»» Continue replacement of defective oil coolers on the 2006 Clean Diesel fleet
»» Continue to work with the manufacturer of the newest CNG model to identify the root cause and a solution to thermostat failures
»» Restart the proactive battery pack replacement on 2006 and 2008 Hybrid models
Metrobus fleet reliability of 8,225 performed better than target and is the most improved fleet reliability since 2013.
Bus Maintenance celebrated a major milestone—the completion of the 2,000th Metrobus mid-life overall. This program, which began in 1994, maintains the fleet in a state of good repair and is a major part of reducing service interruptions for customers.
Chief Performance Officer 4 Vital Signs Report—2016 Annual Report
Page 23 of 54
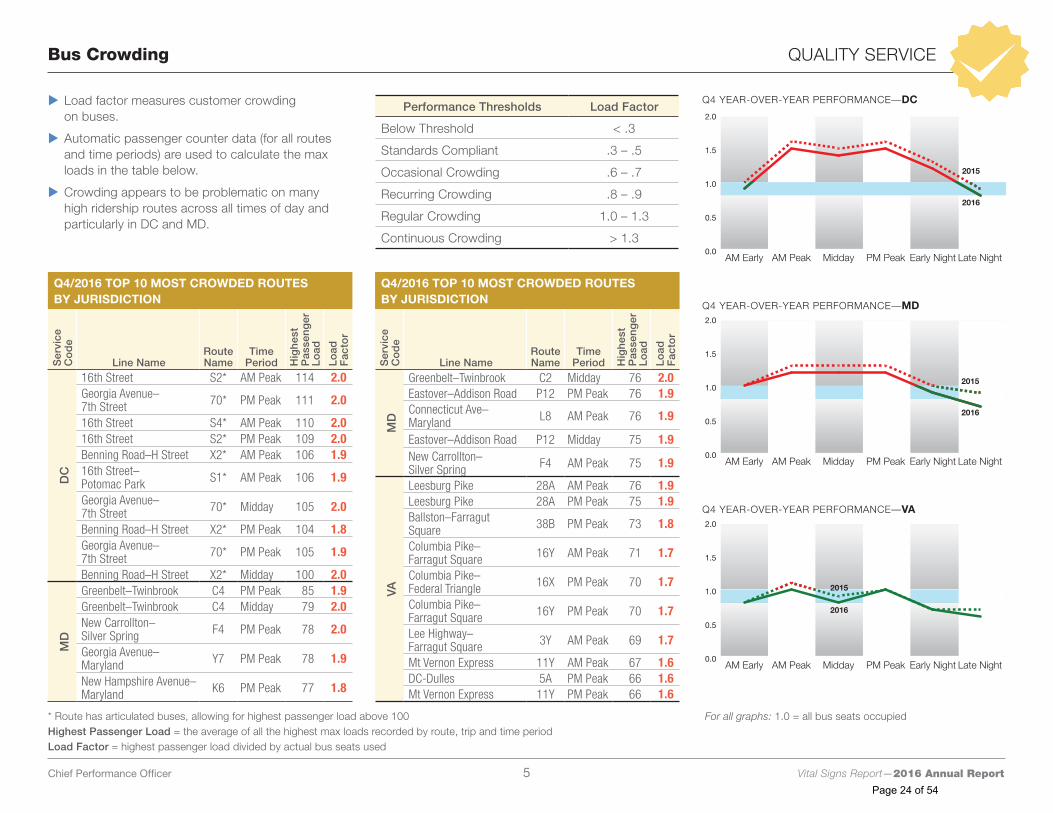
Bus Crowding QUALITY SERVICE
X Load factor measures customer crowding on buses.
X Automatic passenger counter data (for all routes and time periods) are used to calculate the max loads in the table below.
X Crowding appears to be problematic on many high ridership routes across all times of day and particularly in DC and MD.
Performance Thresholds Load Factor
Below Threshold < .3
Standards Compliant .3 – .5
Occasional Crowding .6 – .7
Recurring Crowding .8 – .9
Regular Crowding 1.0 – 1.3
Continuous Crowding > 1.3
Bus Crowding—DC TALLER
0.0
0.5
1.0
1.5
2.0
Late NightEarly NightPM PeakMiddayAM PeakAM Early
Bus Crowding—DC TALLER
2015
2016
Q4 YEAR-OVER-YEAR PERFORMANCE—DC
0.0
0.5
1.0
1.5
2.0
Late NightEarly NightPM PeakMiddayAM PeakAM Early
2016
2015
Q4 YEAR-OVER-YEAR PERFORMANCE—MD
0.0
0.5
1.0
1.5
2.0
Late NightEarly NightPM PeakMiddayAM PeakAM Early
2016
2015
Q4 YEAR-OVER-YEAR PERFORMANCE—VA
For all graphs: 1.0 = all bus seats occupied* Route has articulated buses, allowing for highest passenger load above 100Highest Passenger Load = the average of all the highest max loads recorded by route, trip and time periodLoad Factor = highest passenger load divided by actual bus seats used
Q4/2016 TOP 10 MOST CROWDED ROUTES BY JURISDICTION
Ser
vice
C
od
e
Line NameRoute Name
Time Period H
ighe
st
Pas
seng
er
Load
Load
F
acto
r
DC
16th Street S2* AM Peak 114 2.0Georgia Avenue–7th Street 70* PM Peak 111 2.0
16th Street S4* AM Peak 110 2.016th Street S2* PM Peak 109 2.0Benning Road–H Street X2* AM Peak 106 1.916th Street–Potomac Park S1* AM Peak 106 1.9
Georgia Avenue–7th Street 70* Midday 105 2.0
Benning Road–H Street X2* PM Peak 104 1.8Georgia Avenue–7th Street 70* PM Peak 105 1.9
Benning Road–H Street X2* Midday 100 2.0
MD
Greenbelt–Twinbrook C4 PM Peak 85 1.9Greenbelt–Twinbrook C4 Midday 79 2.0New Carrollton–Silver Spring F4 PM Peak 78 2.0
Georgia Avenue–Maryland Y7 PM Peak 78 1.9
New Hampshire Avenue–Maryland K6 PM Peak 77 1.8
Q4/2016 TOP 10 MOST CROWDED ROUTES BY JURISDICTION
Ser
vice
C
od
e
Line NameRoute Name
Time Period H
ighe
st
Pas
seng
er
Load
Load
F
acto
r
MD
Greenbelt–Twinbrook C2 Midday 76 2.0Eastover–Addison Road P12 PM Peak 76 1.9Connecticut Ave–Maryland L8 AM Peak 76 1.9
Eastover–Addison Road P12 Midday 75 1.9New Carrollton–Silver Spring F4 AM Peak 75 1.9
VA
Leesburg Pike 28A AM Peak 76 1.9Leesburg Pike 28A PM Peak 75 1.9Ballston–Farragut Square 38B PM Peak 73 1.8
Columbia Pike–Farragut Square 16Y AM Peak 71 1.7
Columbia Pike–Federal Triangle 16X PM Peak 70 1.7
Columbia Pike–Farragut Square 16Y PM Peak 70 1.7
Lee Highway–Farragut Square 3Y AM Peak 69 1.7
Mt Vernon Express 11Y AM Peak 67 1.6DC-Dulles 5A PM Peak 66 1.6Mt Vernon Express 11Y PM Peak 66 1.6
Chief Performance Officer 5 Vital Signs Report—2016 Annual Report
Page 24 of 54
50
60
70
80
90
100
DNOQ4SAJQ3JMAQ2MFJ16Q1
RAIL OTP 2016 (complete)
Q1 Q2 Q3 Q42016
0
KPI: Rail Customer On-Time Performance (Pilot) QUALITY SERVICE
1-YEAR TREND IN PERFORMANCEANNUAL PERFORMANCE
70%
Rail Customer On-Time Performance
KPI Pilot
SafeTrack greatly accelerated WMATA’s efforts to bring its most deteriorated tracks into a state of good repair. In just six months in 2016, crews replaced over 28,000 crossties, more than 2014 and 2015 combined.
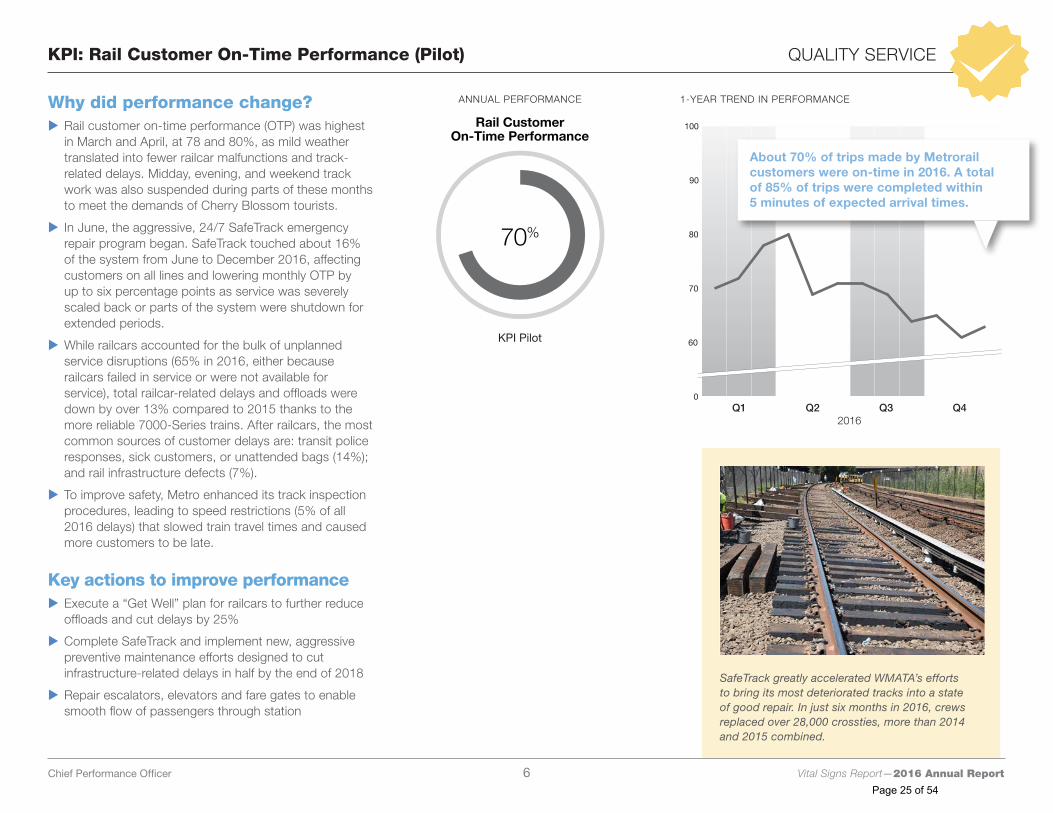
Why did performance change? X Rail customer on-time performance (OTP) was highest in March and April, at 78 and 80%, as mild weather translated into fewer railcar malfunctions and track-related delays. Midday, evening, and weekend track work was also suspended during parts of these months to meet the demands of Cherry Blossom tourists.
X In June, the aggressive, 24/7 SafeTrack emergency repair program began. SafeTrack touched about 16% of the system from June to December 2016, affecting customers on all lines and lowering monthly OTP by up to six percentage points as service was severely scaled back or parts of the system were shutdown for extended periods.
X While railcars accounted for the bulk of unplanned service disruptions (65% in 2016, either because railcars failed in service or were not available for service), total railcar-related delays and offloads were down by over 13% compared to 2015 thanks to the more reliable 7000-Series trains. After railcars, the most common sources of customer delays are: transit police responses, sick customers, or unattended bags (14%); and rail infrastructure defects (7%).
X To improve safety, Metro enhanced its track inspection procedures, leading to speed restrictions (5% of all 2016 delays) that slowed train travel times and caused more customers to be late.
Key actions to improve performance X Execute a “Get Well” plan for railcars to further reduce offloads and cut delays by 25%
X Complete SafeTrack and implement new, aggressive preventive maintenance efforts designed to cut infrastructure-related delays in half by the end of 2018
X Repair escalators, elevators and fare gates to enable smooth flow of passengers through station
About 70% of trips made by Metrorail customers were on-time in 2016. A total of 85% of trips were completed within 5 minutes of expected arrival times.
Chief Performance Officer 6 Vital Signs Report—2016 Annual Report
Page 25 of 54
20000
40000
60000
80000
100000
DNOQ4SAJQ3JMAQ2MFJ16Q1DNOQ4SAJQ3JMAQ2MFJ15Q1DNOQ4SAJQ3JMAQ2MFJ14Q1
RAIL Reliability 2014–2016 (complete year)RAIL Reliability 2014–2016 (complete year)
Q1 Q2 Q3 Q42014
Q1 Q2 Q3 Q42015
Q1 Q2 Q3 Q42016
100,000
80,000
60,000
40,000
0
KPI: Rail Fleet Reliability QUALITY SERVICE
65,029
Rail Fleet Reliability
Target ≥ 65,000 miles between delays
3-YEAR TREND IN PERFORMANCEANNUAL PERFORMANCE
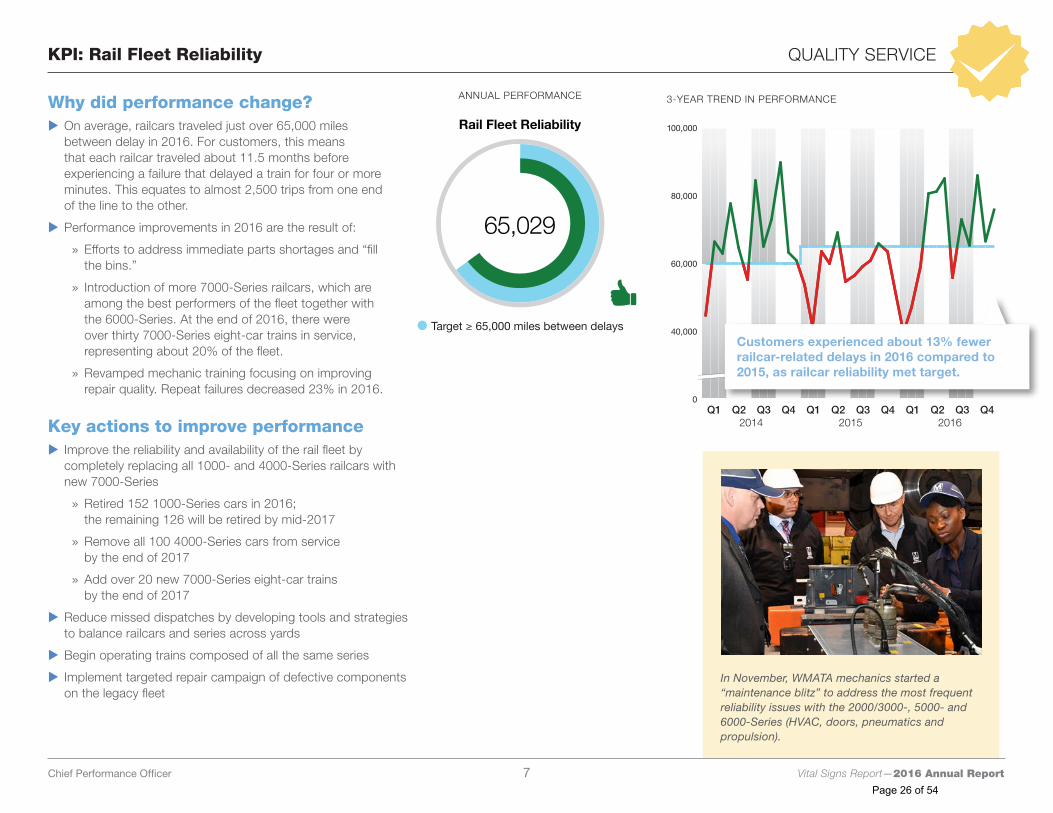
In November, WMATA mechanics started a “maintenance blitz” to address the most frequent reliability issues with the 2000/3000-, 5000- and 6000-Series (HVAC, doors, pneumatics and propulsion).
Why did performance change? X On average, railcars traveled just over 65,000 miles between delay in 2016. For customers, this means that each railcar traveled about 11.5 months before experiencing a failure that delayed a train for four or more minutes. This equates to almost 2,500 trips from one end of the line to the other.
X Performance improvements in 2016 are the result of:
»» Efforts to address immediate parts shortages and “fill the bins.”
»» Introduction of more 7000-Series railcars, which are among the best performers of the fleet together with the 6000-Series. At the end of 2016, there were over thirty 7000-Series eight-car trains in service, representing about 20% of the fleet.
»» Revamped mechanic training focusing on improving repair quality. Repeat failures decreased 23% in 2016.
Key actions to improve performance X Improve the reliability and availability of the rail fleet by completely replacing all 1000- and 4000-Series railcars with new 7000-Series
»» Retired 152 1000-Series cars in 2016; the remaining 126 will be retired by mid-2017
»» Remove all 100 4000-Series cars from service by the end of 2017
»» Add over 20 new 7000-Series eight-car trains by the end of 2017
X Reduce missed dispatches by developing tools and strategies to balance railcars and series across yards
X Begin operating trains composed of all the same series
X Implement targeted repair campaign of defective components on the legacy fleet
Customers experienced about 13% fewer railcar-related delays in 2016 compared to 2015, as railcar reliability met target.
Chief Performance Officer 7 Vital Signs Report—2016 Annual Report
Page 26 of 54
Rail Crowding QUALITY SERVICE
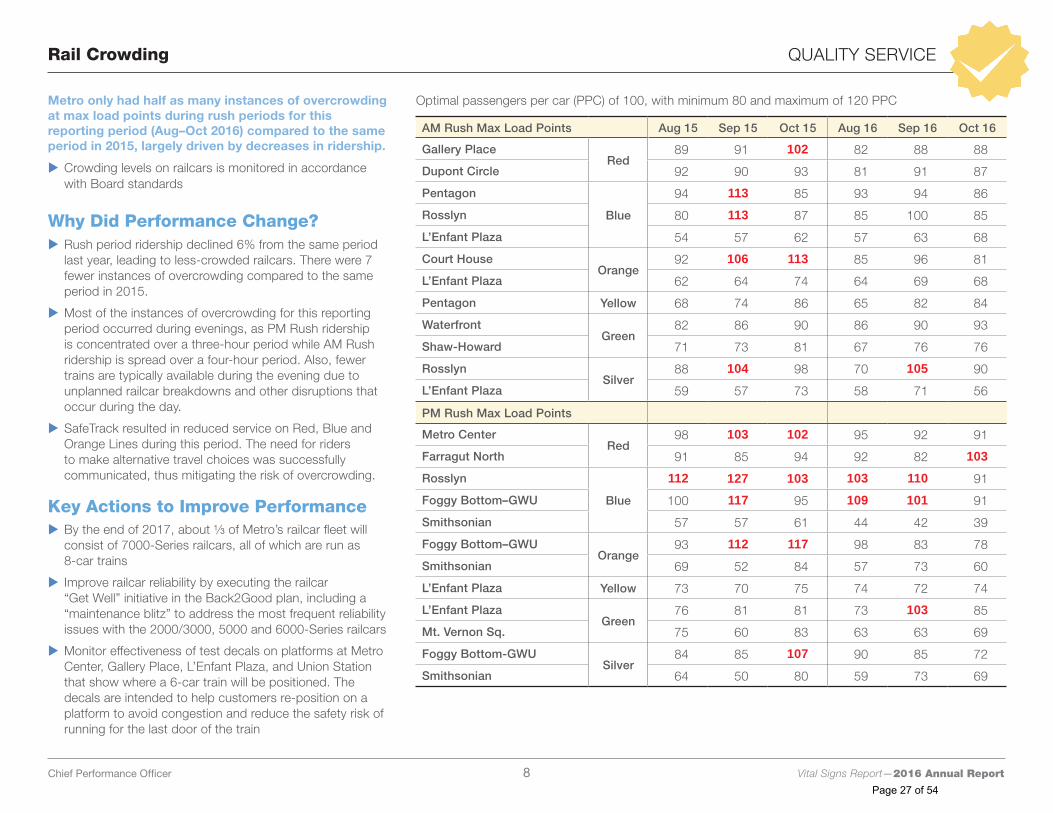
Metro only had half as many instances of overcrowding at max load points during rush periods for this reporting period (Aug–Oct 2016) compared to the same period in 2015, largely driven by decreases in ridership.
X Crowding levels on railcars is monitored in accordance with Board standards
Why Did Performance Change? X Rush period ridership declined 6% from the same period last year, leading to less-crowded railcars. There were 7 fewer instances of overcrowding compared to the same period in 2015.
X Most of the instances of overcrowding for this reporting period occurred during evenings, as PM Rush ridership is concentrated over a three-hour period while AM Rush ridership is spread over a four-hour period. Also, fewer trains are typically available during the evening due to unplanned railcar breakdowns and other disruptions that occur during the day.
X SafeTrack resulted in reduced service on Red, Blue and Orange Lines during this period. The need for riders to make alternative travel choices was successfully communicated, thus mitigating the risk of overcrowding.
Key Actions to Improve Performance X By the end of 2017, about ¹⁄3 of Metro’s railcar fleet will consist of 7000-Series railcars, all of which are run as 8-car trains
X Improve railcar reliability by executing the railcar “Get Well” initiative in the Back2Good plan, including a “maintenance blitz” to address the most frequent reliability issues with the 2000/3000, 5000 and 6000-Series railcars
X Monitor effectiveness of test decals on platforms at Metro Center, Gallery Place, L’Enfant Plaza, and Union Station that show where a 6-car train will be positioned. The decals are intended to help customers re-position on a platform to avoid congestion and reduce the safety risk of running for the last door of the train
Optimal passengers per car (PPC) of 100, with minimum 80 and maximum of 120 PPC
AM Rush Max Load Points Aug 15 Sep 15 Oct 15 Aug 16 Sep 16 Oct 16
Gallery PlaceRed
89 91 102 82 88 88
Dupont Circle 92 90 93 81 91 87
Pentagon
Blue
94 113 85 93 94 86
Rosslyn 80 113 87 85 100 85
L’Enfant Plaza 54 57 62 57 63 68
Court HouseOrange
92 106 113 85 96 81
L’Enfant Plaza 62 64 74 64 69 68
Pentagon Yellow 68 74 86 65 82 84
WaterfrontGreen
82 86 90 86 90 93
Shaw-Howard 71 73 81 67 76 76
RosslynSilver
88 104 98 70 105 90
L’Enfant Plaza 59 57 73 58 71 56
PM Rush Max Load Points
Metro CenterRed
98 103 102 95 92 91
Farragut North 91 85 94 92 82 103Rosslyn
Blue
112 127 103 103 110 91
Foggy Bottom–GWU 100 117 95 109 101 91
Smithsonian 57 57 61 44 42 39
Foggy Bottom–GWUOrange
93 112 117 98 83 78
Smithsonian 69 52 84 57 73 60
L’Enfant Plaza Yellow 73 70 75 74 72 74
L’Enfant PlazaGreen
76 81 81 73 103 85
Mt. Vernon Sq. 75 60 83 63 63 69
Foggy Bottom-GWUSilver
84 85 107 90 85 72
Smithsonian 64 50 80 59 73 69
Chief Performance Officer 8 Vital Signs Report—2016 Annual Report
Page 27 of 54
KPI: Elevator and Escalator Availability QUALITY SERVICE
93%
Escalator Availability
Target ≥ 93%
97%
Elevator Availability
Target ≥ 97%
3-YEAR TREND IN PERFORMANCE—ELEVATOR
3-YEAR TREND IN PERFORMANCE—ESCALATOR
ANNUAL PERFORMANCE
ANNUAL PERFORMANCE
80
90
100
DNOQ4SAJQ3JMAQ2MFJ16Q1DNOQ4SAJQ3JMAQ2MFJ15Q1DNOQ4SAJQ3JMAQ2MFJ14Q1
ELEVATOR 2014–2016 (complete)ELEVATOR 2014–2016 (complete)
Q1 Q2 Q3 Q42014
Q1 Q2 Q3 Q42015
Q1 Q2 Q3 Q42016
0
80
90
100
DNOQ4SAJQ3JMAQ2MFJ16Q1DNOQ4SAJQ3JMAQ2MFJ15Q1DNOQ4SAJQ3JMAQ2MFJ14Q1
ESCALATOR 2014–2016 (complete)
Q1 Q2 Q3 Q42014
Q1 Q2 Q3 Q42015
Q1 Q2 Q3 Q42016
0
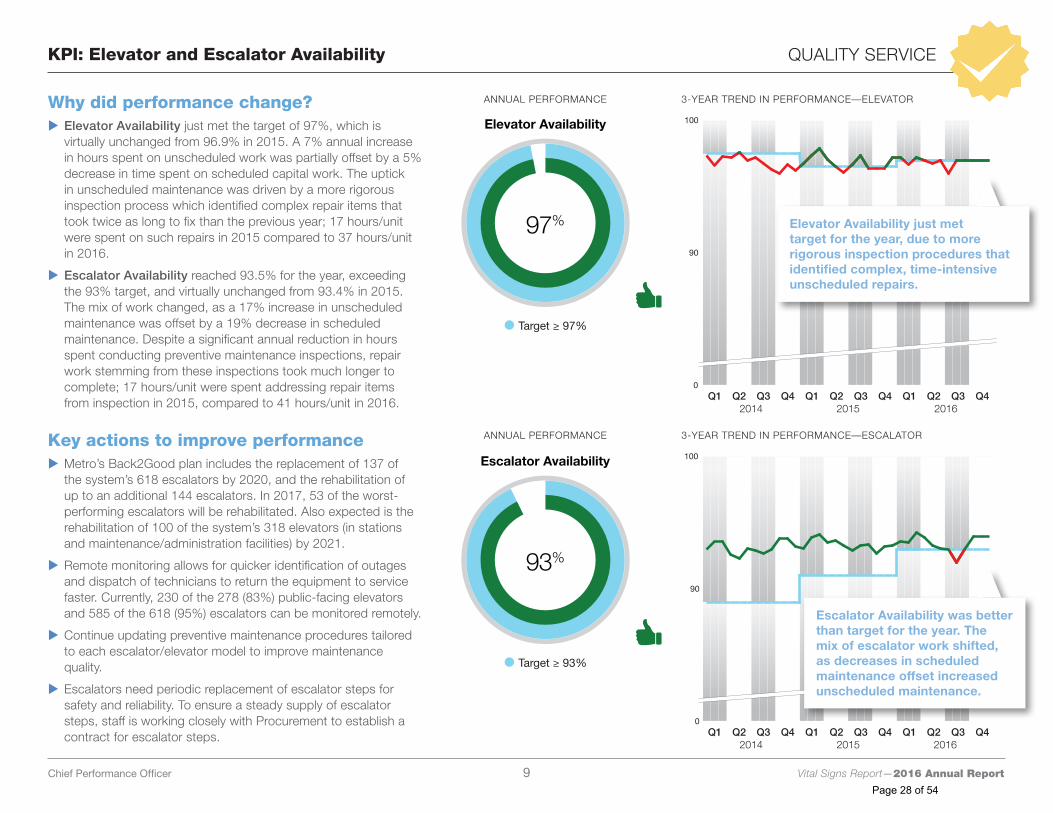
Why did performance change? X Elevator Availability just met the target of 97%, which is virtually unchanged from 96.9% in 2015. A 7% annual increase in hours spent on unscheduled work was partially offset by a 5% decrease in time spent on scheduled capital work. The uptick in unscheduled maintenance was driven by a more rigorous inspection process which identified complex repair items that took twice as long to fix than the previous year; 17 hours/unit were spent on such repairs in 2015 compared to 37 hours/unit in 2016.
X Escalator Availability reached 93.5% for the year, exceeding the 93% target, and virtually unchanged from 93.4% in 2015. The mix of work changed, as a 17% increase in unscheduled maintenance was offset by a 19% decrease in scheduled maintenance. Despite a significant annual reduction in hours spent conducting preventive maintenance inspections, repair work stemming from these inspections took much longer to complete; 17 hours/unit were spent addressing repair items from inspection in 2015, compared to 41 hours/unit in 2016.
Key actions to improve performance X Metro’s Back2Good plan includes the replacement of 137 of the system’s 618 escalators by 2020, and the rehabilitation of up to an additional 144 escalators. In 2017, 53 of the worst-performing escalators will be rehabilitated. Also expected is the rehabilitation of 100 of the system’s 318 elevators (in stations and maintenance/administration facilities) by 2021.
X Remote monitoring allows for quicker identification of outages and dispatch of technicians to return the equipment to service faster. Currently, 230 of the 278 (83%) public-facing elevators and 585 of the 618 (95%) escalators can be monitored remotely.
X Continue updating preventive maintenance procedures tailored to each escalator/elevator model to improve maintenance quality.
X Escalators need periodic replacement of escalator steps for safety and reliability. To ensure a steady supply of escalator steps, staff is working closely with Procurement to establish a contract for escalator steps.
Elevator Availability just met target for the year, due to more rigorous inspection procedures that identified complex, time-intensive unscheduled repairs.
Escalator Availability was better than target for the year. The mix of escalator work shifted, as decreases in scheduled maintenance offset increased unscheduled maintenance.
Chief Performance Officer 9 Vital Signs Report—2016 Annual Report
Page 28 of 54
KPI: Customer Satisfaction QUALITY SERVICE
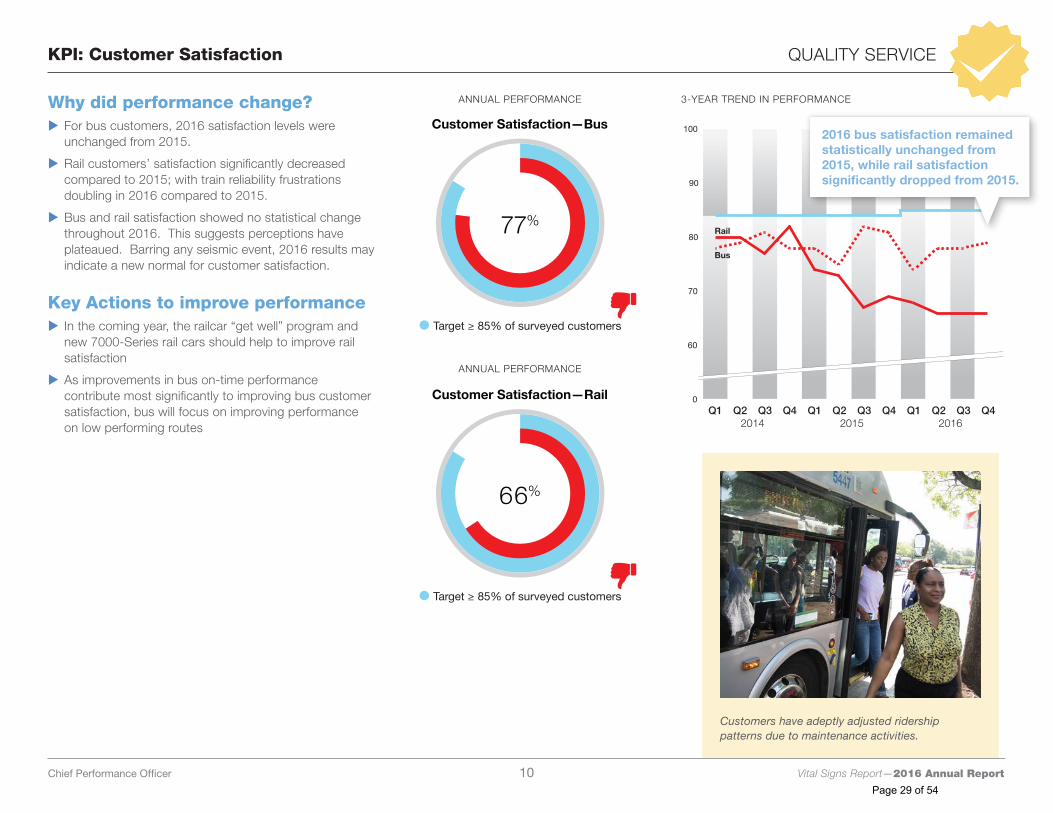
Why did performance change? X For bus customers, 2016 satisfaction levels were unchanged from 2015.
X Rail customers’ satisfaction significantly decreased compared to 2015; with train reliability frustrations doubling in 2016 compared to 2015.
X Bus and rail satisfaction showed no statistical change throughout 2016. This suggests perceptions have plateaued. Barring any seismic event, 2016 results may indicate a new normal for customer satisfaction.
Key Actions to improve performance X In the coming year, the railcar “get well” program and new 7000-Series rail cars should help to improve rail satisfaction
X As improvements in bus on-time performance contribute most significantly to improving bus customer satisfaction, bus will focus on improving performance on low performing routes
3-YEAR TREND IN PERFORMANCE
77%
Customer Satisfaction—Bus
Target ≥ 85% of surveyed customers
ANNUAL PERFORMANCE
66%
Customer Satisfaction—Rail
Target ≥ 85% of surveyed customers
ANNUAL PERFORMANCE
50
60
70
80
90
100
Q4/2016Q3/2016Q2/2016Q1/2016Q4/2015Q3/2015Q2/2015Q1/2015Q4/2014Q3/2014Q2/2014Q1/2014
Customer Satisfaction 2014–2016 (complete)
Q1 Q2 Q3 Q42014
Q1 Q2 Q3 Q42015
Q1 Q2 Q3 Q42016
Rail
Bus
0
Customers have adeptly adjusted ridership patterns due to maintenance activities.
2016 bus satisfaction remained statistically unchanged from 2015, while rail satisfaction significantly dropped from 2015.
Chief Performance Officer 10 Vital Signs Report—2016 Annual Report
Page 29 of 54
KPI: Customer Injury Rate SAFETY AND SECURITY
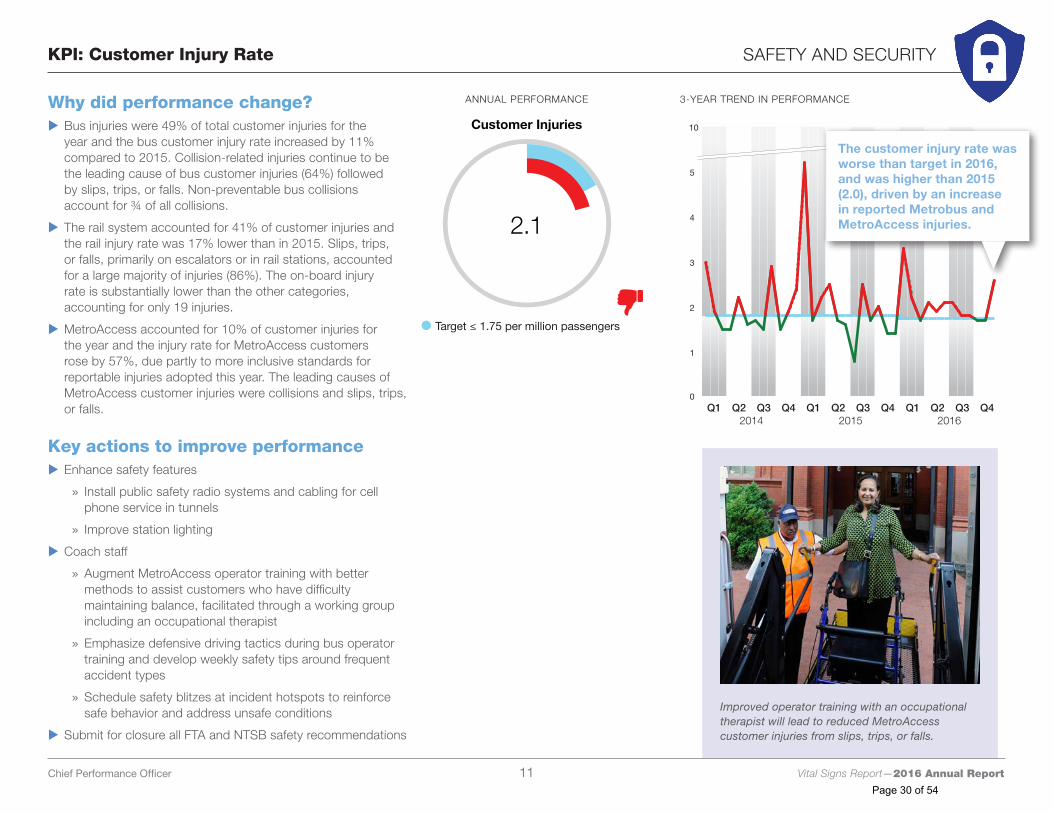
2.1
Customer Injuries
Target ≤ 1.75 per million passengers
0
1
2
3
4
5
6
DNOQ4SAJQ3JMAQ2MFJ16Q1DNOQ4SAJQ3JMAQ2MFJ15Q1DNOQ4SAJQ3JMAQ2MFJ14Q1
Customer Injury 2014–2016 (complete)
Q1 Q2 Q3 Q42014
Q1 Q2 Q3 Q42015
Q1 Q2 Q3 Q42016
10
3-YEAR TREND IN PERFORMANCEANNUAL PERFORMANCE
Improved operator training with an occupational therapist will lead to reduced MetroAccess customer injuries from slips, trips, or falls.
Why did performance change? X Bus injuries were 49% of total customer injuries for the year and the bus customer injury rate increased by 11% compared to 2015. Collision-related injuries continue to be the leading cause of bus customer injuries (64%) followed by slips, trips, or falls. Non-preventable bus collisions account for ¾ of all collisions.
X The rail system accounted for 41% of customer injuries and the rail injury rate was 17% lower than in 2015. Slips, trips, or falls, primarily on escalators or in rail stations, accounted for a large majority of injuries (86%). The on-board injury rate is substantially lower than the other categories, accounting for only 19 injuries.
X MetroAccess accounted for 10% of customer injuries for the year and the injury rate for MetroAccess customers rose by 57%, due partly to more inclusive standards for reportable injuries adopted this year. The leading causes of MetroAccess customer injuries were collisions and slips, trips, or falls.
Key actions to improve performance X Enhance safety features
»» Install public safety radio systems and cabling for cell phone service in tunnels
»» Improve station lighting
X Coach staff
»» Augment MetroAccess operator training with better methods to assist customers who have difficulty maintaining balance, facilitated through a working group including an occupational therapist
»» Emphasize defensive driving tactics during bus operator training and develop weekly safety tips around frequent accident types
»» Schedule safety blitzes at incident hotspots to reinforce safe behavior and address unsafe conditions
X Submit for closure all FTA and NTSB safety recommendations
The customer injury rate was worse than target in 2016, and was higher than 2015 (2.0), driven by an increase in reported Metrobus and MetroAccess injuries.
Chief Performance Officer 11 Vital Signs Report—2016 Annual Report
Page 30 of 54
KPI: Employee Injury Rate SAFETY AND SECURITY
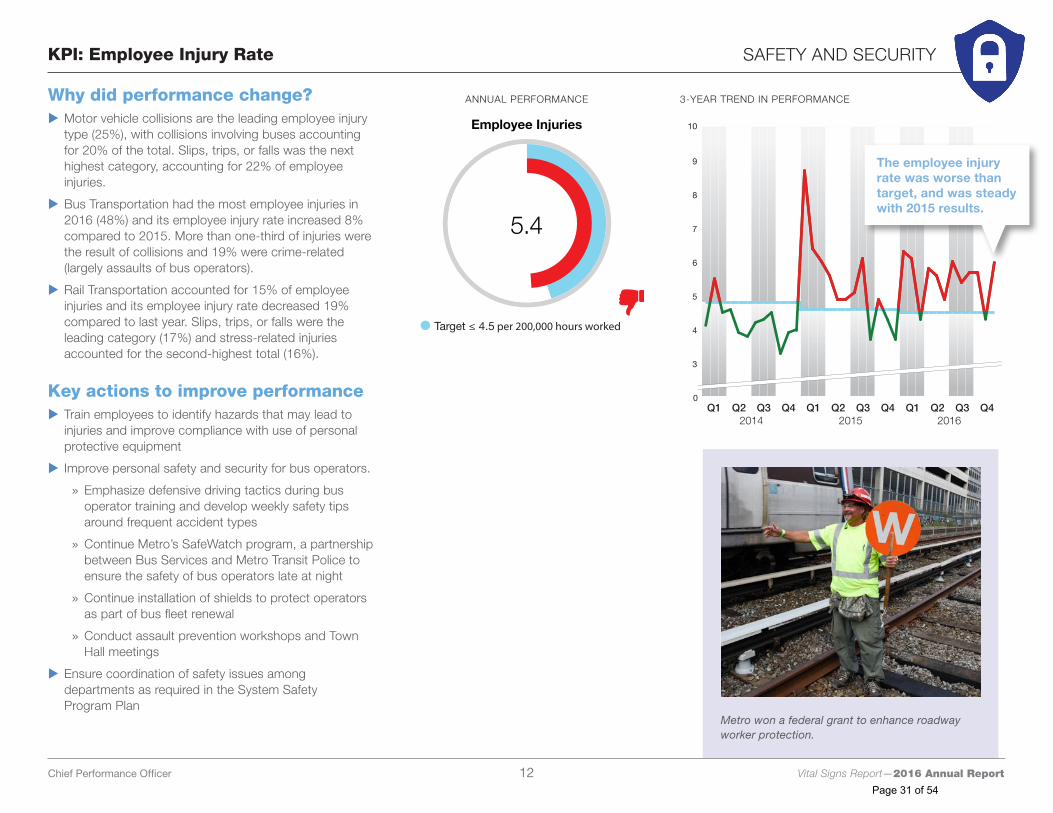
5.4
Employee Injuries
Target ≤ 4.5 per 200,000 hours worked
2
3
4
5
6
7
8
9
10
DNOQ4SAJQ3JMAQ2MFJ16Q1DNOQ4SAJQ3JMAQ2MFJ15Q1DNOQ4SAJQ3JMAQ2MFJ14Q1
Employee Injuries 2014–2016 (complete)Employee Injuries 2014–2016 (complete)
Q1 Q2 Q3 Q42014
Q1 Q2 Q3 Q42015
Q1 Q2 Q3 Q42016
0
3-YEAR TREND IN PERFORMANCEANNUAL PERFORMANCEWhy did performance change? X Motor vehicle collisions are the leading employee injury type (25%), with collisions involving buses accounting for 20% of the total. Slips, trips, or falls was the next highest category, accounting for 22% of employee injuries.
X Bus Transportation had the most employee injuries in 2016 (48%) and its employee injury rate increased 8% compared to 2015. More than one-third of injuries were the result of collisions and 19% were crime-related (largely assaults of bus operators).
X Rail Transportation accounted for 15% of employee injuries and its employee injury rate decreased 19% compared to last year. Slips, trips, or falls were the leading category (17%) and stress-related injuries accounted for the second-highest total (16%).
Key actions to improve performance X Train employees to identify hazards that may lead to injuries and improve compliance with use of personal protective equipment
X Improve personal safety and security for bus operators.
»» Emphasize defensive driving tactics during bus operator training and develop weekly safety tips around frequent accident types
»» Continue Metro’s SafeWatch program, a partnership between Bus Services and Metro Transit Police to ensure the safety of bus operators late at night
»» Continue installation of shields to protect operators as part of bus fleet renewal
»» Conduct assault prevention workshops and Town Hall meetings
X Ensure coordination of safety issues among departments as required in the System Safety Program Plan
Metro won a federal grant to enhance roadway worker protection.
The employee injury rate was worse than target, and was steady with 2015 results.
Chief Performance Officer 12 Vital Signs Report—2016 Annual Report
Page 31 of 54
2
3
4
5
6
7
8
9
10
DNOQ4SAJQ3JMAQ2MFJ16Q1DNOQ4SAJQ3JMAQ2MFJ15Q1
Crime 2014–2016 (complete)Crime 2014–2016 (complete)
Q1 Q2 Q3 Q42015
Q1 Q2 Q3 Q42016
0
KPI: Crime Rate SAFETY AND SECURITY
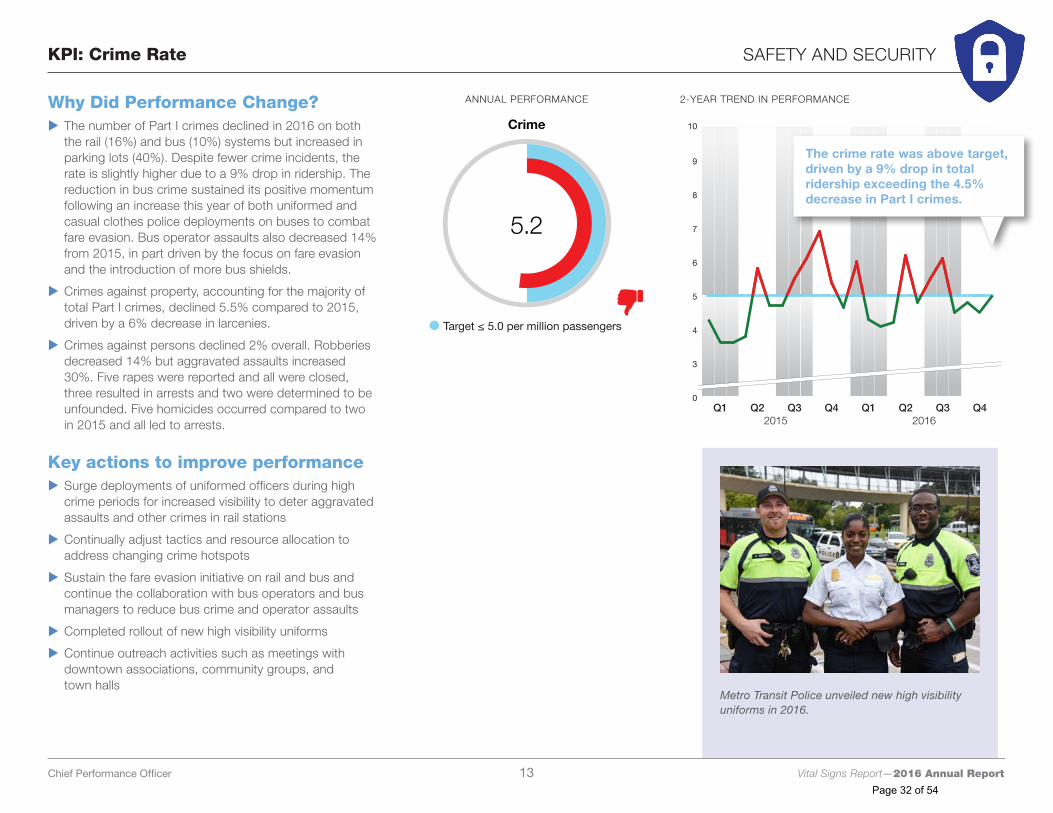
5.2
Crime
Target ≤ 5.0 per million passengers
2-YEAR TREND IN PERFORMANCEANNUAL PERFORMANCE
Metro Transit Police unveiled new high visibility uniforms in 2016.
Why Did Performance Change? X The number of Part I crimes declined in 2016 on both the rail (16%) and bus (10%) systems but increased in parking lots (40%). Despite fewer crime incidents, the rate is slightly higher due to a 9% drop in ridership. The reduction in bus crime sustained its positive momentum following an increase this year of both uniformed and casual clothes police deployments on buses to combat fare evasion. Bus operator assaults also decreased 14% from 2015, in part driven by the focus on fare evasion and the introduction of more bus shields.
X Crimes against property, accounting for the majority of total Part I crimes, declined 5.5% compared to 2015, driven by a 6% decrease in larcenies.
X Crimes against persons declined 2% overall. Robberies decreased 14% but aggravated assaults increased 30%. Five rapes were reported and all were closed, three resulted in arrests and two were determined to be unfounded. Five homicides occurred compared to two in 2015 and all led to arrests.
Key actions to improve performance X Surge deployments of uniformed officers during high crime periods for increased visibility to deter aggravated assaults and other crimes in rail stations
X Continually adjust tactics and resource allocation to address changing crime hotspots
X Sustain the fare evasion initiative on rail and bus and continue the collaboration with bus operators and bus managers to reduce bus crime and operator assaults
X Completed rollout of new high visibility uniforms
X Continue outreach activities such as meetings with downtown associations, community groups, and town halls
The crime rate was above target, driven by a 9% drop in total ridership exceeding the 4.5% decrease in Part I crimes.
Chief Performance Officer 13 Vital Signs Report—2016 Annual Report
Page 32 of 54
Capital Funds Invested PEOPLE AND ASSETS
-5
0
5
10
15
20
25
JUNMAYAPRMARFEBJANDECNOVOCTSEPAUGJUL
Operating Budget Variance FY 2014–2016 (FLIPPED)
Target = 0% to 2% of budgeted expenses
Q1 Q2 Q3 Q4
FFY 2015
FY 2017
FY 2016
5%
0%
5%
10%
15%
20%
25%JUNMAYAPRMARFEBJANDECNOVOCTSEPAUGJUL
Ove
r b
udge
tU
nder
bud
get
0
10
20
30
40
50
60
70
80
90
100
JUNMAYAPRMARFEBJANDECNOVOCTSEPAUGJUL
Capital Funds Investment FY 2014–2016 (complete)
% o
f Fun
ds
Exp
end
ed
Q1 Q2 Q3 Q4
FY 2017
FY 2016
2-YEAR TREND IN PERFORMANCE (FISCAL YEAR)
2-YEAR TREND IN PERFORMANCE (FISCAL YEAR)
Operating Expense Variance
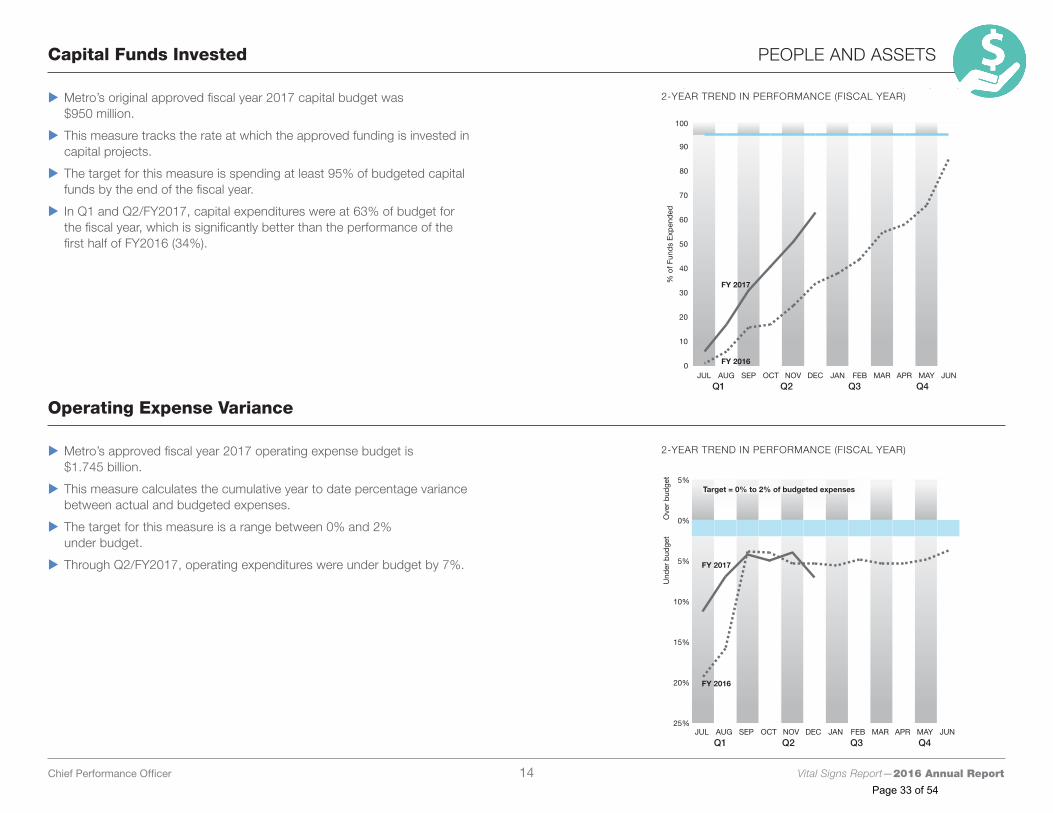
X Metro’s original approved fiscal year 2017 capital budget was $950 million.
X This measure tracks the rate at which the approved funding is invested in capital projects.
X The target for this measure is spending at least 95% of budgeted capital funds by the end of the fiscal year.
X In Q1 and Q2/FY2017, capital expenditures were at 63% of budget for the fiscal year, which is significantly better than the performance of the first half of FY2016 (34%).
X Metro’s approved fiscal year 2017 operating expense budget is $1.745 billion.
X This measure calculates the cumulative year to date percentage variance between actual and budgeted expenses.
X The target for this measure is a range between 0% and 2% under budget.
X Through Q2/FY2017, operating expenditures were under budget by 7%.
Chief Performance Officer 14 Vital Signs Report—2016 Annual Report
Page 33 of 54
86.1
Ridership—Rail
Budget Forecast = 101.1 million passengers
FISCAL YEAR-TO-DATE PERFORMANCE
62.1
Ridership—Bus
Budget Forecast = 67.9 million passengers
1.2
Ridership—MetroAccess
Budget Forecast = 1.2 million passengers
Ridership PEOPLE AND ASSETS
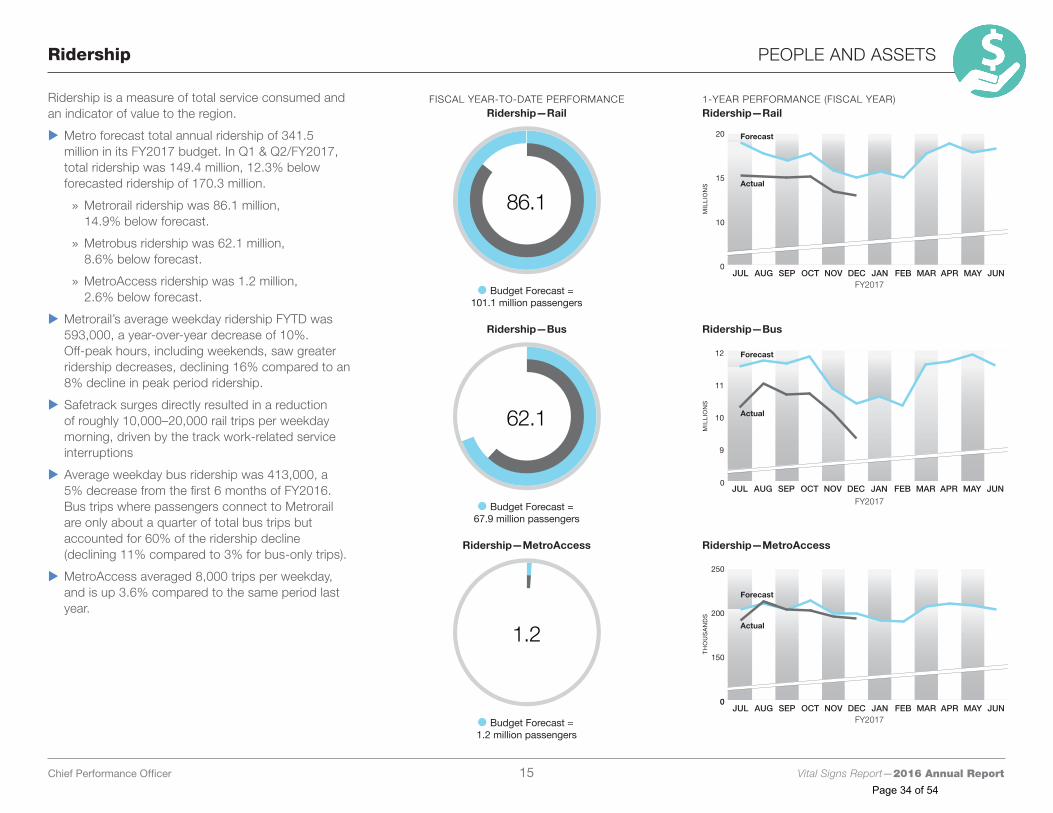
Ridership is a measure of total service consumed and an indicator of value to the region.
X Metro forecast total annual ridership of 341.5 million in its FY2017 budget. In Q1 & Q2/FY2017, total ridership was 149.4 million, 12.3% below forecasted ridership of 170.3 million.
»» Metrorail ridership was 86.1 million, 14.9% below forecast.
»» Metrobus ridership was 62.1 million, 8.6% below forecast.
»» MetroAccess ridership was 1.2 million, 2.6% below forecast.
X Metrorail’s average weekday ridership FYTD was 593,000, a year-over-year decrease of 10%. Off-peak hours, including weekends, saw greater ridership decreases, declining 16% compared to an 8% decline in peak period ridership.
X Safetrack surges directly resulted in a reduction of roughly 10,000–20,000 rail trips per weekday morning, driven by the track work-related service interruptions
X Average weekday bus ridership was 413,000, a 5% decrease from the first 6 months of FY2016. Bus trips where passengers connect to Metrorail are only about a quarter of total bus trips but accounted for 60% of the ridership decline (declining 11% compared to 3% for bus-only trips).
X MetroAccess averaged 8,000 trips per weekday, and is up 3.6% compared to the same period last year.
Ridership—Rail
5
10
15
20
JUNMAYAPRMARFEBJANDECNOVOCTSEPAUGJUL
Forecast
Actual
FY2017
MIL
LIO
NS
0
Ridership—RailRidership—Rail
MIL
LIO
NS
Forecast
Actual
FY2017
8
9
10
11
12
JUNMAYAPRMARFEBJANDECNOVOCTSEPAUGJUL0
Ridership—BusRidership—Bus
100000
150000
200000
250000
JUNMAYAPRMARFEBJANDECNOVOCTSEPAUGJUL
Forecast
Actual
FY2017
0
250
200
150
0T
HO
US
AN
DS
Ridership—MetroAccessRidership—MetroAccess
1-YEAR PERFORMANCE (FISCAL YEAR)
Chief Performance Officer 15 Vital Signs Report—2016 Annual Report
Page 34 of 54
8%
Operations Critical Vacancy Rate
Target ≤ 9%
5%
Overall Vacancy Rate
Target ≤ 6%
ANNUAL PERFORMANCE
ANNUAL PERFORMANCE 3
4
5
6
7
8
9
10
DNOQ4SAJQ3JMAQ2MFJ16Q1DNOQ4SAJQ3JMAQ2MFJ15Q1
Vacancy 2014–2016 (complete)Vacancy 2014–2016 (complete)
Q1 Q2 Q3 Q42015
Q1 Q2 Q3 Q42016
0
WMATA and Upwardly Global hosted an event in which a member of the Talent Acquisition staff gave a presentation outlining WMATA’s efforts to recruit diverse talent into the organization.
Vacancy Rate PEOPLE AND ASSETS
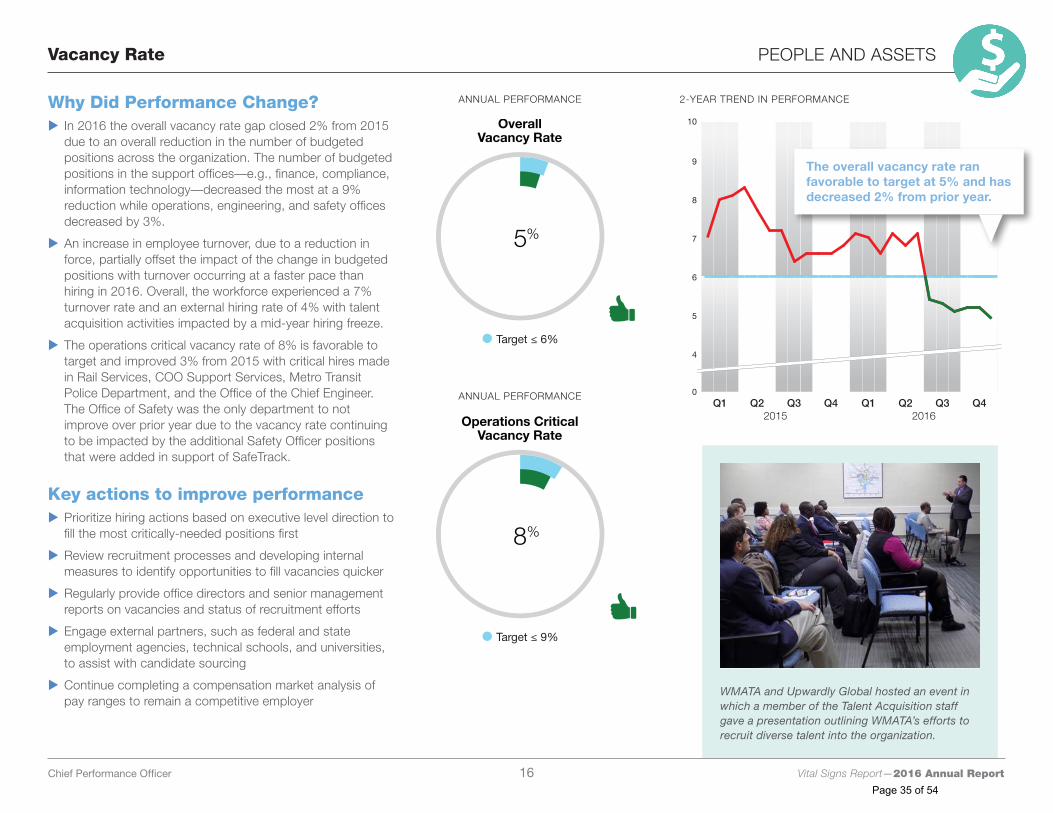
Why Did Performance Change? X In 2016 the overall vacancy rate gap closed 2% from 2015 due to an overall reduction in the number of budgeted positions across the organization. The number of budgeted positions in the support offices—e.g., finance, compliance, information technology—decreased the most at a 9% reduction while operations, engineering, and safety offices decreased by 3%.
X An increase in employee turnover, due to a reduction in force, partially offset the impact of the change in budgeted positions with turnover occurring at a faster pace than hiring in 2016. Overall, the workforce experienced a 7% turnover rate and an external hiring rate of 4% with talent acquisition activities impacted by a mid-year hiring freeze.
X The operations critical vacancy rate of 8% is favorable to target and improved 3% from 2015 with critical hires made in Rail Services, COO Support Services, Metro Transit Police Department, and the Office of the Chief Engineer. The Office of Safety was the only department to not improve over prior year due to the vacancy rate continuing to be impacted by the additional Safety Officer positions that were added in support of SafeTrack.
Key actions to improve performance X Prioritize hiring actions based on executive level direction to fill the most critically-needed positions first
X Review recruitment processes and developing internal measures to identify opportunities to fill vacancies quicker
X Regularly provide office directors and senior management reports on vacancies and status of recruitment efforts
X Engage external partners, such as federal and state employment agencies, technical schools, and universities, to assist with candidate sourcing
X Continue completing a compensation market analysis of pay ranges to remain a competitive employer
2-YEAR TREND IN PERFORMANCE
The overall vacancy rate ran favorable to target at 5% and has decreased 2% from prior year.
Chief Performance Officer 16 Vital Signs Report—2016 Annual Report
Page 35 of 54
0
5
10
15
20
25
30
35
40
16p216p115p215p1OCT–MAR APR–SEPFFY 2015
OCT–MAR APR–SEPFFY 2016
100
Disadvantaged Business Enterprise (DBE) Contracts
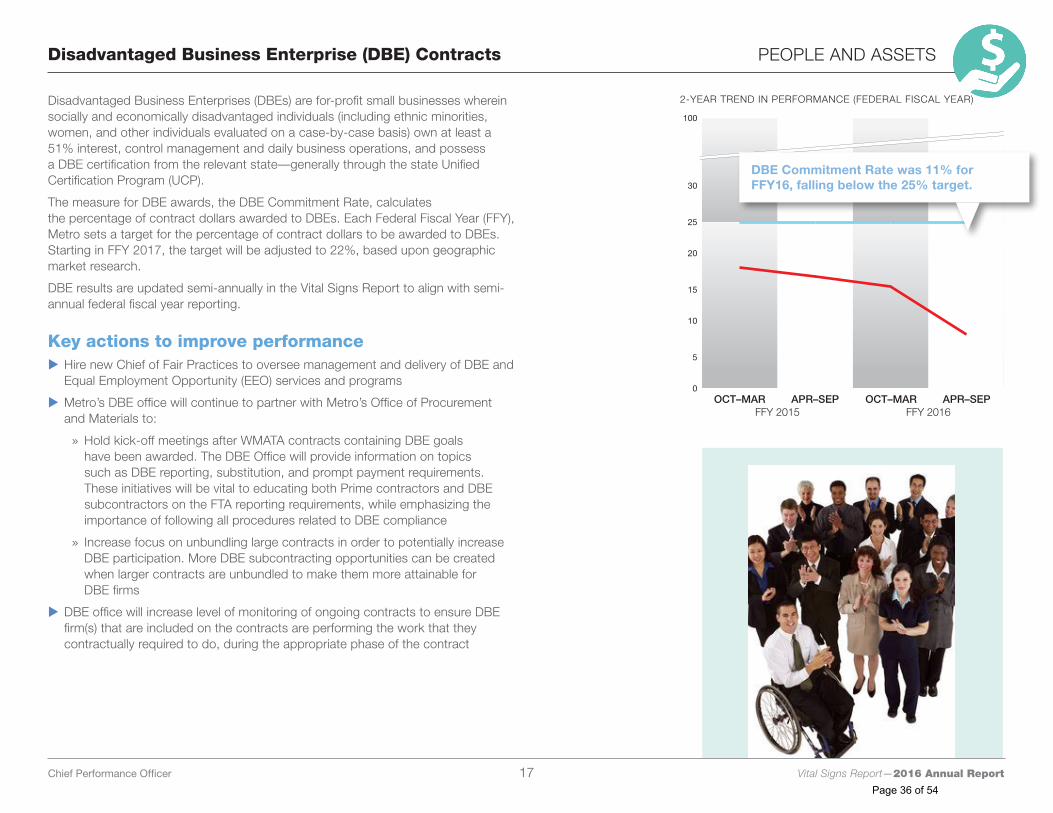
Disadvantaged Business Enterprises (DBEs) are for-profit small businesses wherein socially and economically disadvantaged individuals (including ethnic minorities, women, and other individuals evaluated on a case-by-case basis) own at least a 51% interest, control management and daily business operations, and possess a DBE certification from the relevant state—generally through the state Unified Certification Program (UCP).
The measure for DBE awards, the DBE Commitment Rate, calculates the percentage of contract dollars awarded to DBEs. Each Federal Fiscal Year (FFY), Metro sets a target for the percentage of contract dollars to be awarded to DBEs. Starting in FFY 2017, the target will be adjusted to 22%, based upon geographic market research.
DBE results are updated semi-annually in the Vital Signs Report to align with semi-annual federal fiscal year reporting.
Key actions to improve performance X Hire new Chief of Fair Practices to oversee management and delivery of DBE and Equal Employment Opportunity (EEO) services and programs
X Metro’s DBE office will continue to partner with Metro’s Office of Procurement and Materials to:
»» Hold kick-off meetings after WMATA contracts containing DBE goals have been awarded. The DBE Office will provide information on topics such as DBE reporting, substitution, and prompt payment requirements. These initiatives will be vital to educating both Prime contractors and DBE subcontractors on the FTA reporting requirements, while emphasizing the importance of following all procedures related to DBE compliance
»» Increase focus on unbundling large contracts in order to potentially increase DBE participation. More DBE subcontracting opportunities can be created when larger contracts are unbundled to make them more attainable for DBE firms
X DBE office will increase level of monitoring of ongoing contracts to ensure DBE firm(s) that are included on the contracts are performing the work that they contractually required to do, during the appropriate phase of the contract
PEOPLE AND ASSETS
2-YEAR TREND IN PERFORMANCE (FEDERAL FISCAL YEAR)
DBE Commitment Rate was 11% for FFY16, falling below the 25% target.
Chief Performance Officer 17 Vital Signs Report—2016 Annual Report
Page 36 of 54
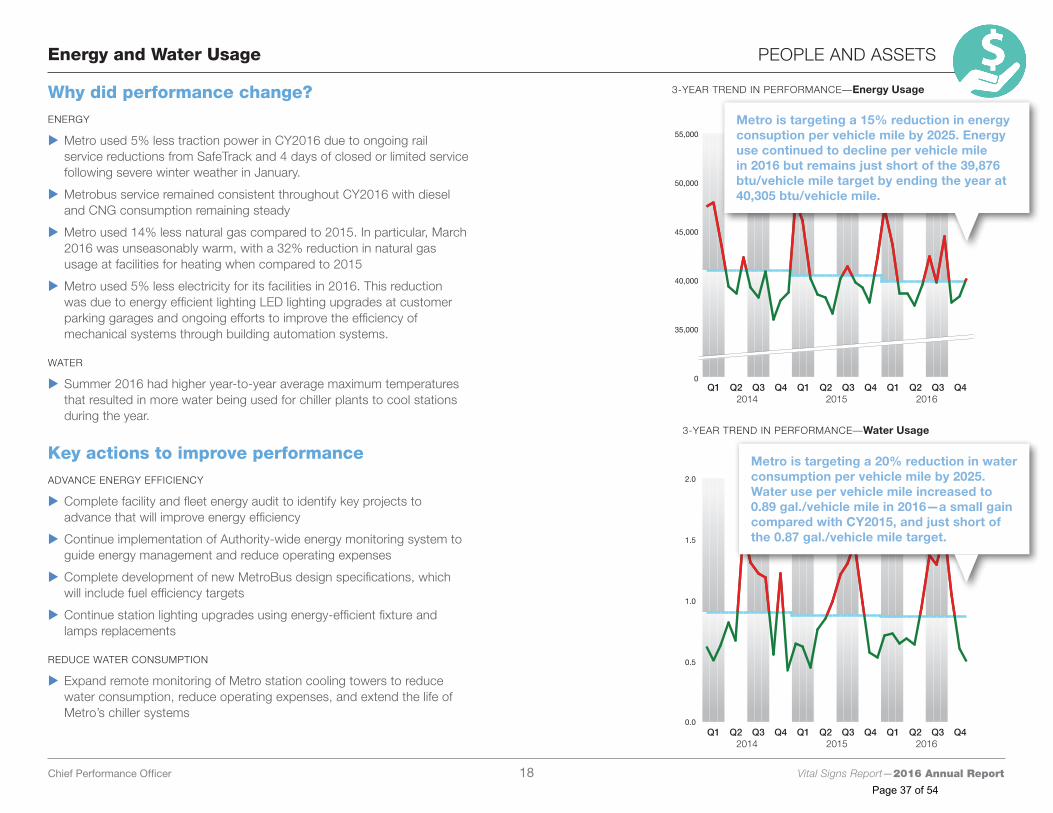
Energy and Water Usage PEOPLE AND ASSETS
Why did performance change?ENERGY
X Metro used 5% less traction power in CY2016 due to ongoing rail service reductions from SafeTrack and 4 days of closed or limited service following severe winter weather in January.
X Metrobus service remained consistent throughout CY2016 with diesel and CNG consumption remaining steady
X Metro used 14% less natural gas compared to 2015. In particular, March 2016 was unseasonably warm, with a 32% reduction in natural gas usage at facilities for heating when compared to 2015
X Metro used 5% less electricity for its facilities in 2016. This reduction was due to energy efficient lighting LED lighting upgrades at customer parking garages and ongoing efforts to improve the efficiency of mechanical systems through building automation systems.
WATER
X Summer 2016 had higher year-to-year average maximum temperatures that resulted in more water being used for chiller plants to cool stations during the year.
Key actions to improve performanceADVANCE ENERGY EFFICIENCY
X Complete facility and fleet energy audit to identify key projects to advance that will improve energy efficiency
X Continue implementation of Authority-wide energy monitoring system to guide energy management and reduce operating expenses
X Complete development of new MetroBus design specifications, which will include fuel efficiency targets
X Continue station lighting upgrades using energy-efficient fixture and lamps replacements
REDUCE WATER CONSUMPTION
X Expand remote monitoring of Metro station cooling towers to reduce water consumption, reduce operating expenses, and extend the life of Metro’s chiller systems
0.0
0.5
1.0
1.5
2.0
DNOQ4SAJQ3JMAQ2MFJ16Q1DNOQ4SAJQ3JMAQ2MFJ15Q1DNOQ4SAJQ3JMAQ2MFJ14Q1
WATER 2014–2016 (complete)
-September: 1.56-Q3: 1.4-YTD: .95
WATER 2014–2016 (complete)
-September: 1.56-Q3: 1.4-YTD: .95
Q1 Q2 Q3 Q42014
Q1 Q2 Q3 Q42015
Q1 Q2 Q3 Q42016
30000
35000
40000
45000
50000
55000
DNOQ4SAJQ3JMAQ2MFJ16Q1DNOQ4SAJQ3JMAQ2MFJ15Q1DNOQ4SAJQ3JMAQ2MFJ14Q1
Energy 2014–2016 (complete)Energy 2014–2016 (complete)
Q1 Q2 Q3 Q42014
Q1 Q2 Q3 Q42015
Q1 Q2 Q3 Q42016
55,000
50,000
45,000
40,000
35,000
0
3-YEAR TREND IN PERFORMANCE—Energy Usage
Metro is targeting a 20% reduction in water consumption per vehicle mile by 2025. Water use per vehicle mile increased to 0.89 gal./vehicle mile in 2016—a small gain compared with CY2015, and just short of the 0.87 gal./vehicle mile target.
Metro is targeting a 15% reduction in energy consuption per vehicle mile by 2025. Energy use continued to decline per vehicle mile in 2016 but remains just short of the 39,876 btu/vehicle mile target by ending the year at 40,305 btu/vehicle mile.
3-YEAR TREND IN PERFORMANCE—Water Usage
Chief Performance Officer 18 Vital Signs Report—2016 Annual Report
Page 37 of 54
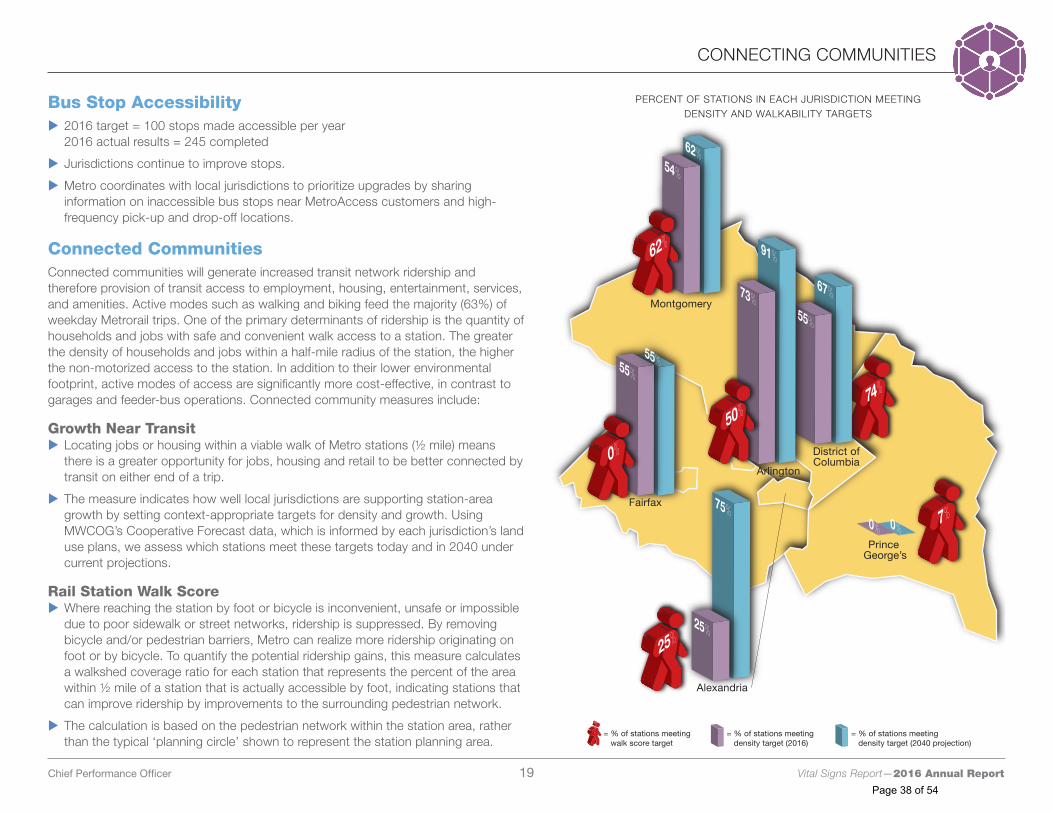
CONNECTING COMMUNITIES
Bus Stop Accessibility X 2016 target = 100 stops made accessible per year 2016 actual results = 245 completed
X Jurisdictions continue to improve stops.
X Metro coordinates with local jurisdictions to prioritize upgrades by sharing information on inaccessible bus stops near MetroAccess customers and high-frequency pick-up and drop-off locations.
Connected CommunitiesConnected communities will generate increased transit network ridership and therefore provision of transit access to employment, housing, entertainment, services, and amenities. Active modes such as walking and biking feed the majority (63%) of weekday Metrorail trips. One of the primary determinants of ridership is the quantity of households and jobs with safe and convenient walk access to a station. The greater the density of households and jobs within a half-mile radius of the station, the higher the non-motorized access to the station. In addition to their lower environmental footprint, active modes of access are significantly more cost-effective, in contrast to garages and feeder-bus operations. Connected community measures include:
Growth Near Transit X Locating jobs or housing within a viable walk of Metro stations (½ mile) means there is a greater opportunity for jobs, housing and retail to be better connected by transit on either end of a trip.
X The measure indicates how well local jurisdictions are supporting station-area growth by setting context-appropriate targets for density and growth. Using MWCOG’s Cooperative Forecast data, which is informed by each jurisdiction’s land use plans, we assess which stations meet these targets today and in 2040 under current projections.
Rail Station Walk Score X Where reaching the station by foot or bicycle is inconvenient, unsafe or impossible due to poor sidewalk or street networks, ridership is suppressed. By removing bicycle and/or pedestrian barriers, Metro can realize more ridership originating on foot or by bicycle. To quantify the potential ridership gains, this measure calculates a walkshed coverage ratio for each station that represents the percent of the area within ½ mile of a station that is actually accessible by foot, indicating stations that can improve ridership by improvements to the surrounding pedestrian network.
X The calculation is based on the pedestrian network within the station area, rather than the typical ‘planning circle’ shown to represent the station planning area.
= % of stations meeting = density target (2040 projection)
= % of stations meeting = density target (2016)
= % of stations meeting = walk score target
74%
62%
54%
62%
55%
55%
0% 0% 7%
0%
50%
55%
67%
25%
75%
73%
91%
25%
Arlington
Prince George’s
Montgomery
Fairfax
District ofColumbia
Alexandria
PERCENT OF STATIONS IN EACH JURISDICTION MEETING DENSITY AND WALKABILITY TARGETS
Chief Performance Officer 19 Vital Signs Report—2016 Annual Report
Page 38 of 54
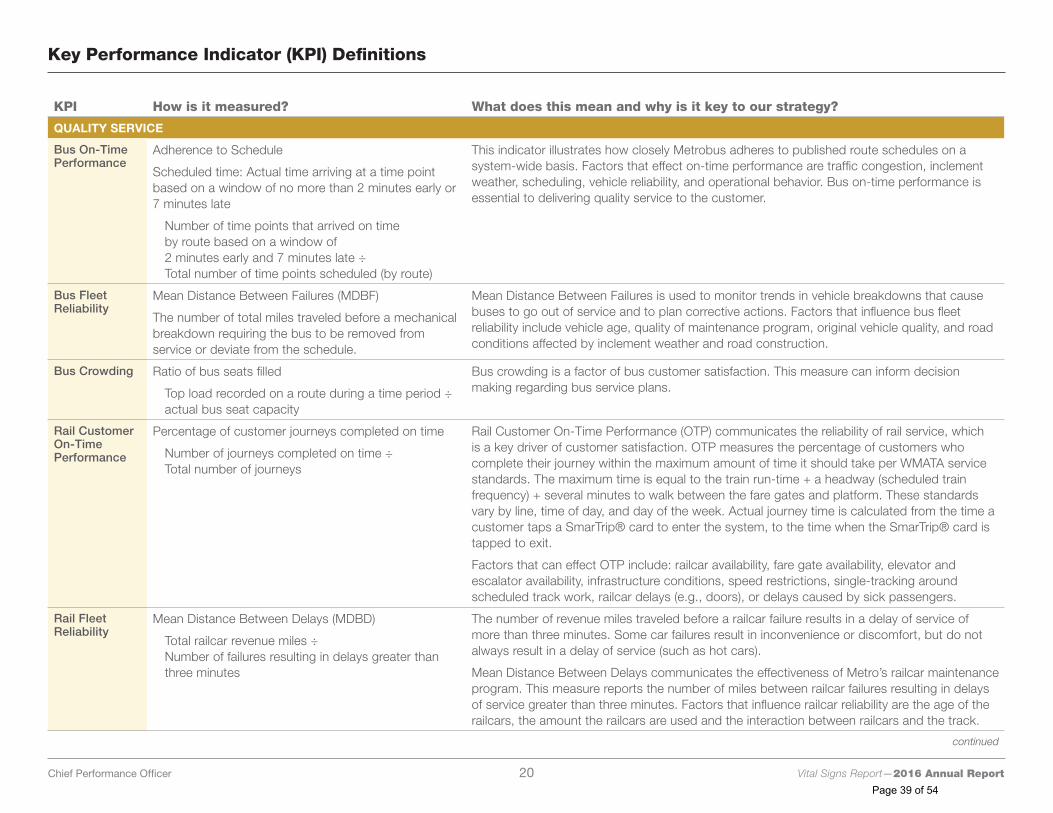
KPI How is it measured? What does this mean and why is it key to our strategy?
QUALITY SERVICE
Bus On-Time Performance
Adherence to Schedule
Scheduled time: Actual time arriving at a time point based on a window of no more than 2 minutes early or 7 minutes late
Number of time points that arrived on time by route based on a window of 2 minutes early and 7 minutes late ÷ Total number of time points scheduled (by route)
This indicator illustrates how closely Metrobus adheres to published route schedules on a system-wide basis. Factors that effect on-time performance are traffic congestion, inclement weather, scheduling, vehicle reliability, and operational behavior. Bus on-time performance is essential to delivering quality service to the customer.
Bus Fleet Reliability
Mean Distance Between Failures (MDBF)
The number of total miles traveled before a mechanical breakdown requiring the bus to be removed from service or deviate from the schedule.
Mean Distance Between Failures is used to monitor trends in vehicle breakdowns that cause buses to go out of service and to plan corrective actions. Factors that influence bus fleet reliability include vehicle age, quality of maintenance program, original vehicle quality, and road conditions affected by inclement weather and road construction.
Bus Crowding Ratio of bus seats filled
Top load recorded on a route during a time period ÷ actual bus seat capacity
Bus crowding is a factor of bus customer satisfaction. This measure can inform decision making regarding bus service plans.
Rail Customer On-Time Performance
Percentage of customer journeys completed on time
Number of journeys completed on time ÷ Total number of journeys
Rail Customer On-Time Performance (OTP) communicates the reliability of rail service, which is a key driver of customer satisfaction. OTP measures the percentage of customers who complete their journey within the maximum amount of time it should take per WMATA service standards. The maximum time is equal to the train run-time + a headway (scheduled train frequency) + several minutes to walk between the fare gates and platform. These standards vary by line, time of day, and day of the week. Actual journey time is calculated from the time a customer taps a SmarTrip® card to enter the system, to the time when the SmarTrip® card is tapped to exit.
Factors that can effect OTP include: railcar availability, fare gate availability, elevator and escalator availability, infrastructure conditions, speed restrictions, single-tracking around scheduled track work, railcar delays (e.g., doors), or delays caused by sick passengers.
Rail Fleet Reliability
Mean Distance Between Delays (MDBD)
Total railcar revenue miles ÷ Number of failures resulting in delays greater than three minutes
The number of revenue miles traveled before a railcar failure results in a delay of service of more than three minutes. Some car failures result in inconvenience or discomfort, but do not always result in a delay of service (such as hot cars).
Mean Distance Between Delays communicates the effectiveness of Metro’s railcar maintenance program. This measure reports the number of miles between railcar failures resulting in delays of service greater than three minutes. Factors that influence railcar reliability are the age of the railcars, the amount the railcars are used and the interaction between railcars and the track.
continued
Key Performance Indicator (KPI) Definitions
Chief Performance Officer 20 Vital Signs Report—2016 Annual Report
Page 39 of 54
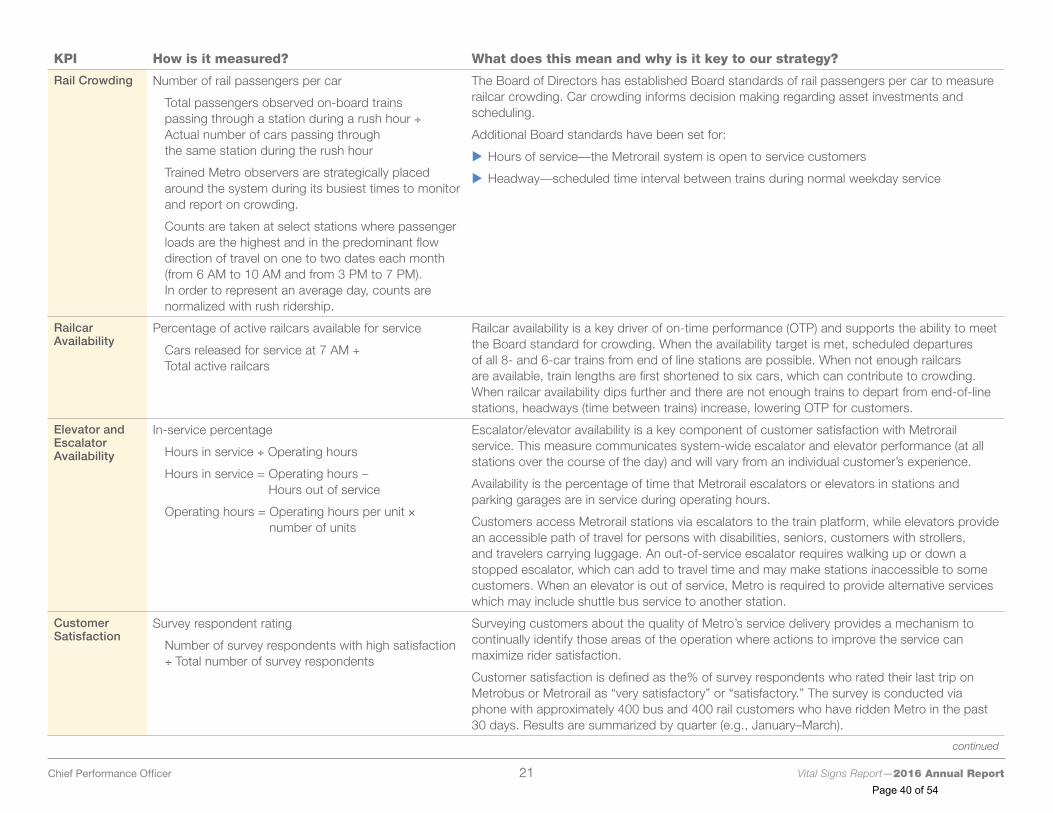
KPI How is it measured? What does this mean and why is it key to our strategy?
Rail Crowding Number of rail passengers per car
Total passengers observed on-board trains passing through a station during a rush hour ÷ Actual number of cars passing through the same station during the rush hour
Trained Metro observers are strategically placed around the system during its busiest times to monitor and report on crowding.
Counts are taken at select stations where passenger loads are the highest and in the predominant flow direction of travel on one to two dates each month (from 6 AM to 10 AM and from 3 PM to 7 PM). In order to represent an average day, counts are normalized with rush ridership.
The Board of Directors has established Board standards of rail passengers per car to measure railcar crowding. Car crowding informs decision making regarding asset investments and scheduling.
Additional Board standards have been set for:
X Hours of service—the Metrorail system is open to service customers
X Headway—scheduled time interval between trains during normal weekday service
Railcar Availability
Percentage of active railcars available for service
Cars released for service at 7 AM ÷ Total active railcars
Railcar availability is a key driver of on-time performance (OTP) and supports the ability to meet the Board standard for crowding. When the availability target is met, scheduled departures of all 8- and 6-car trains from end of line stations are possible. When not enough railcars are available, train lengths are first shortened to six cars, which can contribute to crowding. When railcar availability dips further and there are not enough trains to depart from end-of-line stations, headways (time between trains) increase, lowering OTP for customers.
Elevator and Escalator Availability
In-service percentage
Hours in service ÷ Operating hours
Hours in service = Operating hours – Hours out of service
Operating hours = Operating hours per unit × number of units
Escalator/elevator availability is a key component of customer satisfaction with Metrorail service. This measure communicates system-wide escalator and elevator performance (at all stations over the course of the day) and will vary from an individual customer’s experience.
Availability is the percentage of time that Metrorail escalators or elevators in stations and parking garages are in service during operating hours.
Customers access Metrorail stations via escalators to the train platform, while elevators provide an accessible path of travel for persons with disabilities, seniors, customers with strollers, and travelers carrying luggage. An out-of-service escalator requires walking up or down a stopped escalator, which can add to travel time and may make stations inaccessible to some customers. When an elevator is out of service, Metro is required to provide alternative services which may include shuttle bus service to another station.
Customer Satisfaction
Survey respondent rating
Number of survey respondents with high satisfaction ÷ Total number of survey respondents
Surveying customers about the quality of Metro’s service delivery provides a mechanism to continually identify those areas of the operation where actions to improve the service can maximize rider satisfaction.
Customer satisfaction is defined as the% of survey respondents who rated their last trip on Metrobus or Metrorail as “very satisfactory” or “satisfactory.” The survey is conducted via phone with approximately 400 bus and 400 rail customers who have ridden Metro in the past 30 days. Results are summarized by quarter (e.g., January–March).
continued
Chief Performance Officer 21 Vital Signs Report—2016 Annual Report
Page 40 of 54
KPI How is it measured? What does this mean and why is it key to our strategy?
SAFETY AND SECURITY
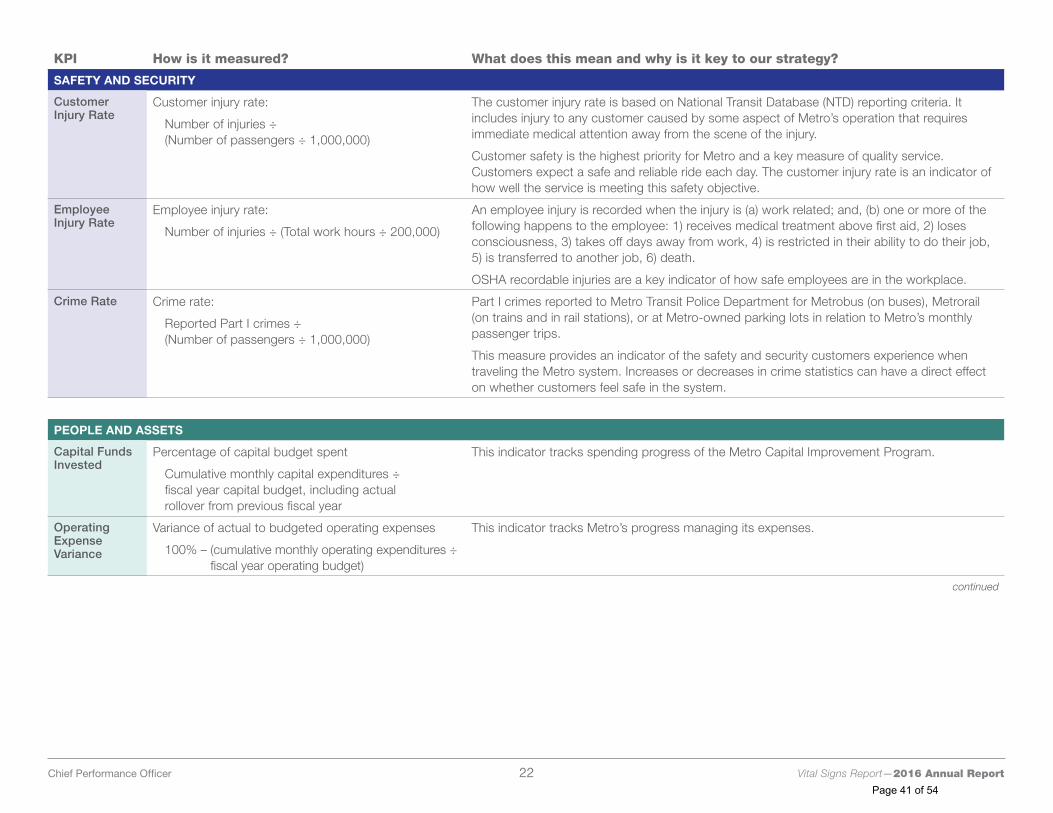
Customer Injury Rate
Customer injury rate:
Number of injuries ÷ (Number of passengers ÷ 1,000,000)
The customer injury rate is based on National Transit Database (NTD) reporting criteria. It includes injury to any customer caused by some aspect of Metro’s operation that requires immediate medical attention away from the scene of the injury.
Customer safety is the highest priority for Metro and a key measure of quality service. Customers expect a safe and reliable ride each day. The customer injury rate is an indicator of how well the service is meeting this safety objective.
Employee Injury Rate
Employee injury rate:
Number of injuries ÷ (Total work hours ÷ 200,000)
An employee injury is recorded when the injury is (a) work related; and, (b) one or more of the following happens to the employee: 1) receives medical treatment above first aid, 2) loses consciousness, 3) takes off days away from work, 4) is restricted in their ability to do their job, 5) is transferred to another job, 6) death.
OSHA recordable injuries are a key indicator of how safe employees are in the workplace.
Crime Rate Crime rate:
Reported Part I crimes ÷ (Number of passengers ÷ 1,000,000)
Part I crimes reported to Metro Transit Police Department for Metrobus (on buses), Metrorail (on trains and in rail stations), or at Metro-owned parking lots in relation to Metro’s monthly passenger trips.
This measure provides an indicator of the safety and security customers experience when traveling the Metro system. Increases or decreases in crime statistics can have a direct effect on whether customers feel safe in the system.
PEOPLE AND ASSETS
Capital Funds Invested
Percentage of capital budget spent
Cumulative monthly capital expenditures ÷ fiscal year capital budget, including actual rollover from previous fiscal year
This indicator tracks spending progress of the Metro Capital Improvement Program.
Operating Expense Variance
Variance of actual to budgeted operating expenses
100% – (cumulative monthly operating expenditures ÷ fiscal year operating budget)
This indicator tracks Metro’s progress managing its expenses.
continued
Chief Performance Officer 22 Vital Signs Report—2016 Annual Report
Page 41 of 54
KPI How is it measured? What does this mean and why is it key to our strategy?
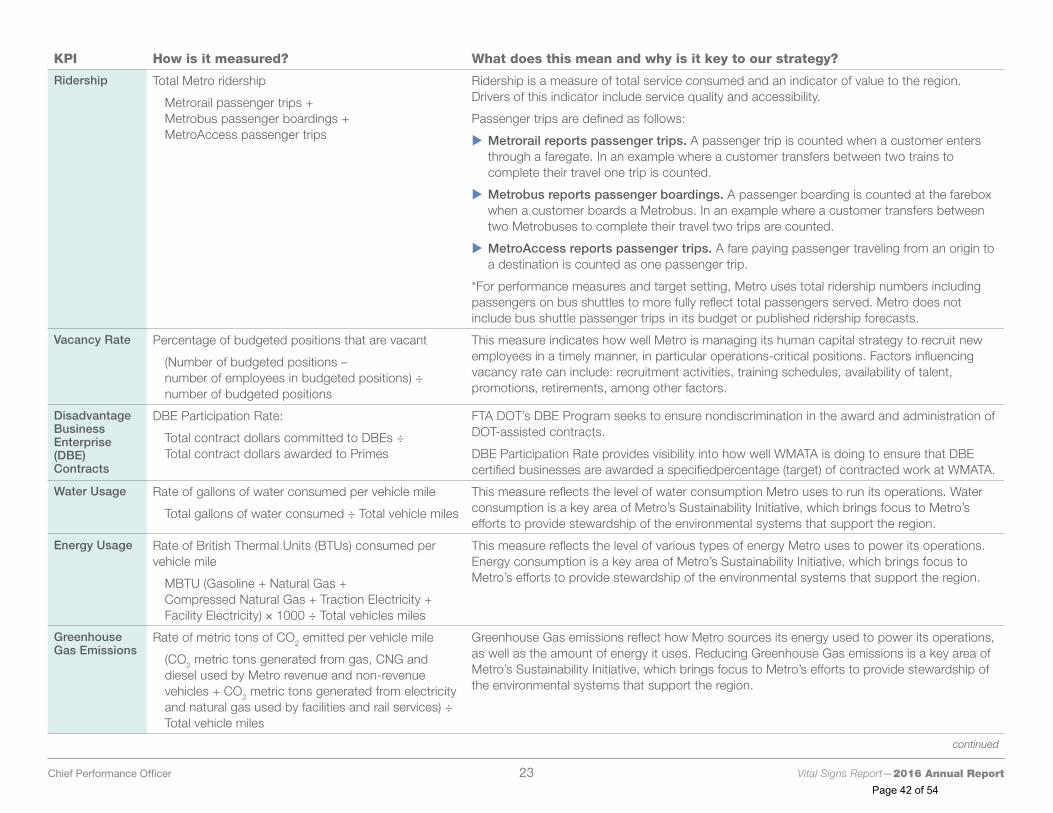
Ridership Total Metro ridership
Metrorail passenger trips + Metrobus passenger boardings + MetroAccess passenger trips
Ridership is a measure of total service consumed and an indicator of value to the region. Drivers of this indicator include service quality and accessibility.
Passenger trips are defined as follows:
X Metrorail reports passenger trips. A passenger trip is counted when a customer enters through a faregate. In an example where a customer transfers between two trains to complete their travel one trip is counted.
X Metrobus reports passenger boardings. A passenger boarding is counted at the farebox when a customer boards a Metrobus. In an example where a customer transfers between two Metrobuses to complete their travel two trips are counted.
X MetroAccess reports passenger trips. A fare paying passenger traveling from an origin to a destination is counted as one passenger trip.
*For performance measures and target setting, Metro uses total ridership numbers including passengers on bus shuttles to more fully reflect total passengers served. Metro does not include bus shuttle passenger trips in its budget or published ridership forecasts.
Vacancy Rate Percentage of budgeted positions that are vacant
(Number of budgeted positions – number of employees in budgeted positions) ÷ number of budgeted positions
This measure indicates how well Metro is managing its human capital strategy to recruit new employees in a timely manner, in particular operations-critical positions. Factors influencing vacancy rate can include: recruitment activities, training schedules, availability of talent, promotions, retirements, among other factors.
Disadvantage Business Enterprise (DBE) Contracts
DBE Participation Rate:
Total contract dollars committed to DBEs ÷ Total contract dollars awarded to Primes
FTA DOT’s DBE Program seeks to ensure nondiscrimination in the award and administration of DOT-assisted contracts.
DBE Participation Rate provides visibility into how well WMATA is doing to ensure that DBE certified businesses are awarded a specifiedpercentage (target) of contracted work at WMATA.
Water Usage Rate of gallons of water consumed per vehicle mile
Total gallons of water consumed ÷ Total vehicle miles
This measure reflects the level of water consumption Metro uses to run its operations. Water consumption is a key area of Metro’s Sustainability Initiative, which brings focus to Metro’s efforts to provide stewardship of the environmental systems that support the region.
Energy Usage Rate of British Thermal Units (BTUs) consumed per vehicle mile
MBTU (Gasoline + Natural Gas + Compressed Natural Gas + Traction Electricity + Facility Electricity) × 1000 ÷ Total vehicles miles
This measure reflects the level of various types of energy Metro uses to power its operations. Energy consumption is a key area of Metro’s Sustainability Initiative, which brings focus to Metro’s efforts to provide stewardship of the environmental systems that support the region.
Greenhouse Gas Emissions
Rate of metric tons of CO2 emitted per vehicle mile
(CO2 metric tons generated from gas, CNG and diesel used by Metro revenue and non-revenue vehicles + CO2 metric tons generated from electricity and natural gas used by facilities and rail services) ÷ Total vehicle miles
Greenhouse Gas emissions reflect how Metro sources its energy used to power its operations, as well as the amount of energy it uses. Reducing Greenhouse Gas emissions is a key area of Metro’s Sustainability Initiative, which brings focus to Metro’s efforts to provide stewardship of the environmental systems that support the region.
continued
Chief Performance Officer 23 Vital Signs Report—2016 Annual Report
Page 42 of 54
KPI How is it measured? What does this mean and why is it key to our strategy?
CONNECTING COMMUNITIES
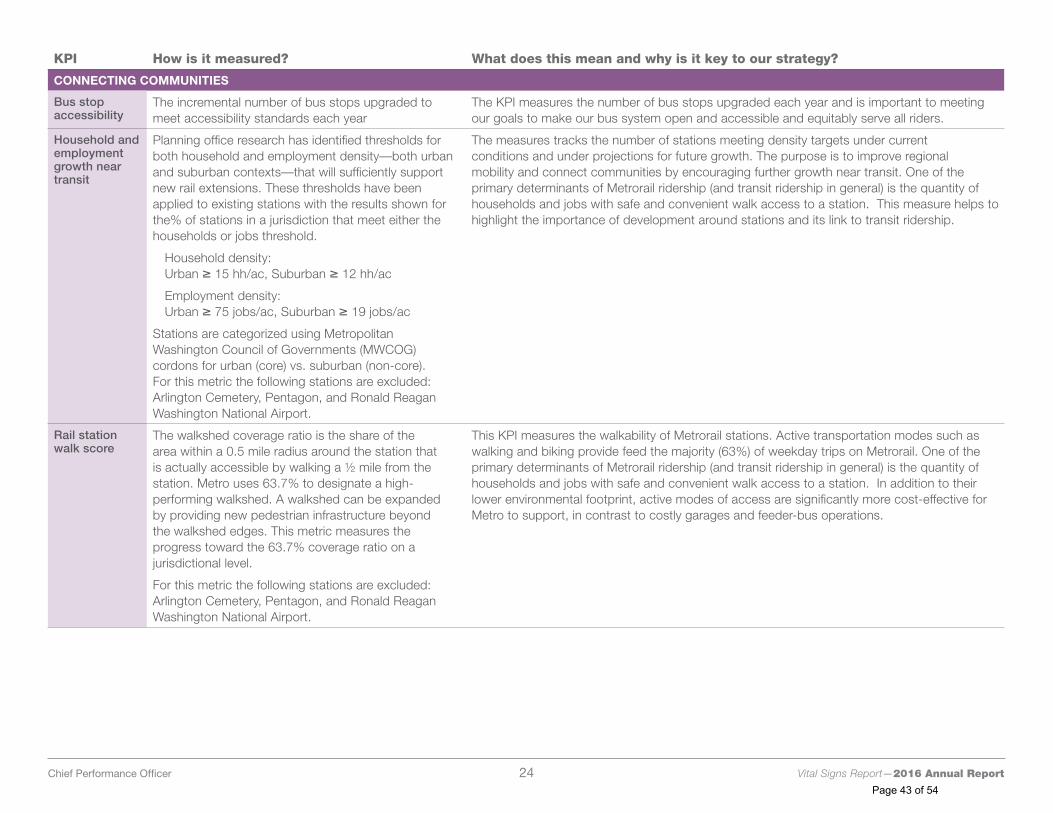
Bus stop accessibility
The incremental number of bus stops upgraded to meet accessibility standards each year
The KPI measures the number of bus stops upgraded each year and is important to meeting our goals to make our bus system open and accessible and equitably serve all riders.
Household and employment growth near transit
Planning office research has identified thresholds for both household and employment density—both urban and suburban contexts—that will sufficiently support new rail extensions. These thresholds have been applied to existing stations with the results shown for the% of stations in a jurisdiction that meet either the households or jobs threshold.
Household density: Urban ≥ 15 hh/ac, Suburban ≥ 12 hh/ac
Employment density: Urban ≥ 75 jobs/ac, Suburban ≥ 19 jobs/ac
Stations are categorized using Metropolitan Washington Council of Governments (MWCOG) cordons for urban (core) vs. suburban (non-core). For this metric the following stations are excluded: Arlington Cemetery, Pentagon, and Ronald Reagan Washington National Airport.
The measures tracks the number of stations meeting density targets under current conditions and under projections for future growth. The purpose is to improve regional mobility and connect communities by encouraging further growth near transit. One of the primary determinants of Metrorail ridership (and transit ridership in general) is the quantity of households and jobs with safe and convenient walk access to a station. This measure helps to highlight the importance of development around stations and its link to transit ridership.
Rail station walk score
The walkshed coverage ratio is the share of the area within a 0.5 mile radius around the station that is actually accessible by walking a ½ mile from the station. Metro uses 63.7% to designate a high-performing walkshed. A walkshed can be expanded by providing new pedestrian infrastructure beyond the walkshed edges. This metric measures the progress toward the 63.7% coverage ratio on a jurisdictional level.
For this metric the following stations are excluded: Arlington Cemetery, Pentagon, and Ronald Reagan Washington National Airport.
This KPI measures the walkability of Metrorail stations. Active transportation modes such as walking and biking provide feed the majority (63%) of weekday trips on Metrorail. One of the primary determinants of Metrorail ridership (and transit ridership in general) is the quantity of households and jobs with safe and convenient walk access to a station. In addition to their lower environmental footprint, active modes of access are significantly more cost-effective for Metro to support, in contrast to costly garages and feeder-bus operations.
continued
Chief Performance Officer 24 Vital Signs Report—2016 Annual Report
Page 43 of 54
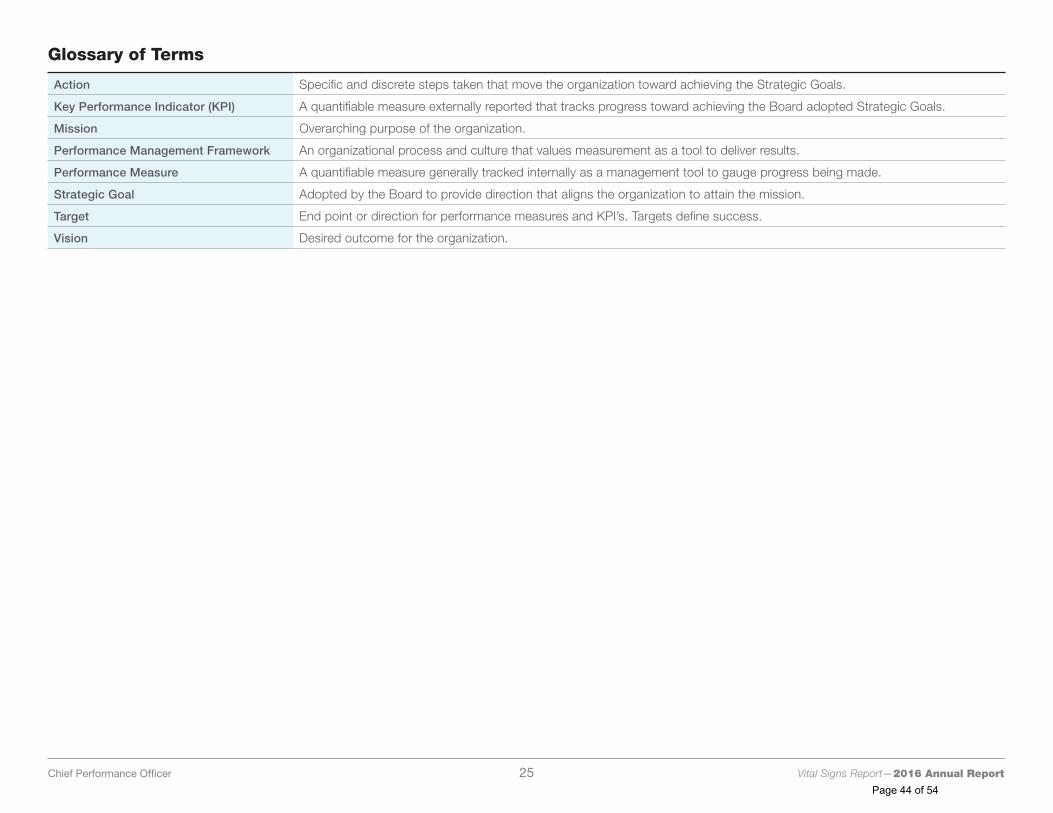
Glossary of Terms
Action Specific and discrete steps taken that move the organization toward achieving the Strategic Goals.
Key Performance Indicator (KPI) A quantifiable measure externally reported that tracks progress toward achieving the Board adopted Strategic Goals.
Mission Overarching purpose of the organization.
Performance Management Framework An organizational process and culture that values measurement as a tool to deliver results.
Performance Measure A quantifiable measure generally tracked internally as a management tool to gauge progress being made.
Strategic Goal Adopted by the Board to provide direction that aligns the organization to attain the mission.
Target End point or direction for performance measures and KPI’s. Targets define success.
Vision Desired outcome for the organization.
Chief Performance Officer 25 Vital Signs Report—2016 Annual Report
Page 44 of 54
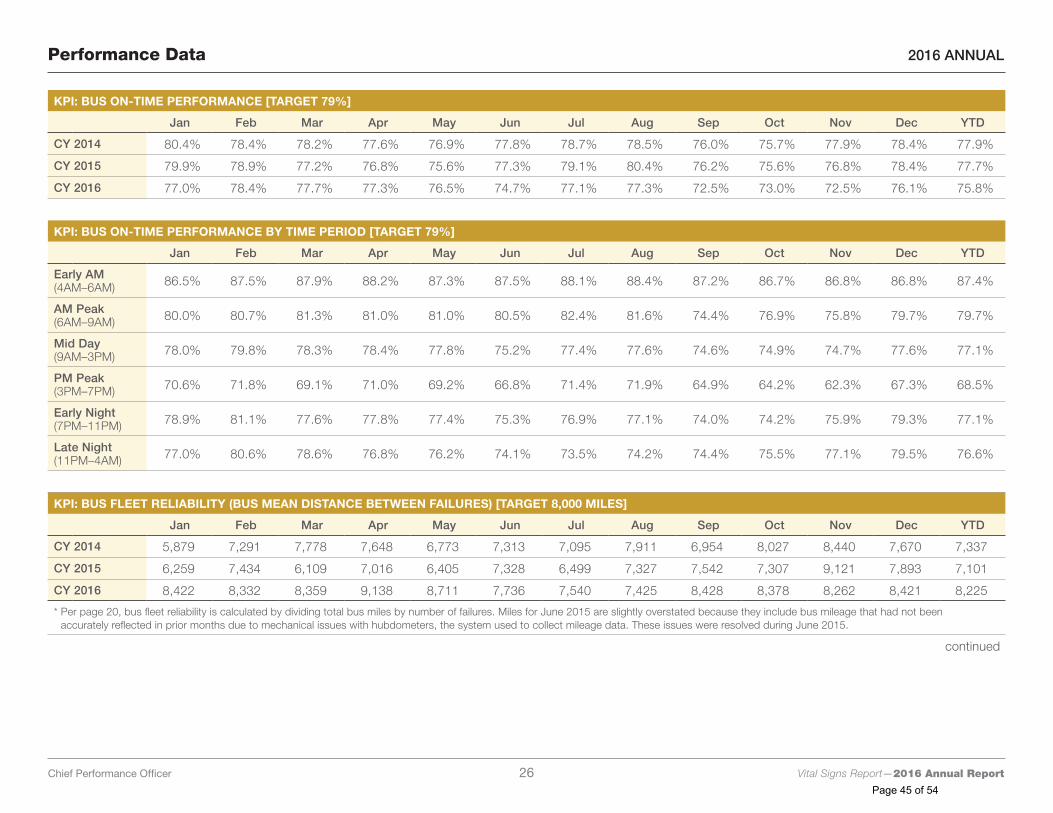
Performance Data 2016 ANNUAL
KPI: BUS ON-TIME PERFORMANCE [TARGET 79%]
Jan Feb Mar Apr May Jun Jul Aug Sep Oct Nov Dec YTD
CY 2014 80.4% 78.4% 78.2% 77.6% 76.9% 77.8% 78.7% 78.5% 76.0% 75.7% 77.9% 78.4% 77.9%
CY 2015 79.9% 78.9% 77.2% 76.8% 75.6% 77.3% 79.1% 80.4% 76.2% 75.6% 76.8% 78.4% 77.7%
CY 2016 77.0% 78.4% 77.7% 77.3% 76.5% 74.7% 77.1% 77.3% 72.5% 73.0% 72.5% 76.1% 75.8%
KPI: BUS ON-TIME PERFORMANCE BY TIME PERIOD [TARGET 79%]
Jan Feb Mar Apr May Jun Jul Aug Sep Oct Nov Dec YTD
Early AM (4AM–6AM) 86.5% 87.5% 87.9% 88.2% 87.3% 87.5% 88.1% 88.4% 87.2% 86.7% 86.8% 86.8% 87.4%
AM Peak (6AM–9AM) 80.0% 80.7% 81.3% 81.0% 81.0% 80.5% 82.4% 81.6% 74.4% 76.9% 75.8% 79.7% 79.7%
Mid Day (9AM–3PM) 78.0% 79.8% 78.3% 78.4% 77.8% 75.2% 77.4% 77.6% 74.6% 74.9% 74.7% 77.6% 77.1%
PM Peak (3PM–7PM) 70.6% 71.8% 69.1% 71.0% 69.2% 66.8% 71.4% 71.9% 64.9% 64.2% 62.3% 67.3% 68.5%
Early Night (7PM–11PM) 78.9% 81.1% 77.6% 77.8% 77.4% 75.3% 76.9% 77.1% 74.0% 74.2% 75.9% 79.3% 77.1%
Late Night (11PM–4AM) 77.0% 80.6% 78.6% 76.8% 76.2% 74.1% 73.5% 74.2% 74.4% 75.5% 77.1% 79.5% 76.6%
KPI: BUS FLEET RELIABILITY (BUS MEAN DISTANCE BETWEEN FAILURES) [TARGET 8,000 MILES]
Jan Feb Mar Apr May Jun Jul Aug Sep Oct Nov Dec YTD
CY 2014 5,879 7,291 7,778 7,648 6,773 7,313 7,095 7,911 6,954 8,027 8,440 7,670 7,337
CY 2015 6,259 7,434 6,109 7,016 6,405 7,328 6,499 7,327 7,542 7,307 9,121 7,893 7,101
CY 2016 8,422 8,332 8,359 9,138 8,711 7,736 7,540 7,425 8,428 8,378 8,262 8,421 8,225
* Per page 20, bus fleet reliability is calculated by dividing total bus miles by number of failures. Miles for June 2015 are slightly overstated because they include bus mileage that had not been accurately reflected in prior months due to mechanical issues with hubdometers, the system used to collect mileage data. These issues were resolved during June 2015.
continued
Chief Performance Officer 26 Vital Signs Report—2016 Annual Report
Page 45 of 54
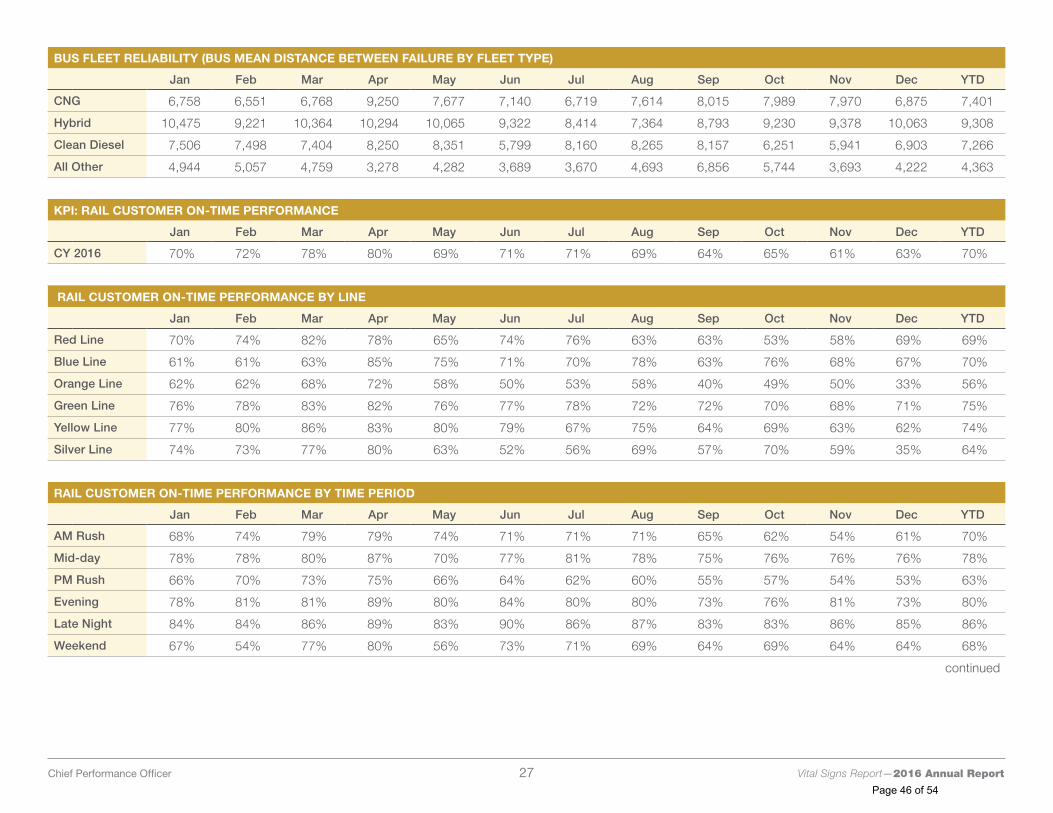
BUS FLEET RELIABILITY (BUS MEAN DISTANCE BETWEEN FAILURE BY FLEET TYPE)
Jan Feb Mar Apr May Jun Jul Aug Sep Oct Nov Dec YTD
CNG 6,758 6,551 6,768 9,250 7,677 7,140 6,719 7,614 8,015 7,989 7,970 6,875 7,401
Hybrid 10,475 9,221 10,364 10,294 10,065 9,322 8,414 7,364 8,793 9,230 9,378 10,063 9,308
Clean Diesel 7,506 7,498 7,404 8,250 8,351 5,799 8,160 8,265 8,157 6,251 5,941 6,903 7,266
All Other 4,944 5,057 4,759 3,278 4,282 3,689 3,670 4,693 6,856 5,744 3,693 4,222 4,363
KPI: RAIL CUSTOMER ON-TIME PERFORMANCE
Jan Feb Mar Apr May Jun Jul Aug Sep Oct Nov Dec YTD
CY 2016 70% 72% 78% 80% 69% 71% 71% 69% 64% 65% 61% 63% 70%
RAIL CUSTOMER ON-TIME PERFORMANCE BY LINE
Jan Feb Mar Apr May Jun Jul Aug Sep Oct Nov Dec YTD
Red Line 70% 74% 82% 78% 65% 74% 76% 63% 63% 53% 58% 69% 69%
Blue Line 61% 61% 63% 85% 75% 71% 70% 78% 63% 76% 68% 67% 70%
Orange Line 62% 62% 68% 72% 58% 50% 53% 58% 40% 49% 50% 33% 56%
Green Line 76% 78% 83% 82% 76% 77% 78% 72% 72% 70% 68% 71% 75%
Yellow Line 77% 80% 86% 83% 80% 79% 67% 75% 64% 69% 63% 62% 74%
Silver Line 74% 73% 77% 80% 63% 52% 56% 69% 57% 70% 59% 35% 64%
RAIL CUSTOMER ON-TIME PERFORMANCE BY TIME PERIOD
Jan Feb Mar Apr May Jun Jul Aug Sep Oct Nov Dec YTD
AM Rush 68% 74% 79% 79% 74% 71% 71% 71% 65% 62% 54% 61% 70%
Mid-day 78% 78% 80% 87% 70% 77% 81% 78% 75% 76% 76% 76% 78%
PM Rush 66% 70% 73% 75% 66% 64% 62% 60% 55% 57% 54% 53% 63%
Evening 78% 81% 81% 89% 80% 84% 80% 80% 73% 76% 81% 73% 80%
Late Night 84% 84% 86% 89% 83% 90% 86% 87% 83% 83% 86% 85% 86%
Weekend 67% 54% 77% 80% 56% 73% 71% 69% 64% 69% 64% 64% 68%
continued
Chief Performance Officer 27 Vital Signs Report—2016 Annual Report
Page 46 of 54
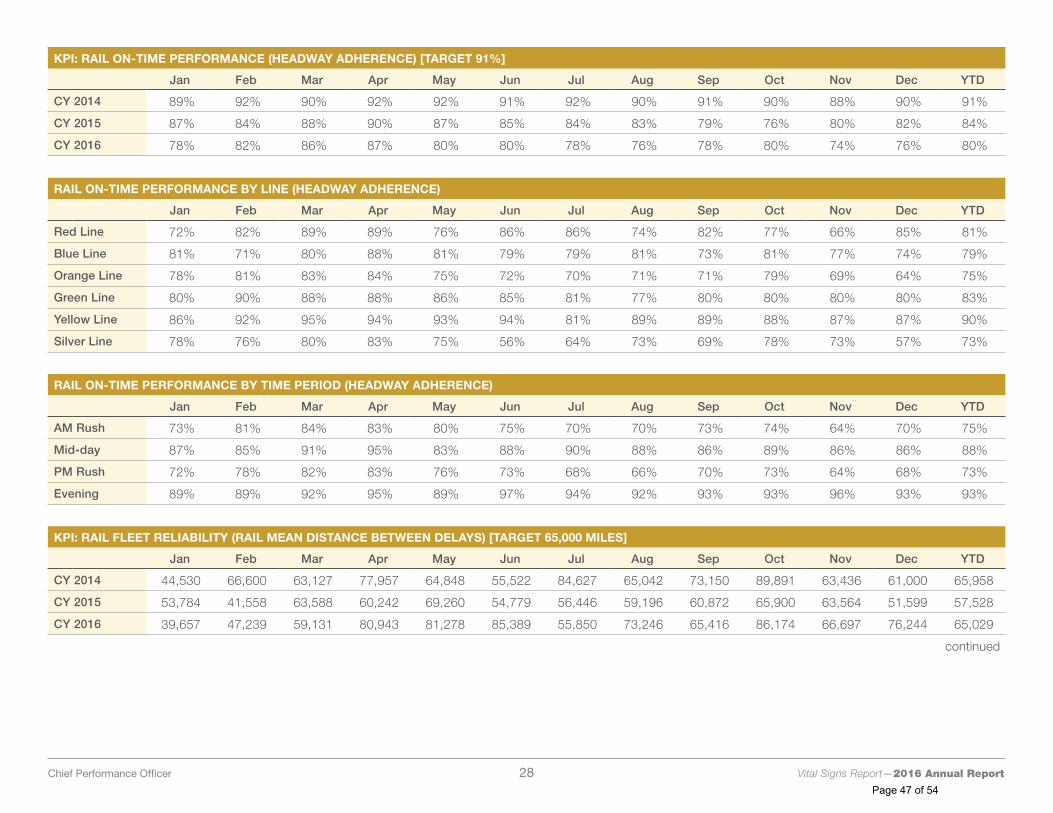
KPI: RAIL ON-TIME PERFORMANCE (HEADWAY ADHERENCE) [TARGET 91%]
Jan Feb Mar Apr May Jun Jul Aug Sep Oct Nov Dec YTD
CY 2014 89% 92% 90% 92% 92% 91% 92% 90% 91% 90% 88% 90% 91%
CY 2015 87% 84% 88% 90% 87% 85% 84% 83% 79% 76% 80% 82% 84%
CY 2016 78% 82% 86% 87% 80% 80% 78% 76% 78% 80% 74% 76% 80%
RAIL ON-TIME PERFORMANCE BY LINE (HEADWAY ADHERENCE)
Jan Feb Mar Apr May Jun Jul Aug Sep Oct Nov Dec YTD
Red Line 72% 82% 89% 89% 76% 86% 86% 74% 82% 77% 66% 85% 81%
Blue Line 81% 71% 80% 88% 81% 79% 79% 81% 73% 81% 77% 74% 79%
Orange Line 78% 81% 83% 84% 75% 72% 70% 71% 71% 79% 69% 64% 75%
Green Line 80% 90% 88% 88% 86% 85% 81% 77% 80% 80% 80% 80% 83%
Yellow Line 86% 92% 95% 94% 93% 94% 81% 89% 89% 88% 87% 87% 90%
Silver Line 78% 76% 80% 83% 75% 56% 64% 73% 69% 78% 73% 57% 73%
RAIL ON-TIME PERFORMANCE BY TIME PERIOD (HEADWAY ADHERENCE)
Jan Feb Mar Apr May Jun Jul Aug Sep Oct Nov Dec YTD
AM Rush 73% 81% 84% 83% 80% 75% 70% 70% 73% 74% 64% 70% 75%
Mid-day 87% 85% 91% 95% 83% 88% 90% 88% 86% 89% 86% 86% 88%
PM Rush 72% 78% 82% 83% 76% 73% 68% 66% 70% 73% 64% 68% 73%
Evening 89% 89% 92% 95% 89% 97% 94% 92% 93% 93% 96% 93% 93%
KPI: RAIL FLEET RELIABILITY (RAIL MEAN DISTANCE BETWEEN DELAYS) [TARGET 65,000 MILES]
Jan Feb Mar Apr May Jun Jul Aug Sep Oct Nov Dec YTD
CY 2014 44,530 66,600 63,127 77,957 64,848 55,522 84,627 65,042 73,150 89,891 63,436 61,000 65,958
CY 2015 53,784 41,558 63,588 60,242 69,260 54,779 56,446 59,196 60,872 65,900 63,564 51,599 57,528
CY 2016 39,657 47,239 59,131 80,943 81,278 85,389 55,850 73,246 65,416 86,174 66,697 76,244 65,029
continued
Chief Performance Officer 28 Vital Signs Report—2016 Annual Report
Page 47 of 54
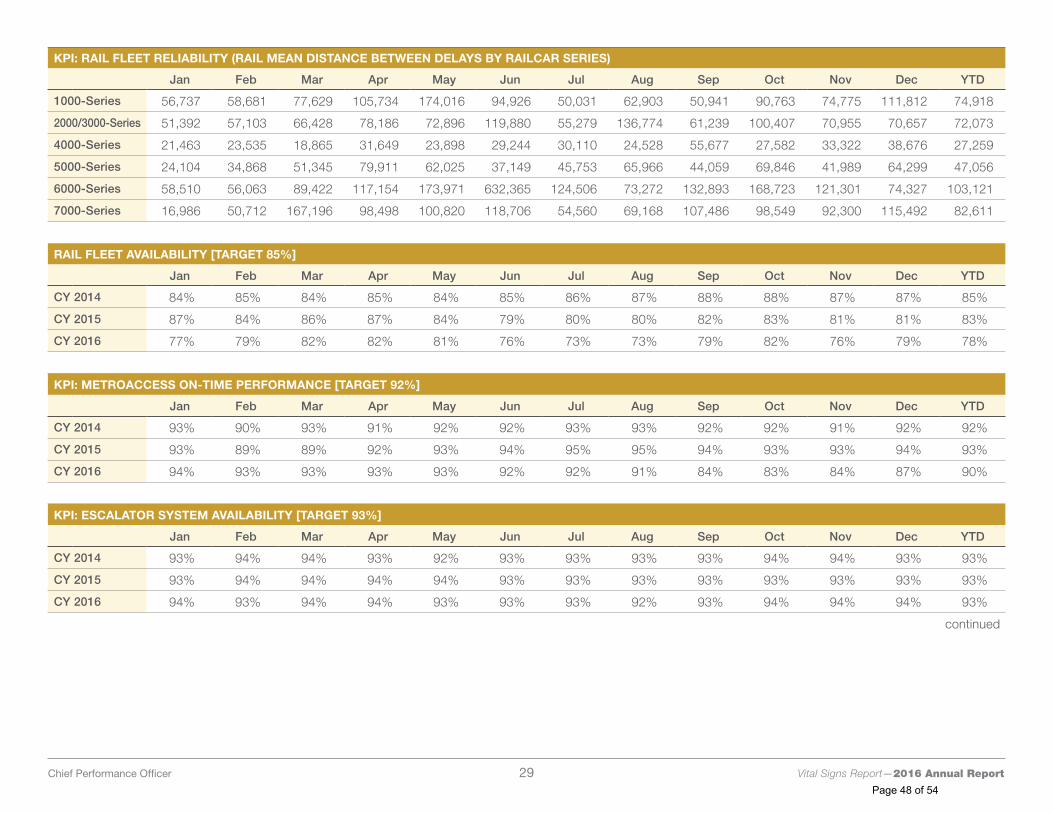
KPI: RAIL FLEET RELIABILITY (RAIL MEAN DISTANCE BETWEEN DELAYS BY RAILCAR SERIES)
Jan Feb Mar Apr May Jun Jul Aug Sep Oct Nov Dec YTD
1000-Series 56,737 58,681 77,629 105,734 174,016 94,926 50,031 62,903 50,941 90,763 74,775 111,812 74,918
2000/3000-Series 51,392 57,103 66,428 78,186 72,896 119,880 55,279 136,774 61,239 100,407 70,955 70,657 72,073
4000-Series 21,463 23,535 18,865 31,649 23,898 29,244 30,110 24,528 55,677 27,582 33,322 38,676 27,259
5000-Series 24,104 34,868 51,345 79,911 62,025 37,149 45,753 65,966 44,059 69,846 41,989 64,299 47,056
6000-Series 58,510 56,063 89,422 117,154 173,971 632,365 124,506 73,272 132,893 168,723 121,301 74,327 103,121
7000-Series 16,986 50,712 167,196 98,498 100,820 118,706 54,560 69,168 107,486 98,549 92,300 115,492 82,611
RAIL FLEET AVAILABILITY [TARGET 85%]
Jan Feb Mar Apr May Jun Jul Aug Sep Oct Nov Dec YTD
CY 2014 84% 85% 84% 85% 84% 85% 86% 87% 88% 88% 87% 87% 85%
CY 2015 87% 84% 86% 87% 84% 79% 80% 80% 82% 83% 81% 81% 83%
CY 2016 77% 79% 82% 82% 81% 76% 73% 73% 79% 82% 76% 79% 78%
KPI: METROACCESS ON-TIME PERFORMANCE [TARGET 92%]
Jan Feb Mar Apr May Jun Jul Aug Sep Oct Nov Dec YTD
CY 2014 93% 90% 93% 91% 92% 92% 93% 93% 92% 92% 91% 92% 92%
CY 2015 93% 89% 89% 92% 93% 94% 95% 95% 94% 93% 93% 94% 93%
CY 2016 94% 93% 93% 93% 93% 92% 92% 91% 84% 83% 84% 87% 90%
KPI: ESCALATOR SYSTEM AVAILABILITY [TARGET 93%]
Jan Feb Mar Apr May Jun Jul Aug Sep Oct Nov Dec YTD
CY 2014 93% 94% 94% 93% 92% 93% 93% 93% 93% 94% 94% 93% 93%
CY 2015 93% 94% 94% 94% 94% 93% 93% 93% 93% 93% 93% 93% 93%
CY 2016 94% 93% 94% 94% 93% 93% 93% 92% 93% 94% 94% 94% 93%
continued
Chief Performance Officer 29 Vital Signs Report—2016 Annual Report
Page 48 of 54
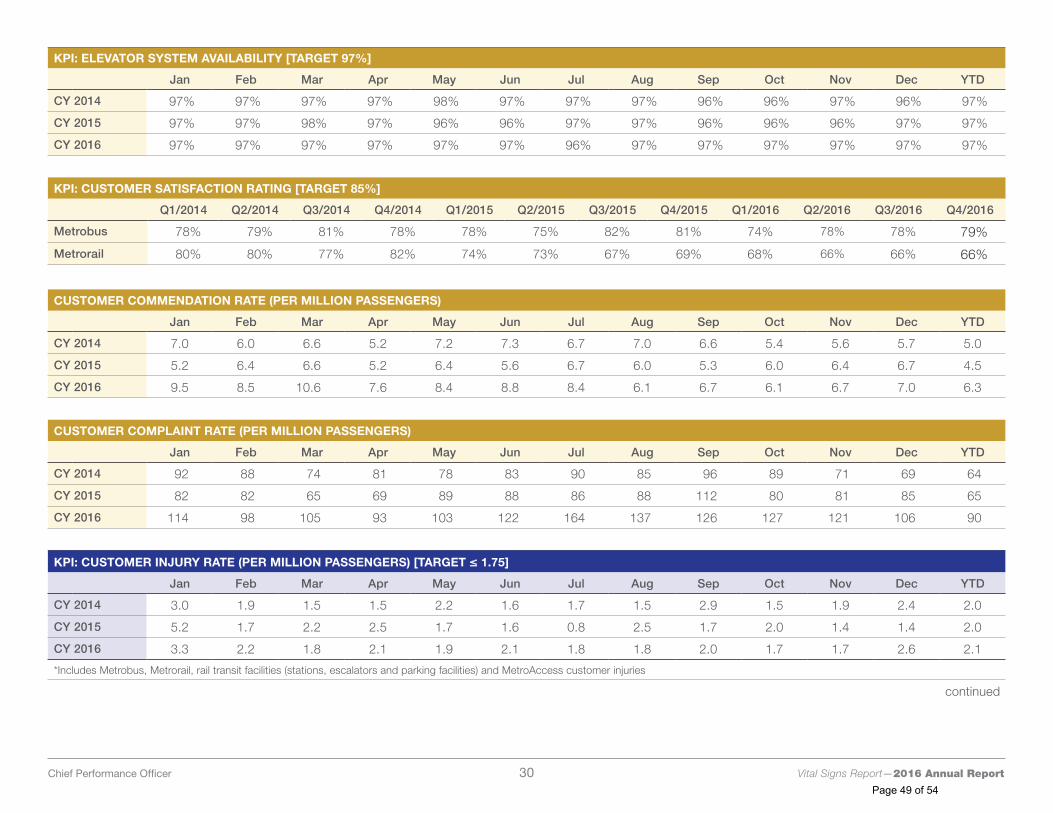
KPI: ELEVATOR SYSTEM AVAILABILITY [TARGET 97%]
Jan Feb Mar Apr May Jun Jul Aug Sep Oct Nov Dec YTD
CY 2014 97% 97% 97% 97% 98% 97% 97% 97% 96% 96% 97% 96% 97%
CY 2015 97% 97% 98% 97% 96% 96% 97% 97% 96% 96% 96% 97% 97%
CY 2016 97% 97% 97% 97% 97% 97% 96% 97% 97% 97% 97% 97% 97%
KPI: CUSTOMER SATISFACTION RATING [TARGET 85%]
Q1/2014 Q2/2014 Q3/2014 Q4/2014 Q1/2015 Q2/2015 Q3/2015 Q4/2015 Q1/2016 Q2/2016 Q3/2016 Q4/2016
Metrobus 78% 79% 81% 78% 78% 75% 82% 81% 74% 78% 78% 79%
Metrorail 80% 80% 77% 82% 74% 73% 67% 69% 68% 66% 66% 66%
CUSTOMER COMMENDATION RATE (PER MILLION PASSENGERS)
Jan Feb Mar Apr May Jun Jul Aug Sep Oct Nov Dec YTD
CY 2014 7.0 6.0 6.6 5.2 7.2 7.3 6.7 7.0 6.6 5.4 5.6 5.7 5.0
CY 2015 5.2 6.4 6.6 5.2 6.4 5.6 6.7 6.0 5.3 6.0 6.4 6.7 4.5
CY 2016 9.5 8.5 10.6 7.6 8.4 8.8 8.4 6.1 6.7 6.1 6.7 7.0 6.3
CUSTOMER COMPLAINT RATE (PER MILLION PASSENGERS)
Jan Feb Mar Apr May Jun Jul Aug Sep Oct Nov Dec YTD
CY 2014 92 88 74 81 78 83 90 85 96 89 71 69 64
CY 2015 82 82 65 69 89 88 86 88 112 80 81 85 65
CY 2016 114 98 105 93 103 122 164 137 126 127 121 106 90
KPI: CUSTOMER INJURY RATE (PER MILLION PASSENGERS) [TARGET ≤ 1.75]
Jan Feb Mar Apr May Jun Jul Aug Sep Oct Nov Dec YTD
CY 2014 3.0 1.9 1.5 1.5 2.2 1.6 1.7 1.5 2.9 1.5 1.9 2.4 2.0
CY 2015 5.2 1.7 2.2 2.5 1.7 1.6 0.8 2.5 1.7 2.0 1.4 1.4 2.0
CY 2016 3.3 2.2 1.8 2.1 1.9 2.1 1.8 1.8 2.0 1.7 1.7 2.6 2.1
*Includes Metrobus, Metrorail, rail transit facilities (stations, escalators and parking facilities) and MetroAccess customer injuries
continued
Customer Sat is a table within a table
Chief Performance Officer 30 Vital Signs Report—2016 Annual Report
Page 49 of 54
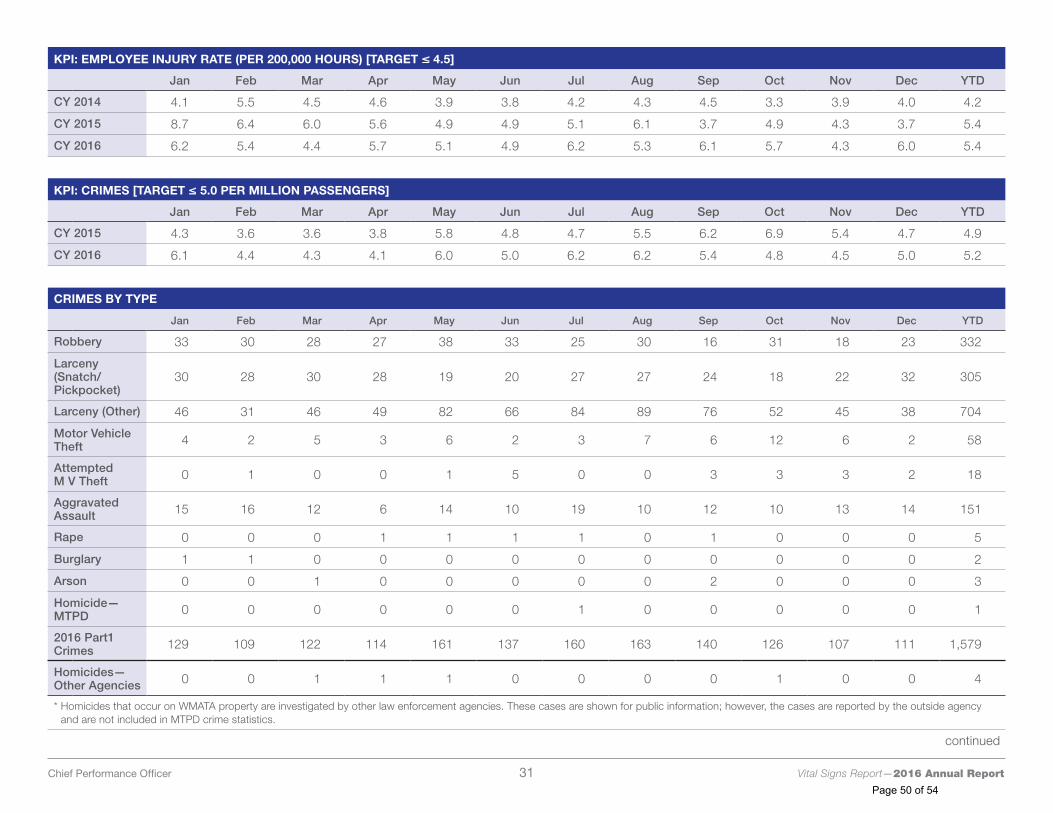
KPI: EMPLOYEE INJURY RATE (PER 200,000 HOURS) [TARGET ≤ 4.5]
Jan Feb Mar Apr May Jun Jul Aug Sep Oct Nov Dec YTD
CY 2014 4.1 5.5 4.5 4.6 3.9 3.8 4.2 4.3 4.5 3.3 3.9 4.0 4.2
CY 2015 8.7 6.4 6.0 5.6 4.9 4.9 5.1 6.1 3.7 4.9 4.3 3.7 5.4
CY 2016 6.2 5.4 4.4 5.7 5.1 4.9 6.2 5.3 6.1 5.7 4.3 6.0 5.4
KPI: CRIMES [TARGET ≤ 5.0 PER MILLION PASSENGERS]
Jan Feb Mar Apr May Jun Jul Aug Sep Oct Nov Dec YTD
CY 2015 4.3 3.6 3.6 3.8 5.8 4.8 4.7 5.5 6.2 6.9 5.4 4.7 4.9
CY 2016 6.1 4.4 4.3 4.1 6.0 5.0 6.2 6.2 5.4 4.8 4.5 5.0 5.2
CRIMES BY TYPE
Jan Feb Mar Apr May Jun Jul Aug Sep Oct Nov Dec YTD
Robbery 33 30 28 27 38 33 25 30 16 31 18 23 332
Larceny (Snatch/Pickpocket)
30 28 30 28 19 20 27 27 24 18 22 32 305
Larceny (Other) 46 31 46 49 82 66 84 89 76 52 45 38 704
Motor Vehicle Theft 4 2 5 3 6 2 3 7 6 12 6 2 58
Attempted M V Theft 0 1 0 0 1 5 0 0 3 3 3 2 18
Aggravated Assault 15 16 12 6 14 10 19 10 12 10 13 14 151
Rape 0 0 0 1 1 1 1 0 1 0 0 0 5
Burglary 1 1 0 0 0 0 0 0 0 0 0 0 2
Arson 0 0 1 0 0 0 0 0 2 0 0 0 3
Homicide—MTPD 0 0 0 0 0 0 1 0 0 0 0 0 1
2016 Part1 Crimes 129 109 122 114 161 137 160 163 140 126 107 111 1,579
Homicides—Other Agencies 0 0 1 1 1 0 0 0 0 1 0 0 4
* Homicides that occur on WMATA property are investigated by other law enforcement agencies. These cases are shown for public information; however, the cases are reported by the outside agency and are not included in MTPD crime statistics.
continued
Chief Performance Officer 31 Vital Signs Report—2016 Annual Report
Page 50 of 54
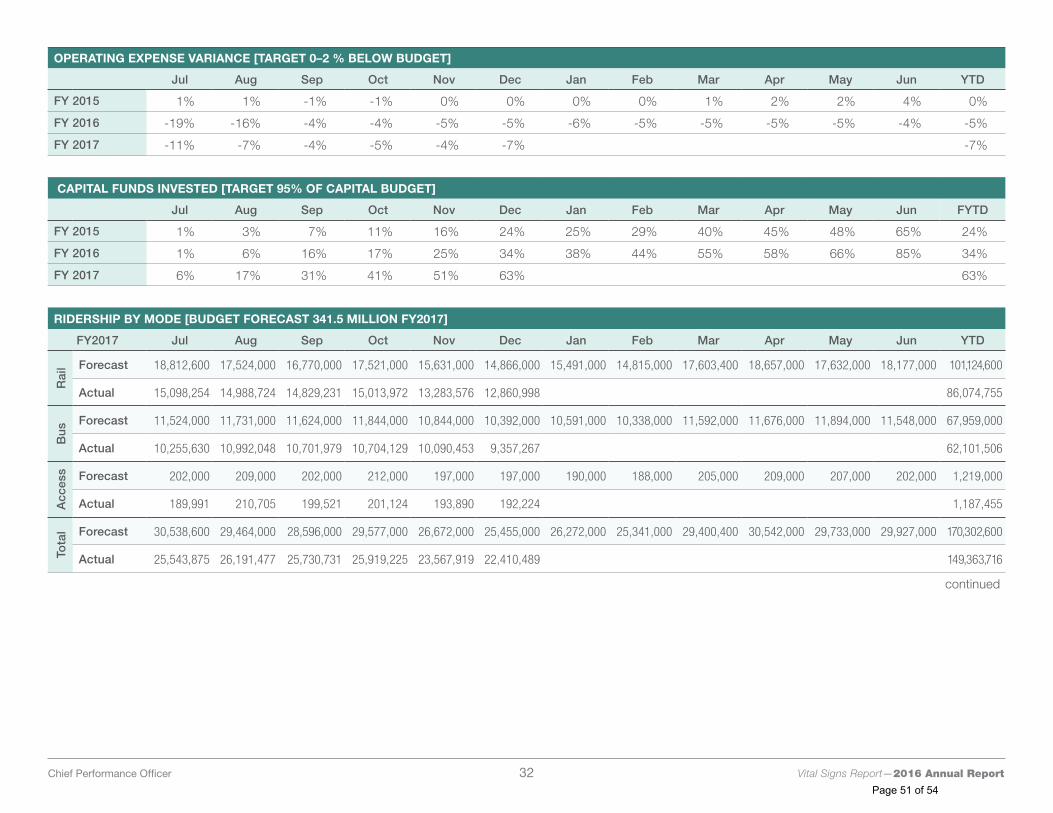
OPERATING EXPENSE VARIANCE [TARGET 0–2 % BELOW BUDGET]
Jul Aug Sep Oct Nov Dec Jan Feb Mar Apr May Jun YTD
FY 2015 1% 1% -1% -1% 0% 0% 0% 0% 1% 2% 2% 4% 0%
FY 2016 -19% -16% -4% -4% -5% -5% -6% -5% -5% -5% -5% -4% -5%
FY 2017 -11% -7% -4% -5% -4% -7% -7%
CAPITAL FUNDS INVESTED [TARGET 95% OF CAPITAL BUDGET]
Jul Aug Sep Oct Nov Dec Jan Feb Mar Apr May Jun FYTD
FY 2015 1% 3% 7% 11% 16% 24% 25% 29% 40% 45% 48% 65% 24%
FY 2016 1% 6% 16% 17% 25% 34% 38% 44% 55% 58% 66% 85% 34%
FY 2017 6% 17% 31% 41% 51% 63% 63%
RIDERSHIP BY MODE [BUDGET FORECAST 341.5 MILLION FY2017]
FY2017 Jul Aug Sep Oct Nov Dec Jan Feb Mar Apr May Jun YTD
Rai
l Forecast 18,812,600 17,524,000 16,770,000 17,521,000 15,631,000 14,866,000 15,491,000 14,815,000 17,603,400 18,657,000 17,632,000 18,177,000 101,124,600
Actual 15,098,254 14,988,724 14,829,231 15,013,972 13,283,576 12,860,998 86,074,755
Bus
Forecast 11,524,000 11,731,000 11,624,000 11,844,000 10,844,000 10,392,000 10,591,000 10,338,000 11,592,000 11,676,000 11,894,000 11,548,000 67,959,000
Actual 10,255,630 10,992,048 10,701,979 10,704,129 10,090,453 9,357,267 62,101,506
Acc
ess Forecast 202,000 209,000 202,000 212,000 197,000 197,000 190,000 188,000 205,000 209,000 207,000 202,000 1,219,000
Actual 189,991 210,705 199,521 201,124 193,890 192,224 1,187,455
Tota
l Forecast 30,538,600 29,464,000 28,596,000 29,577,000 26,672,000 25,455,000 26,272,000 25,341,000 29,400,400 30,542,000 29,733,000 29,927,000 170,302,600
Actual 25,543,875 26,191,477 25,730,731 25,919,225 23,567,919 22,410,489 149,363,716
continued
Chief Performance Officer 32 Vital Signs Report—2016 Annual Report
Page 51 of 54
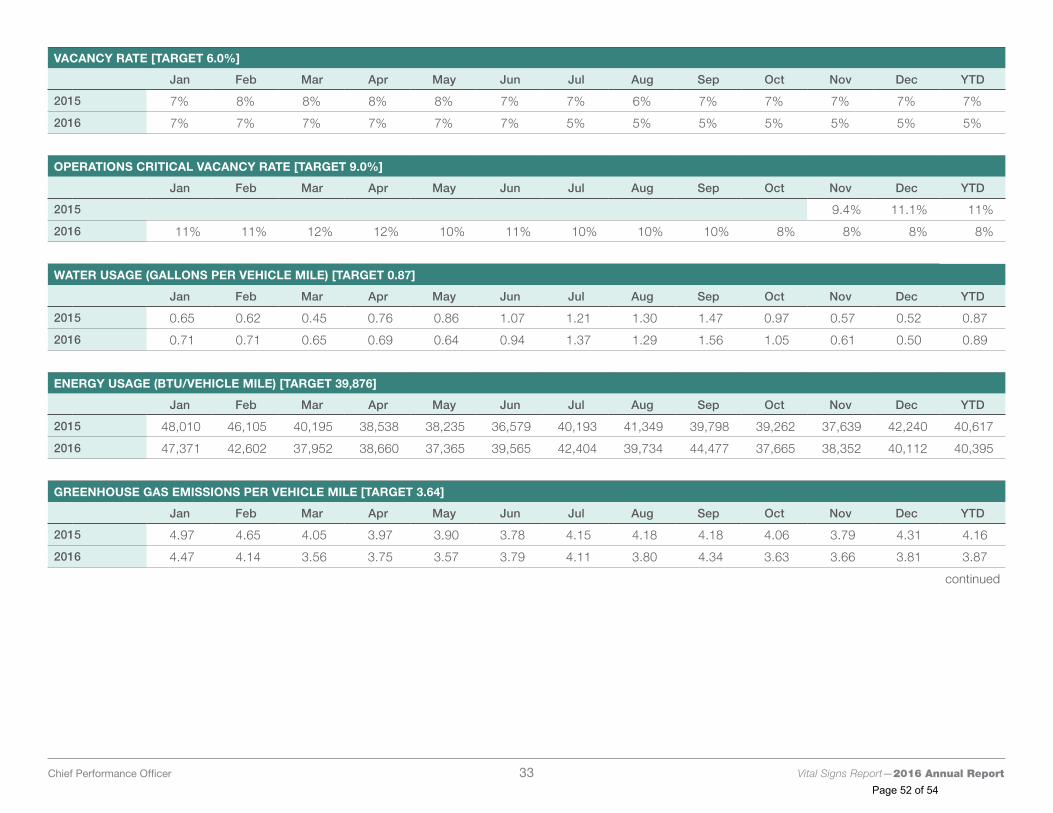
VACANCY RATE [TARGET 6.0%]
Jan Feb Mar Apr May Jun Jul Aug Sep Oct Nov Dec YTD
2015 7% 8% 8% 8% 8% 7% 7% 6% 7% 7% 7% 7% 7%
2016 7% 7% 7% 7% 7% 7% 5% 5% 5% 5% 5% 5% 5%
OPERATIONS CRITICAL VACANCY RATE [TARGET 9.0%]
Jan Feb Mar Apr May Jun Jul Aug Sep Oct Nov Dec YTD
2015 9.4% 11.1% 11%
2016 11% 11% 12% 12% 10% 11% 10% 10% 10% 8% 8% 8% 8%
WATER USAGE (GALLONS PER VEHICLE MILE) [TARGET 0.87]
Jan Feb Mar Apr May Jun Jul Aug Sep Oct Nov Dec YTD
2015 0.65 0.62 0.45 0.76 0.86 1.07 1.21 1.30 1.47 0.97 0.57 0.52 0.87
2016 0.71 0.71 0.65 0.69 0.64 0.94 1.37 1.29 1.56 1.05 0.61 0.50 0.89
ENERGY USAGE (BTU/VEHICLE MILE) [TARGET 39,876]
Jan Feb Mar Apr May Jun Jul Aug Sep Oct Nov Dec YTD
2015 48,010 46,105 40,195 38,538 38,235 36,579 40,193 41,349 39,798 39,262 37,639 42,240 40,617
2016 47,371 42,602 37,952 38,660 37,365 39,565 42,404 39,734 44,477 37,665 38,352 40,112 40,395
GREENHOUSE GAS EMISSIONS PER VEHICLE MILE [TARGET 3.64]
Jan Feb Mar Apr May Jun Jul Aug Sep Oct Nov Dec YTD
2015 4.97 4.65 4.05 3.97 3.90 3.78 4.15 4.18 4.18 4.06 3.79 4.31 4.16
2016 4.47 4.14 3.56 3.75 3.57 3.79 4.11 3.80 4.34 3.63 3.66 3.81 3.87
continued
Chief Performance Officer 33 Vital Signs Report—2016 Annual Report
Page 52 of 54
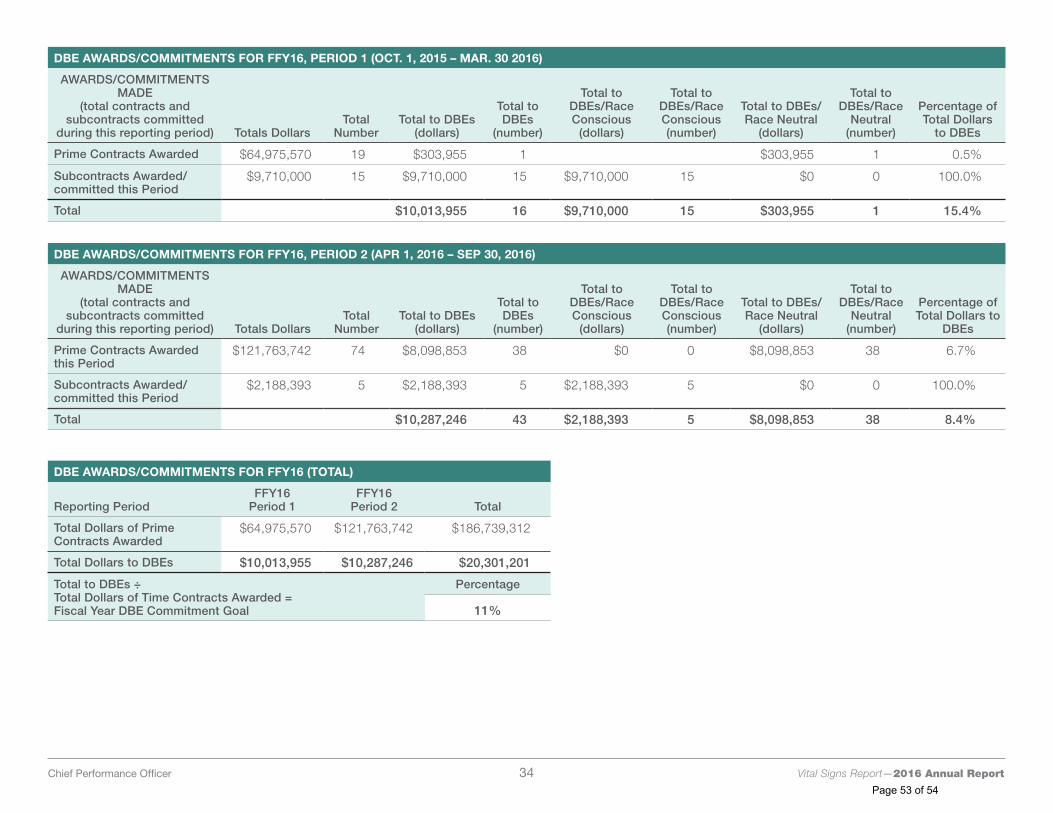
DBE AWARDS/COMMITMENTS FOR FFY16, PERIOD 1 (OCT. 1, 2015 – MAR. 30 2016)
AWARDS/COMMITMENTS MADE
(total contracts and subcontracts committed
during this reporting period) Totals DollarsTotal
NumberTotal to DBEs
(dollars)
Total to DBEs
(number)
Total to DBEs/Race Conscious
(dollars)
Total to DBEs/Race Conscious (number)
Total to DBEs/Race Neutral
(dollars)
Total to DBEs/Race
Neutral (number)
Percentage of Total Dollars
to DBEs
Prime Contracts Awarded $64,975,570 19 $303,955 1 $303,955 1 0.5%
Subcontracts Awarded/committed this Period
$9,710,000 15 $9,710,000 15 $9,710,000 15 $0 0 100.0%
Total $10,013,955 16 $9,710,000 15 $303,955 1 15.4%
DBE AWARDS/COMMITMENTS FOR FFY16, PERIOD 2 (APR 1, 2016 – SEP 30, 2016)
AWARDS/COMMITMENTS MADE
(total contracts and subcontracts committed
during this reporting period) Totals DollarsTotal
NumberTotal to DBEs
(dollars)
Total to DBEs
(number)
Total to DBEs/Race Conscious
(dollars)
Total to DBEs/Race Conscious (number)
Total to DBEs/Race Neutral
(dollars)
Total to DBEs/Race
Neutral (number)
Percentage of Total Dollars to
DBEs
Prime Contracts Awarded this Period
$121,763,742 74 $8,098,853 38 $0 0 $8,098,853 38 6.7%
Subcontracts Awarded/committed this Period
$2,188,393 5 $2,188,393 5 $2,188,393 5 $0 0 100.0%
Total $10,287,246 43 $2,188,393 5 $8,098,853 38 8.4%
DBE AWARDS/COMMITMENTS FOR FFY16 (TOTAL)
Reporting PeriodFFY16
Period 1FFY16
Period 2 Total
Total Dollars of Prime Contracts Awarded
$64,975,570 $121,763,742 $186,739,312
Total Dollars to DBEs $10,013,955 $10,287,246 $20,301,201
Total to DBEs ÷ Total Dollars of Time Contracts Awarded = Fiscal Year DBE Commitment Goal
Percentage
11%
Chief Performance Officer 34 Vital Signs Report—2016 Annual Report
Page 53 of 54