Embed Size (px)
Citation preview
Are you making a profit?
Understand and utilize an income statement:
Understand the purpose of an income statement
Be familiar with income statement terminology and structure
Be familiar with cost and accrual methods of determining Net Farm Income
Understand the relationship with the balance sheet
Be able to use the income statement for strategic purposes
Objectives
Use the income statement to determine the profit or loss during an
accounting period.
Tells you the financial position of the business over a period of time (generally your fiscal year).
Return to Assets and Equity
Return to Labor and Management
Operating Profit Margin
Income Statement
Profit = Revenue – Expenses
Definitions:
Revenue – Income earned during the accounting period
Commodity Sales, Inventories, Accounts Receivable
Expenses – Cash or noncash expenses during the accounting period
Input Expenses, Depreciation, Accounts Payable, Accrued Interest & Expenses
Income Statement Fundamentals
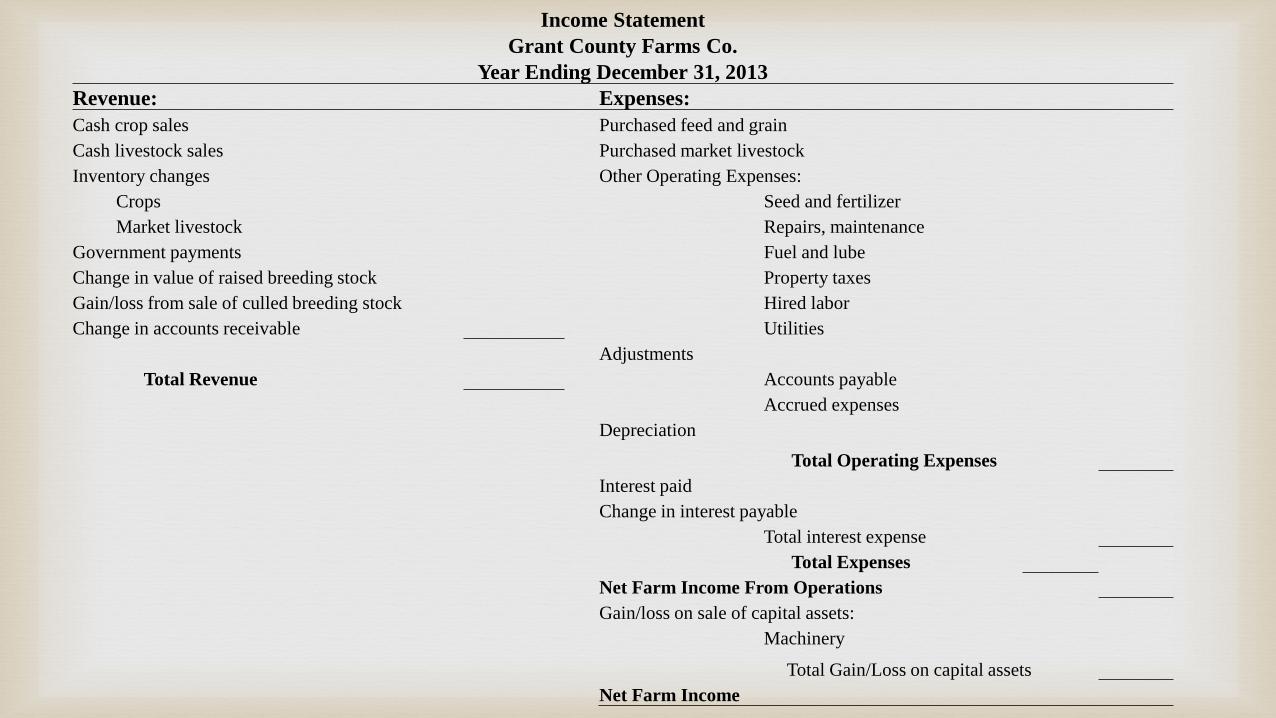
Income Statement
Grant County Farms Co.
Year Ending December 31, 2013
Revenue: Expenses:
Cash crop sales Purchased feed and grain
Cash livestock sales Purchased market livestock
Inventory changes Other Operating Expenses:
Crops Seed and fertilizer
Market livestock Repairs, maintenance
Government payments Fuel and lube
Change in value of raised breeding stock Property taxes
Gain/loss from sale of culled breeding stock Hired labor
Change in accounts receivable Utilities
Adjustments
Total Revenue Accounts payable
Accrued expenses
Depreciation
Total Operating Expenses
Interest paid
Change in interest payable
Total interest expense
Total Expenses
Net Farm Income From Operations
Gain/loss on sale of capital assets:
Machinery
Total Gain/Loss on capital assets
Net Farm Income
Accrual-Adjusted Net Farm Income
The Farm Financial Standards Committee recommends that anyone using cash accounting convert net farm income to accrual-adjusted net farm income.
More accurate
Better for management purposes
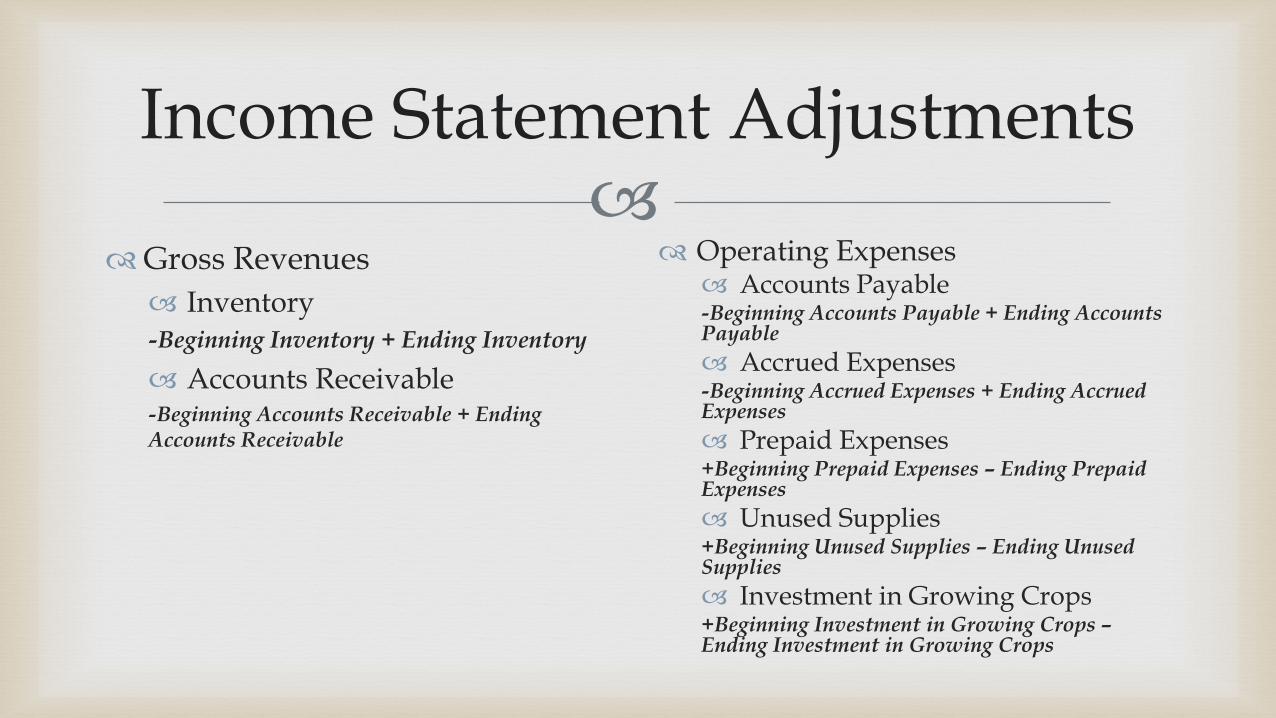
Income Statement Adjustments
Gross Revenues
Inventory-Beginning Inventory + Ending Inventory
Accounts Receivable-Beginning Accounts Receivable + Ending Accounts Receivable
Operating Expenses Accounts Payable-Beginning Accounts Payable + Ending Accounts Payable
Accrued Expenses-Beginning Accrued Expenses + Ending Accrued Expenses
Prepaid Expenses+Beginning Prepaid Expenses – Ending Prepaid Expenses
Unused Supplies+Beginning Unused Supplies – Ending Unused Supplies
Investment in Growing Crops+Beginning Investment in Growing Crops –Ending Investment in Growing Crops
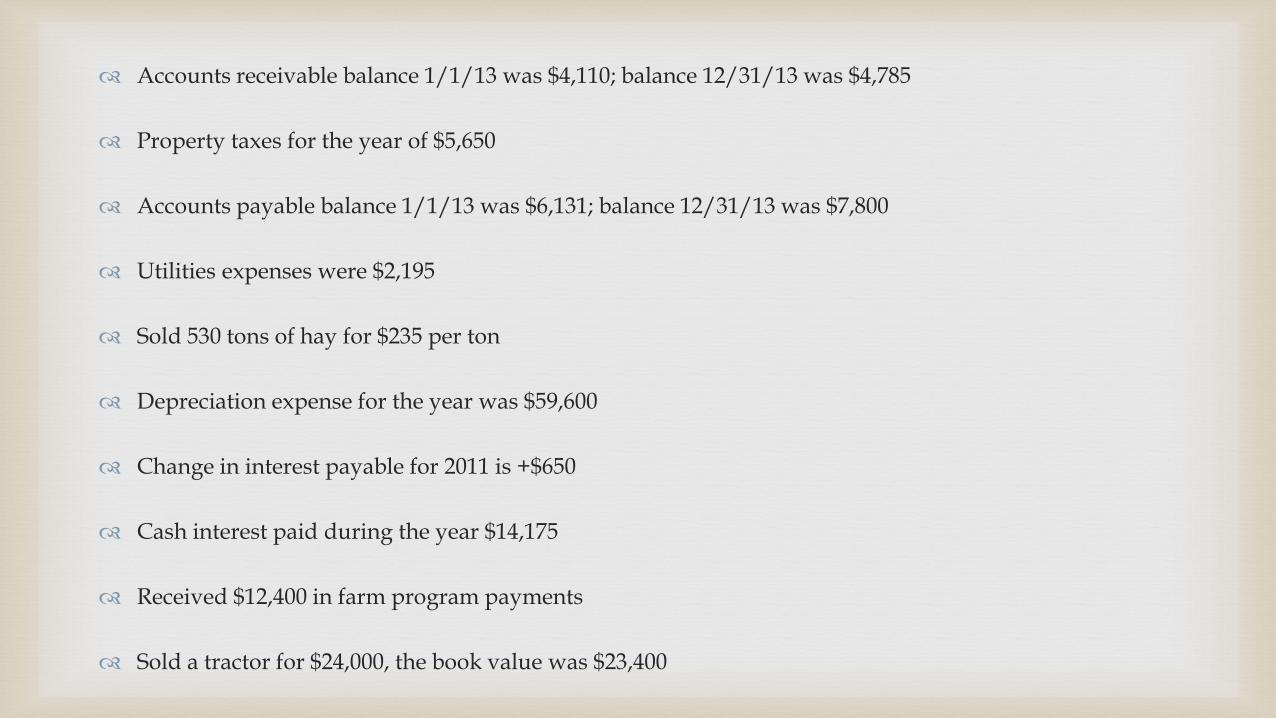
Accounts receivable balance 1/1/13 was $4,110; balance 12/31/13 was $4,785
Property taxes for the year of $5,650
Accounts payable balance 1/1/13 was $6,131; balance 12/31/13 was $7,800
Utilities expenses were $2,195
Sold 530 tons of hay for $235 per ton
Depreciation expense for the year was $59,600
Change in interest payable for 2011 is +$650
Cash interest paid during the year $14,175
Received $12,400 in farm program payments
Sold a tractor for $24,000, the book value was $23,400
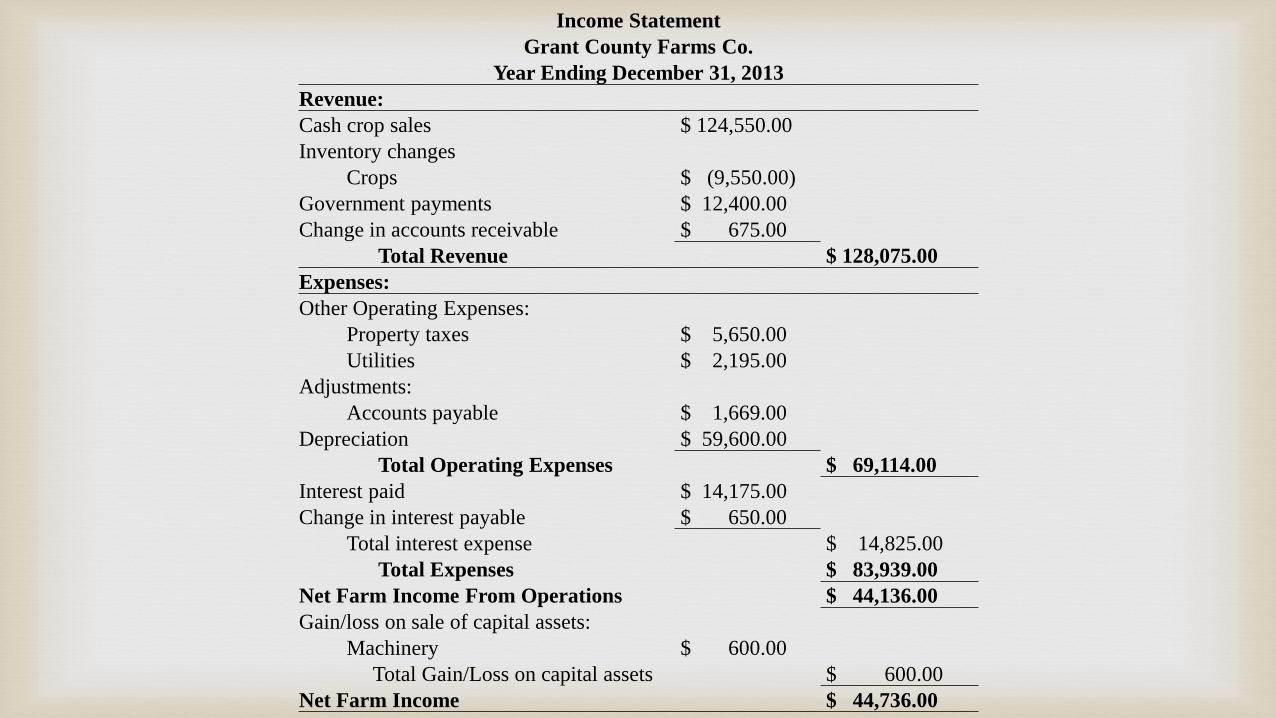
Income Statement
Grant County Farms Co.
Year Ending December 31, 2013
Revenue:
Cash crop sales $ 124,550.00
Inventory changes
Crops $ (9,550.00)
Government payments $ 12,400.00
Change in accounts receivable $ 675.00
Total Revenue $ 128,075.00
Expenses:
Other Operating Expenses:
Property taxes $ 5,650.00
Utilities $ 2,195.00
Adjustments:
Accounts payable $ 1,669.00
Depreciation $ 59,600.00
Total Operating Expenses $ 69,114.00
Interest paid $ 14,175.00
Change in interest payable $ 650.00
Total interest expense $ 14,825.00
Total Expenses $ 83,939.00
Net Farm Income From Operations $ 44,136.00
Gain/loss on sale of capital assets:
Machinery $ 600.00
Total Gain/Loss on capital assets $ 600.00
Net Farm Income $ 44,736.00
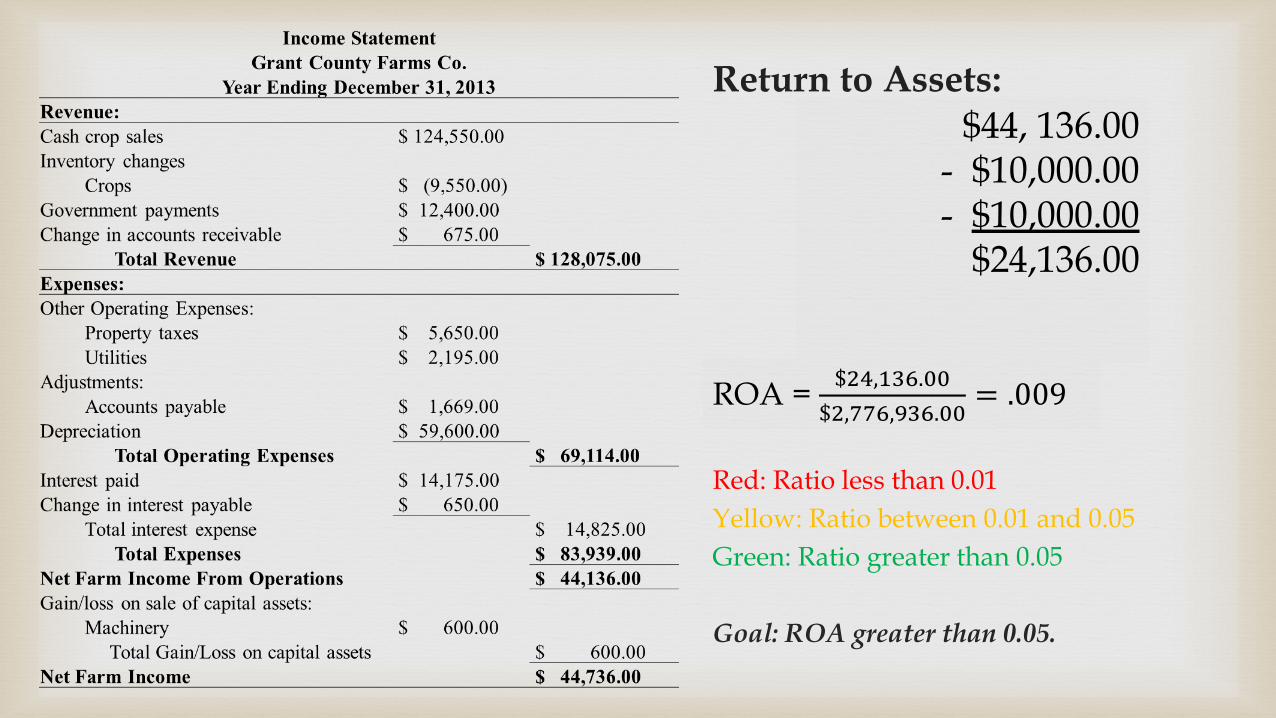
Return to Assets:Adjusted Net Farm Income from OperationsLess Opportunity Cost of
Unpaid LaborLess Opportunity Cost of
ManagementEquals Return to Assets
ROA = 𝑅𝑒𝑡𝑢𝑟𝑛 𝑡𝑜 𝐴𝑠𝑠𝑒𝑡𝑠
𝐴𝑣𝑒𝑟𝑎𝑔𝑒 𝑇𝑜𝑡𝑎𝑙 𝐴𝑠𝑠𝑒𝑡𝑠
Red: Ratio less than 0.01
Yellow: Ratio between 0.01 and 0.05
Green: Ratio greater than 0.05
Goal: ROA greater than 0.05.
$44, 136.00- $10,000.00- $10,000.00
$24,136.00
ROA = $24,136.00
$2,776,936.00= .009
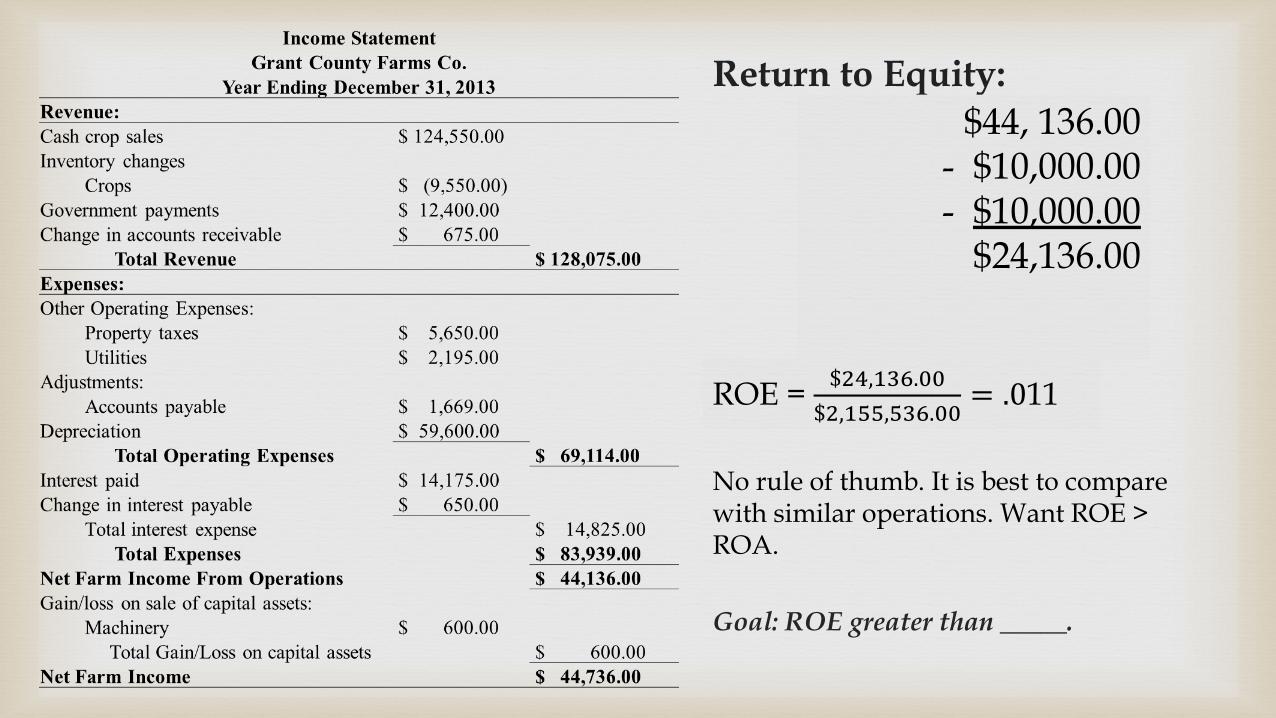
Return to Equity:Adjusted Net Farm Income from OperationsLess Opportunity Cost of
Unpaid LaborLess Opportunity Cost of
ManagementEquals Return to Equity
ROE = 𝑅𝑒𝑡𝑢𝑟𝑛 𝑡𝑜 𝐸𝑞𝑢𝑖𝑡𝑦
𝐴𝑣𝑒𝑟𝑎𝑔𝑒 𝑂𝑤𝑛𝑒𝑟 𝐸𝑞𝑢𝑖𝑡𝑦
No rule of thumb. It is best to compare with similar operations. Want ROE > ROA.
Goal: ROE greater than _____.
$44, 136.00- $10,000.00- $10,000.00
$24,136.00
ROE = $24,136.00
$2,155,536.00= .011
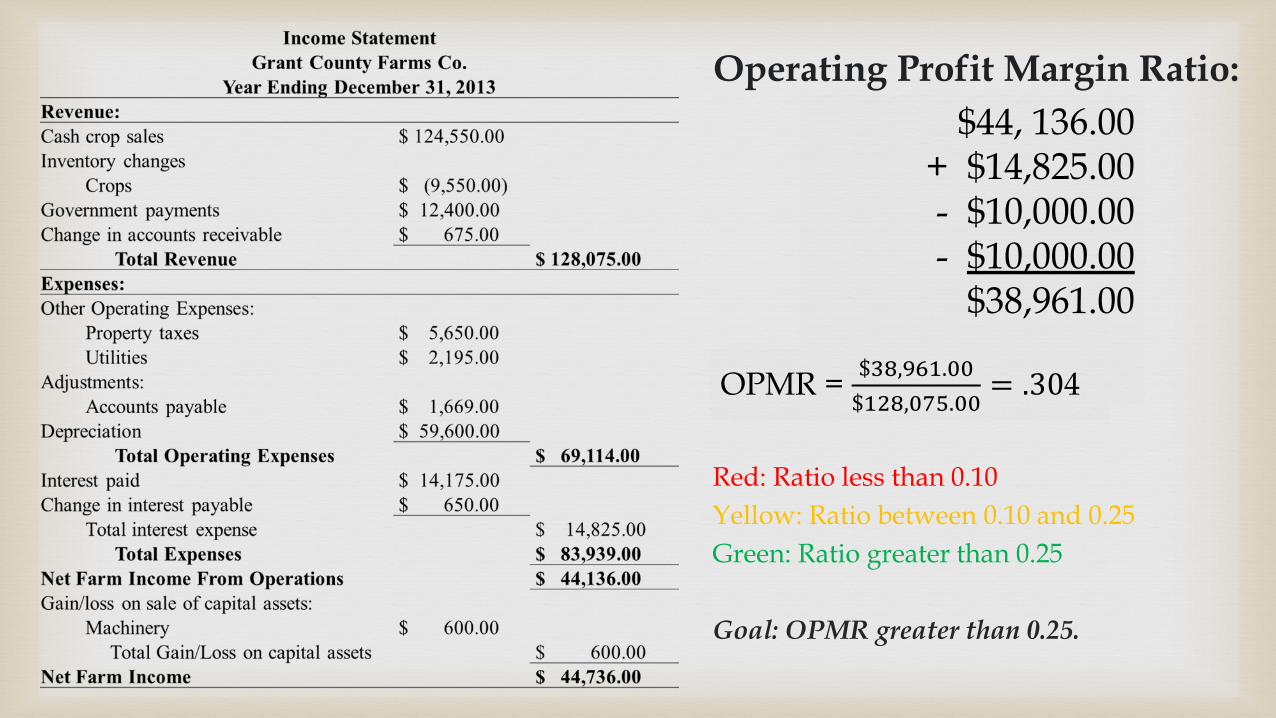
Operating Profit Margin Ratio:Adjusted Net Farm Income from OperationsPlus Interest ExpenseLess Opportunity Cost of Unpaid LaborLess Opportunity Cost of ManagementEquals Operating Profit
OPMR = 𝑂𝑝𝑒𝑟𝑎𝑡𝑖𝑛𝑔 𝑃𝑟𝑜𝑓𝑖𝑡
𝑇𝑜𝑡𝑎𝑙 𝑅𝑒𝑣𝑒𝑛𝑢𝑒
Red: Ratio less than 0.10
Yellow: Ratio between 0.10 and 0.25
Green: Ratio greater than 0.25
Goal: OPMR greater than 0.25.
$44, 136.00+ $14,825.00- $10,000.00- $10,000.00
$38,961.00
OPMR = $38,961.00
$128,075.00= .304
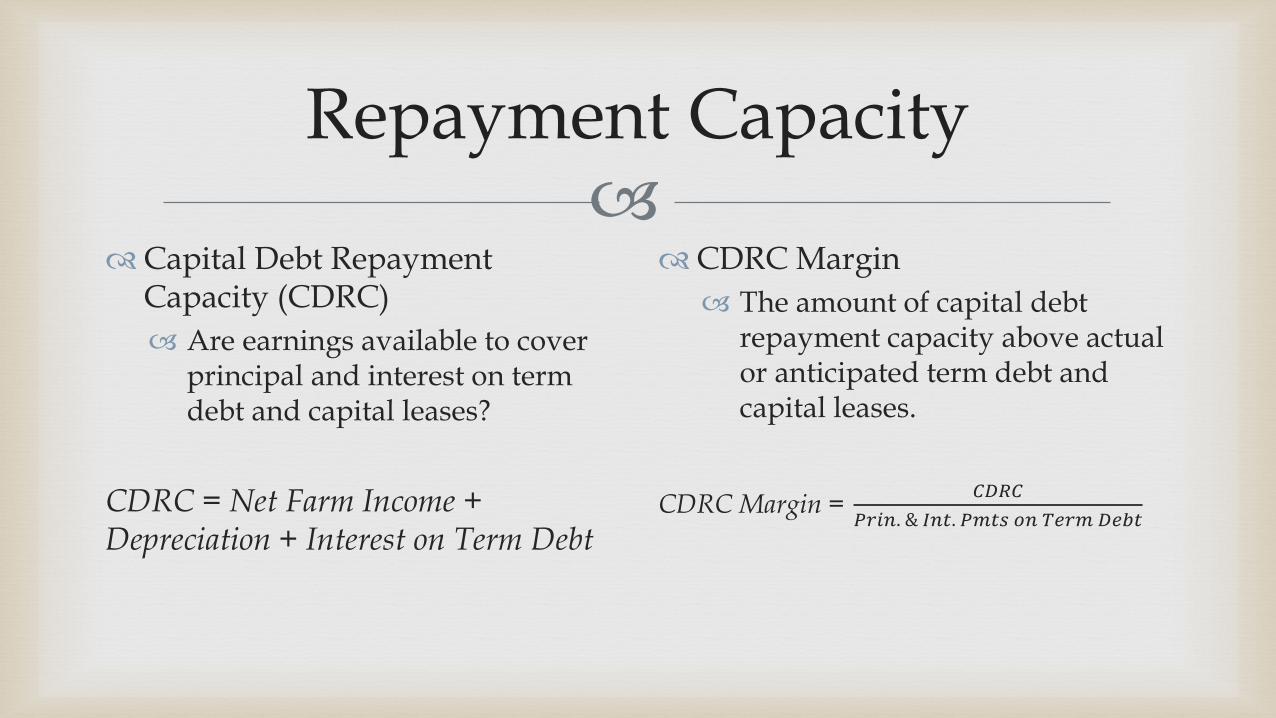
Repayment Capacity
Capital Debt Repayment Capacity (CDRC)
Are earnings available to cover principal and interest on term debt and capital leases?
CDRC = Net Farm Income + Depreciation + Interest on Term Debt
CDRC Margin
The amount of capital debt repayment capacity above actual or anticipated term debt and capital leases.
CDRC Margin =𝐶𝐷𝑅𝐶
𝑃𝑟𝑖𝑛. & 𝐼𝑛𝑡. 𝑃𝑚𝑡𝑠 𝑜𝑛 𝑇𝑒𝑟𝑚 𝐷𝑒𝑏𝑡
Case Studies
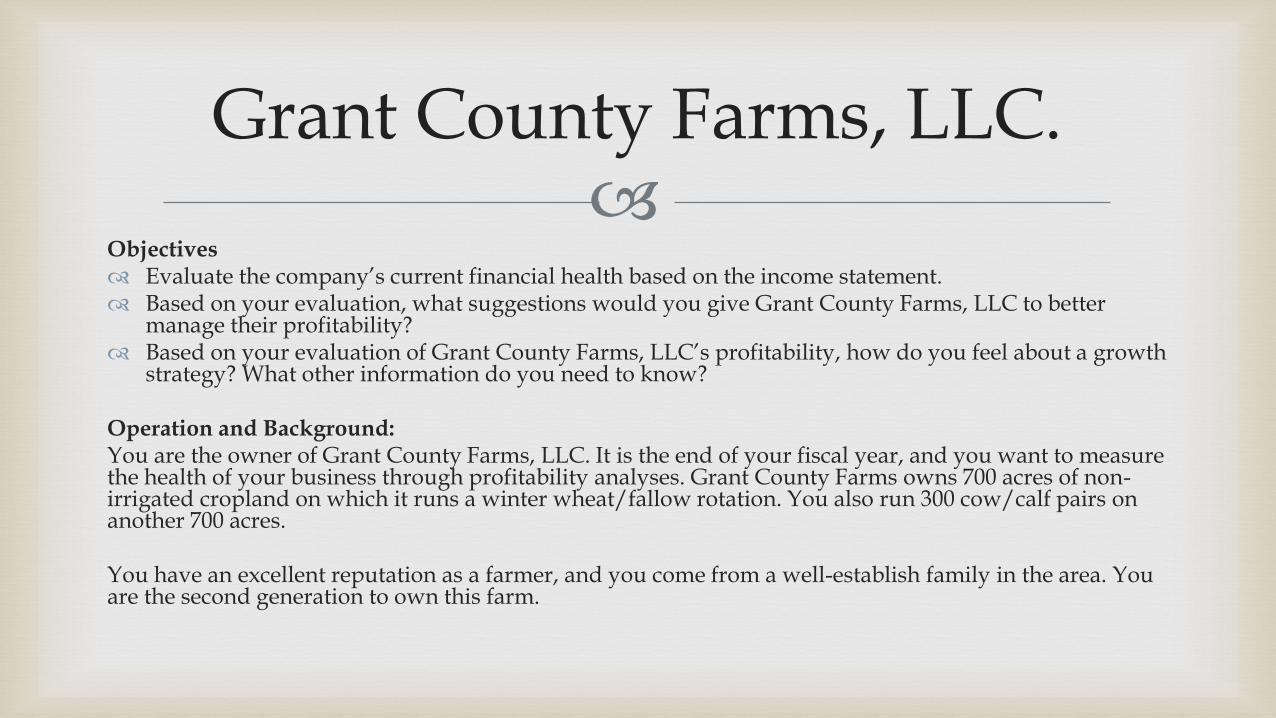
Grant County Farms, LLC.
Objectives Evaluate the company’s current financial health based on the income statement. Based on your evaluation, what suggestions would you give Grant County Farms, LLC to better
manage their profitability? Based on your evaluation of Grant County Farms, LLC’s profitability, how do you feel about a growth
strategy? What other information do you need to know?
Operation and Background:You are the owner of Grant County Farms, LLC. It is the end of your fiscal year, and you want to measure the health of your business through profitability analyses. Grant County Farms owns 700 acres of non-irrigated cropland on which it runs a winter wheat/fallow rotation. You also run 300 cow/calf pairs on another 700 acres.
You have an excellent reputation as a farmer, and you come from a well-establish family in the area. You are the second generation to own this farm.
Profit to Equity
The relationship between your balance sheet and income statement
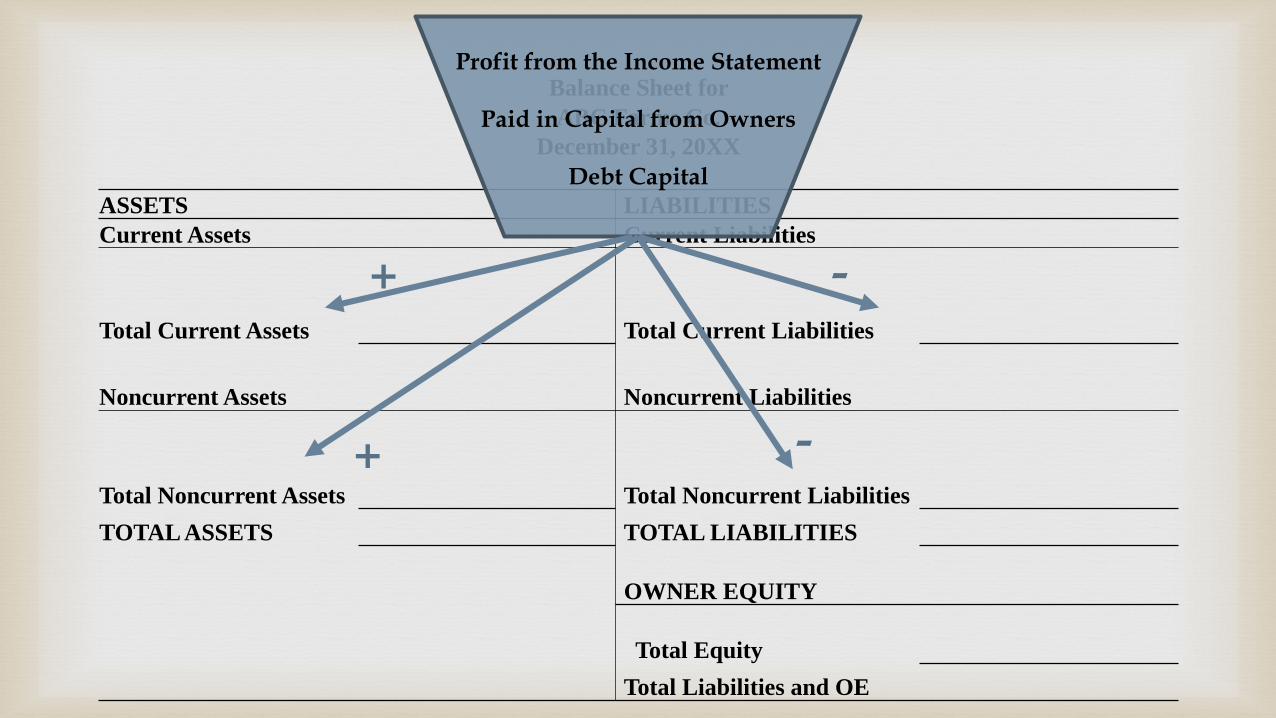
Balance Sheet for
ABC Farms Co.
December 31, 20XX
ASSETS LIABILITIES
Current Assets Current Liabilities
Total Current Assets Total Current Liabilities
Noncurrent Assets Noncurrent Liabilities
Total Noncurrent Assets Total Noncurrent Liabilities
TOTAL ASSETS TOTAL LIABILITIES
OWNER EQUITY
Total Equity
Total Liabilities and OE
Profit from the Income Statement
Paid in Capital from Owners
Debt Capital
+
+ -
-
Managing Your Balance Sheet
Profit comes into the business:
Fund growth
Replace fixed assets
Leverage/deleverage
Increase liquidity
Distribute to owners
Increase risk bearing ability through equity distribution
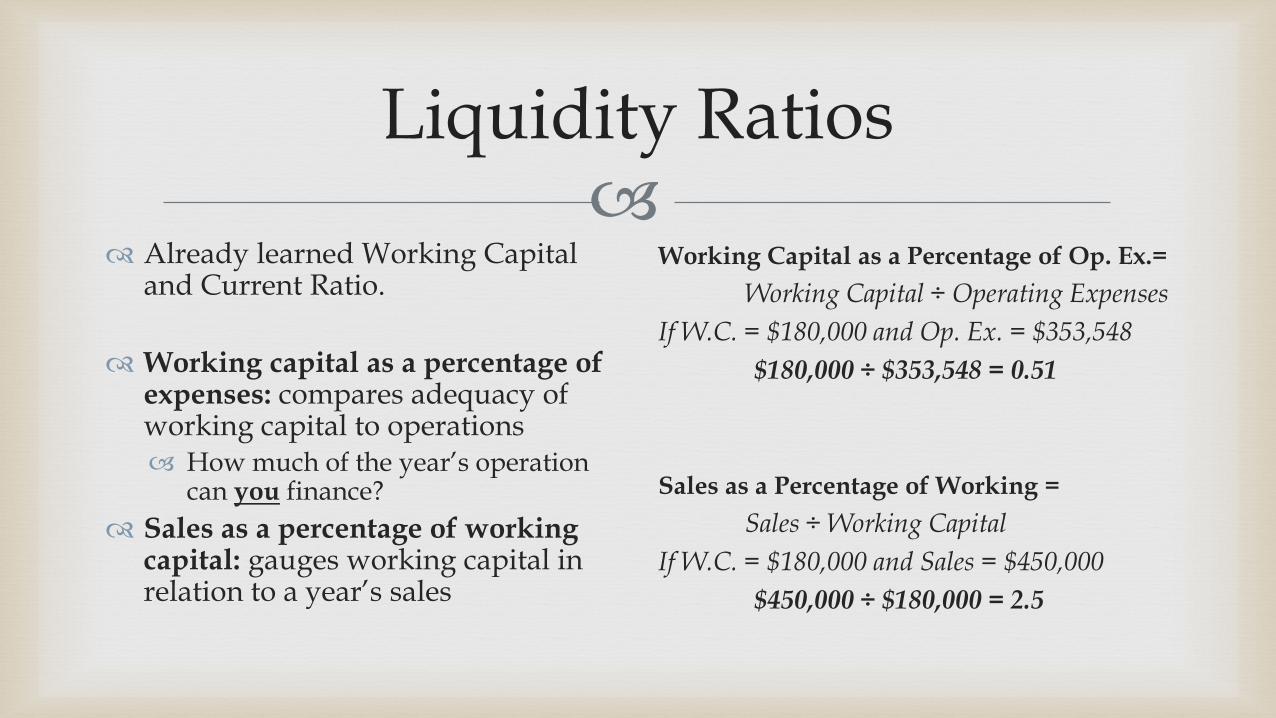
Liquidity Ratios
Already learned Working Capital and Current Ratio.
Working capital as a percentage of expenses: compares adequacy of working capital to operations How much of the year’s operation
can you finance?
Sales as a percentage of working capital: gauges working capital in relation to a year’s sales
Working Capital as a Percentage of Op. Ex.=
Working Capital ÷ Operating Expenses
If W.C. = $180,000 and Op. Ex. = $353,548
$180,000 ÷ $353,548 = 0.51
Sales as a Percentage of Working =
Sales ÷ Working Capital
If W.C. = $180,000 and Sales = $450,000
$450,000 ÷ $180,000 = 2.5
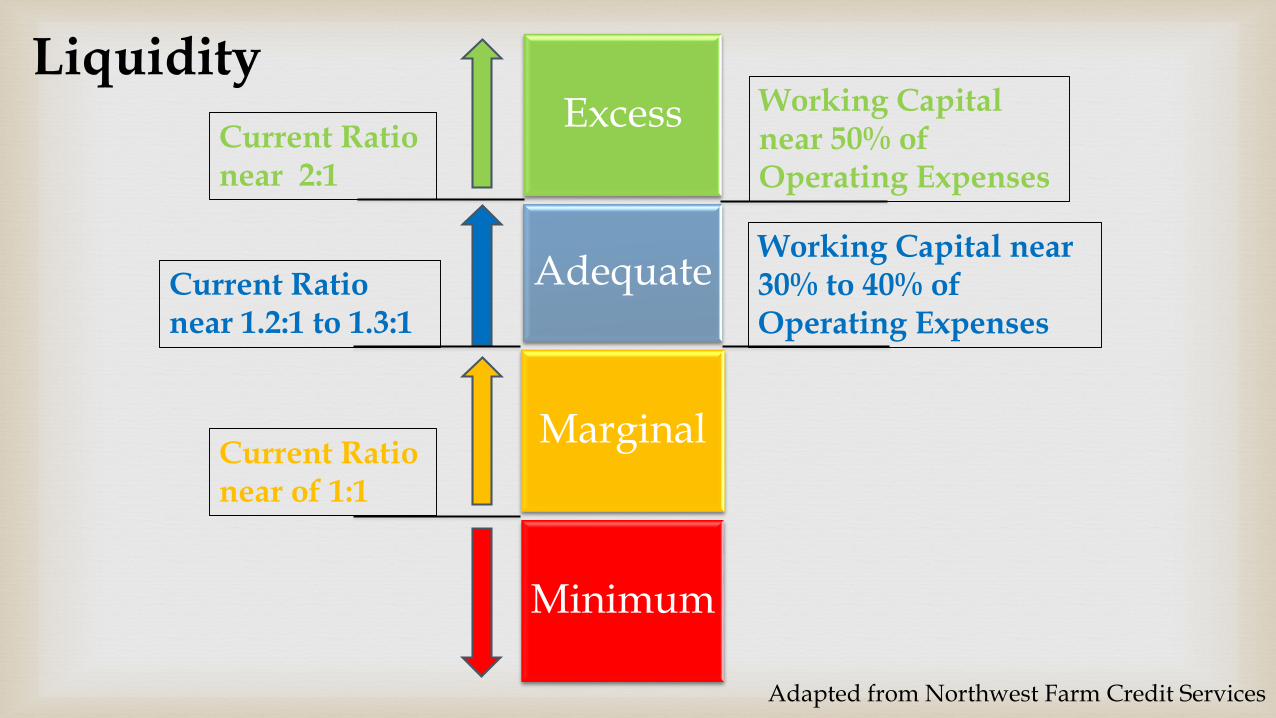
Excess
Adequate
Marginal
Minimum
Current Ratio near 2:1
Current Ratio near 1.2:1 to 1.3:1
Current Ratio near of 1:1
Working Capital near 30% to 40% of Operating Expenses
Working Capital near 50% of Operating Expenses
Liquidity
Adapted from Northwest Farm Credit Services
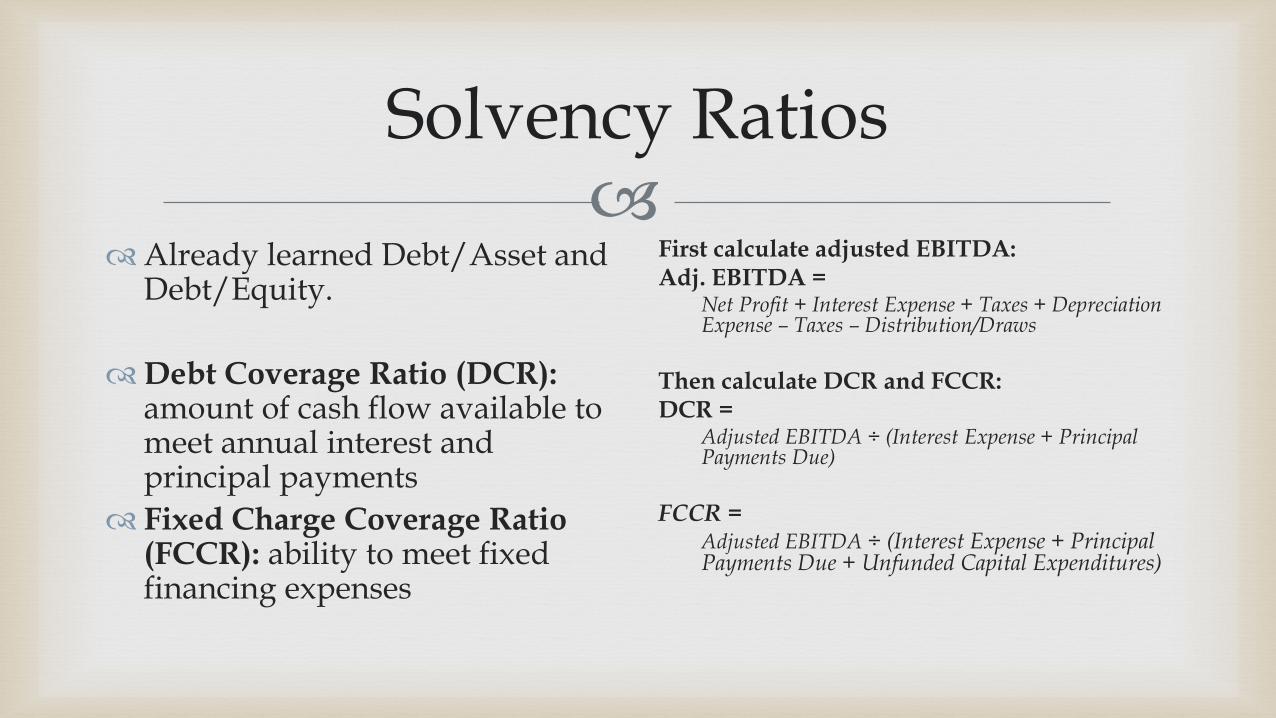
Solvency Ratios
Already learned Debt/Asset and Debt/Equity.
Debt Coverage Ratio (DCR):amount of cash flow available to meet annual interest and principal payments
Fixed Charge Coverage Ratio (FCCR): ability to meet fixed financing expenses
First calculate adjusted EBITDA:Adj. EBITDA =
Net Profit + Interest Expense + Taxes + Depreciation Expense – Taxes – Distribution/Draws
Then calculate DCR and FCCR:DCR =
Adjusted EBITDA ÷ (Interest Expense + Principal Payments Due)
FCCR = Adjusted EBITDA ÷ (Interest Expense + Principal Payments Due + Unfunded Capital Expenditures)
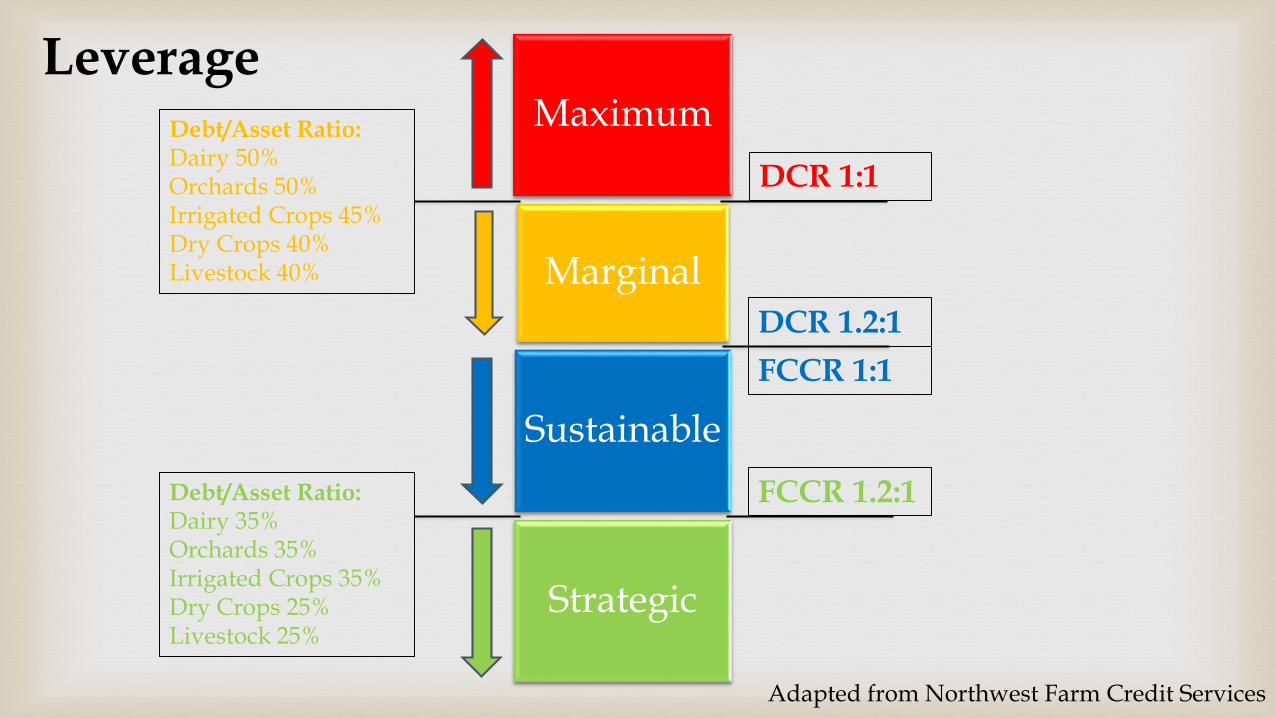
Maximum
Marginal
Sustainable
Strategic
Debt/Asset Ratio:Dairy 50%Orchards 50%Irrigated Crops 45%Dry Crops 40%Livestock 40%
Debt/Asset Ratio:Dairy 35%Orchards 35%Irrigated Crops 35%Dry Crops 25%Livestock 25%
DCR 1.2:1
DCR 1:1
Leverage
Adapted from Northwest Farm Credit Services
FCCR 1:1
FCCR 1.2:1
Guidelines for Using Ratios
Compare, compare, compare…
Industry
Historical information
Business lifecycle
Consider the whole picture.

Case Studies
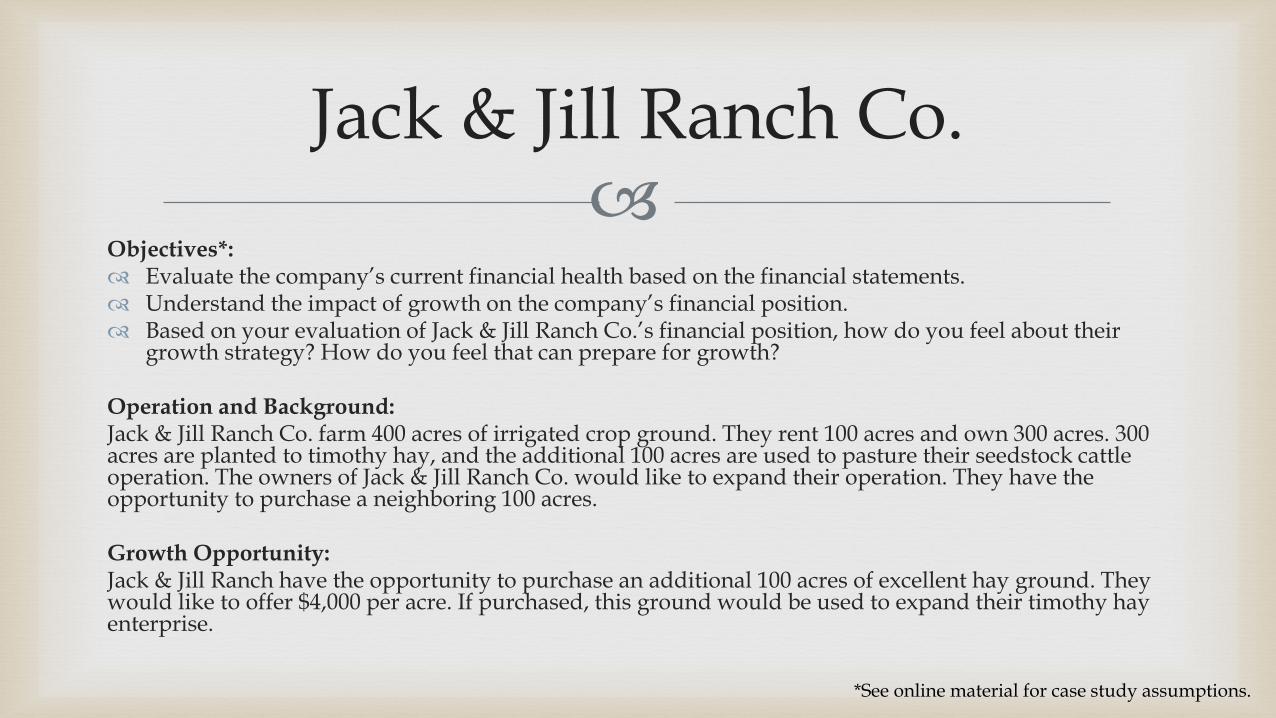
Jack & Jill Ranch Co.
Objectives*: Evaluate the company’s current financial health based on the financial statements. Understand the impact of growth on the company’s financial position. Based on your evaluation of Jack & Jill Ranch Co.’s financial position, how do you feel about their
growth strategy? How do you feel that can prepare for growth?
Operation and Background:Jack & Jill Ranch Co. farm 400 acres of irrigated crop ground. They rent 100 acres and own 300 acres. 300 acres are planted to timothy hay, and the additional 100 acres are used to pasture their seedstock cattle operation. The owners of Jack & Jill Ranch Co. would like to expand their operation. They have the opportunity to purchase a neighboring 100 acres.
Growth Opportunity:Jack & Jill Ranch have the opportunity to purchase an additional 100 acres of excellent hay ground. They would like to offer $4,000 per acre. If purchased, this ground would be used to expand their timothy hay enterprise.
*See online material for case study assumptions.
Homework
Complete an income statement for your farm.
Calculate your ROA and ROE.
Set targets for ROA, ROE, and OPMR.
Take a minute to write down one or two ideas or takeaways from this
lesson.
One Minute Takeaway
Sieverkropp Consulting LLC.
Contact: Elizabeth Sieverkropp
(509) 398-6858
Website:
www.sieverkroppconsulting.com
Training Program Homepage:www.sieverkroppconsulting.com/fsa-borrower-training-program-homepage