Embed Size (px)
Citation preview

Are We Achieving Spatial Transformation In South Africa?
Can Sub-City Spatial Indicators Make a Contribution?
Author(s):
Johan Maritz
Elsona Van Huyssteen
Alize Le Roux
Amy Pieterse
Dumisani Ndaba
Gerbrand Mans
Mawande Ngidi
Designation & Affiliation(s):
Senior Researcher – Town and Regional Planner
Council for Scientific and Industrial Research
PO Bax 359, Pretoria, 0001, South Africa
Tel: +27 – 012 841 2928 / Fax: +27 – 012 841 4036
Abstract:
With the advent of a democratic order in South Africa in 1994 a number of policy frameworks
have seen the light. All of these have indicated the need to spatially transform cities and
settlements – to break from the pre-1994 apartheid city. Over time these frameworks change,
new ones are developed which often state the same objectives. A major focus has also been
placed on tracking their impact through spatial outcomes as set out in the Spatial Planning and
Land Use Managemnet Act (SPLUMA), Act 16 of 2013 (Republic of South Africa, 2013) and
also internationally through the recently introduced UN Sustainable Development Goals (SDGs)
(United Nations Sustainable Development, 2016). A key question that remains is whether cities
are succeeding in reinventing and restructuring the past. Vital in exploring progress regarding
spatial transformation is investigating how the landscape within cities has changed spatially. To
assess the progress made by South African cities in the last 20 years, the CSIR has embarked on
developing a number of standardised repeatable sub-city level spatial indicators and/or indices to
illustrate specific components of spatial change or transformation. This paper provides an
overview of some of the innovations in spatially and temporally aligned sub-city indicator
development within a data-scarce context. It also reflects on lessons learned, in the process
providing some examples of spatial transformation analyses for a number of cities using the
indicators developed. These Indicators have been developed partly in collaboration with the
South African Cities Network (SACN) to support the 2016 State of Cities Report’s (SACN,
2016) theme on spatial transformation.
Keywords:
Apartheid city, spatial transformation, spatial justice, spatial indicators, sub-city, indicators.
1. Introduction
Given South Africa’s Apartheid past and the impact of planned segregation on South African
cities (illustrated diagrammatically in Figure 1), the need to address socio-economic inequalities,
racially divided cities and the transformation of cities to provide equal opportunities and
sustainable means of living for all citizens has been on the political and planning agenda since
1994 (See Oranje, 2000; Oranje, 2011; Turok, 2015; National Planning Commission, 2012 and
UNDP, 2014). Apartheid city design, especially the fact that many township areas are placed on
the periphery of cities, results in inefficiencies and unequal access to economic and service
opportunities (Du Plessis, 2013:70).
Figure 1: The Apartheid city diagrammatically illustrated (Cole & De Blij, 2007)
Presently, South Africa like many other African countries is experiencing rapid urbanisation. The
United Nations estimates that in 2030, 71 per cent of South Africa’s population will be living in
urban areas, reaching nearly 80 per cent by 2050 (COGTA, 2014:12). This places more emphasis
on the need for cities to be liveable, inclusive, sustainable and resilient places. Cities have to
track this growth in order to adequately respond to and guide (infrastructure) investment
decisions. In the past, cities would develop this data for their own use, however, this makes
comparison between cities difficult, if not impossible. Developing consistent comparable data
allows cities to learn from the experience of other cities and efficiently use their resources to
build sustainable cities.
Given the realities of urbanisation and development pressures experienced by South African
cities, there is the continued need to improve efficiency, entice growth and investment, whilst
spatially transforming cities. Since the creation of the new democratic order, the extent to which
cities have been successful in their spatial transformation has been a priority for local and
national government. Even though a number of urban growth and development policies and
strategies have been formulated since 1994, all stating the need to address transformation, the
view is that South African cities “remain[s] amongst the most inefficient urban environments in

the world” (Du Plessis & Landman, 2002:55).
A major emphasis has inter alia, been placed on creating socially-just cities and towns through
the implementation of spatial justice as part of the highly cited set of spatial outcomes as set out
in SPLUMA (Republic of South Africa, 2013). Within this context two key questions are being
asked: Firstly, how can spatial planning, land use management and government investment
support cities in making progress in restructuring the apartheid space economy, creating a more
equitable and sustainable future? Secondly, as raised by Turok (2015), how can place-specific
progress and challenges related to the highly complex goals of integration, transformation and
densification be explored? Exploring and tracking place-specific progress and spatial
transformation is, however, a major challenge, not only in South Africa but in many other fast
growing cities in the world and especially in the Global South (Amindarbari & Sevtsuk, 2013:4).
Challenges to adequately measure (detect) changes and explore implications thereof include not
only identifying and developing relevant spatial-specific indicators, but also issues related to data
availability, exploration, temporal and place-based comparisons, resources and the capacity to
track change (Bickford, 2014).
It is in relation to this second set of challenges that this paper aims to make a contribution.
Spatially-specific indicators are critical, not only i) in investigating how the landscape has
changed and how much progress has been made with spatial transformation in South African
cities during the last 20 years, but also, ii) to contribute towards driving and monitoring just and
sustainable spatial outcomes in cities moving forward. As set out by Harrison and Todes
(2015:160), the South African experience of spatial change and efforts at tracking and ‘directing’
spatial transformation is something that is not incomparable to that of other countries, such as
China, Russia and Canada. The challenge to create relevant and trackable spatial-specific and
localised indicators is not only a South African challenge, but has also been prevalent (especially
in developing country context) within the discourses about the recently introduced set of
Sustainable Development Goals (Osborn, Cutter, & Ullah, 2015).
This paper showcases the results and methodologies used in developing a number of explorative,
standardised and replicable sub-city level spatial indicators which were developed to track spatial
change and progress with transformation at sub-city scale over the last 20 years in South African
cities. The paper is structured firstly, in the Background section (Section 2), to examine: (i) the
need to track and evaluate spatial change and spatial transformation in cities in developing
countries, with specific reference to South Africa; and, (ii) the challenges and key principles
associated with the development of appropriate spatial-specific indicators (development, data,
etc.) to track spatial change. The second part of the paper provides an overview of the endeavour
to develop appropriate, simple and practical spatial indicators to track spatial change and
contribute towards the discourse of spatial transformation in 9 cities in South Africa. Specific
emphasis is placed on the sub-city indicators selected and developed to identify major spatial
patterns and changes with regards to concentrations of population and formal economic activity.
The methodology adopted, as well as innovations and challenges within the process and results, is
highlighted. In the last part of the paper the authors reflect on some of the most prominent
contributions and lessons emanating from this endeavour. The paper aims to contribute to the
ongoing drive towards more just and sustainable spatial outcomes and tracking of spatial change
and transformation in South African cities. It also strives to highlight aspects that might also be of
relevance to other developing countries.

2. Background
2.1 Tracking spatial transformation as an international priority
The term ‘spatial transformation’ is often used to refer to far-reaching urban change or urban
restructuring. It is also a descriptive term to encapsulate the idea that cities have changed greatly
over time due to urbanization (See Turok, 2014; Gülersoy & Gurler, 2011; Harrison & Todes,
2015). Urban spatial structures reflect socio-economic and institutional conditions and embedded
histories, with transformation (as defined above) occurring through the adaptation of spatial form
to new conditions and developments. At the same time urban spaces across the world are
transforming in the midst of political, social and economic change and are also required to adapt
to become more just, sustainable, efficient and viable spaces as set out by Edward Soja in his
2009 presentation on “The city and spatial justice”, the notion of spatial justice brings with it the
“intentional and focussed emphasis on the spatial or geographical aspects of justice and in-justice”
(Soja, 2009). In order to improve and track spatial transformation initiatives, a renewed focus on
evidence-based spatial policies and the development of indicators and monitoring systems is
needed (Daly and González, 2013:84).
As part of a drive to promote spatial justice and a more cohesive and balanced territory the
concept of ‘territorial cohesion’ has been identified as a core objective within the Europe 2020
Strategy together with economic and social cohesion. Territorial cohesion can be understood as a
broad process of reducing socio-economic spatial imbalances, promoting environmental
sustainability, improving governance processes and establishing a more balanced and polycentric
urban system (Medeiros c.f. Daly and Gonzalez, 2013:78). As part of the EU cohesion policy
country-specific targets, priorities and policy objectives were identified to monitor the
effectiveness of policy interventions.
2.2 Spatial Transformation within the South African planning context
Within the South African context, Oranje (2014) indicates that spatial transformation relates
mostly to those efforts aimed at addressing the physical manifestations of Apartheid planning.
Since 1994 there have been several policy instruments, Acts and Programmes that aimed to set a
planning direction (implied spatial transformation) including the Reconstruction and Development
Programme (RDP), Development Facilitation Act, Act 67 of 1995 (Republic of South Africa,
1995) and associated Land Development Objectives, followed by the Local Government:
Municipal Systems Act, Act 32 of 2000 (Republic of South Africa, 2000) providing for integrated
municipal-led integrated planning and spatial development (Oranje, 2007 and Oranje, 2014).
Recently this effort has found expression in the National Development Plan (National Planning
Commission, 2012) with specific focus on ‘transforming human settlements’ and in spatial
principles and spatial outcomes as set out the Spatial Planning and Land Use Management Act
(Republic of South Africa, 2013).
Within the National Development Plan (NDP), spatial transformation includes the focus on spatial
justice, sustainability, and resilience, as well as spatial equality and efficiency, i.e. productive
places with efficient circulation of people, goods and other resources.
According to Turok (2014) spatial transformation includes several dimensions, namely:
Social integration and racial mixing – referring to a greater inclusion of different racial groups
thus overcoming the segregated nature of SA cities (still apparent), thus also the tern racial-

inclusion.
City structure – referring to the overall structure of the city/metropolitan area as well as to the
texture of the urban fabric. Both of these have a bearing on the cities’ functional efficiency,
economic productivity, the life-chances of its inhabitants, and its impact on the environment.
Local texture – referring to a range of finer scale qualitative built environment features that
affect the lived experience of households and businesses. This also relates to the design of the
city and if it is functional, supportive and appealing (to households and those that can invest
in its business opportunities).
Spatial transformation requires a ‘programmatic, plan-oriented, project-directed effort to change
the unequal access to and occupation/ownership of socio-politically differentiated space in South
Africa – a multi-dimensional, open-ended, fluid process of change, organically linked to the past,
present and future’ (Williams, 2000:180). It requires not only a development agenda that moves
beyond project implementation and service delivery (Oranje, 2011) but also pragmatic support to
analyse, track and improve progress in support of this long-term agenda to fundamentally
reconfiguring inequality in society and space.
2.3 Challenges in developing indicators to track spatial change in South Africa
In 2014, a ‘Spatial Transformation of Cities’ Conference was held in Johannesburg. It explored a
number of key themes to understand what transforming urban space means in practical terms
(SACN, 2014). It served to interrogate the work undertaken by various cities, to gain knowledge
and insight at the city scale, and deepen the understanding and learning concerning challenges
and strategies for spatial transformation. The event reaffirmed that in order to gauge if actions to
transform are manifesting actual change, evidence needs to be tracked. Thus there is a need to
identify/develop a suite of suitable indicators to track transformation. Kusek and Rist (2004:65)
define indicators as “the quantitative or qualitative variables that provide a simple and reliable
means to measure achievement, to reflect the changes connected to an intervention, or to help
assess the performance of an organization against the stated outcome”. Before creating any
indicator it is important to know what objective needs to be achieved. Indicators are only
appropriate “when they are measured against an objective” (Kusek & Rist, 2004:57). It is the
outcomes that will in the end produce the sought benefits.
2.3.1 Standardised and other indicators?
When developing indicators it is also important to be aware of the latest approaches and whether
any related international standards have been developed. In this current round of indicator
development (CSIR-SACN project) international standards were not considered, largely due to the
need to develop local indicators that reflect the local issues better (at sub-city scale). It is, however,
important, for future reference, to be aware of the international drive to develop standardised
indicators. Standardised indicators are “quantitative, qualitative or descriptive sets of
measurements or metrics that can provide a globally standardised set of definitions and
methodologies” (International Standards Organisation, 2014:2). It therefore allows cities to
develop comparable indicators that can measure its performance on a number of themes over time,
as well as to compare performance with other cities. These results can then assist in evaluating
whether policies are achieving their desired outcomes. The World Council for City Data developed

a new standard; namely ISO 371201: Sustainable development of communities, indicators for city
services and quality of life. This launches a set of standardized indicators that “provide a uniform
approach to what is measured in the context of city indicators, and how that measurement is to be
undertaken” (Korth, 2015:1). It sets out a common approach for collecting, assessing, and
evaluating city data. Developing from the ISO 37120 standard, is the Global City Indicators
Facility which is now the world standard for city metrics. It must be noted, however, that these
items reflect the city-scale, as the intention is to compare city performance.
2.3.2 Reporting challenges and current initiatives in South Africa
According to the South African Statistical Quality Assessment Framework (SASQAF) of the
National Statistical System (NSS), statistics become official when they are certified after going
through the standard assessment procedure. To be certified, the data collected must meet user
needs of a broad audience and form part of a longitudinal and sustainable process. Consequently,
the data collected by many national agencies such as Statistics SA and the National Treasury can
be considered to be official statistics. This includes their censuses and household surveys. Sources
of data that are not collected by ‘official’ government agencies should follow a process of
accreditation by going through the standard assessment procedure of SASQAF. Datasets that are
not official statistics should not be used to report on any indicators (AfricaScope, 2013:26).
Metropolitan cities are legally obliged to report on outcome indicators as required by national
departments and regulators. In addition, they also use these for purposes of internal analysis. They
use registers and other sources to extract information and some cities also capture their own data.
In addition, they are also requested to provide information to agencies such as Department of
Performance Monitoring and Evaluation in the Presidency (DPME) and the South African Local
Government Association (SALGA). During 2013, the South African Cities Network (SACN)
commissioned the Urban Indicators Project to review the extent of indicators, data custodians, the
methods used to collect and provide data (AfricaScope, 2013:9). An Indicators Reference group
was established to provide inputs and share advice and guidance, to improve the inputs required
from a range of indicators. Indicators would, for example, also be applied in various forms of
requested performance reporting. A range of indicators was also used by the SACN for the latest
State of Cities Report. When one considers the range of departments and institutions dealing with
city statistics it is likely that some items could be duplicated or calculated by different parties.
Several studies have been undertaken since 2013 to review urban indicators. This included the
2013 Urban Indicators Project (AfricaScope, 2013) and the 2015 Open Data Almanac for Cities
(KPMG, 2015) both commissioned by the SACN. The National Treasury Department’s City
Support Programme (National Treasury, 2015) has also developed a range of urban indicators to
track city performance – all used the SACN thematic quadrants (Productive cities, Inclusive
cities, Sustainable cities, and Well-governed cities). In addition, the other critical framework to
mention is the Integrated Urban Development Framework developed by the Department of
Cooperative Governance (2014), where strategic goals find implementation through policy levers,
which would also measure spatial transformation, to greater or lesser extent. One of the main
burdens for the South African metropolitan areas is reporting, as they are often required to submit
a number of completed questionnaires to StatsSA, SALGA, DWA and National Treasury
1 This standard developed under the agenda of a technical committee for Sustainable development in
communities (ISO/TC268)

(AfricaScope, 2013:22).
2.4 Developing spatial specific indicators – Challenges and Principles
2.4.1 Challenges when developing indicators
There are a number of challenges associated with the development of indicators. Some of the most
noticeable challenges include the unavailability or incompleteness of data, difficulties collecting
source data, methodological changes in the capturing of source data, incomplete time series data
and inconsistent statistical methods used in the indicator-development phase. The spatial unit used
when capturing data poses additional constraints, such as, (1) size variation, creating a statistical
bias also known as the modifiable areal unit problem and (2) significant boundary changes
between data collection periods (e.g census years).
The scalability of data (e.g South African voting districts which do not align to units such as sub-
place or main place or even small area layers) also adds additional constraints in indicator
development. It is also the objective to have indicators that are more spatially-specific or of a
sufficiently fine resolution to allow the observation of localised changes in the data. This
overcomes some of the generalisation that occurs when using administrative units such as local
municipal boundaries.
2.4.2 Challenges of scale
It is important to note that although some of the information collected by various metros,
departments and institutions might be collected at local sub-city level, the information presented
in the various indicators is regularly aggregated and aimed at a broader scale and intended for a
comparison of cities. The reporting units being used for city-level indicators are administrative
units (mostly local municipal unit) which do not reflect the true spatial grain of features such as
population distribution, land-use patterns, etc. (Hagenlocher, Kienberger, Lang, & Blaschke,
2014). Metropolitan areas, such as Gauteng, stretch across local municipal boundaries, yet are
mostly reported within a particular local municipality (the seat of Metropolitan area). The
measurement of items is influenced by the scale that is used, when aggregating information, a
measure of generalisation occurs (Fotheringham, 2005). This is particularly relevant when
considering an item that is scale-dependant where the geographic extent is sensitive to the spatial
arrangement (Blaschke, 2005:200). This begs the question – what is its usefulness in measuring
spatial transformation? To enable sufficient pattern detection of spatial features it is necessary that
the scale be sufficiently fine (for purposes of detecting spatial transformation for example). When
the size of measurement unit changes the spatial variance or heterogeneity also decreases
(McGarigal, 2013:2.18). Appropriate finer-grained information is more useful to grasp the
spatially explicit realities which in turn can contribute to policy–relevant information. A
constraint can, however, be in the computational complexity required if a completely new or
unaligned2 fine spatial unit is used.
2 Referring to alignment to existing units of data representation such as Sub-places, Small Areas, etc.

2.4.3 Principles for indicators:
In order to have indicators that provide value, they have to be clear, direct and unambiguous as
possible. Indicators to be created or selected should be relevant to a desired outcome (Kusek &
Rist, 2004:70) and comply with a set of criteria namely:
Appropriateness/ Relevance – relevant to the desired outcome or the topic featured (National
Treasury, 2015:26).
Specific – To be clear on the focus and ‘what’ it attempts to measure.
Verifiable - relating to the process of indicator creation, ensuring that the source of
information is trustworthy. It should, if relevant or necessary, be independently verified.
Statistical soundness – when an item is created using a statistical process to ensure it is
defendable.
Repeatable – Single/ once-off indicators provide limited value, as tracking change requires
time series data. For this purpose, an indicator should, once created, be repeatable .
Cost effective – Due to the costs involved and the likely expenses, indicators should be
carefully selected/ created to provide as much value as possible. Exorbitant costs should be
avoided and proxy indicators sought especially in the case of developing (poorer) countries.
Comparable –The standardisation of indicators to allow for comparison (National Treasury,
2015:27).
Spatial indicators should, apart from the abovementioned principles, also confirm to SDI ‘good
practice’, it is especially relevant that such items conform to the South Africa data framework for
geographic data and metadata. This is important to facilitate data sharing and distribution.
Naturally proper referencing of such items is also a prerequisite.
3. Developing spatial indicators to track change in South African cities3
3.1 Introducing the research project
To assess the progress made by South African cities in the last 20 years in relation to
development outcomes as well as to identify strategic problems and opportunities facing cities,
the South African Cities Network (SACN) has produced the latest (2016) State of the Cities
Report. As part of this project, a number of spatial indicators and or datasets have being explored
by CSIR to identify key elements of change or transformation in South Africa’s nine biggest
cities (Maritz, 2015). The research also forms part of ongoing programmatic research conducted
by the CSIR Spatial Planning and Systems team and various collaborators within the ambit of the
StepSA initiative. This includes the development of socio-economic indicators at the “meso-
zone” scale – a geo-spatial analyses platform and set of indicators to support regional
development and analyses (see http://gap.csir.co.za/gap/about-gap-1 and http://StepSA.org). Also
research focussed on identifying demographic change in South African cities and towns and
population movement between them, undertaken as an input to the development of the Integrated
Urban Development Framework (IUDF). Other items analysed (not featured in this paper) include
tracking racial change (which is closely linked to South Africa’s apartheid city past), as well as
spatial transformation related to vulnerable communities within the city, using a measure called
‘access to good services’ (CSIR BE, 2015).
3 In addition to what is featured in this paper, the research project included the development of a range of added spatial indicators not
featured here. These can be viewed on StepSa.org and some may feature in other papers presented at Planning Africa 2016.
One of the key contributions of the research project was thus to develop indicators to explore
spatial change and levels of growth and spatial transformation. Particular indicators relating to
bridging the data gap and exploring sub-city level changes were the focus. The intention was to
identify spatial patterns and concentrations of people and activities, growth areas and attendant
changes in urban structure, resource allocation and effectiveness of public services provision (e.g.
public transport). It should be acknowledged that spatial change can be depicted on numerous
levels and that no one indicator can provide a clear indication of spatial transformation,
experiences of people within cities, etc. Indicators can, however, add value in providing some
indication of embedded spatial patterns and the areas undergoing the biggest changes within cities
(in terms of population density, concentration of economic activity), and also in addressing
questions related to the spatial relationships between such changes.
3.2 Research approach and methodology
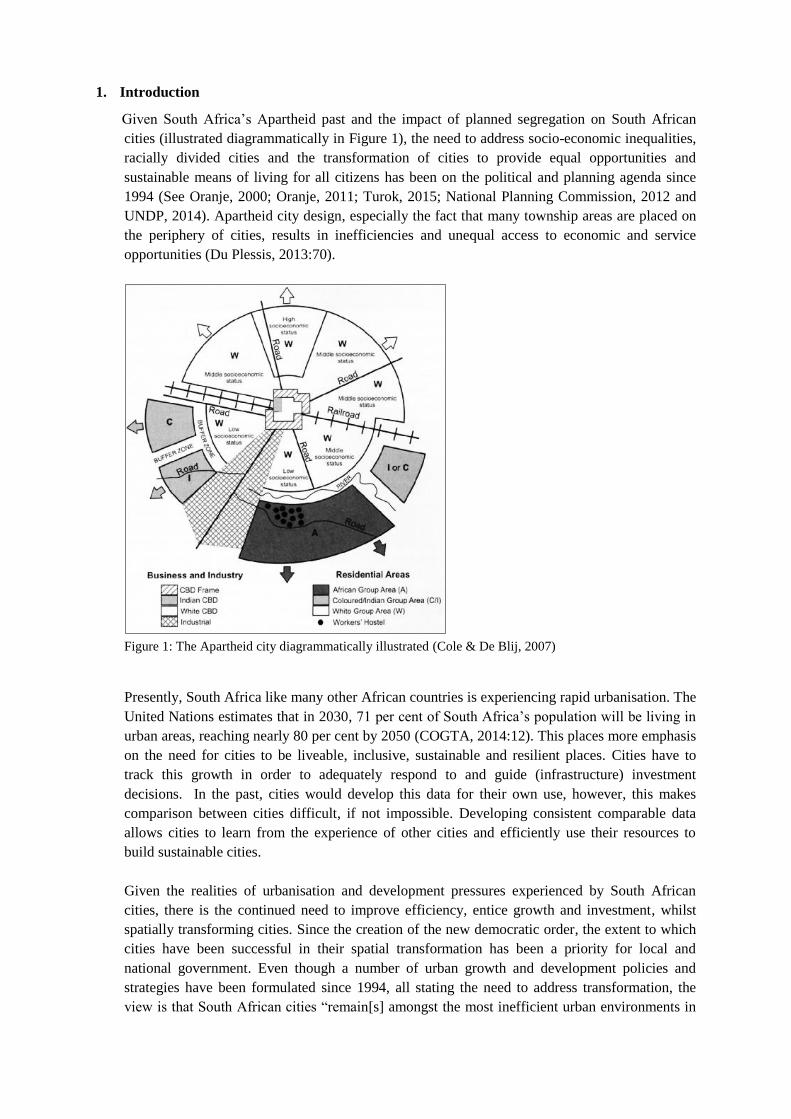
As mentioned previously the purpose of the research was thus to develop spatial specific sub-city
level indicators to provide an indication of spatial change, not merely reflecting increases in
number of people at sub-place or ward level (See example figure 2) or built-up area change (see
http://stepsa.org/pdf/newsletter/stepSA_April16.pdf).
Figure 2: Change in total population per sub-place 1996-2011 (Maritz, 2015).
The intent was to spatio-temporally track aligned data to identify:
spatial specific patterns of population concentration and growth;
spatially embedded formal economic concentration, agglomeration and growth patterns ; and
enable comparative analyses of fine-grained spatial patterns and changes in spatial patterns
within cities – comparing place specific spatial change, as well as comparing spatial change
and growth patterns between cities.
The development and exploration of sub-city indicators required several steps which included;

basic research into each item, data extraction (or update if already available), preparation, and
calculation of the indicator, as well as considering and reflecting on the standards with respect to
developing indicators (as set out in Section 2). However, it also required the development of a
separate new uniform tessellation to correct for the spatial bias introduced by the sub-place
boundaries.
To improve the spatial resolution of information at sub-city level, a single fine grained uniform
tessellation (using 1 sqkm hexagons) was created for each city. Total population and economic
information was assigned to this hexagon tessellation using a dasymetric mapping process, which
is defined generally as the use of an ancillary data set to disaggregate coarse resolution data to a
finer resolution (Eicher & Brewer, 2001). This was done for both population and total economic
production.
3.3 Results
Using this uniform spatial unit enables users to see a less distorted picture of the information.
Because the information does not result in zone size distortions and is sufficiently fine grained. It
can also be displayed in different ways, primarily aimed at the identification and comparison of:
Spatial patterns of concentration and growth of a particular trend i.e. population density
within a city, and also across boundaries – highly useful in discussions regarding nodes,
corridors, identification of growth areas in and on border areas, etc. (See Figure 3 and 4);
An indicator across time between cities, i.e. increase and change in population density across
different cities to explore possible patterns, i.e. increased densities and development on the
outskirts of cities (See Figure 5 and 6);
Spatial concentrations and changes/embeddedness of patterns of population and economic
growth within a city across time (See Figure 7).
Figure 3: Spatial patterns of population concentration (Maritz, 2015).

Using a uniform fine-grained analysis surface as depicted in Figure 3 enables a comparable
depiction across space. Using GIS software a 3D-bar landscape map is created with the extruded
values representing the value of the attribute (population or total economic production). Looking
at the 3D tessellation of population further assists in ‘reading’ the values. The advantage is that
the areas of largest growth or highest value can be easily observed more clearly. Dense versus
less-densely populated areas are clearly visible. Taking the same spatial surface but comparing
only the change in population (figure 4) helps to visualize whether the growth that materialised
was aligned with development objectives such as ‘not developing township type settlements on
the periphery of cities’, etc.
Figure 4: Spatial patterns of population growth (Maritz, 2015).
Figures 5 and 6 repeat the same analysis for different cities, allowing for visual comparison
between different cities because the tessellated units used were the same size. The scale of change
(population growth) as well as its spatial extent is depicted more clearly and in a comparable
fashion.

Figure 5: Population growth 1996-2011 - East London (Maritz, 2015).
Using this approach, different items can be depicted for the same area – Figure 7 depicts the
change in population as well as in economic production. Although the actual numbers cannot be
compared one-to-one, the change when reflected along a relative scale can be useful when
comparing change in population versus economic production.
Figure 6: Population growth 1996-2011 - Mangaung (Maritz, 2015).

Figure 7: Comparing spatial patterns of population and economic growth (Maritz, 2015).
Considering the locational and strategic planning context it then becomes easier to judge the
result of policies such as densification, corridor development or economic development growth
points. Comparing planned with actual development can assist in informing planners and city
managers whether their efforts in transforming cities, in line with their spatial plans, are
succeeding or not. The contribution of the spatial concentration and growth indicator is,
however, not merely in the identification of patterns as illustrated above, but even more so in
enabling advanced spatial analyses related to comparison of patterns across distance bands and
over time. An example of comparison of areas across different distance bands is done by
developing line transects. See Figure 8 that uses uniform distance intervals, drawn from this
newly developed socio-economic sub-city indicator dataset, where the values are truer when
considering distribution and distance than datasets that vary in size. A statistically unbiased
representation is created because the units along the transect are regular.

Figure 8: Linear transect from the JHB CBD to the PTA CBD reflecting the change in population
comparing 1996 to 2011 (Napier, Le Roux, & Van Heerden, 2016).
In the same vein, comparison of areas across different time scales can be done by developing
‘heat contour’ maps (see Figure 9) that also use uniform intervals, where this newly developed
socio-economic sub-city indicator dataset enables comparison across time scales whilst data
gathering and sub-place area boundaries have shifted.
Figure 9: Economic nodes in the Gauteng city region, following the JHB CBD to the PTA CBD transect,
reflecting embedded patterns of economic concentration between the time periods 1996 to 2011
(Maritz, 2015).
3.4 Value and contribution of the sub-city spatial change indicator, and possibilities going
forward
Although there are numerous indicators aimed at measuring city performance, most utilise only
city-level information. This does not reflect the spatial realities underlying change, development
or even decay. We need to also apply more information at a sub-city scale. Such information

allows planners and researchers to investigate whether their policies/strategies are having the
intended effect. Also critical is that when change is reflected, this also requires that spatial units
remain constant (or alternatively it would require an adjustment process where spatial extent has
changed). As indicated it is unlikely that a single indicator can measure spatial transformation.
A current reality is that several sub-city indicators exist but they are also based on different
spatial units. This presents a problem when needing to combine them or to test for the correlation
between indicators. The type of indicators used will differ. For example, the population and
economic change can be seen as indicators of intensity, while items such as racial change will be
an indicator of diversity.
By adding other information such as age-groups, household income, etc. more differentiated
views can be created to depict the relative concentration of vulnerable groups, housing need,
service requirements, etc.
4. Reflections and conclusion
Continued urbanisation and societal inequalities present a challenge in ensuring that spatial
change and investment in South African cities are orientated towards achieving the outcomes of
spatial transformation. To contribute towards achieving spatial transformation objectives, and
tracking progress in this regard, the need for the development, extension and use of spatially and
temporally aligned sub-city level indicators is evident.
It is crucial to support the wide range of ongoing indicator initiatives in South Africa and
internationally, and to strive for the use of trustworthy official data. However, there is also a need
to explore the benefits and improvement of spatially refined and aligned sub-city indicators that
can provide spatially-specific views on place-specific progress and challenges in the endeavour
towards spatial transformation.
The innovative approach and findings of the endeavour to develop spatio-temporally aligned sub-
city level indicators does not only provide a solid baseline to track change in cities in South
Africa, but also provides a basis to explore and improve the development and value of such
spatial-specific indicators within the context of developing countries and fast growing cities. In
reflecting on the research and development process, the team and authors identified a number of
key considerations regarding the development, value and use of such indicators. These can be
summarised as:
The value of place-specific views on population increase and decline in specific parts of
cities, and especially in city regions (moving beyond the metropolitan/city borders). An
indicator built on a finer spatial granularity is more useful to grasp the spatial realities. It can
provide a view of population change in the broader area, and not as an aggregate value.
In order to create fine-grained socio-economic data it is critical to maintain proxy data sets
that are used to assign values to such fine-grained spatial units with confidence, in order to
create a representative picture.
It enables spatial analyses and presentation of change in different ways to make comparative
analyses possible. It allows for additional analysis - such as creating transects across city
space. Keeping the unit type a constant size also makes for better comparison between cities.
Should such tessellations be extended beyond the city boundary it will also indicate cross-
border change.

Although currently available only for nine of South Africa’s largest cities, this can similarly
be repeated for other cities or even regions. Currently the mesozone data layer provides
(similar) information albeit to assist with coarser scale regional-level analysis. Moving
beyond Local Municipal indicators provides for better inter- and intra-city views.
• Indicators are often the result of contained data combination or processing, as such it does not
represent all realities. For example, depicting economic activity does not include the informal
economy. There is merit in collaboration when it comes to developing sub-city level spatial indicators.
Indicator development should involve the users/ beneficiaries to ensure appropriateness and
relevance. Data reference- and working-groups are important to avoid duplication whilst
ensuring that items are vetted and aligned to standards.
Through the stepSA initiative opportunities are sought to enhance the use and sense-making
of indicators to measure spatial change and changes in concentration of population and
economic activity.
Can sub-city spatial indicators make a contribution (to measure spatial transformation)? This
paper presented an approach which uses a fine-grained uniform spatial unit to present change and
trend data. Given the importance of measuring change and reporting on spatial planning
outcomes, the value of finer-grained information becomes obvious. Considering the examples
used it is clear that this is useful in judging the extent of spatial transformation in our cities. Much
work still needs to be done to test its application with city authorities and to expand information
variables. In addition, the monitoring and evaluation space is filled with indicators often only
presented at city-scale. Collaboration between institutions/departments can reduce the burden
placed on municipalities and might even result in the provision of a range of comparable sub-city
indicators being developed. Having a shared framework against which to measure spatial
transformation will also be beneficial in answering this question.
The authors would like to acknowledge the contribution made by the South African Cities
Network to explore sub-city indicators in support of the 2016 State of the Cities Report.
5. Bibliography
AfricaScope. 2013. Urban Indicators project 2013 scoping and planning exercise. Johannesburg:
South African Cities Network.
Amindarbari, R. & Sevtsuk, A. 2013. Measuring Growth and Change in Metropolitan Form
(working paper). Cambridge: City Form Lab.
Balestrat, M. 2009. Spatial indicators for the analysis of peri -urban dynamics in the Languedoc
Mediterranean area. Territorial cohesion of Europe and Integrative Planning (pp. 17-35). Lodz,
Poland: European Regional Science Association.
Bickford, G. 2014. Transit Oriented Development: An appropriate tool to drive improved
mobility and accessibility in South African cities? Spatial Transformation of Cities.
Johaannesburg: South African Cities Network.
Blaschke, T. 2005. The role of the spatial dimension within the framework of sustainable
landscapes and natural capital. Landscape and Urban Planning, 198-226.
Bourdic, L., Salat, S., & Nowacki, C. 2012. Assessing cities: a new system of cross-scale spatial
indicators. Building Research and Information, 592-605.

COGTA. 2014. Integrated Urban Development Framework. Pretoria: Department of Cooperative
Governance and Traditional Affairs.
Cole, R. & De Blig, H.J. 2007. Survey of Subsaharan Africa: A Regional Geography. New York:
Oxford University Press.
CSIR BE. 2015. Indicator - access to good basic service (Prepared in support of SACN - state of
the cities report 2015). Pretoria: CSIR.
Daly, G. and González, A. 2013. Key Indicators for Territorial Cohesions and Spatial Planning
The Reform of EU Cohesion Policy and the New Role of Spatial Indicators. Borderlands: The
Journal of Spatial Planning in Ireland, 3: 73-89.
Du Plessis, C. & Landman, K. 2002. Sustainabitliy analysis of human settlements in South Africa.
Pretoria: CSIR Bulding and Construction Technology.
Du Plessis, D. 2013. A critical reflection on urban spatial planning practices and outcomes in
post-apartheid South Africa. Urban Forum, 25: 69-88.
Eicher, C. l. & Brewer, C. A. 2001. Dasymetric mapping and areal interpolation: implementation
and evaluation. Cartography and Geographic Information Science, 28(2): 125-138.
Fotheringham, S. 2005. Scale-dependant spatial analysis. In M. Goodchild, & S. Gopal (Eds),
Accuracy of spatial databases. London: Taylor and Francis.
Global Cities Institute. 2015. Global City Indicators available at: http://www.cityindicators.org/
[accessed: 5 January 2016].
Gülersoy, N.Z. & Gürler, E. 2011. Conceptual challenges on urban transformation. ITU Journal
of the Faculty of Architecture, 8(1): 10-24.
Hagenlocher, M., Kienberger, S., Lang, S. & Blaschke, T. 2014. Implications of Spatial Scales
and Reporting Units for the Spatial Modelling of Vulnerability to Vector-borne Diseases. In R.
Vogler, A. Car, J. Strobl, & G. Griesebner (Eds), GI Forum 2014 - Geospatial Innovation for
Society (pp. 197-206). Wien: OAW Verlag.
Harrison, P. & Todes, A. 2014. Spatial considerations in the development of urban policy in
South Africa: a research paper as input into the preparation of the integrated urban development
framework (IUDF). Pretoria: Department of Cooperative Governance and Traditional Affairs.
Harrison, P. & Todes, A. 2015. Spatial Transformation in a "loosening state": South Africa in a
comparative perspective. Geoforum, 61: 148-162.
Hindon, D. 1996. The apartheid city: construction, decline and reconstruction. In E. Le Bris (Ed),
Villes du sud : sur la route d'Istanbul (pp. 75-106). Paris: ORSTOM.
HSRC. 2014. Multiple deprivation in the Eastern Cape. HSRC, available at:,
http://www.hsrc.ac.za/en/review/hsrc-review-january-2015/multiple-deprivation-eastern-cape
[accessed: 7 January 2016].
Iceland, J., Weinberg, D. H. & Steinmetz, E. 2002. Racial and Ethnic residential Segregation in
the United states: 1980-2000. Bureau, U.S. Census, Department of Commerce. Washington DC:
US Government Printing Office.
International Standards Organisation. 2014. Sustainable development in communities: City
Indicators for service delivery and quality of life. ISO 37120 briefing note. International
Standards Organisation.
Korth, N. 2015. How ISO standardised city indicators could change the way we design. Deeproot,
available at: http://www.deeproot.com/blog/blog-entries/how-iso-standardized-city-indicators-
could-change-the-way-we-design [accessed: 30 October 2015].
KPMG. 2015. Open Data Almanac for Cities - Status Quo Report. Pretoria: South African Cities
Network.

Kusek, J. Z. & Rist, R. C. 2004. Ten steps to a results based monitoring and evaluation system.
Washington DC: The World Bank.
Lehohla, P. 2005. Debate over race and censuses not peculiar to SA. Pretoria: Statistics South
Africa.
Marcuse, P. 2009. Spatial justice: derivative but causal of social injustice. Justice spatiale/ spatial
justice, available at http://www.jssj.org/wp-content/uploads/2012/12/JSSJ1-4en2.pdf [accessed: 7
January 2016].
Maritz, J. 2015. Selected indicators for SACN SOCR2015 (SET 2). Pretoria: CSIR.
Maritz, J. 2015. State of the Cities Report. StepSA: http://stepsa.org/sacn_socr.html [accessed 16
December 2015]
McGarigal, K. 2013. Concepts of Scale. UMass Landscape Ecology Lab:
http://www.umass.edu/landeco/teaching/landscape_ecology/schedule/landeco_schedule.html
[accessed: 29 February 2016].
Medeiros, E. 2014. Territorial Cohesion Trends in Inner Scandinavia: The Role of Cross-Border
Cooperation (INTERREG-A 1995-2010), Norsk Geografisk Tidsskrift 68(5).
Napier, M., Le Roux, A. & Van Heerden, J.L. 2016. Seeing spatial inequality: Analysing density
and value gradients in South African cities to test commonly held assumptions and inform future
action (working paper). Pretoria: CSIR.
National Planning Commission. 2012. National Development Plan 2030 Our Future – Make it
Work:. Pretoria: The Presidency.
National Treasury. 2015. National Treasury: City Support Programme - Emerging framework for
integrated reporting on Built Environment functions for cities. Pretoria: Palmer Development
Group.
Noble, M., Zembe, W. & Wright, G. 2011. Indices of multiple deprivation for South Africa, 2011.
Cape Town: Southern African Social Policy Research Institute.
Odimegwu, C. & Kekovole, J. 2016. Sources of socio-economic and demographic data in South
Africa. In C. Odimegwu, & J. Kekovole (Eds), Social Demography of South Africa. Advances and
Emerging Issues (pp. 7-12). New York: Routledge.
Odoki, J. B., et al. 2001. An integrated model for quantifying accessibility-benefits in developing
countries. Transportation Research Part A: 601-623.
Oranje, M. 2014. Spatial Transformation and Urban Restructuring: Lessons for the 20-year old
post-apartheid South African city? Spatial transformation of cities. Pretoria: South African Cities
Network.
Oranje, M. 2011. Nestling national 'transformation' imperatives in local 'servicing' space: Critical
reflections on an intergovernmental planning and implementation project. Town and Regional
Planning, 58: 6-16.
Oranje, M and van Huyssteen, E. 2007. A brief history of intergovernmental development
planning in post-apartheid South Africa. Town and Regional Planning, 51: 1-15.
Oranje, M. 2000. A Policy Paper on Integrated Development Planning. Pretoria: Department of
Provincial and Local Government.
Osborn, D., Cutter, A. & Ullah, F. 2015. Universal Sustainable Development Goals:
Understanding the Transformational Challenge for Developed Countries. London: Stakeholder
Forum.
Republic of South Africa, 2013. Spatial Planning and Land Use Management Act, Act 16 of 2013.
Cape Town: The Presidency.
Republic of South Africa. 2000. Local Government: Municipal Systems Act, Act 32 of 2000.Cape
Town: The Presidency.

Republic of South Africa. 1995. Development Facilitation Act, Act 67 of 1995. Pretoria: Office of
the President.
Soja, E., 2009. The city and spatial justice. Justice Spatiale, Spatial Justice, 1: 31-39.
South African Cities Network. 2016. Sustainable Cities. State of the Cities. [online]
Johannesburg: SACN. Available at: http://sacitiesnetwork.co.za/wp-
content/uploads/2015/12/SACN-Sustainable-Cities-Report-WEB.pdf [Accessed 18 Jun. 2016].
South African Cities Network. 2014. Spatial transformation of cities: Conference report.
Johannesburg: South African Cities Network.
South African Cities Network. 2011. South African Cities Network Strategic Plan for the fiscal
years 2011-2016. Johannesburg: South African Cities Network.
Sustainable measures. 1998. Sustainable community indicators. Sustainable measures, available at
http://sustainablemeasures.com/Training/Indicators/Indicatr.html [accessed: 23 February 2016].
Taeuber, A. & Taeuber, K. 1988. Measures of racial exposure: some problems. Working paper No
88-9. Madison: Center for Demography and Ecology, University of Wisconsin.
Turok, I. 2014. Settlement Planning and Urban Transformation. Spatial Transformation of Cities
conference. Pretoria: South African Cities Network.
Turok, I. 2015. SPLUMA as a tool for spatial transformation. Johannesburg: South African Cities
Network.
UNDP. 2014. The impacts of social and economic inequality on economic development in South
Africa. Prepared by TIPS for UNDP. New York: United Nations Development Programme.
United Nations Sustainable Development. 2016. Sustainable development goals - United Nations.
[online] Available at: http://www.un.org/sustainabledevelopment/sustainable-development-goals/
[Accessed 18 Jun. 2016].
Weber, J. L. & Hall, M. 2001. Towards spatial and territorial indicators using land cover data.
Copenhagen: European Topic Centre on Land Cover, European Environment Agency.
Williams, J. J. 2000. Urban transformation. Cities, 17(3): 167-183.
Yang, Y. 2010. Sustainable Urban Transformation driving forces, indicators and processes.
Zurich: Swiss Federal Institute of Technology (ETH).