Embed Size (px)
Citation preview

http://ijfr.sciedupress.com International Journal of Financial Research Vol. 11, No. 5; 2020
Published by Sciedu Press 42 ISSN 1923-4023 E-ISSN 1923-4031
Are Trade Policies Performance Enhancing? The Special Case of the
GCC Countries
Turki Alshammari1
1 Finance Dept., Kuwait University, Kuwait
Correspondence: Turki Alshammari, Finance Dept., Kuwait University, Kuwait. E-mail: [email protected]
Received: June 7, 2020 Accepted: July 19, 2020 Online Published: September 21, 2020
doi:10.5430/ijfr.v11n5p42 URL: https://doi.org/10.5430/ijfr.v11n5p42
This study is supported by Kuwait University research sector grant no. IF-03/17.
Abstract
Purpose – The purpose of this study is to investigate the extent to which trade policies affect the performance of
firms in the six countries of the Gulf Cooperation Council (GCC): Saudi Arabia, Kuwait, the United Arab Emirates,
Qatar, Bahrain, and Oman. The finance literature, theoretically and empirically, postulates that the efficient
management of trade policies (i.e., trade debtors, inventory, and trade credit policies) relates positively to corporate
performance. This study, however, conjectures that in a different and distinct business setting, corporate performance
might not be related to how a firm manages its trade policies, or at least not significantly.
Design/Methodology/approach – The study sample is comprised of all nonfinancial firms in the Gulf Cooperation
Council (GCC) countries. The study uses several ratios in the literature to proxy for trade policies and corporate
performance. It also employs related and alternative econometric models in order to corroborate the results.
Findings – Contrary to a documented worldwide evidence, the results of the study reveal that short-term trade
policies – specifically, trade debtors, inventory, and trade credit – have an insignificant or at most a trifling effect on
corporate performance, for a set of nonfinancial listed firms in all six GCC countries.
The results are robust to the econometric model, the profitability measure, and the country. This is probably because
most GCC corporate managers have no concern about being financially constrained, which leads to less attention to
aligning the optimal levels of working capital with the daily financing needs. Most firms in Gulf Cooperation
Council (GCC) countries receive generous subsidies from their governments as part of lavish payments, in order to
carry out development projects and other services for governmental agencies. The results of this study should be of
great importance to GCC corporate managers and investors.
Originality/Value – The study contributes to the literature by demonstrating that different cultural managerial
practices might skew the already-established association among the financial variables and, hence, bring up new
evidence. Also, the study implicitly suggests that further research in this area could reveal additional anomalous
findings.
Keywords: GCC countries, debt ratio, firm value, trade credit, trade debtors, Tobin’s Q
JEL Classification: G3, G31
1. Introduction
Corporate performance is affected by both long-term and short-term decisions. For example, a long-term decision
might influence the way a firm structures its financing, pays its dividend, and carries out its investments. Short-term
decisions might include all day-to-day trading activities, such as paying trade creditors after the longest time possible,
collecting from debtors in the shortest time possible, and investing an appropriate amount of money in inventory.
That is, the best operating practices dictate the optimal level of trade debtors, trade credit, and inventory, while
financing those operations for the least cost.
The dramatic advances in technology have transformed the way firms manage their trade policies (those that relate to
trade debtors, inventory, and trade credit). Firms currently collect real-time data on how well each product is selling
so computers can place orders automatically to keep shelves full. Once sales begin to slip, prices tend to be lowered

http://ijfr.sciedupress.com International Journal of Financial Research Vol. 11, No. 5; 2020
Published by Sciedu Press 43 ISSN 1923-4023 E-ISSN 1923-4031
to reduce stocks before drastic price cuts become imperative.
A study by Duggal and Budden (2015) on the largest S&P 500 US health care firms, over the period 2009-2012,
documents that about 45 percent of sales are (net) invested in trade debtors and inventory. Hence, a great proportion
of a firm’s funds constitute hidden reserves that can be otherwise exploited to finance growth plans. Similarly, firms
all over the world do their best to manage their funding meticulously and sensibly so they are not forced to resort to
any long-term expensive financing. That is, managers usually struggle to reach an optimal level of net investment in
short term assets, to free up some cash that can be a readily available alternative to expensive financing. As a
consequence, the better the firm’s performance, the more valuable a firm will probably become.
However, different cultures dictate the different beliefs and attitudes of corporate managers, and their business
practices may not be optimal due to those different business environments. For example, finance theory postulates
that firm managers do their best to forecast the cash flows of their firms so they can line up funds well in advance. If
they are likely to generate surplus cash, managers plan for its productive use. This optimal situation might change if
managers have no concern about the level of cash they need (or they have) since the availability of cash can always
be arranged either from the government (due to certain facilities) or by having an intimate connection with the banks
they deal with. As a result, managers become unconcerned by the imperative need for financing operations in drastic
times as they always have access to financing. Finance theory also postulates that managers should prudently
monitor their inventory level so as to alleviate losing sales or excessively incurring carrying costs. However, if
managers can secure sales with their customers by contracts (through a government tender), the level of inventory
becomes less important as the sales are secured, and money will be collected effortlessly.
The Gulf Cooperation Council (GCC) is a political and economic coalition that includes Kuwait, the Kingdom of
Saudi Arabia, Qatar, Bahrain, United Arab Emirates, and Oman. The main goal of the GCC alliance is to harmonize
all major economic (and diplomatic) policies among the member countries. The wealth of the oil-exporting GCC
countries creates a massive level of financing. As the GCC governments, in general, tend to provide support to all
business concerns in terms of guaranteeing sales with secured payments, this, in turn, tends to discourage the GCC
corporate managers from paying proper attention to the logical optimal decision process with respect to short-term
investments and financing decisions.
Given these, this study examines the influence of trade debtors, trade credit, and inventory management on company
performance for all nonfinancial GCC firms in the period of 2011 – 2016. Employing several econometric methods,
the results show a trifling, if any, effect of trade debtors, trade credit, and inventory management on firm
performance.
The study contributes to the extant literature in many ways. First, it provides different (and anomalous) evidence that
has not been documented consistently in several countries. Second, the study uses sample firms from different
socially and economically inter-connected developing countries instead of focusing on one developed country. Third,
this study focuses on economies where intercompany financing plays a prominent role, which is in contrast to the
Anglo-Saxon economies where firms usually service debt promptly. Further, the GCC economies are bank-based
systems where the capital market role in financing tends to be weak.
1.1 The Motivation of the Study
From a theoretical point of view, Hofstede's (1983) findings posit that individuals from different cultures process
information differently. Hofstede postulates that individuals from similar cultures have a “collective mental
programming” that they share with members of their nation, but not with members of other nations. The empirical
evidence seems to widely support the propositions of Hofstede, who argues that corporate managers from different
cultures act differently according to the accepted cultural corporate norms. For example, the following figure shows
the differences of Hofstede common six cultural dimensions between Saudi Arabia and the USA (squared numbers
denote KSA). Irrespective of the insinuation of the numbers, there is a discernible difference between the cultural
dimensions of the two countries, which is the case for most countries.

http://ijfr.sciedupress.com International Journal of Financial Research Vol. 11, No. 5; 2020
Published by Sciedu Press 44 ISSN 1923-4023 E-ISSN 1923-4031
Figure 1
For more constructed figures, visit Hofstede Insights: www.hofstede-insights.com
Similarly, the work of Lazarsfeld and Merton (1954) brings up “homophily”, the sociological principle that as
individuals feel more comfortable, they tend to behave in a way similar to people like themselves, but not like those
of other countries. This suggests a shift in normative expectations with regard to the development of a benevolent
attitude, such that managers' intentions and actions are interpreted similarly in confined cultures. That is, managers’
affinity to their peer managers provides an appropriate environment that is conducive to mutual, personal
understanding in the context of all kinds of management roles and responsibilities. Thus, other things being equal,
this paper conjectures that managers who share more homophilous ties tend to display a higher propensity to share
common practice. Hence, this tends to create a different managerial attitude that might distort the pre-established
optimal business practices with respect to trade policies.
Based on the theoretical proposition of Hofstede (1983) and Lazarsfeld et al. (1954), this study investigates the
relationship between trade debtors, trade credit, and inventory management efficiency and corporate profitability in
different managerial settings, in GCC countries where the corporate sector depends highly on government supports
and subsidies. That is, most firms in GCC countries prosper when the national budgets flourish due to a rise in the oil
price (Alshammari, 2018). In each country, economic prosperity tends to boost government expenditures in terms of
more development projects that are usually carried out by the private sector, and vice versa.
This study conjectures that as GCC governments embrace their private sector, firm managers might be less inclined
to follow the universally accepted practices of optimal, short-term trade policies. Moreover, firms in GCC economies,
being part of emerging markets, tend to be in the nascent stage of their product life cycle. Because of that, they may
not always be inclined to adopt optimal corporate trade policies, due to operational and temporal financial constraints.
This conjecture contradicts the evidence of Allen et al. (2012) that, as firms in emerging markets tend to face intense
competition from the stronger business concerns in developed markets, it becomes imperative for those firms to
manage their trade policies astutely.
2. Literature Review and Hypothesis Development
Several studies examined the relationship between the optimal level of trade debtor/credit and inventory and firm
performance. Two distinct features tag most of the previous studies. First, most of these studies focus on the
developed economies that are characterized by both a large number of firms and the big size of these firms. Very few
studies are devoted to smaller sized firms in developing countries. Second, most of these studies assert a direct
association between the optimal management of trade debtor, trade credit, and inventory, and firm performance
measured either on an accounting basis (ROA, ROE, return on sales, etc.) or on a market value basis (e. g. Tobin’s
Q).
Shin and Soenen (1998) analyze the association between the net trade cycle and profitability for 2,950 US companies
during the period 1975-1994. Their findings support a negative correlation between a corporation’s net trade cycle
and its accounting and market-based performance. Their findings place the emphasis on creating shareholder value
by efficiently managing both trade debtor and trade credit.
40
91
62
46
26
68
95
25
60
80
36
52
Power Distance Individualism Masculinity UncertaintyAvoidance
Long TermOrientation
Indulgence

http://ijfr.sciedupress.com International Journal of Financial Research Vol. 11, No. 5; 2020
Published by Sciedu Press 45 ISSN 1923-4023 E-ISSN 1923-4031
Deloof (2003) examines the relationship between the cash conversion cycle and firm performance for 1,009 large
Belgium nonfinancial firms during the period 1992-1996. He documents a negative linear relationship between gross
firm operating income and trade debtor, trade credit, and the optimal level of inventory.
In a study of the relationship between cash conversion cycle and corporate performance for more than 8,000 Spanish
SMEs during the period 1996-2002, Teruel and Solano (2007) document a direct and significant relationship between
the optimal policies of trade debtor and trade credit and corporate performance.
Cristea and Cristea. (2016) analyze the relationship between the cash conversion cycle and return on sales for all
manufacturing firms listed on the Bucharest stock exchange from 2011 to 2015. The results of their panel data
analysis indicate a negative and statistically significant relationship between the cash conversion cycle and firm
profitability.
In investigating the relationship between firm performance (ROA and firm value) and cash conversion cycle for the
10 years 2003-2012 for firms listed in Johannesburg stock exchange, Oseifuah and Gyekye (2017) document an
insignificant relationship between cash conversion cycle and the ROA. Barjaktarovic, Latinovic and Milosavljevic
(2014) employ a correlation analysis to examine the relationship between profitability and liquidity measures for 51
listed Serbian firms. They report a negative correlation between ROA and both trade debtors and trade credit. They
also document an insignificant relationship between the cash conversion cycle and ROA.
Enqvist, Graham, and Nikkinen (2014) analyze the relationship between the cash conversion cycle and ROA for
1,136 firm-year observations for Finnish firms. They document that the cash conversion cycle and trade debtor
relationship is more pronounced during economic downturns relative to economic booms. Wasiuzzaman (2015)
examines the influence of short-term trade policies on firm value when there are financial constraints. His data spans
the period 1999-2008 and includes all nonfinancial Malaysian firms. He finds that the efficiency of corporate trade
policies leads to higher firm value.
Botoc and Anton (2017) analyze the effect of working capital management on the profitability of high-growth firms
in Europe during the period of 2006-2015. They employ different quantile regressions, different sub-samples,
different indicators of profitability, and document a significant relationship between profitability and the efficiency of
working capital management.
Linh and Mohanlingam (2018) investigate the association between the cash conversion cycle and firm profitability
for a sample of 34 agricultural and food Thai firms during the period 2009 – 2013. They find the cash conversion
cycle, as well as its component the production cycle, to be inversely related to firm profitability. The payment cycle
has positive relation with profitability while collection cycle has insignificant relationship with firm profitability.
2.1 Hypothesis
Given the above literature and the distinct GCC business environment, this paper hypothesizes a trivial relationship
between trade debtors, trade credit, inventory management and corporate performance, for all nonfinancial GCC
listed firms. This conjecture is contrary to the theoretical predictions of the working capital theory as well as to the
empirical findings worldwide, as explained above in the literature review.
However, this hypothesis is founded on the different and distinct cultural attributes of GCC corporate managers, as
well as the economic environment that is usually rich in government subsidies. Besides, the underdeveloped GCC
capital markets coupled with the short investment history in these markets – the oldest GCC stock market is the
Kuwait stock exchange which was established officially in 1984 – have resulted in investor illusion with respect to
the business and investment risk. Hence, the practices of corporate managers might not reflect properly on firm
values, so, there tends to be no clear-cut and vibrant link between efficient business practices and firm performance
represented by Tobin’s Q.
Therefore, the following hypothesis is formulated:
Hypothesis: There is a significant relationship between trade debtors, trade credit and inventory policies, and
corporate performance for all nonfinancial firms in the GCC countries.
3. Methodology
Given that this paper intends to investigate the relationship between trade as well as inventory policies and firm
performance, the following model is to be tested:
Performance = f {short-term corporate trade and inventory policy measures + control variables}
As in Alshammari (2018), two widely utilized measures of performance are employed. The first is the return on
http://ijfr.sciedupress.com International Journal of Financial Research Vol. 11, No. 5; 2020
Published by Sciedu Press 46 ISSN 1923-4023 E-ISSN 1923-4031
assets, ROA, which is an accounting measure (the operating income divided by total assets); the second measure is
Tobin’s Q (a market-based measure), which is depicted by the following formula:
TQ = (MVE + TA – EQ) / TA
where MVE is the product of (year close) stock price by the number of common stocks outstanding, TA is the
year-end book value of total assets, and EQ is the year-end book value of equity. This ratio is used in other studies
such as David Hyland (1997) and Chung and Pruit (1994) who document that this ratio of Tobin’s Q has about 96
percent correlation with Q of Lindenberg and Ross (1981).
To control for corporate performance, the debt ratio (total debt divided by total assets) and firm size (log of sales) are
to be employed.
Several regression methods are employed for robustness. These include the pooled regression methods (fixed effects
and variable effects) and the generalized method of moments (the GMM method). In order to further support the
results, the quantile regression will also be employed due to its distinct statistical properties, where its results divulge
a more comprehensive picture of the different effects of trade and inventory policies on corporate performance.
Trade debtors represent cash that is to be paid by customers who have purchased goods/services on account from a
firm. Trade creditors, on the other hand, characterize any customer/supplier from whom a firm has purchased on
account and hence is owed to. Managing the day-to-day cash cycle of trade debtors and creditors is important for
every firm since it ensures a sustainable business (ceteris paribus). If a firm pays its creditors before it collects from
its debtors, then a firm most likely faces short-term capital constraints that need to be resolved.
Therefore, for the variables of interest, and following the related literature, three measures of trade policies are to be
employed:
The trade debtors’ variable is proxied by the “days in account receivables” which is the number of days it
takes to collect accounts receivable. This variable signals the magnitude of cash invested in trade debtor and
is measured as follows:
ARP = accounts receivable / daily sales
The inventory management efficiency is proxied by the “days in inventory” which reflects the period of
turning inventory into sales. This variable designates the magnitude of cash invested in inventory and is
measured as follows:
IP = inventory / daily sales
Trade credit variable is proxied by the “days in accounts payable”, which is the average time that a
company takes to pay its bills and invoices to its trade creditors. This variable indicates the magnitude of
cash invested in trade credit and is measured as follows:
APP = Account payables / daily sales
3.1 Data
To be included in the sample of this study, a firm must be:
(a) a listed firm in the stock exchange in its GCC country.
(b) a nonfinancial GCC firm, and
(c) a going concern, hence, have financial data during the period of the study, 2011 – 2016.
All financial data are from Thomson Reuters, a well-known and widely used commercial database. To standardize
the reference and ensure comparability, all figures are in US dollars. Applying the above three criteria results in 943
firms out of 1,041 in the related database.
Table 1 includes summary statistics of some variables that are employed to draw the analysis. The GCC corporate
mean value of net income is $106 million, while the median GCC firm makes $US 22.3 million of net income. The
mean value of assets size is about $US 660 million, while the average debt to asset ratio of the GCC nonfinancial
firms is about 40 percent. Tobin’s Q mean value is almost 1.6.
To show comparison by subgrouping numbers in the GCC countries (statistics are suppressed to save space), the
biggest firms are the Saudi firms in terms of total assets while the smallest firms are the Omani firms. Tobin’s Q is
the largest for Kuwait firms (=2.8), while it is the lowest in Bahrain (=98 percent), followed by Saudi (=2.02). The
most indebted firms are in Emirates with a mean debt ratio of 56 percent versus only 27 percent (lowest) in Bahrain.

http://ijfr.sciedupress.com International Journal of Financial Research Vol. 11, No. 5; 2020
Published by Sciedu Press 47 ISSN 1923-4023 E-ISSN 1923-4031
Table 1 also shows that the mean value of the accounts receivable period is 79 days for GCC firms. This means that,
on average, a GCC nonfinancial firm collects its receivable about every 80 days. This is considered relatively an
average when compared to the 54 days for the Belgium firms (Deloof, 2003), the 67 days for UK firms (Thuvarakan,
2013), the 148 days for Greece firms (Lazaridis et al., 2006); and the 103 days for Singaporean firms (Mansoori et al.,
2012).
Table 1. Summary statistics of all GCC nonfinancial firms (Related figures are in $US)
Mean Median SD Obs.
NI 106 Mn 22.3 Mn 193 Mn 943
Assets 660 Mn 408 Mn 476 Mn 943
DR 40% 36% 20% 943
Tob Q 1.6 1.4 79% 943
ARP 79 days
IP 65 days
APP 41 days
Cash% 6.2% of assets
AR% 14% of assets
Inv% 12% of assets
AP% 8% of assets
NI is net income; DR is debt ratio; Tob Q is Tobin’s Q; ARP is accounts receivable period; IP is inventory period;
APP is accounts payable period; Cash% is cash percentage of assets; AR% is accounts receivable percentage of
assets; Inv% is inventory percentage of assets; AP% is accounts payable percentage of assets.
The inventory period of the GCC nonfinancial firms is almost 65 days. That means that a GCC firm, on average,
exhausts its inventory every 65 days, which is almost comparable to the 60 days of UK firms (Thuvarakan, 2013),
and the 59 days for Thai firms (Linh 2018), but less than the 110 days documented by Mansoori et al. (2012) for
Singaporean firms, and the 137 days for the Greece firms reported in Lazaridis et al. 2006). The account payable
period of 41 days is relatively low for the GCC firms when it is compared to the 96 days for Greece firms (Lazaridis
et al. 2006) and 79 days for the Singaporean firms (Mansoori 2012).
Table 1 also includes the components of the current asset as a percentage of total assets. For example, the accounts
receivable and inventories account for about 14 percent and 12 percent, respectively, of total assets, which is
relatively lower than those for Belgium firms (17 percent and 10 percent, respectively, as documented by Deloof
(2003)). The accounts payable is almost 8 percent of total assets for the GCC firms, while it is 13 percent for
Belgium firms. Hence, it is evident that the mean value of the components of the current asset and the trade policy
proxies is relatively lower than those that are reported in the literature.
3.2 Correlation Analysis
To visualize the relationship among the studied variables, table (2) shows the results of the Pearson correlation
among trade debtors, trade credit, debt level, profitability, Tobin’s Q, and inventory period. From table (2), none of
the variables have a correlation of more than 27 percent (about 50 percent is the cut-off rate), which negates the
multicollinearity problem among the study variables. Also, the table shows a negative correlation between each of
the trade policy proxies and the accounting profitability measure as well as with the size variable of the GCC firms.
On the other hand, a positive relationship exists between Tobin’s Q (a market performance measure) and the number
of days a firm takes to pay its payables. Moreover, the relationship between the trade policies themselves is low. The
result in Table 2 implies illogical form of relationships for some of the variables. For example, the theory of the
working capital calls for a positive relationship between trade credit and firm performance, while it is negative with
respect to ROA, but not with Tobin’s Q. Also, the trade debtor proxy has a negative correlation with firm profitability
and Tobin’s Q, which is against the postulates of the working capital theory and the empirical evidence. In addition,
the low correlation among the three trade policy proxies might indicate a dearth in conducting an effective short-term
financial planning. All in all, these preliminary unformal results imply startling study results.

http://ijfr.sciedupress.com International Journal of Financial Research Vol. 11, No. 5; 2020
Published by Sciedu Press 48 ISSN 1923-4023 E-ISSN 1923-4031
Table 2. The Correlation Analysis
INVP APP ARP PROF Q DR SIZE
INVP 1
APP 10.24% 1
ARP 0.21% 26.73% 1
PROF -26.45% -5.34% -18.68% 1
Q -6.98% 3.26% -19.34% 19.31% 1
DR -14.09% 1.34% 15.96% 18.58% -7.96% 1
SIZE -18.56% -16.29% -18.16% 16.72% 6.22% 41.86% 1
TQ is Tobin’s Q = (market value of equity + total assets - equity) / total assets; Prof is profitability = operating income / total assets; APP is accounts payable period = accounts payable / (Sales / 365); DR is debt ratio = debt / total assets; Size = log (sales)
4. Results and Discussion
This paper investigates the relationship between corporate performance and the efficiency of managing trade debtor, trade credit, and inventory. Table (3) shows the effects of the accounts payables period (a popular measure of trade credit management efficiency), the inventory period (a popular measure of inventory management efficiency), and the accounts receivable period (a popular measure of trade debtor management efficiency) on corporate performance for a set of GCC nonfinancial firms.
The first set of regressions – the fixed-effect model, the variable effect model, and the pooled model – employ Tobin’s Q as the performance measure. The second set of regressions are similar to the first set, but the performance measure employed is the operating income divided by total assets. The GMM estimator comes as the last regression model and it employs Tobin’s Q as the performance measure. In panel (A), all regression models show, as conjectured by the paper, that there is either insignificant effect of the accounts payable period on both Tobin’s Q and profitability, or at best, there is a trivial effect of the trade credit on corporate performance.
Specifically, when employing the accounting profitability measure, none of the regression models show a significant effect of trade credit on GCC corporate performance (all p-values are above 50 percent). However, when employing Tobin’s Q as the performance measure, there seems to be a significant effect of the trade credit on firm performance, although that effect is very minimal, as the coefficient is almost zero. This result comes at odds when compared (for example) with that of Deloof et al. (2003) where the coefficient of trade credit is 0.54 and the coefficient of the number of days in inventory is 0.25. So, an increase in APP by one day would result in an increase by only 0.0001 (i.e., 0.01 percent) in Tobin’s Q. Regressing the performance measure on only APP, without the control variables, does not change the result in terms of the correct sign, the statistical significance, and the minimal magnitude of the effect, for both sets of regressions.
Following Teruel et al. (2007), one estimation problem that might be relevant is the potential violation of the assumption of strict exogeneity of regressors. Shocks affecting firm performance can also affect some of the regressors such as leverage and firm size. Moreover, it is likely that some of the regressors may be correlated with the past and current values of the idiosyncratic component of disturbances. These problems advocate the use of instrumental variables (IV) estimation method, where the lagged dependent variable and endogenous regressors are instrumented using an appropriate set of variables. To do so, the GMM method of estimation is employed, which provides consistent parameter estimates (see Arellano and Bond, 1991).
Remarkably, employing the GMM model does not change the previous results in terms of the insignificant effect of APP on Tobin’s Q. Both control variables (firm size and debt level) retain their expected sign and significance level which conforms to the related literature. That is, the effect of the debt ratio on corporate performance is negative as it is considered a financial burden. Also, the positive sign of firm size is expected, since large firm size tends to boost firm profitability. To sum up, the results so far partially support the conjecture of this study that the influence of trade credit management efficiency on corporate performance in GCC countries is weak at best. Examining the over-identifying restrictions and whether the employed instruments in the GMM model are independent of the unobservable error process, the Hansen (1982) J-statistic is employed, where its value accepts the orthogonality assumption which indicates the validity of the chosen instruments. Furthermore, the serial correlation test of AR(1) and AR(2) (Arellano and Bond 1991) confirms the inexistence of the serial correlation in the error terms, hence, the moment conditions are correctly specified.

http://ijfr.sciedupress.com International Journal of Financial Research Vol. 11, No. 5; 2020
Published by Sciedu Press 49 ISSN 1923-4023 E-ISSN 1923-4031
Table 3. The effect of APP, IP, and ARP on GCC corporate performance
TQ
Prof
TQ
FE VE Pooled FE VE Pooled GMM
Panel (A)
APP 0.0001 0.0001 0.0001 -0.001 -0.001 0.0001 -0.0002
(0.0120) (0.0570) (0.0010) (0.5310) (0.7020) (0.6580) (0.6970)
DR -0.558 -0.638 -0.749 0.127 0.089 0.208 -0.614
(0.0890) (0.0010) (0.0010) (0.1620) (0.0280) (0.0240) (0.0400)
Size 0.535 0.316 0.239 0.255 0.225 0.107 0.205
(0.0010) (0.0010) (0.0030) (0.0010) (0.0010) (0.0010) (0.1200)
943 943 905 943 943 943 817 Obs.
Adj R2 0.67 0.69 0.02 0.84 0.95 0.06
Panel (B)
IP 0.0001 0.0001 -0.001 0.0001 0.001 -0.001 -0.001
(0.0457) (0.6740) (0.9040) (0.0010) (0.4230) (0.2330) (0.3450)
DR -0.369 -0.576 -0.844 0.106 0.103 0.201 0.827
(0.2340) (0.0130) (0.0010) (0.2050) (0.0010) (0.0030) (0.0100)
Size 0.3 0.252 0.251 251 0.207 0.096 0.215
(0.1040) (0.0040) (0.0010) (0.0001) (0.0010) (0.0010) (0.0880)
1032 1032 1032 1076 1076 1076 997 Obs.
Adj R2 0.7 0.75 0.03 0.93 0.93 0.06
Panel (C)
ARP 0.0001 0.0001 -0.0001 -0.0001 -0.0001 -0.0001 0.002
(0.2390) (0.6010) (0.0010) (0.6770) (0.0010) (0.9920) (0.8620)
DR -0.5 -0.658 -0.862 0.142 0.132 0.169 4.084
(0.0920) (0.0040) (0.0010) (0.0060) (0.0010) (0.0010) (0.0410)
Size 0.489 0.299 0.242 0.422 0.287 0.087 -0.301
(0.0010) (0.0060) (0.0010) (0.0010) (0.0010) (0.0010) (0.4560)
943 943 943 943 943 943 913 Obs.
Adj R2 0.7 0.75 0.03 0.91 0.92 0.04
FE denotes fixed-effect model; VE denotes variable effect model; TQ is Tobin’s Q = (market value of equity + total
assets - equity) / total assets; Prof is profitability = operating income / total assets; APP is accounts payable period =
accounts payable / (Sales / 365); DR is debt ratio = debt / total assets; Size = log (sales); Numbers between
parenthesis are probability values testing the hypothesis the coefficient is zero (p-value); Since we have a
cross-sectional data, heteroscedasticity was found to be significant. And since it is of unknown form, it was corrected
by using White’s (1980) consistent covariance matrix. For the GMM estimation method, (a) Tobin’s Q is employed
as a performance measure, and (b) the weighting matrix is cross-section by white covariance and the Newey west
fixed bandwidth are employed. Lagged values of the variables are used as instruments. The Hansen (1982) J-statistic
as well as the serial correlation test of AR(1) and AR(2) of Arellano and Bond 1991 are carried out and their figures
and saved for brevity.
http://ijfr.sciedupress.com International Journal of Financial Research Vol. 11, No. 5; 2020
Published by Sciedu Press 50 ISSN 1923-4023 E-ISSN 1923-4031
Panel (B) in Table 3 demonstrates the results of regressing corporate profitability on the inventory period and the
control variables for all nonfinancial GCC firms. Employing different regression tests, the results, overall, show that
the effect of inventory period on corporate performance is very inconsequential or insignificant and sometimes does
not hold the predicated sign.
For example, when considering the fixed effect regressions on both performance measures, the effect of the
inventory period appears to be significant (at 5 percent significance level), however, the magnitude of the effect is
trivial (= 0.0001). Also, it does not hold the correct sign. Other regressions also show the insignificant effect of
inventory period on profitability and market value of firms in GCC countries. The influence of the control variables,
in total, appears to be valid, and in line with the theoretical propositions in the literature.
Panel C, in Table (3), shows the results of testing the effect of the trade debtors on corporate performance in GCC
countries. Analogous to the findings in panels A and B, the effect appears to be insignificant. Although it is
significant in two cases, the magnitude of the effect is very minimal and, in one case, does not hold the correct sign.
For example, the variable model shows that if the ARP declines by 1 day, the operating income on assets tends to rise
by 0.0001 (i.e. 0.01 percent), which is numerically (in magnitude) insignificant. The control variables retain their
validity in almost all models.
Again, the GMM estimation method is carried out to consider the probable endogeneity problem which might skew
the previous results. The GMM method results are contained in the last column in Table 3. All relative variables are
regressed against Tobin’s Q. The results of the GMM almost confirm what the previous models have already
established, in that the effect of trade debtor, inventory policy, and trade credit on firm performance in GCC
countries is at most very minimal or, in most cases, insignificant.
Two notable remarks before this section is wrapped up. First, when the related variables are regressed against
operating return on assets using the GMM procedure, the results are similar to those of Tobin’s Q, hence, they are
retained for brevity. Second, another regression was carried out that tests whether there are any differences in results
with respect to each of the firms in each GCC country. The test results show a very similar conclusions to those in
the Table (3) concerning the effect of each of the related variables on corporate performance, hence, all results are
concealed for brevity reasons.
4.1 A Robust Check
One important validation to the previous results is a distinct statistical method that considers the different effects of
trade policies across the spectrum of firm performance. This provides a better characterization and description of the
available data. The quantile regression method considers and estimates the complete heterogeneous conditional
distributions of the firm performance variable. Also, it is robust to the outliers as it fits several percentiles (i.e., 90th,
50th, 20th, …. etc.). All in all, the quantile regression serves an important and essential purpose by giving a more
comprehensive picture of the different effects of the trade debtors, inventory policy, and trade credit on firm
profitability.
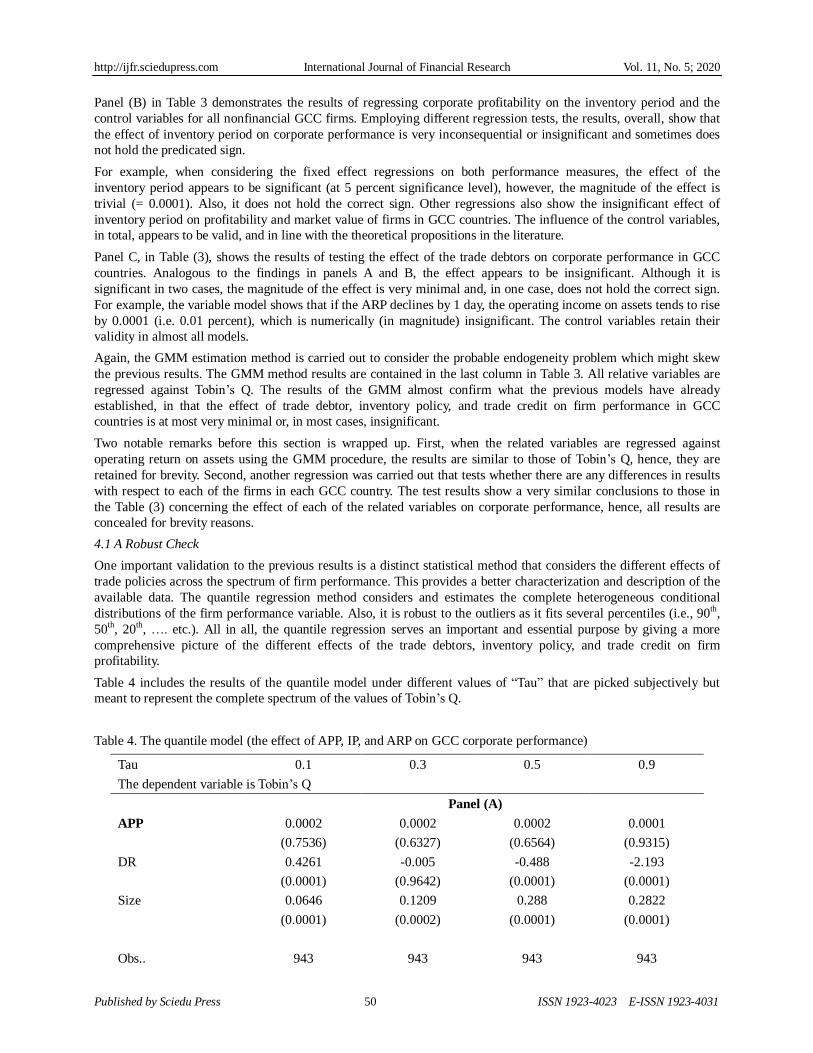
Table 4 includes the results of the quantile model under different values of “Tau” that are picked subjectively but
meant to represent the complete spectrum of the values of Tobin’s Q.
Table 4. The quantile model (the effect of APP, IP, and ARP on GCC corporate performance)
Tau 0.1 0.3 0.5 0.9
The dependent variable is Tobin’s Q
Panel (A)
APP 0.0002 0.0002 0.0002 0.0001
(0.7536) (0.6327) (0.6564) (0.9315)
DR 0.4261 -0.005 -0.488 -2.193
(0.0001) (0.9642) (0.0001) (0.0001)
Size 0.0646 0.1209 0.288 0.2822
(0.0001) (0.0002) (0.0001) (0.0001)
Obs.. 943 943 943 943

http://ijfr.sciedupress.com International Journal of Financial Research Vol. 11, No. 5; 2020
Published by Sciedu Press 51 ISSN 1923-4023 E-ISSN 1923-4031
Adj R2 0.04 0.02 0.02 0.04
Panel (B)
IP -0.0002 0.0001 -0.0001 0.0001
(0.3706) (0.7091) (0.4609) (0.5473)
DR 0.4487 0.005 -0.4401 -2.274
(0.0001) (0.9393) (0.0001) (0.0001)
Size 0.0498 0.1526 0.2056 0.3112
(0.0670) (0.0001) (0.0001) (0.0040)
Obs. 1032 1032 1032 1032
Adj R2 0.04 0.02 0.03 0.05
Panel (C)
ARP -0.0001 0.0001 0.0001 0.0001
(0.9632) (0.8482) (0.8800) (0.9412)
DR 0.4475 -0.026 -0.498 -2.354
(0.0001) (0.8073) (0.0001) (0.0001)
Size 0.059 0.1454 0.2248 0.2781
(0.0140) (0.0001) (0.0001) (0.0030)
Obs. 943 943 943 943
Adj R2 0.04 0.02 0.03 0.06
Tau value represents the relative quantile; Tobin’s Q = (market value of equity + total assets - equity) / total assets;
APP is accounts payable period = accounts payable / (Sales / 365); DR is debt ratio = debt / total assets; Size = log
(sales); Numbers between parenthesis are probability values testing the hypothesis the coefficient is zero (p-value);
Estimates use bootstrap method for computing the covariance matrix, with individual sparsity estimates obtained
using kernel methods. The bandwidth uses the Hall and Sheather formula. All estimations identify unique optimal
solution.
Panel A of Table 4 shows the effect of trade credit on Tobin’s Q. The results are analogous to those in Table 3 in that
the effect of the trade credit is insignificant on Tobin’s Q, even when using different quantiles (i.e., 10 percent, 30
percent, 50 percent, and 90 percent). Panels B and C of Table 3 show the results of testing the effect of the inventory
policy and the trade debtors on firm value. All in all, the results show the insignificant influence of the trade policies
on Tobin’s Q for all nonfinancial firms in the GCC countries.
For the control variables, they all retain their significance level and the correct sign according to the theoretical
propositions. Results with respect to the accounting profitability performance measure (operating income/total assets)
are very similar with respect to the significance level, hence they are retained to save space. All in all, the results in
Table 4 also confirm the conclusions from previous results for firms in GCC countries in that there is an insignificant
effect of the trade debtors, inventory period, and the trade credit on the GCC corporate performance.
4.2 Discussion of the Results
The above results contradict both the working capital theory propositions and the previous empirical evidence
brought up by researchers worldwide. See for example Lazaridis et al. (2006), Mansoori et al. (2012), Deloof (2003),
Abdulrahman et al. (2010), and Wasiuzzaman (2015). On the other hand, very few studies have partial support for
the results of this study (Oseifuah (2013) and Barjoktarovic (2014). Although the working capital theory reveals
strong connection between corporate performance and efficient trade policies, it seems to be short with respect to the
interpretation of the weak or absent association between the two. As a result, and due to little existing research about
GCC businesses that the study could draw on, advocated, and educated arguments have to be introduced.

http://ijfr.sciedupress.com International Journal of Financial Research Vol. 11, No. 5; 2020
Published by Sciedu Press 52 ISSN 1923-4023 E-ISSN 1923-4031
First of all, it is probable that the main line of reasoning behind the distinct results in Tables 3 and 4 relates basically
to what Hofstede (1983) and Lazarsfeld and Merton (1954) put forth, in that different business settings lead to
different managerial practices and attitudes due to some country-specific merits. The business environment in GCC
countries is such that GCC governments tend to shelter the private sector, including all business concerns, by
providing lavish subsidies, especially to listed firms. Halaoui et al (2017) confirm that governments across the GCC
countries dominate the economy and that GCC states heavily embrace and bolster their private-sector involvement in
their economies by billions of dollars every year. Also, according to an IMF “Policy Consultation” report (1996),
subsidies in GCC countries have evolved over the years with a broad objective of mainly supporting private sector
(listed firms). The most common forms of the lavish subsidies are tax exemption (GCC economies are tax-free),
subsidized costs of utilities, possession of free lands, and the most important are the constant business tenders, to the
point that GCC firms often merely function as intermediaries for foreign companies, who provide most of the actual
goods and services demanded (Hertog 2013). This results in creating an environment where corporate managers
become unconcerned about financial constraints. One consequence is that corporate managers consider trade policies
to be of less importance. That is, the mindset of GCC firm managers is predisposed to adopt a practice through which
they can receive ample and quick financing when their firms face short-term financial constraints, as they expect
over-the-top support from government in the form of acceptance of lavish bids, which can be extremely helpful in
resolving short-term financial constraints. Hence, instead of worrying about optimally managing short-term trading
policies (trade debtors, inventory, and trade credit) to assist in providing short term financing, managers tend to
solicit hidden financial support from over-generous governments, and that support is considered to be continuous
inexpensive short-term (and long-term) financing. Therefore, managing short-term trade policies efficiently becomes
less enviable. The end result would be a negligible association between trade policy proxies and corporate
performance, as the results in Tables 3 and 4 show. This conjecture is supported by what Nobanee et al. (2015) find
that the net trade cycle – one measure of trade policies – has a negligible impact on the corporate performance of
small construction firms in Kuwait. Almazari (2014) also documents an insignificant relation between working
capital management, proxied by the ratio of cash conversion cycle, and the corporate performance of the Saudi
cement firms.
The above scenario of the GCC business setting leads to the second practical argument, which is the reduced need to
practice the optimal financial procedure with respect to having a forecasted financial plan, i.e., to provide the usual
cash budget and proforma financial statements. The support of this argument comes from the empirical evidence
provided by Hertog (2013) who shows that most publicly listed GCC companies are often not run in line with
international standards of corporate management. Also, Almutairi et al. (2009) document that Kuwaiti nonfinancial
firms are deficient in applying the financial management planning tools in many aspects, indicating a lack of proper
financial planning. This distinct environment could result in driving the values of the current assets (hence trade
polices) to be most likely swinging up and down, which would probably render their association with corporate
performance negligible, if any.
In relation to the second argument, the third argument is that financial constraints are not of concern to GCC
corporate managers, who, consequently, do not see a necessity for developing financial planning tools. This is due to
two reasons. The first relates to the provision of lavish financing from the government. The second lies in the fact
that GCC banks exceedingly practice “relationship lending” – as opposed to focusing exclusively on “fundamental
and cash-flow analysis” – where repeated interaction with corporate borrowers enables GCC banks to adapt lending
terms accordingly. This is in line with the “helping hand” hypothesis which stresses the role of “relationship lending”
in facilitating short-term financing (Chemmanur and Fulghieri, 1994). Sette and Gobbi (2015) also document that
companies with extended lending relationships have easier access to credit at lower lending cost. In fact, GCC
countries are bank-oriented systems when it comes to corporate financing (bonds issues are highly uncommon) with
instant access by the GCC firms to the highly capitalized banks (Alshammari, 2017). All in all, the close relations of
corporate managers with bankers ensures ample financing once needed. Furthermore, most banks in the GCC
countries are owned by GCC governments as well as by connected ownership of families. The research on the degree
to which financial decisions are influenced by the ownership of families is vast (see for example Kim et al. (2019).
All this creates a state in which corporate managers have no concern to financial constraints, hence, the optimal
financial practices with respect to trade policies becomes of less important.
The fourth argument relates to the relatively recent establishment of stock exchanges in the GCC countries – most of
the GCC stock exchanges were established in the eighties. Hence, the capital market role in economic development
is not completely realized by stock market investors, who, consequently, have misconceptions about the effect of
working capital management on firm value. Because of this, a measure of Tobin’s Q does not appear to capture the

http://ijfr.sciedupress.com International Journal of Financial Research Vol. 11, No. 5; 2020
Published by Sciedu Press 53 ISSN 1923-4023 E-ISSN 1923-4031
theoretical and empirical relation between trade policy proxies and corporate performance. Partial support for this
argument comes from studies of market efficiency in some of the GCC stock exchanges in that investor
consciousness and awareness of the factors that should affect market value are lacking (Andrew et al., 2004).
Similarly, Abuzayed (2012) documents that financial markets sometimes fail to penalize managers for inefficient
working capital management in emerging markets, and he finds an insignificant relation between Tobin’s Q and the
cash conversion cycle, which is a measure of working capital management.
5. Conclusion and Policy Implications
This paper investigates the effects of short-term corporate trade policies on corporate performance for all
nonfinancial firms in the six GCC countries, namely, Kuwait, Saudi Arabia, Bahrain, Qatar, Emirates, and Oman.
This research was carried out by exploring the magnitude of the association between corporate performance and
three proxies of corporate trade policies: trade debtors, trade credit, and inventory policies.
Using panel data methods as well as GMM and quantile regressions, the results found are distinctive as they oppose
the mainstream theoretical propositions that have been established in empirical finance research. Specifically, this
paper upholds a very weak, if any, relationship between corporate trade policies and corporate performance for all
nonfinancial firms in the six GCC countries. The different empirical tests in this paper demonstrate an ascetically
insignificant relationship between corporate short-term trade policies and corporate accounting and market
performance. In the very few cases where the relationship turns out to be significant, the extent of the relationship
can best be described as frail or minimal. The effect of the control variables, the debt ratio, and the firm size appear
clearly to conform to the vast theoretical predictions and follow the majority of the related empirical studies.
The results of this paper confirm the work of Hofstede (1983) that the predictive power of the theoretical
propositions with respect to the influence of trade policies in creating value might differ in different settings and
environments. Business practices and norms, as well as corporate cultures, could affect test results. GCC countries
represent an alliance that is part of emerging markets, hence, the different business norms and values may push
investors to be less than perfect in their evaluation of the relationship between firm market value and short-term trade
decisions. The test results might represent anomalous evidence or an irregularity in financial markets that tend
sometimes to fail to penalize inefficient managers with respect to their negligence of efficient short-term trade
policies.
Although the theory and the empirical evidence in different parts of the world are in consensus regarding the effect of
trade policies on corporate profitability, this study finds that the effect appears to be susceptible to the GCC corporate
sector, as part of the emerging markets. Therefore, nonfinancial firm managers in GCC countries need to pay close
attention to more efficient short-term trade policies in order to improve or boost the shareholders' wealth. Managers
can create additional profits for their firms by correctly handling the trade policies and keeping each different
component (accounts receivables, accounts payables, inventory) at its optimal level. For example, GCC corporate
managers can improve profitability by reducing the credit period granted to their customers, avoiding pilling the
inventory for long period of time, and prudently stretching the time of paying their bills. As a whole, the results in
this paper repudiate the main hypothesis which predicts positive and significant effects of corporate trade policies on
corporate profitability.
The results of this study imply significant corporate policies. Due to the huge investments of GCC firms in working
capital, corporate managers should emphasize the importance of maximizing the benefits of that working capital to
their shareholders. Having a proper amount of working capital items, such as cash and inventories, alleviates the
need of firms to resort too frequently to expensive external finance.
5.1 Limitations and Recommendations
As this study documents new evidence, a valid limitation on this study is stipulated by other variables that could not
be employed, due to their unavailability in the related database. Variables such as other performance measures (e.g.
the stock excess return adjusted for firm size and market to book value) as well as some risk factors, could lay their
effects on the observed results. That is, changes in firm risk could be a plausible explanation for the increase in firm
performance following a working capital decrease/increase. By the same token, the positive/negative effects of
working capital could be significant if the release of cash is deemed as this might allow firms to undertake more
profitable investments. Also, employing the positive or the negative net working capital concepts and relating that to
the amount of capital investments may (or may not) shed more light on the observed findings. Besides, the style of
managing working capital (aggressive vs. conservative) theoretically influences the firm risk, which then impacts the
relationship between working capital and firm performance.
http://ijfr.sciedupress.com International Journal of Financial Research Vol. 11, No. 5; 2020
Published by Sciedu Press 54 ISSN 1923-4023 E-ISSN 1923-4031
The study recommends that further research can be conducted by considering other factors/variables that may signify
the relation between working capital and firm performance. From these factors/variables are the management style,
financial constraints, dividend policy, capital structure, and the legal environment. Also, this study is conducted on
all firms irrespective of their industries. Including the sectors that firms belong to might provide further evidence on
the relationship between corporate performance and working capital policies. Furthermore, the moderating effect of
liquidity requirements on the relationship between working capital and performance could be investigated.
References
Abuzayed, B. (2012). Working Capital Management and Firms’ Performance in Emerging Markets: The Case of
Jordan. International Journal of Managerial Finance, 8(2), 155-179.
Allen, F., Chakrabarti, R., De, S., & Qian, M. (2012). Financing Firms in India. Journal of Financial Intermediation,
21(3), 409-445.
Almazari, A. (2014). The Relationship Between Working Capital Management and Profitability: Evidence from
Saudi Cement Companies. British Journal of Economics, Management & Trade, 4(1), 146-157.
Almutairi, M., Tian, G., & Tan, A. (2009). Corporate Finance Practice in Kuwait: A Survey to Confirm Theory with
Practice. Paper presented at the 22nd Australasian Finance and Banking Conference, Sydney, Australia SSRN.
Alshammari, T. (2017). Performance Differences Between Islamic and Conventional Banking Forms. Banks and
Bank Systems, 12(3), 237-246.
Alshammari, T. (2018). Performance Effects of Working Capital in Emerging Markets. The International Journal of
Economics and Financial Issues, 8(5), 80-87.
Andrew, C., & Higgs, H. (2004). Weak-form Market Efficiency in European Emerging and Developed Stock
Markets. School of Economics and Finance, Queensland University of Technology, Brisbane, Australia.
Barjaktarovic, S., Latinovic, M., & Milosavljevic, M. (2014). Working Capital Management Practices and Financial
Performance: Evidence from Serbia. In M. Jaksic, S. Barjaktarovic & M. Martic (Eds.), Innovative Management
and Firm Performance (pp. 254-275). London: Palgrave Macmillan.
Berryman, J. (1983). Small Business Failure and Bankruptcy: A Survey of the Literature. European Small Business
Journal, 1(4), 47-59.
Boțoc, C., & Anton, G. (2017). Is Profitability Driven by Working Capital Management? Evidence for High-Growth
Firms from Emerging Europe. Journal of Business Economics and Management, 18(6), 1135–1155.
Chemmanur, T., & Fulghieri, P. (1994). Reputation, Renegotiation and the Choice between Bank Loans and Publicly
Traded Debt. Review of Financial Studies, 7, 475-506.
Chung, K., & Stephen, P. (1994). A Simple Approximation of Tobin’s Q. Financial Management, 23(3), 70-74.
Cristea, C., & Cristea, M. (2016). The Impact of the Working Capital Management on Firm Profitability in the
Romanian Manufacturing Industry. Annals of the University of Oradea, Fascicle of Management and
Technological Engineering, 2, 107-110.
Deloof, M. (2003). Does Working Capital Management Affects the Profitability of Belgian Firms?. Journal of
Business Finance & Accounting, 30(3), 573-87.
Duggal, R., & Budden, M. (2015). Further Evidence of the Creation of Value Through the Management of Net
Working Capital: An Analysis Of S&P 500 Firms. Journal of Business and Economics Research, 13(1), 79-82.
Dunn, P., & Cheatham, L. (1993). Fundamentals of Small Business Financial Management for Start-up, Survival,
Growth, and Changing Economic Circumstances. Managerial Finance, 19(8), 1-13.
Enqvist, J., Graham, M., & Nikkinen, J. (2014). The Impact of Working Capital Management on Firm Profitability in
Different Business Cycles: Evidence from Finland. Research in International Business and Finance, 32, 36-49.
Halawi, H., Ghazaly, S., Aly, K., Malek, J., & Samad, R. (2017). Private-Sector Participation in the GCC. Research
paper by Strategy& (formerly Booz & Company).
Hertog, S. (2013). The Private Sector and Reform in the Gulf Cooperation Council. A research paper written under
the auspices of the Kuwait Program on Development, Governance and Globalisation in the Gulf States at the
London School of Economics and Political Science with the support of the Kuwait Foundation for the
Advancement of Sciences.
http://ijfr.sciedupress.com International Journal of Financial Research Vol. 11, No. 5; 2020
Published by Sciedu Press 55 ISSN 1923-4023 E-ISSN 1923-4031
Hofstede, G. (1983). The Cultural Relativity of Organizational Practices and Theories. Journal of International
Business Studies, 14(2), 75-89.
Hyland, D. (1997). Why Firms Diversify: An Empirical Examination. A Doctoral Dissertation, Ohio State
University.
Kim, S., & An, Y. (2019). Influence of Family Ownership on Earnings Quality. Asian Journal of Business and
Accounting, 12(2), 61-92.
Lazaridis, I., & Tryfonidis, D. (2006). Relationship Between Working Capital Management and Profitability of
Listed Companies in the Athens Stock Exchange. Journal of Financial Management and Analysis, 19(1), 26-35.
Lazarsfeld, P., & Merton, R. (1954). Friendship as a Social Process: A Substantive and Methodological Analysis.
Freedom and Control in Modern Society, 18, 8-66.
Lindenberg, E., & Ross, A. (1981). Tobin’s Q Ratio and Industrial Organization. Journal of Business, 1-32.
Linh, N., & Mohanlingam, S. (2018). The Effects of Cash Conversion Cycle on Profitability: An Insight into the
Agriculture and Food Industries in Thailand. Asian Journal of Business and Accounting, 11(1), 97-119.
Nobanee, H. E., & Ellili, N. O. (2015). Working Capital Management and Performance of Kuwait Construction
Companies. Corporate Ownership & Control, 12(2), 349-355.
Oseifuah, E., & Gyekye, A. (2017). Working Capital Management and Shareholders' Wealth Creation: Evidence from
Non-Financial Firms Listed on the Johannesburg Stock Exchange. Investment Management and Financial
Innovations, 14(1), 80-88.
Sette, E., & Gobbi, G. (2015). Relationship Lending during a Financial Crisis. Journal of the European Economic
Association, 13(3), 453-481.
Shin, H., & Soenen, L. (1998). Efficiency of Working Capital Management and Corporate Profitability. Financial
Practice and Education, 8(2), 37-45.
Teruel, G., & Solano, M. (2007). Effects of Working Capital Management on SME Profitability. International
Journal of Managerial Finance, 3(2), 164-177.
Thuvarakan, S. (2013). Impact of Working Capital Management on Profitability in UK Manufacturing Industry.
Master Thesis, London South Bank University.
Wasiuzzaman. Sh. (2015). Working Capital and Firm Value in an Emerging Market. International Journal of
Managerial Finance, 11(1), 60-79.
Copyrights
Copyright for this article is retained by the author(s), with first publication rights granted to the journal.
This is an open-access article distributed under the terms and conditions of the Creative Commons Attribution
license (http://creativecommons.org/licenses/by/4.0/).