Embed Size (px)
Citation preview
Are the stock markets “rigged”?
An empirical analysis of regulatory change*
Stephen F. Diamond Santa Clara University
Jennifer W. Kuan Tulane University
Revised: December 21, 2017
Original: April 2017
Abstract: Volatile events in the stock market such as the 2010 Flash Crash have sparked concern that financial markets are “rigged” in favor of trading firms that use high frequency trading (“HFT”) systems. We analyze a regulatory change implemented by the SEC in 2007 by examining its effect on a key market metric, the bid-ask spread, an investor cost, and find that the regulatory shift, indeed, disadvantages investors. We link the implementation of this change to a shift in the volume of trades from a low-cost venue to a high-cost venue. We argue that this outcome is predicted by the incentives of the venues, non-profit stock exchanges owned by different types of members. The less-volatile, lower-cost New York Stock Exchange was owned by underwriters and included a specialist system that is less vulnerable to HFT tactics that can disadvantage investors.
Key words: stock market, high frequency trading, flash crashes, non-profit, SEC
*The authors wish to express their appreciation for comments received from Ran Abramitsky, Emek Basker, Janet Bercovitz, Shane Corwin, Kira Fabrizio, Deepak Hegde, Ha Hoang, Peter T. DeMarzo, Albert J. Menkveld, Minh T. Ngo, Joanne Oxley, Robert Seamans, David N. Smith, Lawrence Wu, Rosemarie Ziedonis, and Arvids Ziedonis, and from participants in conferences and workshops at Berkeley, Harvard, the New School, Northwestern, Santa Clara, Stanford, Tulane, and Yale.
2
I. Introduction
On May 6, 2010, a dramatic price drop, now known widely as the “Flash Crash,”
shocked major stock indices in the United States. Within five minutes nearly 1000 points
had been wiped off the Dow Jones Index - approximately $1 trillion or 9% of its value.
Yet, within the following fifteen minutes, the Index regained the bulk of those losses.
Such an extreme volatility event should be exceptionally rare, if not impossible, and yet it
happened. Smaller versions of the Flash Crash now occur on a regular basis in the capital
markets typically hitting individual stocks. One study discovered more than 5,000 such
“mini flash crashes” during a four-month period (Golub et al. 2012). Coincident with the
appearance of incidents of extreme market volatility is the new dominance of so-called
high frequency trading (“HFT”) systems. Firms deploying these computerized order
systems are now responsible for more than 60% of the trading volume in U.S. listed
stocks. HFTs engage in a range of complex trading tactics that take advantage of the new
equally complex structure of the capital markets. There is some evidence that the
mechanisms used by HFTs contribute to flash crashes. This has led some to charge that
the stock markets are now “rigged.” (Lewis 2014) We trace the emergence of extreme
volatility and concerns about HFTs to an important regulatory change implemented by
the Securities and Exchange Commission (“SEC”) in 2007. We measure the impact of
this change empirically by examining its effect on a key market metric, the bid-ask
spread, and find that the regulatory shift, indeed, disadvantages investors.
Until relatively recently, U.S. stock exchanges shared much in common with
other regulated utilities. Exchanges were private firms that served an important public
function but could have monopolistic tendencies. Indeed, from its founding in the late
3
18th century until approximately 2007, the New York Stock Exchange (NYSE) enjoyed
near-monopoly status, listing a set of stocks and executing the vast majority of trades for
those stocks. The Nasdaq, once it emerged in the 1970s, also achieved a near monopoly
for a separate set of stocks that it listed.
Now, however, less than one-fifth of the trades of NYSE-listed stocks take place
on the NYSE. The bulk of trading is now spread across as many as a dozen different
trading venues, including so-called “dark pools” which do not share pricing data with
other venues. This complex trading architecture enables HFTs to jump ahead of other
investor orders or to create a false impression about the level of demand for certain stocks
that can lead to trading profits for the HFT firms.
However, these stock exchanges differed from typical regulated utilities in two
ways that have important implications for regulation beyond this narrow context.
Specifically, both were member-owned nonprofit organizations and both contained self-
regulatory functions. Nonprofit ownership raises analytical challenges in characterizing
the incentives of an organization (Hansmann, 1980) and self-regulation complicates the
effect of public regulation, which could either be a complement or a substitute for private
ordering (DeMarzo et al., 2005). More broadly, while nonprofits might seem rare targets
of regulation, they appear surprisingly often in such diverse settings as energy markets,
health care, education, professional associations, industry trade groups and more.
How does nonprofit ownership affect self-regulation and public regulation? The
stock market and a 2007 regulatory change, Regulation NMS (Reg. NMS), provide an
opportunity to show how nonprofit incentives can be analyzed and understood in a
regulatory context. Previous studies have explored the nonprofit organization of stock
4
exchanges2 but focused on their stock-trading function, such that the NYSE and Nasdaq
were assumed to have identical objectives. However, an important finding of the
nonprofit literature is that nonprofits can have heterogeneous objective functions even
within the same industry or market (Hansmann, 1980; Gertler and Kuan, 2008). Existing
models also overlook the fact that exchanges are two-sided markets (Parker and Van
Alstyne, 2005; Rochet and Tirole, 2003), serving not just investors but also firms that list
their shares. Combining these two observations, we posit an NYSE owned by
underwriters who service listed firms (and therefore investors, as well), and a Nasdaq
owned by broker-dealers who service only investors.3
The incentives of two such exchanges differ substantially from each other. The
agency problem between a broker-dealer and investors in a broker-dealer-owned
exchange is modeled in the literature (DeMarzo et al., 2005). By contrast, an underwriter-
owned exchange involves the vertical integration of an input (Kuan, 2001). That is,
underwriters operate a marketplace to increase the value of their underwriting services.
(Below, we describe in some detail how orderliness in trading can attract investors, i.e.,
customers for underwriters’ clients). The resulting incentive difference thus leads to a
predictable performance difference between the two exchanges. A broker-dealer-owned
2 Pirrong (2000) and Hart and Moore (1996) examine the reasons for nonprofit organization; and a literature on demutualization explores the role of technology in exchanges demutualization (Aggarwal, 2002; Steil, 2002; Stoll, 2002) 3 Institutional details are informative. Prior to its 2006 IPO, underwriters dominated the NYSE (Gasparino, 2007; Harris, 2010; NYSE, 2006) and listed only those firms that met stringent, formal listing requirements. Long before the federal regulation of disclosures to investors, the NYSE mandated disclosures by their listed firms, following the “due diligence” practices developed by underwriting banks (Loss and Seligman 2001; Carrosso 1970). By contrast, the Nasdaq - an acronym for the National Association of Securities Dealers Automated Quotation system - is a computer network that knits together a loose confederation of broker-dealers. The Nasdaq evolved out of the older over-the-counter market, which traded unlisted securities. Once established as a venue for listing, its culture of trading weaker firms continued, with minimal listing standards.
5
exchange would maximize profits from investors’ trades, while a vertically integrated
exchange would offer trading services at a lower cost, possibly even below cost in a two-
sided market (Rochet and Tirole, 2003). In short, the Nasdaq would provide higher-cost
services than the NYSE.
Reg. NMS allows for a test of this hypothesis. Before 2007, a “best price rule”
required brokers to route trades to the venue with the best posted price. For NYSE-listed
stocks, this was typically the NYSE, so 80% or more of NYSE-listed stock trades took
place on the NYSE, with the other 20% performed by smaller, regional exchanges and
the Nasdaq.4 Reg. NMS replaced this rule and allowed brokers to route orders to the
Nasdaq despite a better price on the manual trading floor of the NYSE.5 Only orders
placed on automated exchanges would now be protected against “trade throughs.”
This regulatory change accommodates a difference-in-differences analysis. In the
pre-change period, any Nasdaq trading of NYSE-listed stocks had to be at the NYSE
price or better. Thus, prices were constrained by regulation to be equal, while post-
change prices are de-constrained. We predict higher investor costs for the de-constrained,
post-Reg. NMS Nasdaq trades in NYSE-listed stocks. Using stock trade data from a
sample of over 200 NYSE-listed stocks 30 days before and after Reg. NMS, we show
that spreads, a commonly used measure of investor cost, increase for trades on the
Nasdaq relative to the NYSE.6
4 The best price rule explains, in large part, why the NYSE so long dominated trading of NYSE stocks. Nasdaq had a monopoly in trading Nasdaq stocks because the NYSE did no trading of Nasdaq stocks. 5 Specifically, the trade-through provisions of Reg. NMS require brokers to route orders to the automated venue posting the best price. The floor of the NYSE is not automated as are the Nasdaq and the newest entrants, electronic communications networks (ECNs). The rule change was intended to give investors a choice, allowing them to choose the faster trade execution enabled by automation even though it might come at the expense of a better price. 6 An important question is why investors would choose a high-cost venue over a low-cost venue. While some of the shift in volume was perhaps due to investors choosing faster execution over better prices,
6
The literature offers several alternate hypotheses about the impact of Reg. NMS.
First, regulators predicted that competition would lead to lower costs for investors (SEC,
2005b). Second, “cream-skimming” could occur in which an entrant, the Nasdaq, siphons
off high-profit, uninformed, trades leaving lower-profit trades with the incumbent NYSE.
This would raise investor costs at the NYSE (Bessembinder and Kaufman 1997; Easley
et al. 1996; Battalio et al 1997).7 Third, auction (dealer) markets might be better than
dealer (auction) markets, in general (Huang and Stoll 1996; Affleck-Graves et al. 1994;
SEC 2004). Our test does not quite address this last hypothesis because the design details
of any auction or dealer market influence performance so significantly that we cannot
claim to compare these two mechanisms in the abstract. Rather, we argue that owners
make design choices based on their incentives and our analysis compares two realized
sets of design decisions.
The dramatic changes in stock market structure since our period of analysis might
suggest that this analysis is of historical interest only. Exchanges have proliferated,
technology has made floor trading seem more archaic than in 2007, and neither the
NYSE nor the Nasdaq is, any longer, a nonprofit. However, while a complete analysis of
the current industry structure is beyond the scope of this paper, we would argue that our
analysis actually helps explain today’s often bewildering stock market by reinterpreting
the institutional design and self-regulation of the NYSE as part of a vertically integrated
earlier “cream-skimming” studies predict that volume would shift to electronic trading venues that pay brokers to route uninformed trades to their higher-cost venues, i.e., “payment for order flow.” An “arms race” among high frequency traders (HFTs) emerged to profit from this “cream,” contributing additional trading volume to the automated venues (Budish et. al, 2015). 7 SEC Rule 19c-3 allowed dealers to pay to shift profitable “uninformed” trades to non-NYSE venues but only applied to certain NYSE stocks. This restriction makes a difference in differences comparison possible. Battalio et al. (1997) find that after the profitable, small-sized, uninformed trades moved to alternative venues, spreads increased for the NYSE stocks that were included in the Rule, but the analysis did not decompose the trades by venue to identify which trades had caused the increase.
7
system where private incentives generated a low-cost, orderly market that attracted
investors and listings. More broadly, our study suggests that the incentives of nonprofits
should be carefully considered because they may differ from those of for-profits and even
other nonprofits in the same market, and that these incentives, which are susceptible to
analysis, can affect self-regulation and the effectiveness of public regulation.
II. Background
The NYSE formed over 200 years ago when traders began gathering informally
near what is today Wall Street in New York City. Michie (1987) and Geisst (1997) detail
the long historical process of institutional change at the Exchange, which included
moving trading activity indoors, formal incorporation, competition with a variety of
formal and informal exchanges, and the adoption and adaptation of mechanisms, rules,
and procedures, including restrictive membership and listing requirements. Thus, trading
on the Exchange was limited to the carefully vetted owners of 1,366 “seats,” a number
that was set in the mid-20th century and remained the same until the Exchange’s
demutualization in 2006. Its listing standards meant that only a limited subset of publicly
traded firms could sell their shares on the Exchange.
Emerging from a longstanding but informal over the counter (“OTC”) trading
market, the Nasdaq began formal operation in 1971 with the expectation that it could
compete with the NYSE if the barriers between OTC and exchange-listed securities were
removed. The Nasdaq comprises broker-dealers connected initially by telephone and later
by a computer network. It was immediately more inclusive than the clubby NYSE. Thus,
even unprofitable firms could trade on this market, and dealers needed only be members
of the NASD to participate in that trading. By the mid-1990s the NASD had 5,400 firms
8
with more than 57,000 branch offices and “nearly 500,000 registered securities
professionals.” (NASD Report cited in Loss and Seligman 2006 at 703) With more than
5,500 listed companies, Nasdaq dealers in the mid-1990s traded in the stocks of more
than twice as many firms as the NYSE. The Nasdaq’s listing standards were far laxer
than those at the NYSE, which reflected the entity’s origins in the weakly regulated OTC
market. One study, for example, found the NASDAQ’s standards to be “partially
responsible for the influx of poorly-performing IPOs during the Nasdaq market bubble of
the late 1990s.” (Klein and Mohanram 2008)
While the original goal of the Nasdaq to engage as a direct competitor in trading
of NYSE listed securities was long delayed, the Nasdaq served as a useful complement to
the NYSE. The two exchanges differed in several ways in addition to the significantly
larger number of listings on the Nasdaq. Quality seemed to be lower at the Nasdaq, where
the total market capitalization was less than that of the NYSE despite the much greater
number of listed firms. Different trading mechanisms were chosen by each exchange.
Using the computer network that is the foundation of the Nasdaq, dealers take part in
both sides of every trade, buying from sellers and selling to buyers. The NYSE employs a
manual floor trading process that appears to be the outdated holdover of a centuries-old
institution. However, our proposition that trading is an input to underwriting calls for a
closer examination of this key institutional difference from the Nasdaq.
For each listed firm, the NYSE assigns a specialist who conducts trades at a single
trading post where trades in that firm’s shares are executed. The specialist (called a
“designated market maker” in the post-Reg. NMS environment) is subject to rules that
ensure an orderly price discovery process. Under the NYSE’s continuous “double-sided”
9
auction mechanism, the specialist continuously gathers all buy and sell orders and sets a
quote for bids and asks. This quote, by rule, must be close to the previous bids and asks
(NYSE, Rule 104). Buyers are then matched to sellers by the specialist acting as a broker
(or agent). Any unmatched residual is bought (sold) by the specialist acting as a dealer (or
principal) if necessary to maintain a “fair and orderly” market (Exchange Act Sec. 11(b)
and Rule 11b-1; NYSE Rule 104). Note that this differs from the Nasdaq’s pure dealer
mechanism, in which the dealer is the counter-party on both sides of every transaction.
The Nasdaq dealer buys from third party sellers, resells to third party buyers, and thus
profits from a wider spread while not being required to enter the market to ensure
orderliness.
While the privileged information that a specialist enjoys is potentially valuable,
rules and enforcement minimize its exploitation (Mann and Seijas 1991 and Dutta and
Madhavan 1995; Battalio et al. 2007; Madhavan and Panchapagesan 2000, 655; but see
SEC 2005a). If trading is viewed as an input to underwriting, specialists are best
understood as having been, prior to the implementation of Reg. NMS, agents of the
underwriter-owners of the NYSE and rule enforcement can be modeled as the outcome of
a (metaphorical) principal-agent relationship. This is notably different from self-
regulation by Nasdaq members who are peers (SEC, 1996).
An empirical literature has tried to measure the effects of different exchange
features. Bid-ask spreads, for example, a measure of investor cost and disorderliness, are
higher for Nasdaq stocks, but these could be the result of the underlying risk of the stocks
or because of the Nasdaq’s dealer mechanism. Because each exchange long monopolized
trading of (an almost) disjoint sets of stocks, however, direct comparisons of trading
10
mechanisms have been impossible.8 Reg. NMS allows for a better test, as NYSE stocks
now trade freely at different prices on both exchanges.
In replacing the old “best price” rule with what is now known as the “trade
through” rule, Reg. NMS initiated substantial structural changes to the stock market. But
even before Reg. NMS was implemented, change had already begun. The final regulation
was adopted in August 2005; six months later, the NYSE demutualized via a merger with
the publicly traded Archipelago, an ECN (Diamond and Kuan 2006). NYSE members,
thereby, agreed to convert their nonprofit into a publicly traded, investor-owned for-profit
corporation. While Reg. NMS and demutualization might seem to be two unrelated
events, our model of vertical integration suggests otherwise. If underwriters who were
vertically integrated with trading could no longer produce orderliness, they would sell
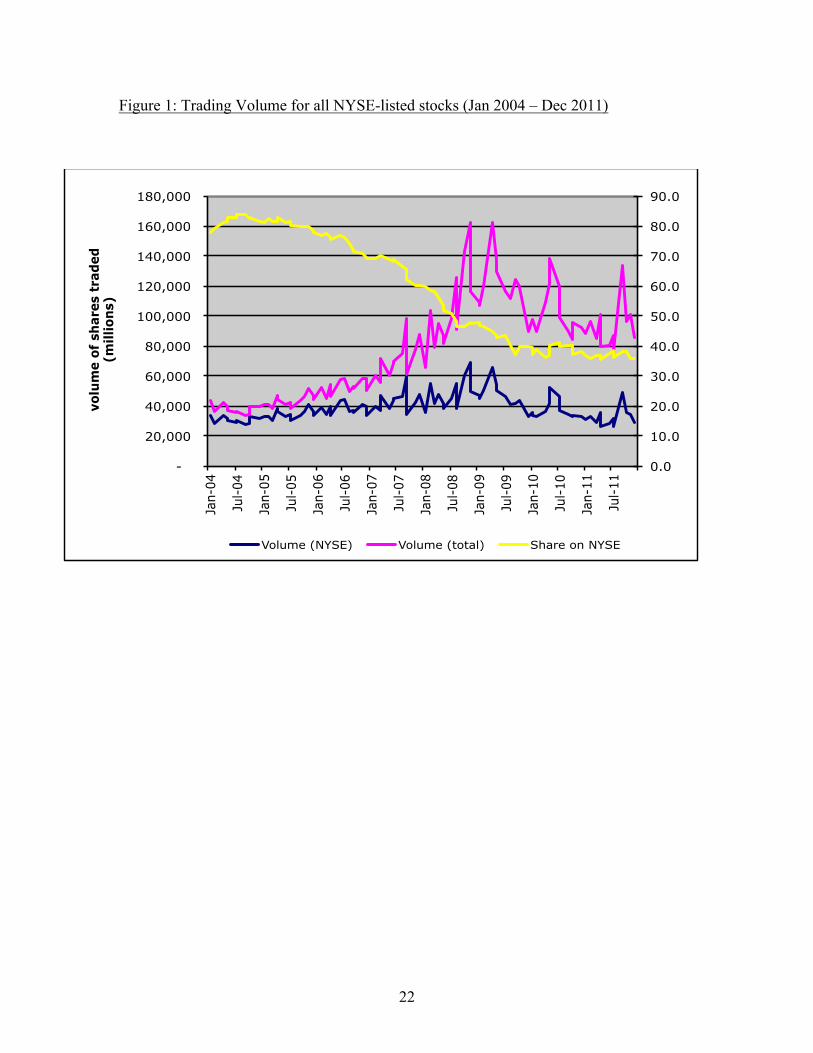
their trading operation. The loss of control over orderliness was predictable; the NYSE’s
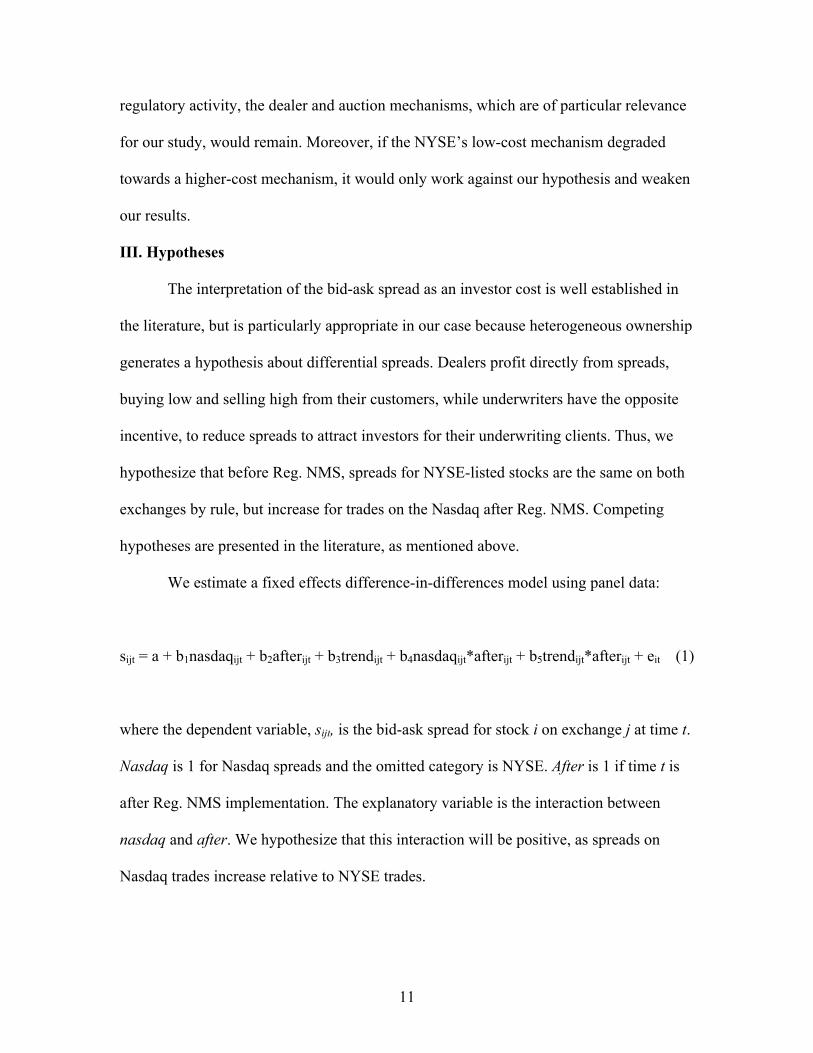
share of trading volume in NYSE listed stocks began a steep decline to 25% (see Figure
1) so that prices of those stocks were no longer set solely by the NYSE.
Final implementation of Reg. NMS took an additional year and a half after NYSE
demutualization, so that at the time of our empirical study, the NYSE and Nasdaq were
both for-profit firms.9 We nevertheless interpret our results as reflecting the incentives of
two different ownership interests, each of which instituted long-lasting mechanisms and
structures that take time to dismantle. So, while a merger might reduce the NYSE’s self-
8 Empirical strategies for comparing mechanisms include using matched pairs of stocks from the NYSE and Nasdaq. This is challenging because NYSE-listed firms have much bigger market capitalizations, which is a match dimension (Huang and Stoll 1996; Affleck-Graves et al. 1994). An alternative uses the relatively few firms that move their listings from the Nasdaq to the NYSE as the basis of comparison (Christie and Huang 1994; Barclay et al. 1998; SEC 2004). The studies find lower bid-ask spreads at the NYSE but are problematic because of selection issues. 9 The NASD began the process of divesting and demutualizing the Nasdaq in 2000, well before Reg. NMS, and finally completed that process at the end of 2006.
11
regulatory activity, the dealer and auction mechanisms, which are of particular relevance
for our study, would remain. Moreover, if the NYSE’s low-cost mechanism degraded
towards a higher-cost mechanism, it would only work against our hypothesis and weaken
our results.
III. Hypotheses
The interpretation of the bid-ask spread as an investor cost is well established in
the literature, but is particularly appropriate in our case because heterogeneous ownership
generates a hypothesis about differential spreads. Dealers profit directly from spreads,
buying low and selling high from their customers, while underwriters have the opposite
incentive, to reduce spreads to attract investors for their underwriting clients. Thus, we
hypothesize that before Reg. NMS, spreads for NYSE-listed stocks are the same on both
exchanges by rule, but increase for trades on the Nasdaq after Reg. NMS. Competing
hypotheses are presented in the literature, as mentioned above.
We estimate a fixed effects difference-in-differences model using panel data:
sijt = a + b1nasdaqijt + b2afterijt + b3trendijt + b4nasdaqijt*afterijt + b5trendijt*afterijt + eit (1)
where the dependent variable, sijt, is the bid-ask spread for stock i on exchange j at time t.
Nasdaq is 1 for Nasdaq spreads and the omitted category is NYSE. After is 1 if time t is
after Reg. NMS implementation. The explanatory variable is the interaction between
nasdaq and after. We hypothesize that this interaction will be positive, as spreads on
Nasdaq trades increase relative to NYSE trades.
12
As a robustness check, we include a time trend variable, trend, the time period in
days. The interaction term trend*after, interacts the time trend with “after Reg. NMS” to
detect whether our results are driven by a general time trend or only begin after the
regulation.
IV. Data
We follow the literature on several dimensions of our empirical strategy. In
addition to measuring daily bid-ask spreads (Corwin and Schultz, 2012) in a differences-
in-differences design, we also use a broad cross section of stocks, decompose the spread
by venue (Bessembinder and Kaufman 1997), and use a 30-day event window. Also, we
use transaction data from the Wharton Research Data Services (WRDS) Trade and Quote
(TAQ) dataset, which provides the timing and size of each trade, the price for each
transaction, and the exchange where the trade took place.
A. Sample
We restrict our attention to NYSE-listed stocks because Reg. NMS affects the
NYSE’s monopoly position in trading, not the Nasdaq. Recall that the Nasdaq’s
monopoly in trading is the result of the NYSE’s organizational design, which provides no
mechanism for trading Nasdaq-listed stocks. We selected a sample of 222 stocks from a
variety of industries in the top quartile of trading volume and market capitalization.
Together, they account for about 15% of the industrial firms listed on the NYSE.
We selected actively traded stocks because of the endogeneity of trading volume
and spreads: on the one hand, liquidity is associated with smaller spreads; on the other
hand, lower spreads might encourage people to trade, thus increasing liquidity. So, if
Reg. NMS caused spreads to decrease, as some of the alternate hypotheses predict, we
13
might worry that the measured decline in spreads was conflating the effect of Reg. NMS
with increased liquidity as lower spreads attracted more investors. By restricting our
attention to stocks that always trade heavily, we minimize the effect of liquidity changes
on spread, and thus also do not control for volume in the regressions. Selecting only
heavily traded stocks addresses a second liquidity problem, as well. If the share of trading
shifted significantly away from the NYSE to the Nasdaq, the decrease in liquidity causes
an identification problem. However, because “liquidity can obtain in fragmented trading,
at least for the most active securities” (O'Hara 2004, 43), we use only heavily traded
stocks to avoid falling below a liquidity threshold.
B. Spread decomposition
For each stock in our sample, we calculate the spread twice for each day: once
using Nasdaq transactions and once using NYSE transactions. Recall that although we
have described the NYSE as having a near-monopoly, 20% of trades of NYSE-listed
stocks had traded on the Nasdaq long before Reg. NMS. So, for each stock on each day,
we can separate Nasdaq transactions from NYSE transactions and calculate a separate
spread for each exchange’s transactions. In this way, we can compare the spread
generated by trading activity on the Nasdaq with the spread generated by trading activity
on the NYSE for the same stock on the same day. We follow Bessembinder and Kaufman
(1997) in decomposing spreads in this manner.
C. Event window
Our time window for analysis is the 30 trading days before and after the
implementation of Reg. NMS, which began on July 9, 2007. While 30 days is a relatively
short time in which to see large changes in market outcomes, the time window is
14
intentionally small in order to isolate the effects of regulatory change from other changes
in the market. Again, to select the size of our event window, we follow existing studies
including Easley et al. (1996), Battalio et al. (1998), Foucault and Menkveld (2008), and
Chung and Chuwonganat (2012) who also study Reg. NMS and find a decline in other
indicators of market quality after its implementation. The SEC also applied a 60-day
event window to its pilot study for Reg. NMS.10
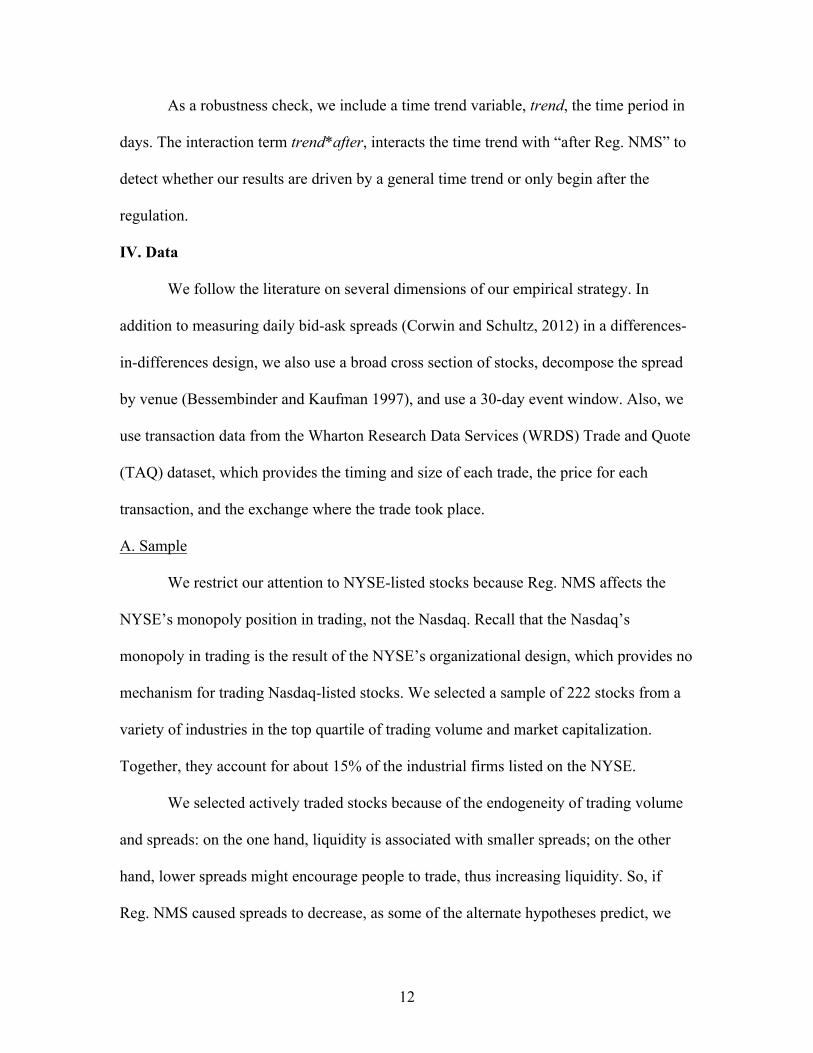
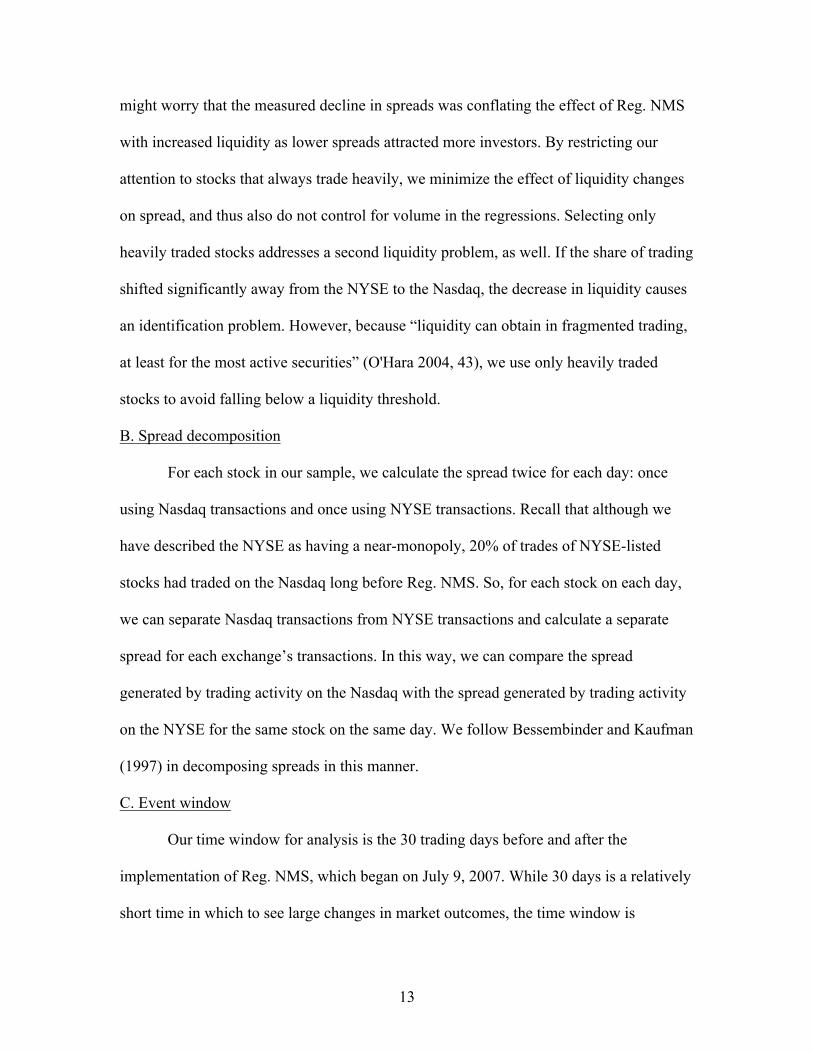
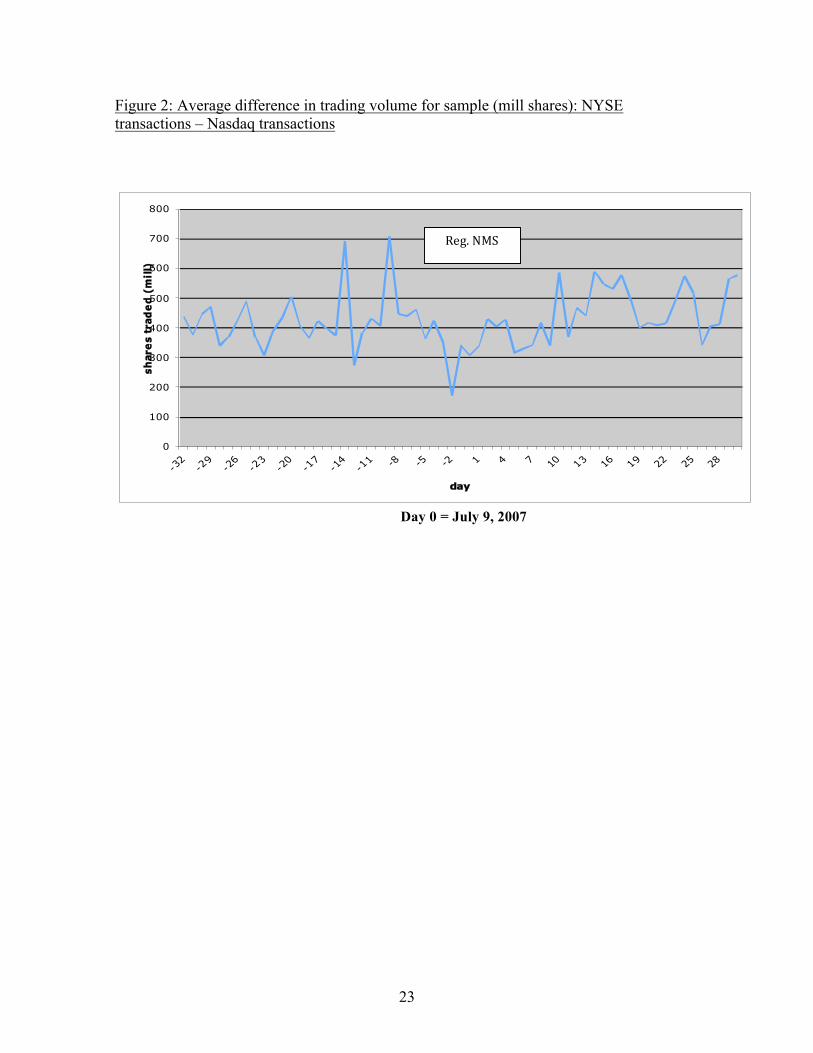
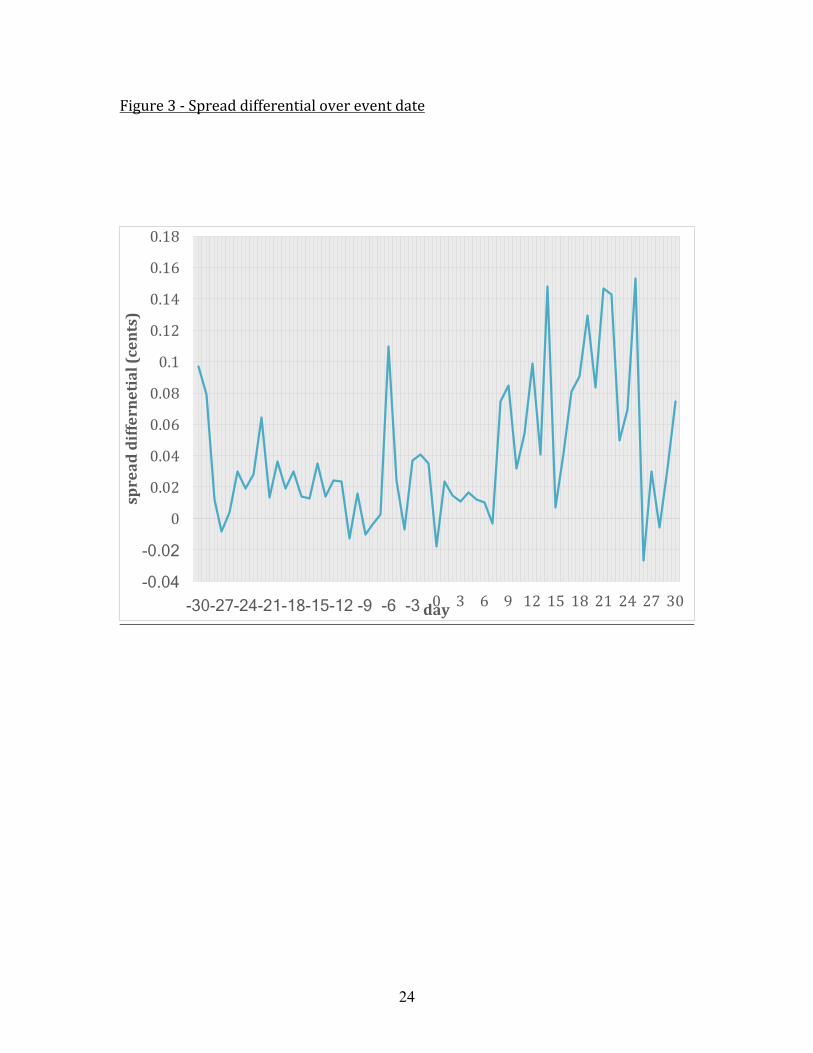
Figures 2 and 3 plot descriptive statistics for our sample over the event window.
Figure 2 shows no appreciable shift in average trading volume for our sample stocks over
the event window—certainly nothing as great as the eventual shift in trading volume seen
in Figure 1. Figure 3 shows our metric of interest, the average spread differentials for
NYSE and Nasdaq transactions for our sample (i.e., Nasdaq spread – NYSE spread). A
slightly higher level after Reg. NMS may be discernable, as is a positive differential even
before Reg. NMS.
V. Results
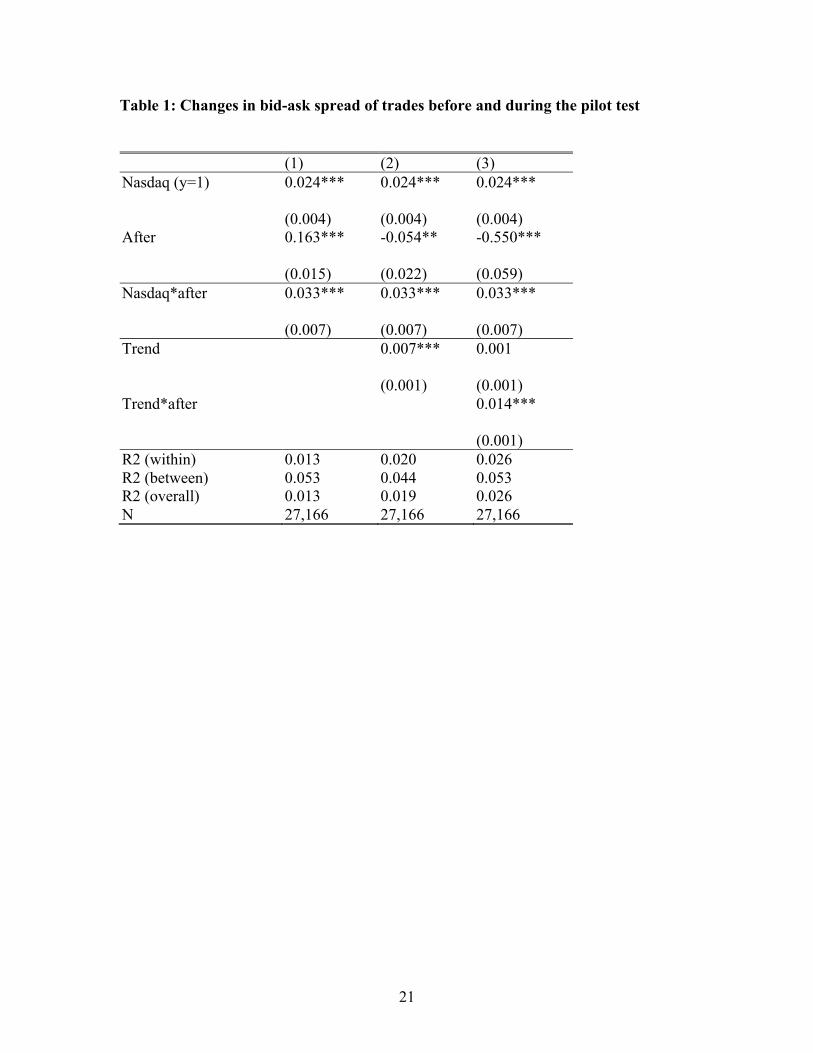
Table 1 presents results from variations of the model in equation (1), where
spread is measured in cents (i.e., calculated spread is multiplied by 100). Model 1 is the
basic specification in equation (1). We find that the interaction term is positive and
significant, indicating that Nasdaq spreads for NYSE-listed shares increase relative to
NYSE spreads after Reg. NMS.
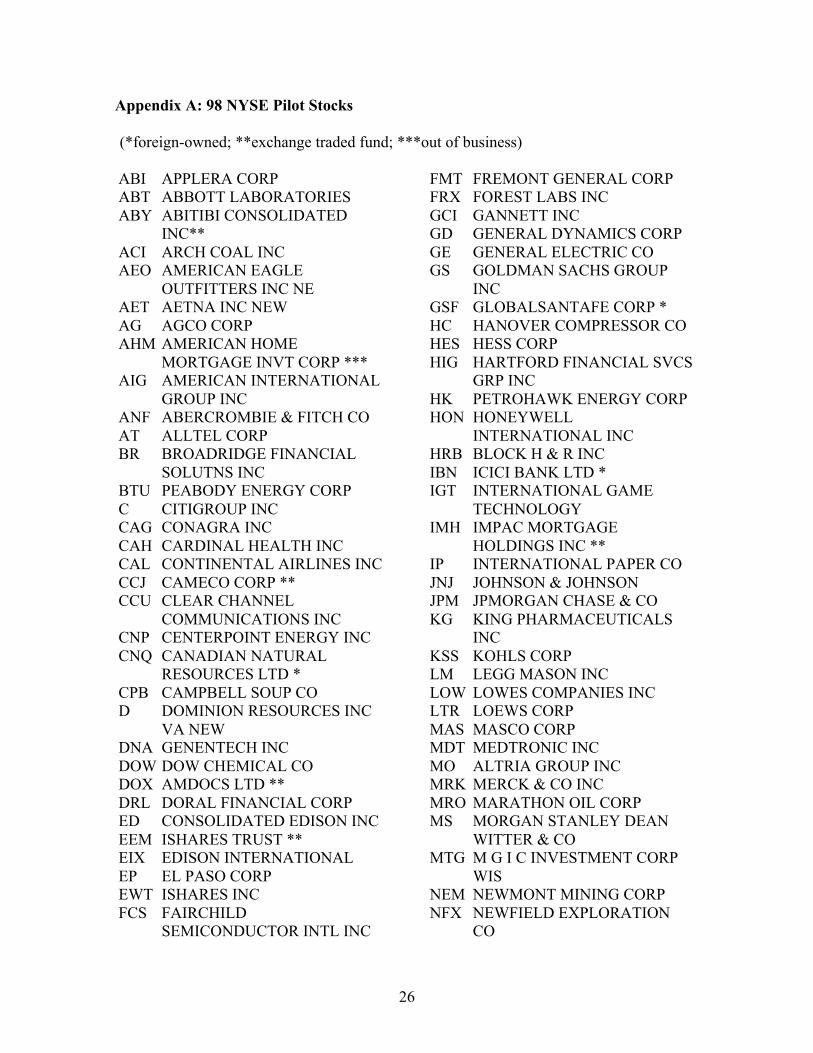
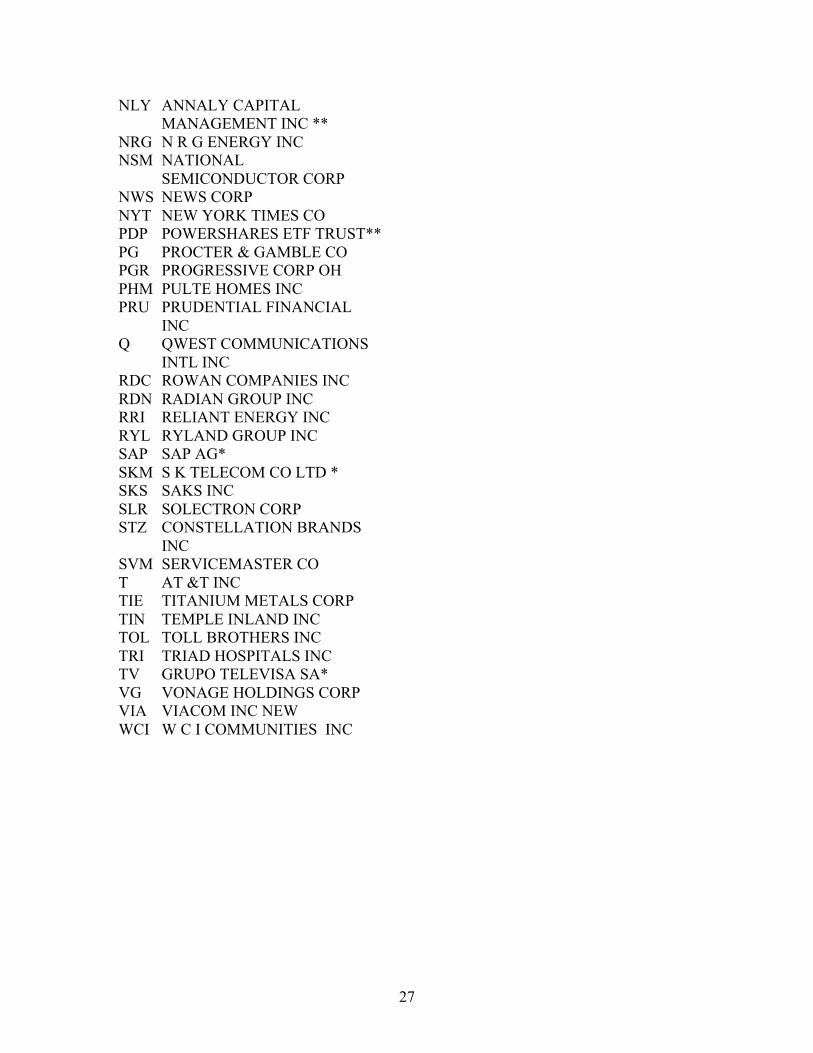
10 The SEC ordered a pilot test of Reg. NMS and asked the NYSE to select 100 listings for a 30-day test, which began July 9, 2007. Appendix A lists the 99 pilots, the majority of which have large market capitalizations and are heavily traded. We constructed our sample by selecting all large-cap, heavily traded stocks in the same industries as the pilots. Because there were no technological barriers to implementing the new Order Protection Rule on July 9 for all listings, we tested whether trades for pilot stocks were routed differently than other NYSE stocks and found that they were not. We therefore take July 9 to be the start date for Reg. NMS generally for all NYSE listings.
15
We also find that Nasdaq spreads are higher overall than NYSE spreads. One
explanation for this is that Nasdaq trades met the posted NYSE quote, while NYSE
transactions occurred inside the quote, i.e., at a better price. This would be consistent
with Petersen and Fialkowski’s (1994) findings that actual spreads are half the size of
posted spreads for trades on the NYSE.
Model 1 also shows a secular increase in spreads after Reg. NMS. Models 2 and 3
present our robustness check, by adding a control for a time trend. The results show a
positive and significant effect of time. However, Model 3, which interacts the time trend
with after NMS, shows that the time trend begins after Reg. NMS, with no trend before
Reg. NMS. This suggests that the effects of regulation might occur gradually.
The average spread in our sample is 0.53 cents for NYSE trades and 0.57 cents
for Nasdaq trades. The coefficients, also reported in cents, suggest that spreads increase
by 0.033 cents, or 6%, for Nasdaq trades relative to NYSE trades in the first month of the
new regulation. This is in addition to higher spreads for Nasdaq trades generally of about
0.024 cents, or 4.5%. Thus, the first month of Reg. NMS saw a difference in spreads
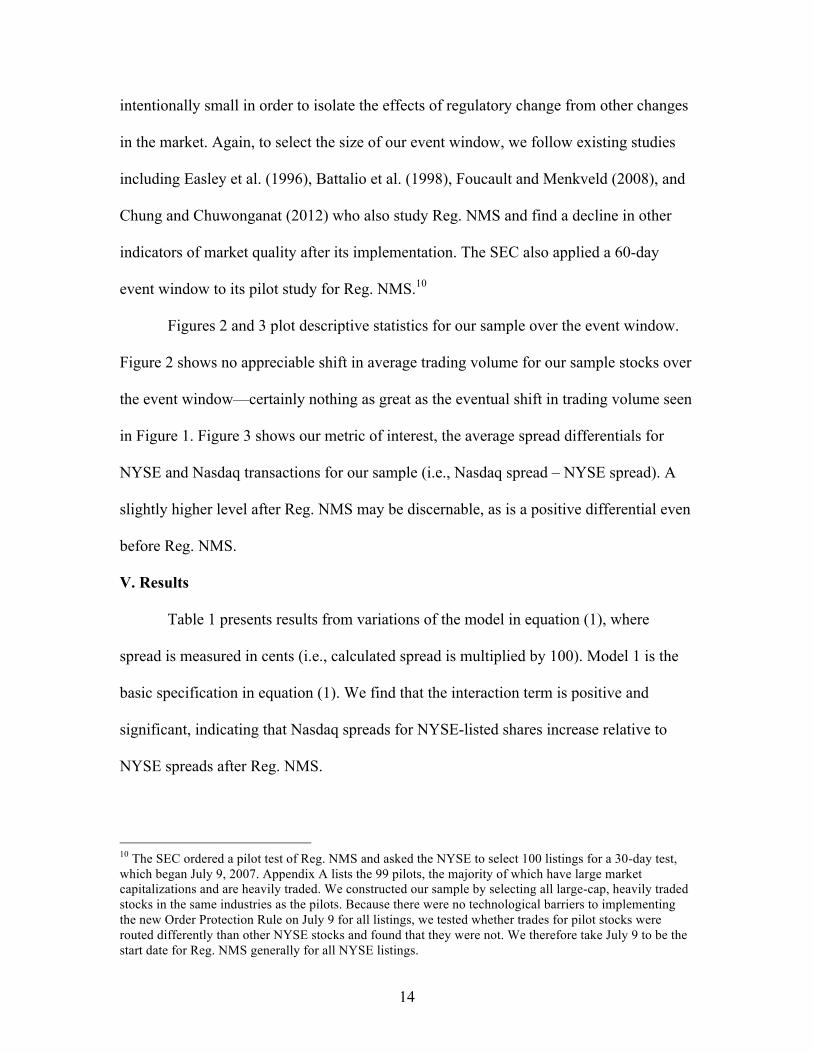
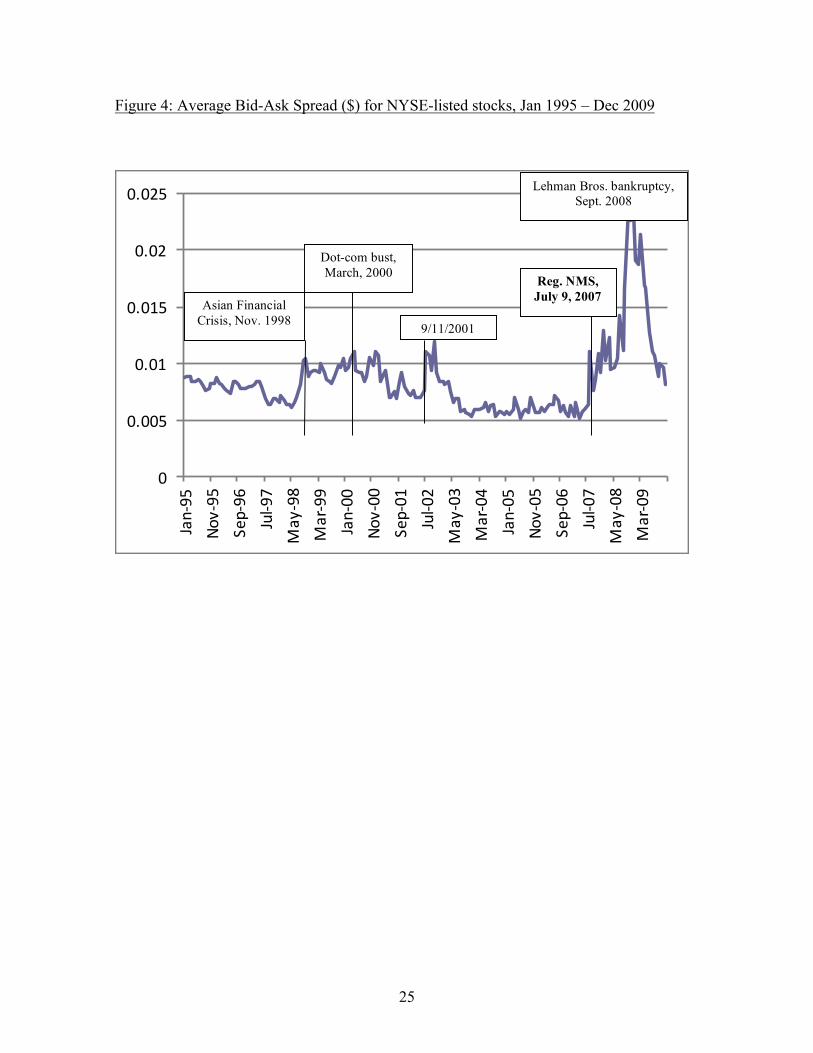
between NYSE and Nasdaq trades of 10%. The longer-term descriptive data in Figure 4
suggest that spreads increase substantially more over time.
Note that our results allow us to reject alternate hypotheses. The competitive
outcome of lower spreads does not obtain, nor does the no-change outcome. Thus,
heterogeneous incentives appear to affect market outcomes.
VI. Discussion & Conclusion
Nonprofits are not always strange animals. In fact, sometimes they do exactly
what a for-profit would do, as was the case with the nonprofit and for-profit versions of
16
the Nasdaq. But nonprofits can behave differently than for-profits for predictable reasons
and in predictable ways.
In this study, we provide an example of a nonprofit member organization
vertically integrating into stock trading to enhance underwriting profits. While
underwriting activity gets less attention than trading, it is a lucrative business in which a
single initial public offering (IPO) can easily generate tens of millions - and even
hundreds of millions - of dollars in fees for the lead underwriters (Ho and Demos 2014).
To maximize that business, underwriters, which we posit have long dominated the
NYSE, insured that trading was orderly, i.e., continuous and relatively smooth, by tightly
regulating specialists. This helped prevent the development of a “lemons” problem at the
NYSE (Akerlof 1970), which in turn enabled underwriters to generate higher IPO
valuations and, therefore, higher underwriting profits. Our institutional analysis
highlights the incentives behind mechanisms and outcomes that are often taken for
granted, with recent problems serving as counterfactuals. Events such as the “flash crash”
of 2010 and the allegations of market “rigging” in favor of so-called “high frequency
traders” (Lewis 2014), can jeopardize investor participation while botched IPOs, such as
that of Facebook on the Nasdaq and BATS on its own internal trading system, show how
difficult and complex is the underwriting process.
The stock market is an economically important institution, but it is just one of
many regulated industries. Nonprofits are frequently involved in providing public goods
and often as monopolies. This study demonstrates the importance of carefully analyzing
nonprofit incentives, including their potential heterogeneity.
17
References Affleck-Graves, John, Shantaram Hegde and Robert Miller, 1994, “Trading Mechanisms and the Components of the Bid-Ask Spread,” The Journal of Finance, 49:4, pp. 1471-1488. Aggarwal, Reena, 2002, “Demutualization and Corporate Governance of Stock Exchanges,” Journal of Applied Corporate Finance, Spring, 15, pp. 105-113. Akerlof, George, 1970, “The Market for ‘Lemons’ Quality Uncertainty and the Market Mechanism,” Quarterly Journal of Economics 9, pp. 629-650. Barclay, Michael, Eugene Kandel and Leslie Marx, 1998, “The Effects of Transaction Costs on Stock Prices and Trading Volume,” Journal of Financial Intermediation, 7, pp. 130-150. Battalio, Robert, Andrew Ellul and Robert Jennings, 2007, “Reputation Effects in Trading on the New York Stock Exchange,” The Journal of Finance, 62:3, pp. 1243-1271. Battalio, Robert, Jason Greene and Robert Jennings, 1997, Do Competing Specialists and Preferencing Dealers Affect Market Quality, Review of Financial Studies, 10:4, pp. 969-993. _________, 1998, “Order Flow Distribution, Bid–Ask Spreads, and Liquidity Costs: Merrill Lynch’s Decision to Cease Routinely Routing Orders to Regional Stock Exchanges,” Journal of Financial Intermediation 7, pp. 338–358. Bessembinder, Hendrik and Herbert Kaufman, 1997, “A Comparison of Trade Execution Costs for NYSE and Nasdaq-listed Stocks,” Journal of Financial and Quantitative Analysis, 32:3, pp. 287-310.
Budish, Eric; Cramton, Peter and John Shim, 2015, “The High-Frequency Trading Arms Race: Frequent Batch Auctions as a Market Design Response,” The Quarterly Journal of Economics, Volume 130, Issue 4, 1 November 2015, Pages 1547–1621.
Carosso, Vincent P., 1970, Investment Banking in America: A History. Christie, William and Roger Huang, 1994, “Market Structures and Liquidity: A Transactions Data Study of Exchange Listings,” Journal of Financial Intermediation, 3, pp. 300-326. Chung, Kee H. and Chairat Chuwonganant, 2012, “Regulation NMS and Market Quality,” Financial Management, Summer, pp. 285-317.
18
Corwin, Shane and Paul Schultz, 2012, “A Simple Way to Estimate Bid-Ask Spreads from Daily High and Low Prices,” The Journal of Finance, 67:2, pp. 719-760. DeMarzo, Peter, Michael Fishman and Kathleen Hagerty, 2005, “Self-Regulation and Government Oversight,” Review of Economic Studies, 72, pp. 687-706. Diamond, Stephen F. and Jennifer W. Kuan, 2006, “Ringing the Bell on the NYSE: Might a Nonprofit Stock Exchange Have Been Efficient?” Duquesne Business Law Journal, Spring, Vol. 9, pp. 1-18. Dutta, Prajit and Ananth Madhavan, 1995, “Price Continuity Rules and Insider Trading,” Journal of Financial and Quantitative Analysis, 30:2, pp. 199-221. Easley, David, Nicholas M. Kiefer and Maureen O’Hara, 1996, “Cream-Skimming or Profit-Sharing? The Curious Role of Purchased Order Flow,” The Journal of Finance, July, pp. 811-833. Foucault, Thierry and Albert Menkveld, 2008, “Competition for Order Flow and Smart Order Routing Systems,” The Journal of Finance, February, pp. 119-158. Gasparino, Charles, 2007, King of the Club: Richard Grass and the Survival of the New York Stock Exchange. Geisst, Charles R., 1997, Wall Street: A History. Gertler, Paul and Jennifer Kuan, 2009, “Does It Matter Who Your Buyer Is? The Role of Nonprofit Mission in the Market for Corporate Control of Hospitals,” Journal of Law and Economics, vol. 52 (May), pp. 295-306. Golub, Anton and Keane, John and Poon, Ser-Huang, High Frequency Trading and Mini Flash Crashes (November 28, 2012). Available at SSRN: https://ssrn.com/abstract=2182097 or http://dx.doi.org/10.2139/ssrn.2182097 Hansmann, Henry, 1980, "The Role of Nonprofit Enterprise," Yale Law Journal Vol. 89, pp. 835-901. Harris, Lawrence, Editor, 2010, Regulated Exchanges: Dynamic Agents of Economic Growth. Hart, Oliver and John Moore, 1996, “The Governance of Exchanges: Members’ Cooperatives Versus Outside Ownership,” Oxford Review of Economic Policy, 12:4, pp. 53- 69. Ho, Prudence and Telis Demos, 2014, “Alibaba to Pay Underwriters 1% of U.S. IPO as Base Fee,” The Wall Street Journal, March 28.
19
Huang, Roger and Hans Stoll, 1996, “Dealer versus auction markets: A paired comparison of execution costs on NASDAQ and the NYSE,” Journal of Financial Economics, 41, pp. 313-357. Kuan, Jennifer W., 2001, “The Phantom Profits of the Opera: Nonprofit Ownership in the Arts as a Make-Buy Decision,” Journal of Law, Economics and Organization, Vol. 17, pp. 507-521. Lewis, Michael, 2014, “Is the U.S. Stock Market Rigged?” 60 Minutes, March 30. Loss, Louis and Joel Seligman, 2006, Fundamentals of Securities Regulation. Madhavan, Ananth and Venkatesh Panchapagesan, 2000, “Price Discovery in Auction Markets: A Look Inside the Black Box,” Review of Financial Studies, 123:3, pp. 627-658. Mann, Steven and Robert Seijas, 1991, “Bid-ask spreads, NYSE specialists, and NASD dealers,” Journal of Portfolio Management, Fall, pp. 54– 58. Michie, R.C., 1987, The London and New York Stock Exchanges, 1850-1914. NYSE Group, Inc., 2006, Registration Statement on Form S-1, Amendment No. 4, May 4. O'Hara, Maureen, 2004, “Searching for a New Center: U.S. Securities Markets in Transition,” Economic Review, Federal Reserve Bank of Atlanta, Fourth quarter, pp. 37-52. Parker, Geoffrey and Michael Van Alstyne, 2005, “Two-sided Network Effects: A Theory of Information Product Design,” Management Science, 51:10, pp. 1494-1504. Petersen, Mitchell A. and David Fialkowski, 1994, “Posted versus effective spreads: Good prices or bad quotes?” Journal of Financial Economics, 35: 269-292. Pirrong, Craig, 2000, “A theory of financial exchange organization,” Journal of Law and Economics, 43:2, 437-472. Rochet, Jean-Charles and Jean Tirole, 2003, “Platform Competition in Two-sided Markets,” Journal of the European Economic Association, June, 1:4, pp. 990-1029. Securities and Exchange Commission, 2004, “Analysis of Volatility for Stocks Switching from Nasdaq to NYSE,” December 15. __________, 2005a, “In the matter of the New York Stock Exchange,” Rel. No. 34-51524, April 12.
20
__________, 2005b, “Regulation NMS,” Release No. 34-51808, June 9. __________, 1996, Report Pursuant to Section 21(a) of the Securities Exchange Act of 1934 Regarding the NASD and the NASDAQ Market. Steil, Benn, 2002, “Changes in the Ownership and Governance of Securities Exchanges: Causes and Consequences,” Brookings-Wharton Papers on Financial Services, pp. 61-82. Stoll, Hans, 2002, “Changes in the Ownership and Governance of Securities Exchanges: Comment and Discussion,” Brookings-Wharton Papers on Financial Services, pp. 83-90.
21
Table 1: Changes in bid-ask spread of trades before and during the pilot test (1) (2) (3) Nasdaq (y=1) 0.024***
(0.004)
0.024*** (0.004)
0.024*** (0.004)
After 0.163*** (0.015)
-0.054** (0.022)
-0.550*** (0.059)
Nasdaq*after 0.033*** (0.007)
0.033*** (0.007)
0.033*** (0.007)
Trend 0.007*** (0.001)
0.001 (0.001)
Trend*after 0.014*** (0.001)
R2 (within) 0.013 0.020 0.026 R2 (between) 0.053 0.044 0.053 R2 (overall) 0.013 0.019 0.026 N 27,166 27,166 27,166
22
Figure 1: Trading Volume for all NYSE-listed stocks (Jan 2004 – Dec 2011)
0.0
10.0
20.0
30.0
40.0
50.0
60.0
70.0
80.0
90.0
-
20,000
40,000
60,000
80,000
100,000
120,000
140,000
160,000
180,000 Ja
n-04
Jul-0
4
Jan-
05
Jul-0
5
Jan-
06
Jul-0
6
Jan-
07
Jul-0
7
Jan-
08
Jul-0
8
Jan-
09
Jul-0
9
Jan-
10
Jul-1
0
Jan-
11
Jul-1
1
volu
me
of s
hare
s tr
aded
(m
illio
ns)
Volume (NYSE) Volume (total) Share on NYSE
23
Figure 2: Average difference in trading volume for sample (mill shares): NYSE transactions – Nasdaq transactions
Day 0 = July 9, 2007
0
100
200
300
400
500
600
700
800
-32-29-26-23-20-17-14-11 -8 -5 -2 1 4 7 10 13 16 19 22 25 28
day
shar
es
trad
ed
(mil
l)
Reg.NMS
24
Figure3-Spreaddifferentialovereventdate
-0.04
-0.02
0
0.02
0.04
0.06
0.08
0.1
0.12
0.14
0.16
0.18
-30 -27 -24 -21 -18 -15 -12 -9 -6 -3 0 3 6 9 12 15 18 21 24 27 30
spreaddiffernetial(cents)
day
25
Figure 4: Average Bid-Ask Spread ($) for NYSE-listed stocks, Jan 1995 – Dec 2009
0
0.005
0.01
0.015
0.02
0.025Jan-95
Nov-95
Sep-96
Jul-97
May-98
Mar-99
Jan-00
Nov-00
Sep-01
Jul-02
May-03
Mar-04
Jan-05
Nov-05
Sep-06
Jul-07
May-08
Mar-09
Asian Financial Crisis, Nov. 1998
Dot-com bust, March, 2000
9/11/2001
Lehman Bros. bankruptcy, Sept. 2008
Reg. NMS, July 9, 2007
26
Appendix A: 98 NYSE Pilot Stocks (*foreign-owned; **exchange traded fund; ***out of business) ABI APPLERA CORP ABT ABBOTT LABORATORIES ABY ABITIBI CONSOLIDATED
INC** ACI ARCH COAL INC AEO AMERICAN EAGLE
OUTFITTERS INC NE AET AETNA INC NEW AG AGCO CORP AHM AMERICAN HOME
MORTGAGE INVT CORP *** AIG AMERICAN INTERNATIONAL
GROUP INC ANF ABERCROMBIE & FITCH CO AT ALLTEL CORP BR BROADRIDGE FINANCIAL
SOLUTNS INC BTU PEABODY ENERGY CORP C CITIGROUP INC CAG CONAGRA INC CAH CARDINAL HEALTH INC CAL CONTINENTAL AIRLINES INC CCJ CAMECO CORP ** CCU CLEAR CHANNEL
COMMUNICATIONS INC CNP CENTERPOINT ENERGY INC CNQ CANADIAN NATURAL
RESOURCES LTD * CPB CAMPBELL SOUP CO D DOMINION RESOURCES INC
VA NEW DNA GENENTECH INC DOW DOW CHEMICAL CO DOX AMDOCS LTD ** DRL DORAL FINANCIAL CORP ED CONSOLIDATED EDISON INC EEM ISHARES TRUST ** EIX EDISON INTERNATIONAL EP EL PASO CORP EWT ISHARES INC FCS FAIRCHILD
SEMICONDUCTOR INTL INC
FMT FREMONT GENERAL CORP FRX FOREST LABS INC GCI GANNETT INC GD GENERAL DYNAMICS CORP GE GENERAL ELECTRIC CO GS GOLDMAN SACHS GROUP
INC GSF GLOBALSANTAFE CORP * HC HANOVER COMPRESSOR CO HES HESS CORP HIG HARTFORD FINANCIAL SVCS
GRP INC HK PETROHAWK ENERGY CORP HON HONEYWELL
INTERNATIONAL INC HRB BLOCK H & R INC IBN ICICI BANK LTD * IGT INTERNATIONAL GAME
TECHNOLOGY IMH IMPAC MORTGAGE
HOLDINGS INC ** IP INTERNATIONAL PAPER CO JNJ JOHNSON & JOHNSON JPM JPMORGAN CHASE & CO KG KING PHARMACEUTICALS
INC KSS KOHLS CORP LM LEGG MASON INC LOW LOWES COMPANIES INC LTR LOEWS CORP MAS MASCO CORP MDT MEDTRONIC INC MO ALTRIA GROUP INC MRK MERCK & CO INC MRO MARATHON OIL CORP MS MORGAN STANLEY DEAN
WITTER & CO MTG M G I C INVESTMENT CORP
WIS NEM NEWMONT MINING CORP NFX NEWFIELD EXPLORATION
CO
27
NLY ANNALY CAPITAL MANAGEMENT INC **
NRG N R G ENERGY INC NSM NATIONAL
SEMICONDUCTOR CORP NWS NEWS CORP NYT NEW YORK TIMES CO PDP POWERSHARES ETF TRUST** PG PROCTER & GAMBLE CO PGR PROGRESSIVE CORP OH PHM PULTE HOMES INC PRU PRUDENTIAL FINANCIAL
INC Q QWEST COMMUNICATIONS
INTL INC RDC ROWAN COMPANIES INC RDN RADIAN GROUP INC RRI RELIANT ENERGY INC RYL RYLAND GROUP INC SAP SAP AG* SKM S K TELECOM CO LTD * SKS SAKS INC SLR SOLECTRON CORP STZ CONSTELLATION BRANDS
INC SVM SERVICEMASTER CO T AT &T INC TIE TITANIUM METALS CORP TIN TEMPLE INLAND INC TOL TOLL BROTHERS INC TRI TRIAD HOSPITALS INC TV GRUPO TELEVISA SA* VG VONAGE HOLDINGS CORP VIA VIACOM INC NEW WCI W C I COMMUNITIES INC

28