Embed Size (px)
Citation preview
Are some ethnic groups more vulnerable to COVID-19 than others?
Lucinda Platt and Ross Warwick
An IFS initiative funded by the Nuffield Foundation
Are some ethnic groups more vulnerable to COVID-19 than others?
Lucinda Platt Ross Warwick
Copy-edited by Judith Payne
Published by
The Institute for Fiscal Studies, May 2020
ISBN 978-1-912805-75-4
The Nuffield Foundation is an independent charitable trust with a mission to advance social well-being. It funds research that informs social policy, primarily in Education, Welfare, and Justice. It also funds student programmes that provide opportunities for young people to develop skills in quantitative and scientific methods. The Nuffield Foundation is the founder and co-funder of the Nuffield Council on Bioethics and the Ada Lovelace Institute. The Foundation has funded this project, but the views expressed are those of the authors and not necessarily of the Foundation. Visit www.nuffieldfoundation.org.
2 © Institute for Fiscal Studies
Executive summary The COVID-19 pandemic has affected some sections of the population more than others, and there are growing concerns that the UK’s minority ethnic groups are being disproportionately affected. Following evidence that minority groups are over-represented in hospitalisations and deaths from the virus, Public Health England has launched an inquiry into the issue.
In the short term, ethnic inequalities are likely to manifest from the COVID-19 crisis in two main ways:
through exposure to infection and health risks, including mortality;
through exposure to loss of income.
Analysis of ethnic disproportionalities in health outcomes that aggregates groups together masks much of the story with regards to ethnic inequalities, and limits the scope for understanding why they have come about. Moreover, simply comparing mortalities with overall populations fails to take account of key characteristics of different groups that we would expect to lead to different outcomes in the aggregate, such as demographics and place of residence. Accounting for these factors is necessary to understand the true scale of disproportionalities as a starting point for thinking about policy responses.
In addition, given the varied profiles of different ethnic groups, some are more likely to be economically vulnerable under current restrictions than others, and this dimension is crucial for painting a full picture of ethnic inequalities arising from COVID-19. Household structures, occupational profiles and levels of savings are all important to consider in identifying in which groups the greatest economic vulnerabilities lie.
This report brings together evidence on the unequal health and economic impacts of COVID-19 on the UK’s minority ethnic groups, presenting information on risk factors for each of the largest minority groups in England and Wales: white other, Indian, Pakistani, Bangladeshi, black African and black Caribbean. For the most part, we focus on these six groups (and the white British majority) for which there is reliable information across different data sources.
The analysis focuses on a limited but crucial set of risk factors in terms of both infection risk and economic vulnerability in the short term. Beyond the scope of this report are a range of other factors which may prove to be important as more research is undertaken, as well as the longer-term consequences of widespread societal disruption for the outcomes of different groups.
© Institute for Fiscal Studies 3
Key findings The impacts of the COVID-19 crisis are not uniform across ethnic groups, and aggregating all minorities together misses important differences. Understanding why these differences exist is crucial for thinking about the role policy can play in addressing inequalities. Per-capita COVID-19 hospital deaths are highest among the black Caribbean population and three times those of the white British majority. Some minority groups – including Pakistanis and black Africans – have seen similar numbers of hospital deaths per capita to the population average, while Bangladeshi fatalities are lower. Once you take account of age and geography, most minority groups ‘should’ have fewer deaths per capita than the white British majority. While many minority groups live disproportionately in areas such as London and Birmingham, which have more COVID-19 deaths, most minorities are also younger on average than the population as a whole, which should make them less vulnerable. After accounting for the age, gender and geographic profiles of ethnic groups, inequalities in mortality relative to the white British majority are therefore more stark for most minority groups than they first appear. Black Africans and Pakistanis would be expected to have fewer fatalities per capita than white British but at present they are comparable. After stripping out the role of age and geography, Bangladeshi hospital fatalities are twice those of the white British group, Pakistani deaths are 2.9 times as high and black African deaths 3.7 times as high. The Indian, black Caribbean and ‘other white’ ethnic groups also have excess fatalities, with the white Irish group the only one to have fewer fatalities than white British. These disparities cannot currently be accounted for by non-hospital deaths. Official deaths in care homes – for which the ethnicity of victims is not currently available but where over 95% of residents are white – could only explain a small part of estimated excess fatalities recorded in hospitals for minority groups. The ethnic composition of additional deaths directly or indirectly caused by the virus but not officially attributed to it is unclear at this time. Occupational exposure may partially explain disproportionate deaths for some groups. Key workers are at higher risk of infection through the jobs they do. More than two in ten black African women of working age are employed in health and social care roles. Indian men are 150% more likely to work in health or social care roles than their white British counterparts. While the Indian ethnic group makes up 3% of the working-age population of England and Wales, they account for 14% of doctors. At-risk underlying health conditions are especially prevalent among older Bangladeshis, Pakistanis and black Caribbeans. Compared with white British individuals over 60 years of age, Bangladeshis are more than 60% more likely to have a long-term health condition that makes them particularly vulnerable to infection, which may explain excess fatalities in this group.
4 © Institute for Fiscal Studies
Many ethnic minorities are also more economically vulnerable to the current crisis than are white ethnic groups. The fact that larger shares of many minority groups are of working age means that these populations are more exposed to labour market conditions as a whole, but even amongst working-age populations there are clear inequalities in vulnerability to the current crisis. Men from minority groups are more likely to be affected by the shutdown. While in the population as a whole women are more likely to work in shut-down sectors, this is only the case for the white ethnic groups. Bangladeshi men are four times as likely as white British men to have jobs in shut-down industries, due in large part to their concentration in the restaurant sector, and Pakistani men are nearly three times as likely, partly due to their concentration in taxi driving. Black African and black Caribbean men are both 50% more likely than white British men to be in shut-down sectors. Self-employment – where incomes may currently be especially uncertain – is especially prevalent amongst Pakistanis and Bangladeshis. Pakistani men are over 70% more likely to be self-employed than the white British majority. While in the population as a whole young people are more likely to be affected by the shutdown, the reverse is true among Pakistanis and Bangladeshis. While 24% of young white British and 29% of young Bangladeshis work in shut-down sectors, the figure is 14% for 30- to 44-year-old white British but 40% for 30- to 44-year-old Bangladeshis. This also means that the family circumstances of those affected by shutdown differ by ethnicity, with older workers more likely to be living in couples. The potential for buffering incomes within the household depends on partners’ employment rates, which are much lower for Pakistani and Bangladeshi women. As a result, 29% of Bangladeshi working-age men both work in a shut-down sector and have a partner who is not in paid work, compared with only 1% of white British men. Bangladeshis, black Caribbeans and black Africans also have the most limited savings to provide a financial buffer if laid off. Only around 30% live in households with enough to cover one month of income. In contrast, nearly 60% of the rest of the population have enough savings to cover one month’s income.
© Institute for Fiscal Studies 5
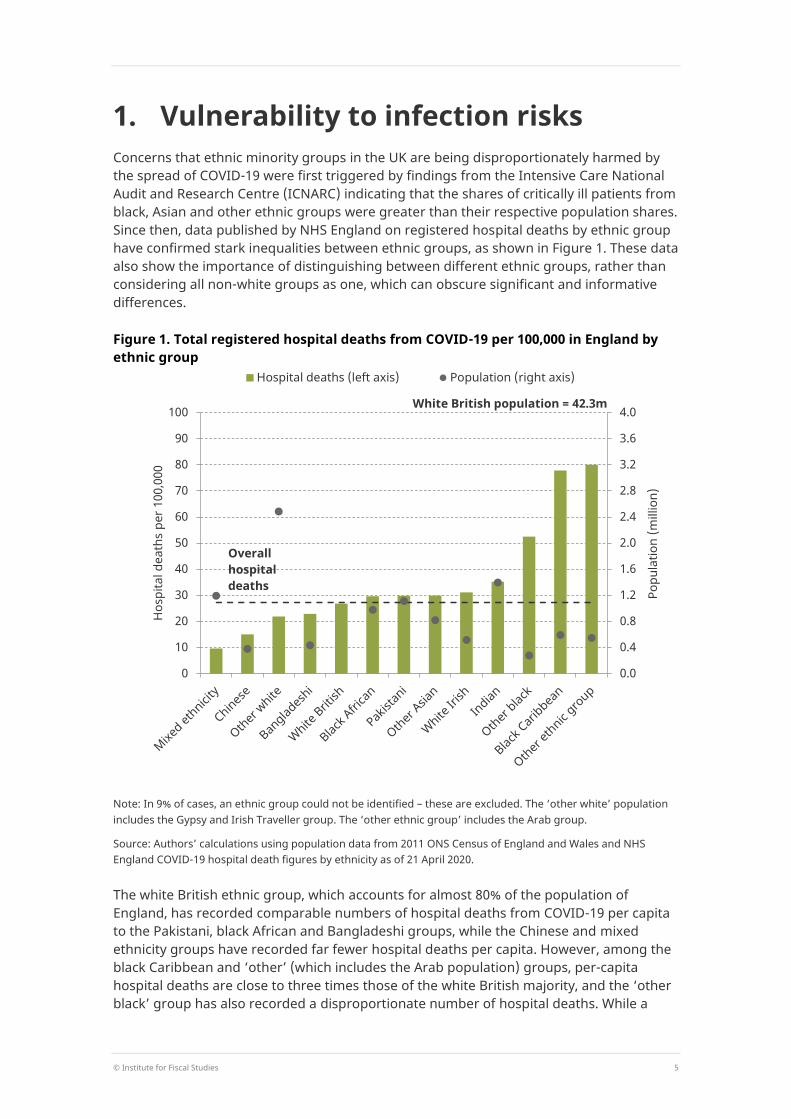
1. Vulnerability to infection risks Concerns that ethnic minority groups in the UK are being disproportionately harmed by the spread of COVID-19 were first triggered by findings from the Intensive Care National Audit and Research Centre (ICNARC) indicating that the shares of critically ill patients from black, Asian and other ethnic groups were greater than their respective population shares. Since then, data published by NHS England on registered hospital deaths by ethnic group have confirmed stark inequalities between ethnic groups, as shown in Figure 1. These data also show the importance of distinguishing between different ethnic groups, rather than considering all non-white groups as one, which can obscure significant and informative differences.
Figure 1. Total registered hospital deaths from COVID-19 per 100,000 in England by ethnic group
Note: In 9% of cases, an ethnic group could not be identified – these are excluded. The ‘other white’ population includes the Gypsy and Irish Traveller group. The ‘other ethnic group’ includes the Arab group.
Source: Authors’ calculations using population data from 2011 ONS Census of England and Wales and NHS England COVID-19 hospital death figures by ethnicity as of 21 April 2020.
The white British ethnic group, which accounts for almost 80% of the population of England, has recorded comparable numbers of hospital deaths from COVID-19 per capita to the Pakistani, black African and Bangladeshi groups, while the Chinese and mixed ethnicity groups have recorded far fewer hospital deaths per capita. However, among the black Caribbean and ‘other’ (which includes the Arab population) groups, per-capita hospital deaths are close to three times those of the white British majority, and the ‘other black’ group has also recorded a disproportionate number of hospital deaths. While a
0.0
0.4
0.8
1.2
1.6
2.0
2.4
2.8
3.2
3.6
4.0
0
10
20
30
40
50
60
70
80
90
100
Popu
latio
n (m
illio
n)
Hos
pita
l dea
ths
per 1
00,0
00
Hospital deaths (left axis) Population (right axis)
Overall hospital deaths
White British population = 42.3m
6 © Institute for Fiscal Studies
word of caution may be warranted on the precision of these per-capita numbers – there is some evidence that the ‘other ethnic group’ population has grown significantly since 2011, for instance – it is nonetheless clear that there is a lot of variation in hospital deaths between England’s ethnic groups.
The unequal effects of the COVID-19 crisis on different ethnic groups are likely to be the result of a complex set of economic, social and health-related factors. Understanding the role of each of these will require a better understanding of the virus itself, more data than are currently available, and additional research. However, there are important differences between the characteristics of the UK’s main ethnic groups – in terms of their geography, age, overall health, and occupational exposure – that are relevant for understanding why inequalities in vulnerability to infection may arise and for understanding the degree of disproportionality in health outcomes, including mortality. These include substantial differences between the country’s main minority ethnic groups, and thus it is important not simply to contrast ethnic minorities as a whole with the white British majority, and not only to compare population shares of all minority or immigrant groups with shares of deaths.
People and place
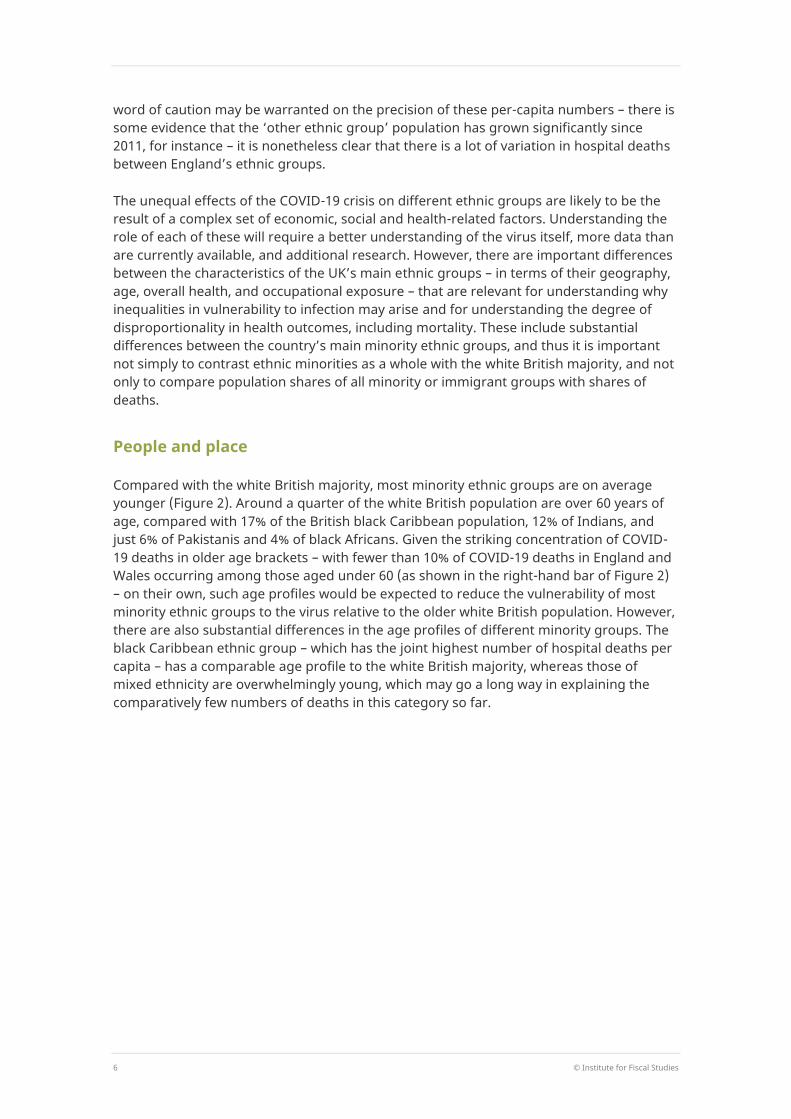
Compared with the white British majority, most minority ethnic groups are on average younger (Figure 2). Around a quarter of the white British population are over 60 years of age, compared with 17% of the British black Caribbean population, 12% of Indians, and just 6% of Pakistanis and 4% of black Africans. Given the striking concentration of COVID-19 deaths in older age brackets – with fewer than 10% of COVID-19 deaths in England and Wales occurring among those aged under 60 (as shown in the right-hand bar of Figure 2) – on their own, such age profiles would be expected to reduce the vulnerability of most minority ethnic groups to the virus relative to the older white British population. However, there are also substantial differences in the age profiles of different minority groups. The black Caribbean ethnic group – which has the joint highest number of hospital deaths per capita – has a comparable age profile to the white British majority, whereas those of mixed ethnicity are overwhelmingly young, which may go a long way in explaining the comparatively few numbers of deaths in this category so far.
© Institute for Fiscal Studies 7
Figure 2. Age distributions of selected ethnic groups in England and Wales and share of overall COVID-19 deaths by age band
Note: COVID-19 deaths are from all places of occurrence (hospital and non-hospital) in England and Wales.
Source: Population data from 2011 ONS Census of England and Wales and COVID-19 death data from ONS weekly occurrences up to 17 April 2020.
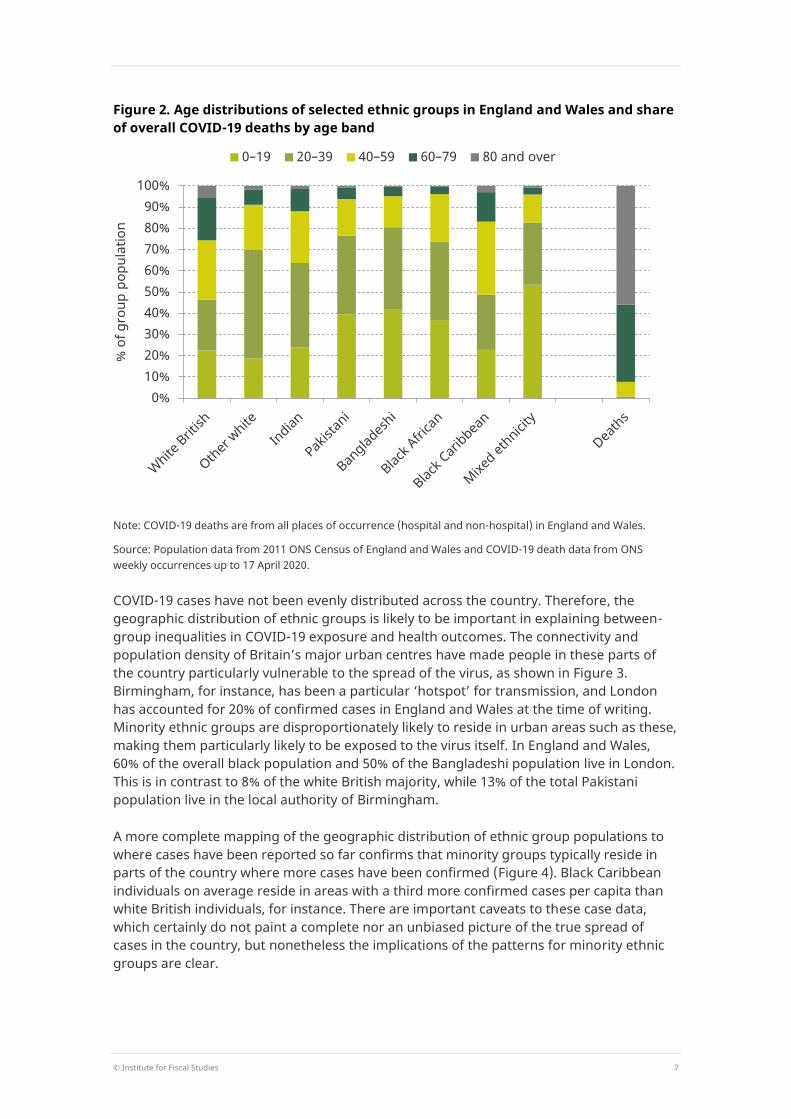
COVID-19 cases have not been evenly distributed across the country. Therefore, the geographic distribution of ethnic groups is likely to be important in explaining between-group inequalities in COVID-19 exposure and health outcomes. The connectivity and population density of Britain’s major urban centres have made people in these parts of the country particularly vulnerable to the spread of the virus, as shown in Figure 3. Birmingham, for instance, has been a particular ‘hotspot’ for transmission, and London has accounted for 20% of confirmed cases in England and Wales at the time of writing. Minority ethnic groups are disproportionately likely to reside in urban areas such as these, making them particularly likely to be exposed to the virus itself. In England and Wales, 60% of the overall black population and 50% of the Bangladeshi population live in London. This is in contrast to 8% of the white British majority, while 13% of the total Pakistani population live in the local authority of Birmingham.
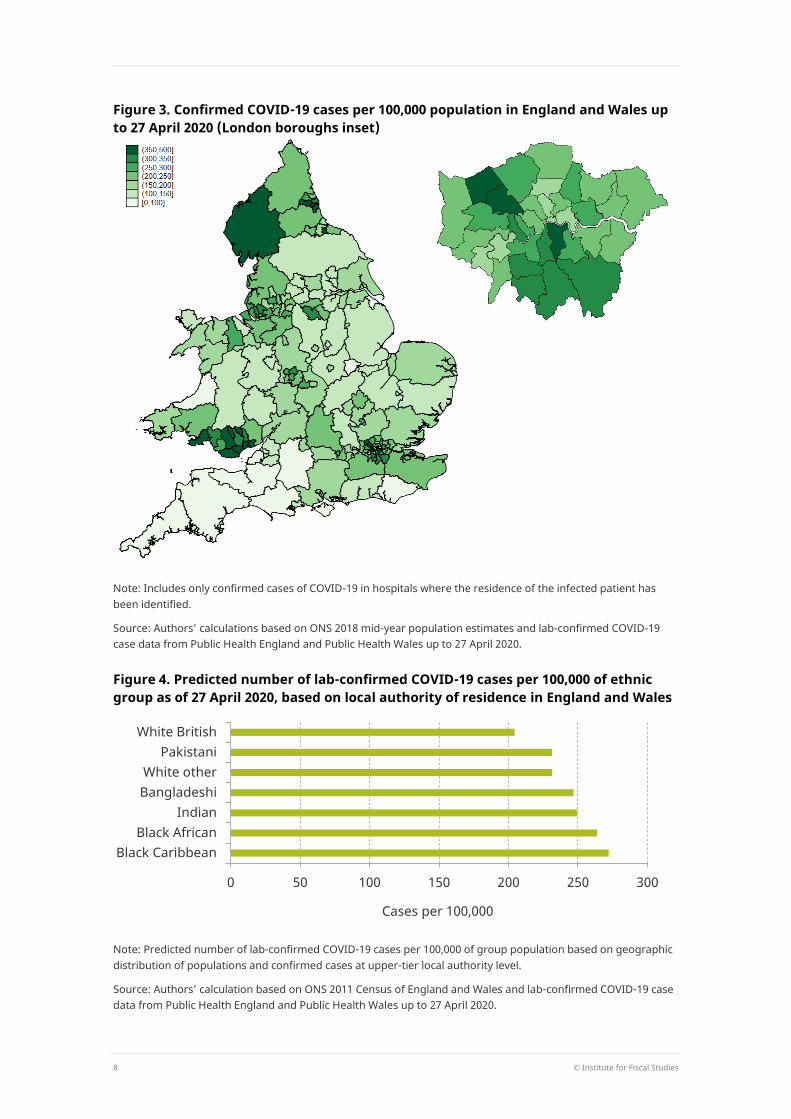
A more complete mapping of the geographic distribution of ethnic group populations to where cases have been reported so far confirms that minority groups typically reside in parts of the country where more cases have been confirmed (Figure 4). Black Caribbean individuals on average reside in areas with a third more confirmed cases per capita than white British individuals, for instance. There are important caveats to these case data, which certainly do not paint a complete nor an unbiased picture of the true spread of cases in the country, but nonetheless the implications of the patterns for minority ethnic groups are clear.
0%10%20%30%40%50%60%70%80%90%
100%
% o
f gro
up p
opul
atio
n
0–19 20–39 40–59 60–79 80 and over
8 © Institute for Fiscal Studies
Figure 3. Confirmed COVID-19 cases per 100,000 population in England and Wales up to 27 April 2020 (London boroughs inset)
Note: Includes only confirmed cases of COVID-19 in hospitals where the residence of the infected patient has been identified.
Source: Authors’ calculations based on ONS 2018 mid-year population estimates and lab-confirmed COVID-19 case data from Public Health England and Public Health Wales up to 27 April 2020.
Figure 4. Predicted number of lab-confirmed COVID-19 cases per 100,000 of ethnic group as of 27 April 2020, based on local authority of residence in England and Wales
Note: Predicted number of lab-confirmed COVID-19 cases per 100,000 of group population based on geographic distribution of populations and confirmed cases at upper-tier local authority level.
Source: Authors’ calculation based on ONS 2011 Census of England and Wales and lab-confirmed COVID-19 case data from Public Health England and Public Health Wales up to 27 April 2020.
0 50 100 150 200 250 300
Black CaribbeanBlack African
IndianBangladeshiWhite other
PakistaniWhite British
Cases per 100,000
© Institute for Fiscal Studies 9
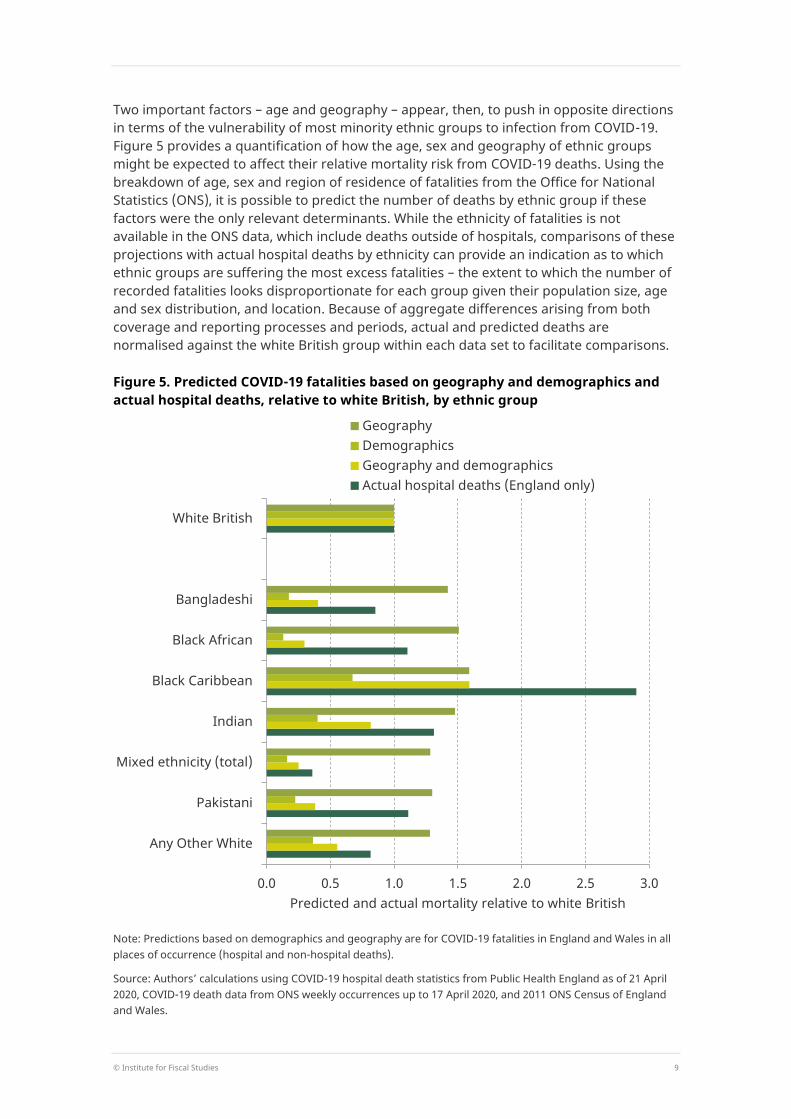
Two important factors – age and geography – appear, then, to push in opposite directions in terms of the vulnerability of most minority ethnic groups to infection from COVID-19. Figure 5 provides a quantification of how the age, sex and geography of ethnic groups might be expected to affect their relative mortality risk from COVID-19 deaths. Using the breakdown of age, sex and region of residence of fatalities from the Office for National Statistics (ONS), it is possible to predict the number of deaths by ethnic group if these factors were the only relevant determinants. While the ethnicity of fatalities is not available in the ONS data, which include deaths outside of hospitals, comparisons of these projections with actual hospital deaths by ethnicity can provide an indication as to which ethnic groups are suffering the most excess fatalities – the extent to which the number of recorded fatalities looks disproportionate for each group given their population size, age and sex distribution, and location. Because of aggregate differences arising from both coverage and reporting processes and periods, actual and predicted deaths are normalised against the white British group within each data set to facilitate comparisons.
Figure 5. Predicted COVID-19 fatalities based on geography and demographics and actual hospital deaths, relative to white British, by ethnic group
Note: Predictions based on demographics and geography are for COVID-19 fatalities in England and Wales in all places of occurrence (hospital and non-hospital deaths).
Source: Authors’ calculations using COVID-19 hospital death statistics from Public Health England as of 21 April 2020, COVID-19 death data from ONS weekly occurrences up to 17 April 2020, and 2011 ONS Census of England and Wales.
0.0 0.5 1.0 1.5 2.0 2.5 3.0
Any Other White
Pakistani
Mixed ethnicity (total)
Indian
Black Caribbean
Black African
Bangladeshi
White British
Predicted and actual mortality relative to white British
GeographyDemographicsGeography and demographicsActual hospital deaths (England only)
10 © Institute for Fiscal Studies
If only location of residence mattered, the white British majority would be expected to have the lowest number of deaths per capita and black ethnic groups the highest. Conversely, if demographics were the only factor, white British individuals would be expected to have the highest mortality, due to the older age profile of that group. Combining both demographics and geography gives a varied picture across different groups. On the basis of these factors, one would expect a higher number of fatalities, compared with the white British majority, for black Caribbeans, but lower rates for all other minority ethnic groups.
In reality, the available information on hospital deaths by ethnic group suggests higher per-capita mortalities for all ethnic minorities in Figure 5 than can be explained by demographics and geography alone, as can be seen by comparing the yellow and dark green bars for each group. The ratio of these two provides an estimate of excess mortality beyond what can be explained by demographics and geography if hospital death rates are representative of overall COVID-19 fatalities. This ratio varies substantially across ethnic groups, from 3.7 for black Africans, to 2.9 for Pakistanis and 1.8 for black Caribbeans. For the white Irish group (not shown on Figure 5) the ratio is 0.5, suggesting disproportionately few fatalities in that population given their age profile and where they live.
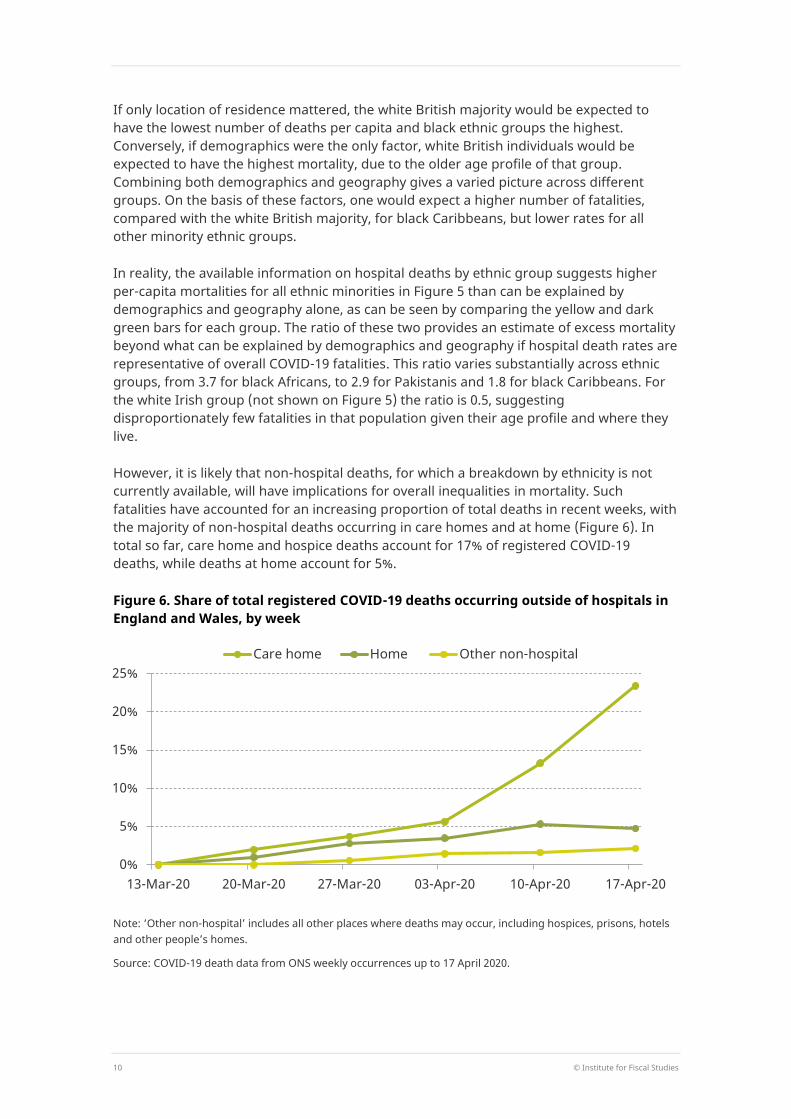
However, it is likely that non-hospital deaths, for which a breakdown by ethnicity is not currently available, will have implications for overall inequalities in mortality. Such fatalities have accounted for an increasing proportion of total deaths in recent weeks, with the majority of non-hospital deaths occurring in care homes and at home (Figure 6). In total so far, care home and hospice deaths account for 17% of registered COVID-19 deaths, while deaths at home account for 5%.
Figure 6. Share of total registered COVID-19 deaths occurring outside of hospitals in England and Wales, by week
Note: ‘Other non-hospital’ includes all other places where deaths may occur, including hospices, prisons, hotels and other people’s homes.
Source: COVID-19 death data from ONS weekly occurrences up to 17 April 2020.
0%
5%
10%
15%
20%
25%
13-Mar-20 20-Mar-20 27-Mar-20 03-Apr-20 10-Apr-20 17-Apr-20
Care home Home Other non-hospital
© Institute for Fiscal Studies 11
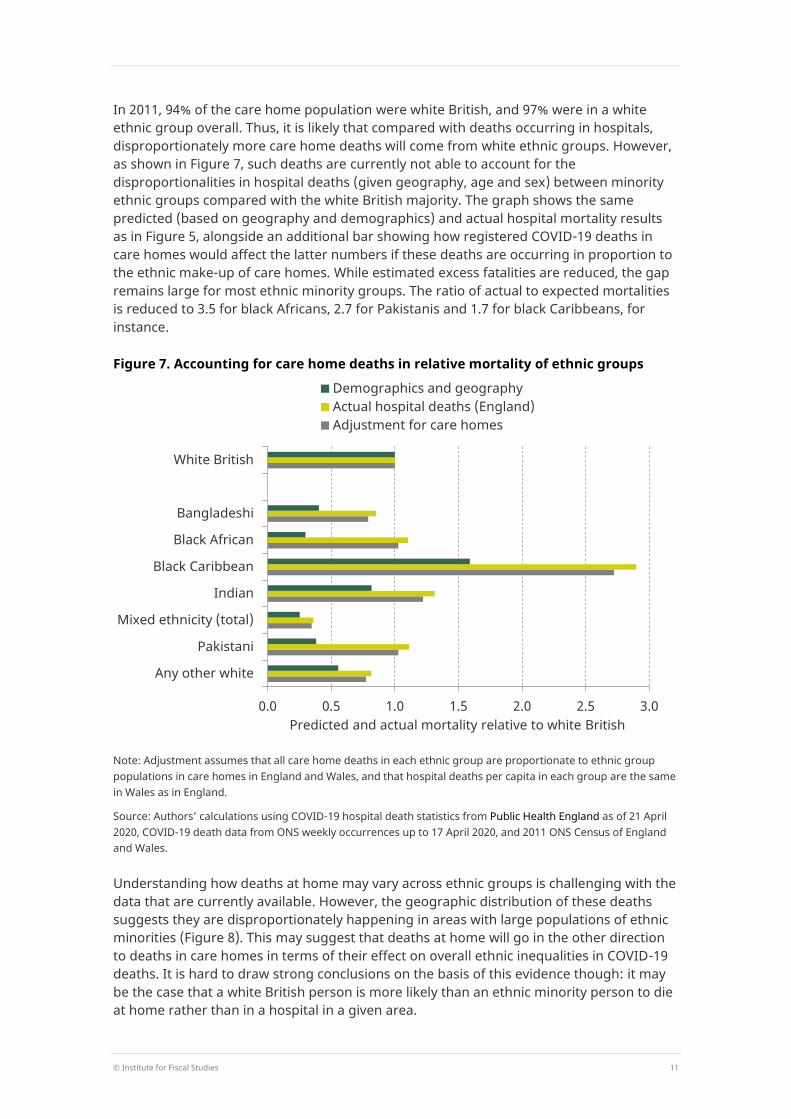
In 2011, 94% of the care home population were white British, and 97% were in a white ethnic group overall. Thus, it is likely that compared with deaths occurring in hospitals, disproportionately more care home deaths will come from white ethnic groups. However, as shown in Figure 7, such deaths are currently not able to account for the disproportionalities in hospital deaths (given geography, age and sex) between minority ethnic groups compared with the white British majority. The graph shows the same predicted (based on geography and demographics) and actual hospital mortality results as in Figure 5, alongside an additional bar showing how registered COVID-19 deaths in care homes would affect the latter numbers if these deaths are occurring in proportion to the ethnic make-up of care homes. While estimated excess fatalities are reduced, the gap remains large for most ethnic minority groups. The ratio of actual to expected mortalities is reduced to 3.5 for black Africans, 2.7 for Pakistanis and 1.7 for black Caribbeans, for instance.
Figure 7. Accounting for care home deaths in relative mortality of ethnic groups
Note: Adjustment assumes that all care home deaths in each ethnic group are proportionate to ethnic group populations in care homes in England and Wales, and that hospital deaths per capita in each group are the same in Wales as in England.
Source: Authors’ calculations using COVID-19 hospital death statistics from Public Health England as of 21 April 2020, COVID-19 death data from ONS weekly occurrences up to 17 April 2020, and 2011 ONS Census of England and Wales.
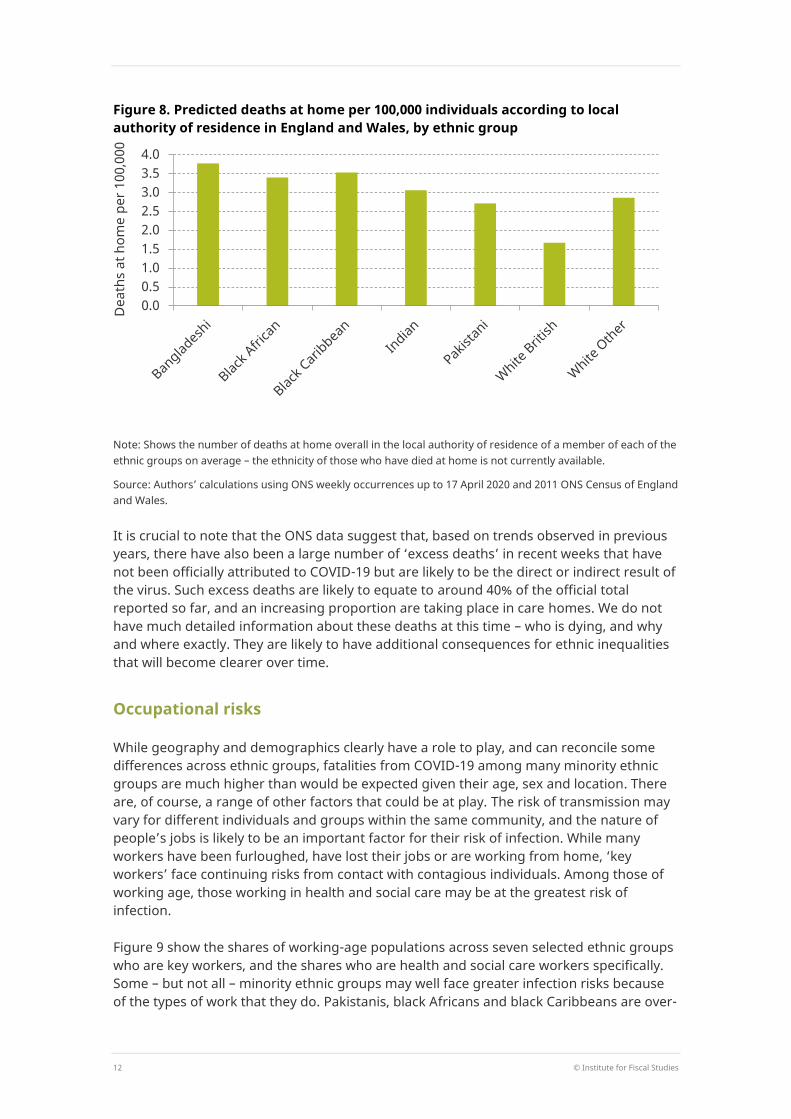
Understanding how deaths at home may vary across ethnic groups is challenging with the data that are currently available. However, the geographic distribution of these deaths suggests they are disproportionately happening in areas with large populations of ethnic minorities (Figure 8). This may suggest that deaths at home will go in the other direction to deaths in care homes in terms of their effect on overall ethnic inequalities in COVID-19 deaths. It is hard to draw strong conclusions on the basis of this evidence though: it may be the case that a white British person is more likely than an ethnic minority person to die at home rather than in a hospital in a given area.
0.0 0.5 1.0 1.5 2.0 2.5 3.0
Any other white
Pakistani
Mixed ethnicity (total)
Indian
Black Caribbean
Black African
Bangladeshi
White British
Predicted and actual mortality relative to white British
Demographics and geographyActual hospital deaths (England)Adjustment for care homes
12 © Institute for Fiscal Studies
Figure 8. Predicted deaths at home per 100,000 individuals according to local authority of residence in England and Wales, by ethnic group
Note: Shows the number of deaths at home overall in the local authority of residence of a member of each of the ethnic groups on average – the ethnicity of those who have died at home is not currently available.
Source: Authors’ calculations using ONS weekly occurrences up to 17 April 2020 and 2011 ONS Census of England and Wales.
It is crucial to note that the ONS data suggest that, based on trends observed in previous years, there have also been a large number of ‘excess deaths’ in recent weeks that have not been officially attributed to COVID-19 but are likely to be the direct or indirect result of the virus. Such excess deaths are likely to equate to around 40% of the official total reported so far, and an increasing proportion are taking place in care homes. We do not have much detailed information about these deaths at this time – who is dying, and why and where exactly. They are likely to have additional consequences for ethnic inequalities that will become clearer over time.
Occupational risks
While geography and demographics clearly have a role to play, and can reconcile some differences across ethnic groups, fatalities from COVID-19 among many minority ethnic groups are much higher than would be expected given their age, sex and location. There are, of course, a range of other factors that could be at play. The risk of transmission may vary for different individuals and groups within the same community, and the nature of people’s jobs is likely to be an important factor for their risk of infection. While many workers have been furloughed, have lost their jobs or are working from home, ‘key workers’ face continuing risks from contact with contagious individuals. Among those of working age, those working in health and social care may be at the greatest risk of infection.
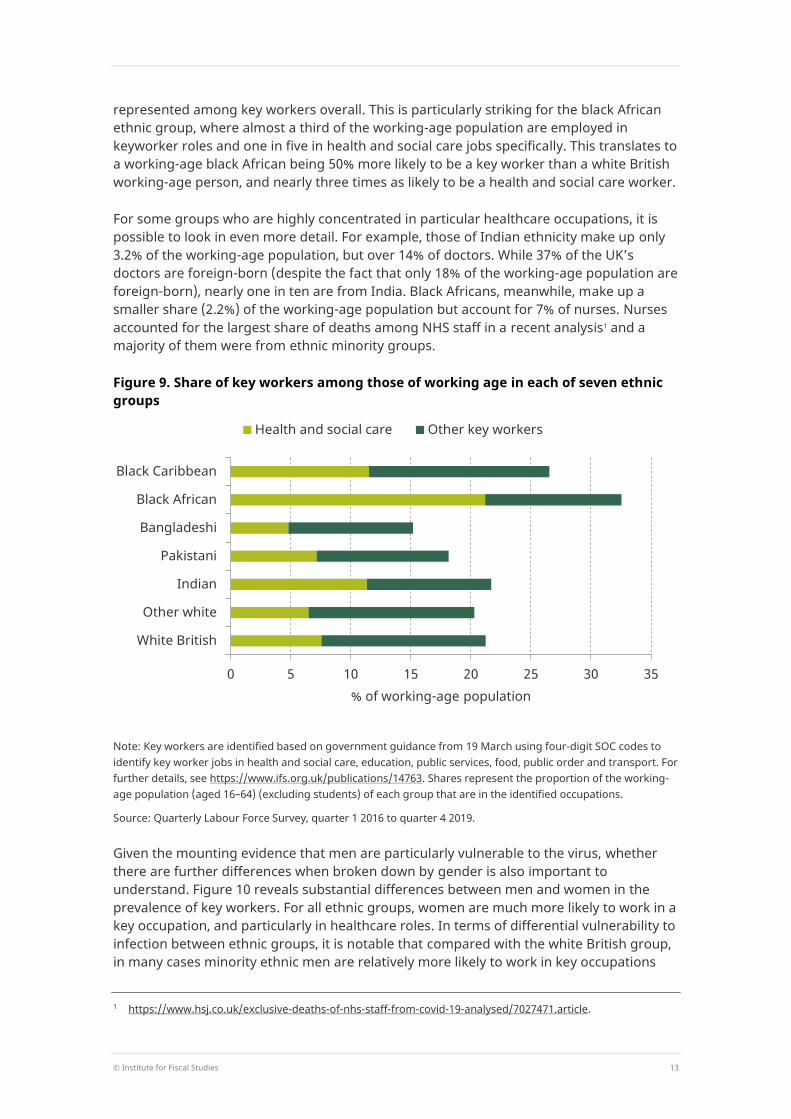
Figure 9 show the shares of working-age populations across seven selected ethnic groups who are key workers, and the shares who are health and social care workers specifically. Some – but not all – minority ethnic groups may well face greater infection risks because of the types of work that they do. Pakistanis, black Africans and black Caribbeans are over-
0.00.51.01.52.02.53.03.54.0
Dea
ths
at h
ome
per 1
00,0
00
© Institute for Fiscal Studies 13
represented among key workers overall. This is particularly striking for the black African ethnic group, where almost a third of the working-age population are employed in keyworker roles and one in five in health and social care jobs specifically. This translates to a working-age black African being 50% more likely to be a key worker than a white British working-age person, and nearly three times as likely to be a health and social care worker.
For some groups who are highly concentrated in particular healthcare occupations, it is possible to look in even more detail. For example, those of Indian ethnicity make up only 3.2% of the working-age population, but over 14% of doctors. While 37% of the UK’s doctors are foreign-born (despite the fact that only 18% of the working-age population are foreign-born), nearly one in ten are from India. Black Africans, meanwhile, make up a smaller share (2.2%) of the working-age population but account for 7% of nurses. Nurses accounted for the largest share of deaths among NHS staff in a recent analysis1 and a majority of them were from ethnic minority groups.
Figure 9. Share of key workers among those of working age in each of seven ethnic groups
Note: Key workers are identified based on government guidance from 19 March using four-digit SOC codes to identify key worker jobs in health and social care, education, public services, food, public order and transport. For further details, see https://www.ifs.org.uk/publications/14763. Shares represent the proportion of the working-age population (aged 16–64) (excluding students) of each group that are in the identified occupations.
Source: Quarterly Labour Force Survey, quarter 1 2016 to quarter 4 2019.
Given the mounting evidence that men are particularly vulnerable to the virus, whether there are further differences when broken down by gender is also important to understand. Figure 10 reveals substantial differences between men and women in the prevalence of key workers. For all ethnic groups, women are much more likely to work in a key occupation, and particularly in healthcare roles. In terms of differential vulnerability to infection between ethnic groups, it is notable that compared with the white British group, in many cases minority ethnic men are relatively more likely to work in key occupations
1 https://www.hsj.co.uk/exclusive-deaths-of-nhs-staff-from-covid-19-analysed/7027471.article.
0 5 10 15 20 25 30 35
White British
Other white
Indian
Pakistani
Bangladeshi
Black African
Black Caribbean
% of working-age population
Health and social care Other key workers
14 © Institute for Fiscal Studies
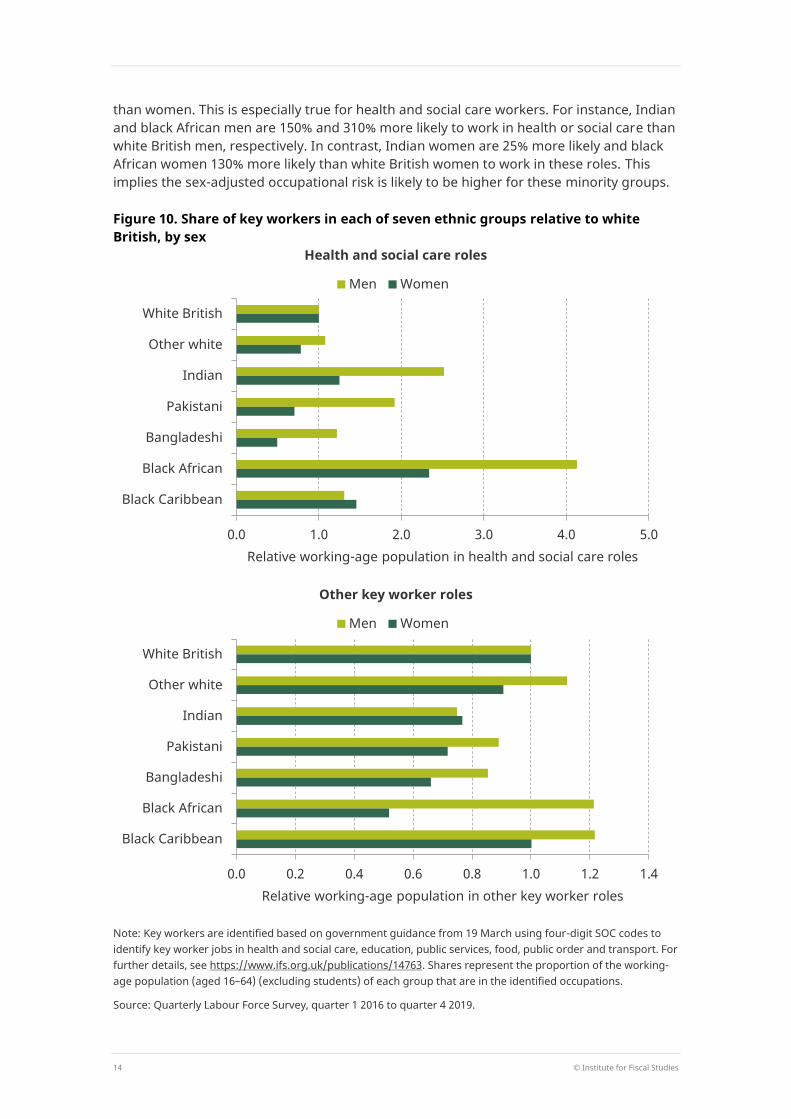
than women. This is especially true for health and social care workers. For instance, Indian and black African men are 150% and 310% more likely to work in health or social care than white British men, respectively. In contrast, Indian women are 25% more likely and black African women 130% more likely than white British women to work in these roles. This implies the sex-adjusted occupational risk is likely to be higher for these minority groups.
Figure 10. Share of key workers in each of seven ethnic groups relative to white British, by sex
Health and social care roles
Other key worker roles
Note: Key workers are identified based on government guidance from 19 March using four-digit SOC codes to identify key worker jobs in health and social care, education, public services, food, public order and transport. For further details, see https://www.ifs.org.uk/publications/14763. Shares represent the proportion of the working-age population (aged 16–64) (excluding students) of each group that are in the identified occupations.
Source: Quarterly Labour Force Survey, quarter 1 2016 to quarter 4 2019.
0.0 1.0 2.0 3.0 4.0 5.0
White British
Other white
Indian
Pakistani
Bangladeshi
Black African
Black Caribbean
Relative working-age population in health and social care roles
Men Women
0.0 0.2 0.4 0.6 0.8 1.0 1.2 1.4
White British
Other white
Indian
Pakistani
Bangladeshi
Black African
Black Caribbean
Relative working-age population in other key worker roles
Men Women
© Institute for Fiscal Studies 15
Other relevant factors
Apart from infection risk at work, some ethnic groups may be more at risk of community transmission due to different family and household structures. South Asian ethnic groups are much more likely to live in larger households, for instance, which all else equal will make transmission more likely. Taking London as an example, just under a third of households are a single person, but among households where the household head is Bangladeshi, Indian and Pakistani, the figures are 11%, 17% and 13%, respectively.
Related to this, compared with white British households, minority ethnic groups also tend to be more likely to live in overcrowded accommodation – even after controlling for region of the country. Fewer than 2% of white British households in London have more residents than rooms; in contrast, this figure is just under 30% for Bangladeshi households, 18% for Pakistani households and 16% for black African households. Such conditions are likely to make self-isolation much more difficult and increase opportunities for within-household transmission for some ethnic groups. However, such overcrowding is not so prevalent for black Caribbeans, who nevertheless face the highest number of hospital deaths per capita thus far, while Bangladeshi death rates are much lower.
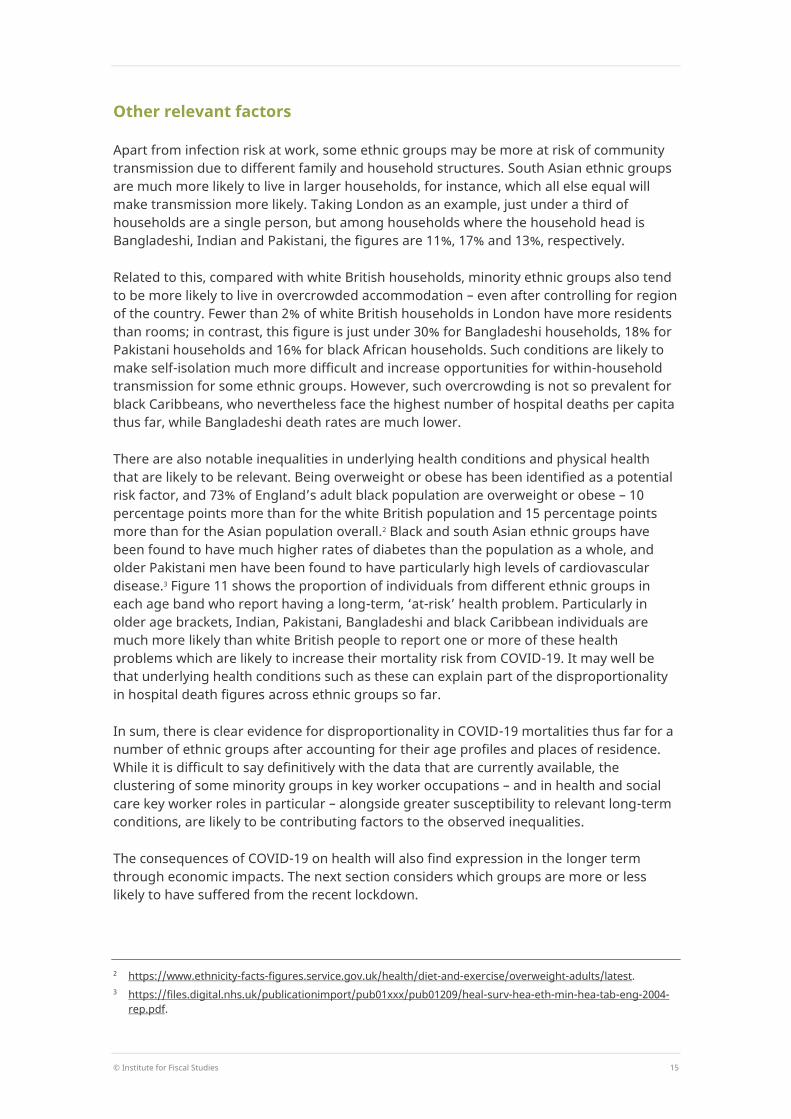
There are also notable inequalities in underlying health conditions and physical health that are likely to be relevant. Being overweight or obese has been identified as a potential risk factor, and 73% of England’s adult black population are overweight or obese – 10 percentage points more than for the white British population and 15 percentage points more than for the Asian population overall.2 Black and south Asian ethnic groups have been found to have much higher rates of diabetes than the population as a whole, and older Pakistani men have been found to have particularly high levels of cardiovascular disease.3 Figure 11 shows the proportion of individuals from different ethnic groups in each age band who report having a long-term, ‘at-risk’ health problem. Particularly in older age brackets, Indian, Pakistani, Bangladeshi and black Caribbean individuals are much more likely than white British people to report one or more of these health problems which are likely to increase their mortality risk from COVID-19. It may well be that underlying health conditions such as these can explain part of the disproportionality in hospital death figures across ethnic groups so far.
In sum, there is clear evidence for disproportionality in COVID-19 mortalities thus far for a number of ethnic groups after accounting for their age profiles and places of residence. While it is difficult to say definitively with the data that are currently available, the clustering of some minority groups in key worker occupations – and in health and social care key worker roles in particular – alongside greater susceptibility to relevant long-term conditions, are likely to be contributing factors to the observed inequalities.
The consequences of COVID-19 on health will also find expression in the longer term through economic impacts. The next section considers which groups are more or less likely to have suffered from the recent lockdown.
2 https://www.ethnicity-facts-figures.service.gov.uk/health/diet-and-exercise/overweight-adults/latest. 3 https://files.digital.nhs.uk/publicationimport/pub01xxx/pub01209/heal-surv-hea-eth-min-hea-tab-eng-2004-
rep.pdf.
16 © Institute for Fiscal Studies
Figure 11. At-risk long-term health conditions by ethnic group and age in England and Wales, relative to white British
Note: Self-reported long-term health problems, where ‘at-risk’ includes one or more of chest and breathing problems, heart, blood pressure or circulation problems, and diabetes.
Source: Quarterly Labour Force Survey, quarter 1 2016 to quarter 4 2019.
0.0
0.2
0.4
0.6
0.8
1.0
1.2
1.4
1.6
1.8
2.0
Prev
alen
ce o
f at-
risk
heal
th c
ondi
tions
,re
lativ
e to
whi
te B
ritis
h16–29 30–44 45–59 60+
© Institute for Fiscal Studies 17
2. Economic vulnerability In order to confront the public health crisis, the government has implemented unprecedented social distancing measures. This has created a unique type of economic crisis, the effects of which are likely to be experienced unequally as different sectors and household types are more or less exposed to the effects of the restrictions put in place. In this section, we consider how the economic characteristics of the main ethnic groups in England and Wales may result in different risks from the short-run effects of the current crisis. We focus on those of working age given they are potentially most at risk from the economic crisis. This age group covers larger shares of some groups than others given differing age profiles (see Figure 2). In the medium and long term, additional unequal impacts are likely to arise through disruption to education, occupational and geographical mobility, and from policy responses to the crisis. These are crucial to understand but are beyond the scope of this report.
Family characteristics
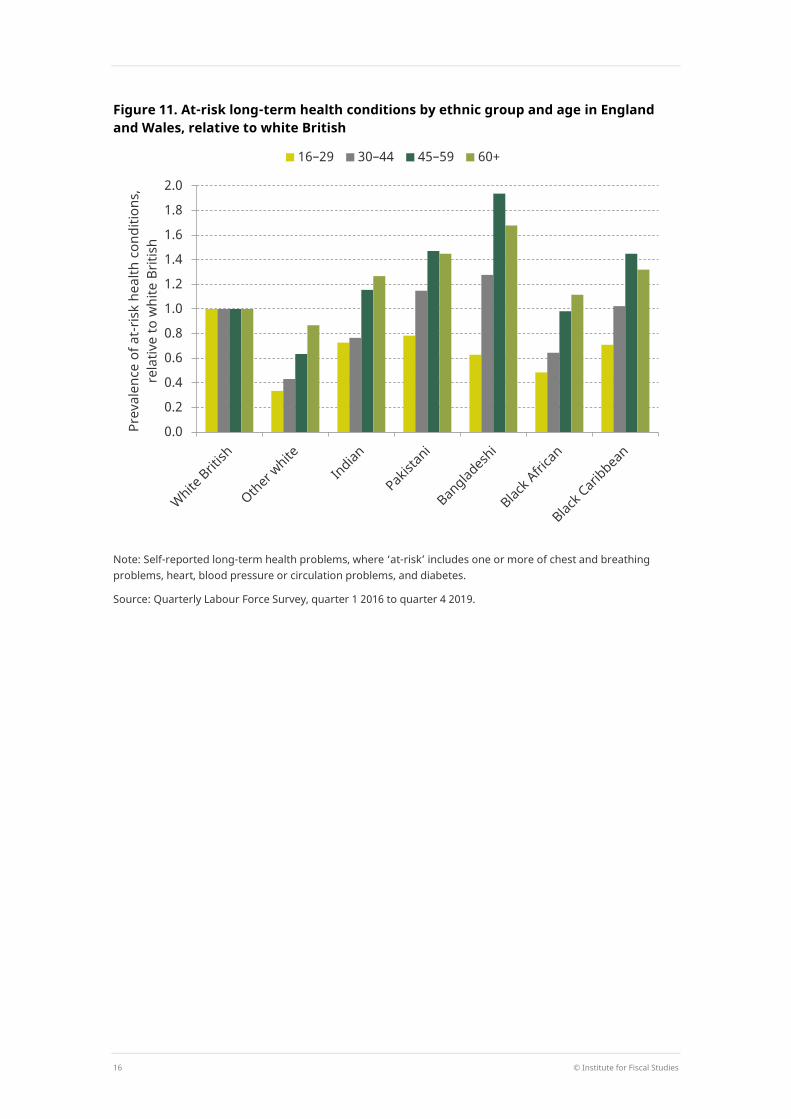
As well as substantial differences in age profiles, the main ethnic groups also have very different characteristics in terms of household structure and labour market participation, both of which are important for understanding how changes in individual employment and earnings may affect overall between-group inequalities. Fewer Pakistani and Bangladeshi individuals are in paid work than in other groups, largely owing to lower labour market participation amongst women. This might suggest that on aggregate these groups are less exposed to changes in economic circumstances resulting from the crisis but, alongside black Africans and black Caribbeans, they are especially likely to reside in families where only one person is in paid work (Table 1), implying greater household-level exposure.
Table 1. Economic activity of working-age populations by ethnic group Group In paid work
(%) Number in paid work in family (%)
0 1 2+
White British 79.7 11.6 30.0 58.4
Other white 85.1 5.2 39.7 55.1
Indian 80.1 6.1 35.3 58.6
Pakistani 61.9 12.9 47.8 39.3
Bangladeshi 60.3 12.4 49.3 38.3
Black African 79.7 14.3 45.2 40.5
Black Caribbean 85.1 16.5 42.5 41.0
Note: ‘In paid work’ is the sum of the employed and self-employed. Estimates among those of working age (aged 16–64) excluding students.
Source: Quarterly Labour Force Survey, quarter 1 2016 to quarter 4 2019.
18 © Institute for Fiscal Studies
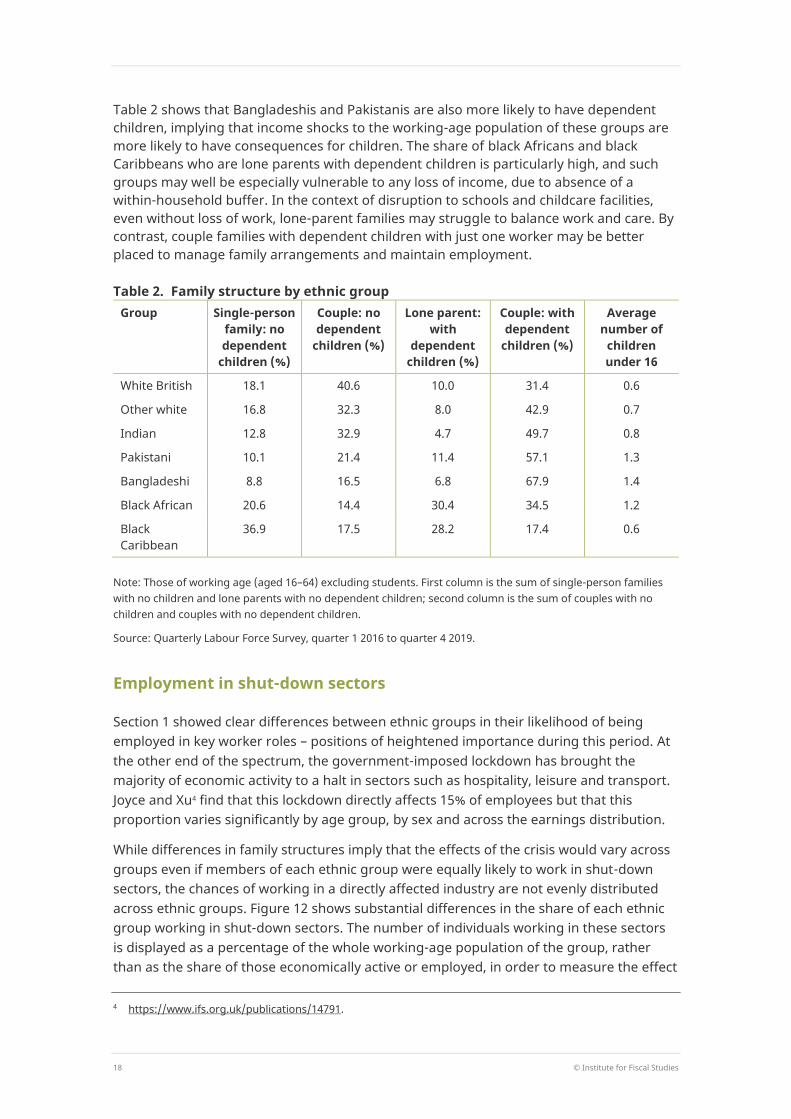
Table 2 shows that Bangladeshis and Pakistanis are also more likely to have dependent children, implying that income shocks to the working-age population of these groups are more likely to have consequences for children. The share of black Africans and black Caribbeans who are lone parents with dependent children is particularly high, and such groups may well be especially vulnerable to any loss of income, due to absence of a within-household buffer. In the context of disruption to schools and childcare facilities, even without loss of work, lone-parent families may struggle to balance work and care. By contrast, couple families with dependent children with just one worker may be better placed to manage family arrangements and maintain employment.
Table 2. Family structure by ethnic group Group Single-person
family: no dependent
children (%)
Couple: no dependent
children (%)
Lone parent: with
dependent children (%)
Couple: with dependent
children (%)
Average number of
children under 16
White British 18.1 40.6 10.0 31.4 0.6
Other white 16.8 32.3 8.0 42.9 0.7
Indian 12.8 32.9 4.7 49.7 0.8
Pakistani 10.1 21.4 11.4 57.1 1.3
Bangladeshi 8.8 16.5 6.8 67.9 1.4
Black African 20.6 14.4 30.4 34.5 1.2
Black Caribbean
36.9 17.5 28.2 17.4 0.6
Note: Those of working age (aged 16–64) excluding students. First column is the sum of single-person families with no children and lone parents with no dependent children; second column is the sum of couples with no children and couples with no dependent children.
Source: Quarterly Labour Force Survey, quarter 1 2016 to quarter 4 2019.
Employment in shut-down sectors
Section 1 showed clear differences between ethnic groups in their likelihood of being employed in key worker roles – positions of heightened importance during this period. At the other end of the spectrum, the government-imposed lockdown has brought the majority of economic activity to a halt in sectors such as hospitality, leisure and transport. Joyce and Xu4 find that this lockdown directly affects 15% of employees but that this proportion varies significantly by age group, by sex and across the earnings distribution.
While differences in family structures imply that the effects of the crisis would vary across groups even if members of each ethnic group were equally likely to work in shut-down sectors, the chances of working in a directly affected industry are not evenly distributed across ethnic groups. Figure 12 shows substantial differences in the share of each ethnic group working in shut-down sectors. The number of individuals working in these sectors is displayed as a percentage of the whole working-age population of the group, rather than as the share of those economically active or employed, in order to measure the effect
4 https://www.ifs.org.uk/publications/14791.
© Institute for Fiscal Studies 19
on the group as a whole and to ensure estimates are not affected by the substantial differences in labour market participation – particularly among women.
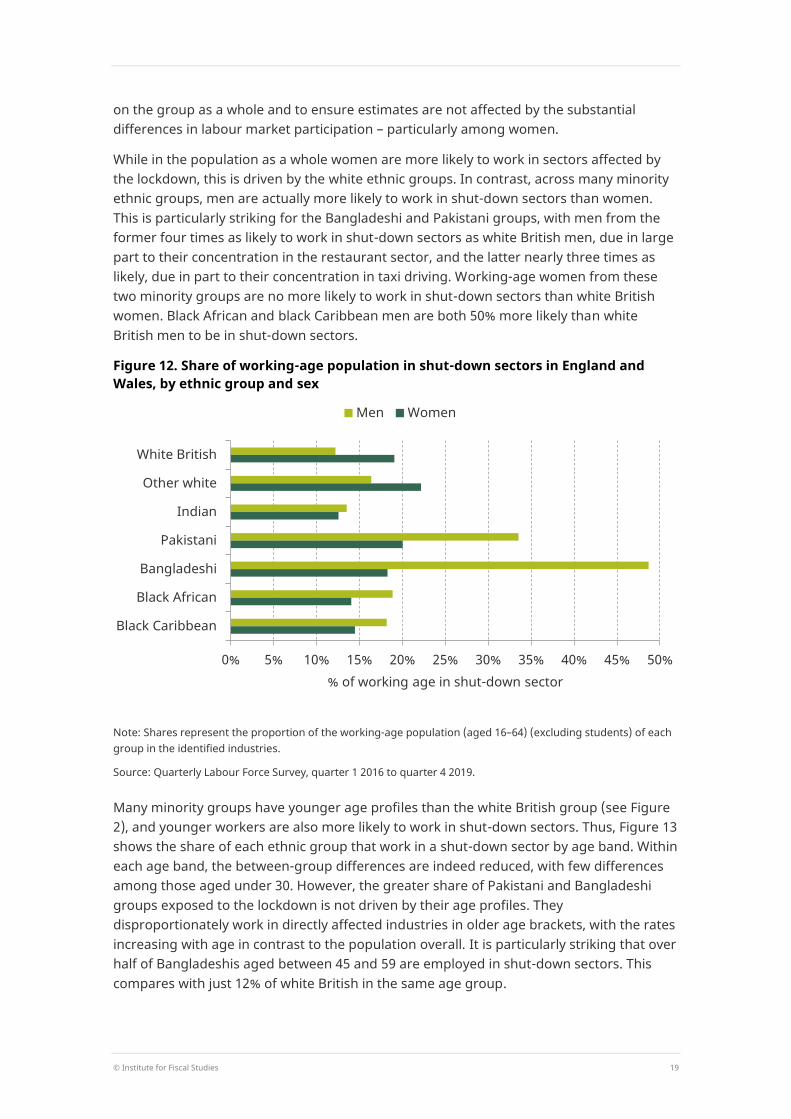
While in the population as a whole women are more likely to work in sectors affected by the lockdown, this is driven by the white ethnic groups. In contrast, across many minority ethnic groups, men are actually more likely to work in shut-down sectors than women. This is particularly striking for the Bangladeshi and Pakistani groups, with men from the former four times as likely to work in shut-down sectors as white British men, due in large part to their concentration in the restaurant sector, and the latter nearly three times as likely, due in part to their concentration in taxi driving. Working-age women from these two minority groups are no more likely to work in shut-down sectors than white British women. Black African and black Caribbean men are both 50% more likely than white British men to be in shut-down sectors.
Figure 12. Share of working-age population in shut-down sectors in England and Wales, by ethnic group and sex
Note: Shares represent the proportion of the working-age population (aged 16–64) (excluding students) of each group in the identified industries.
Source: Quarterly Labour Force Survey, quarter 1 2016 to quarter 4 2019.
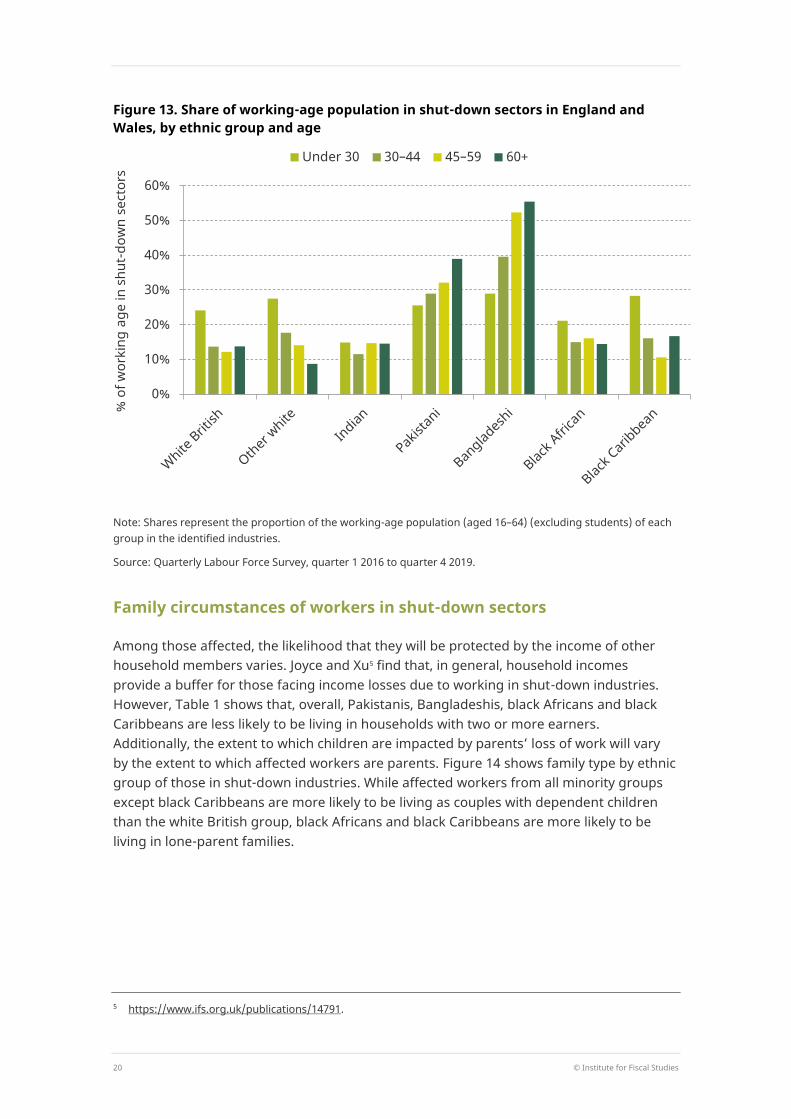
Many minority groups have younger age profiles than the white British group (see Figure 2), and younger workers are also more likely to work in shut-down sectors. Thus, Figure 13 shows the share of each ethnic group that work in a shut-down sector by age band. Within each age band, the between-group differences are indeed reduced, with few differences among those aged under 30. However, the greater share of Pakistani and Bangladeshi groups exposed to the lockdown is not driven by their age profiles. They disproportionately work in directly affected industries in older age brackets, with the rates increasing with age in contrast to the population overall. It is particularly striking that over half of Bangladeshis aged between 45 and 59 are employed in shut-down sectors. This compares with just 12% of white British in the same age group.
0% 5% 10% 15% 20% 25% 30% 35% 40% 45% 50%
White British
Other white
Indian
Pakistani
Bangladeshi
Black African
Black Caribbean
% of working age in shut-down sector
Men Women
20 © Institute for Fiscal Studies
Figure 13. Share of working-age population in shut-down sectors in England and Wales, by ethnic group and age
Note: Shares represent the proportion of the working-age population (aged 16–64) (excluding students) of each group in the identified industries.
Source: Quarterly Labour Force Survey, quarter 1 2016 to quarter 4 2019.
Family circumstances of workers in shut-down sectors
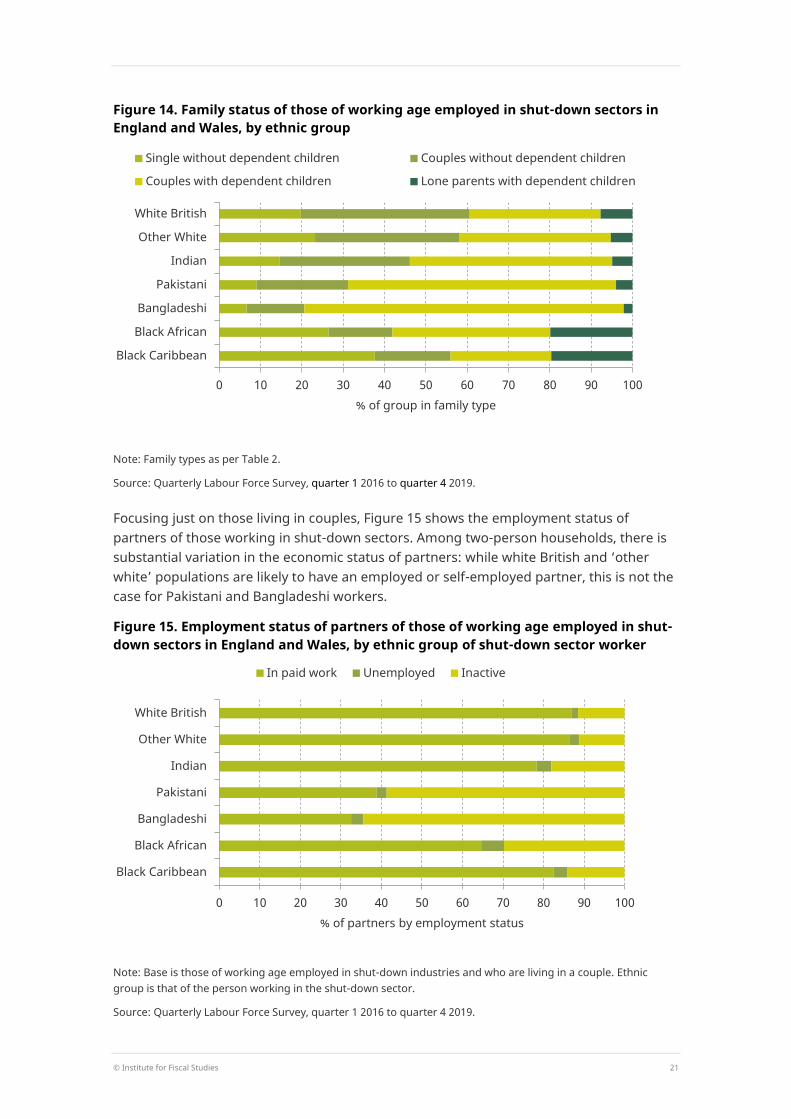
Among those affected, the likelihood that they will be protected by the income of other household members varies. Joyce and Xu5 find that, in general, household incomes provide a buffer for those facing income losses due to working in shut-down industries. However, Table 1 shows that, overall, Pakistanis, Bangladeshis, black Africans and black Caribbeans are less likely to be living in households with two or more earners. Additionally, the extent to which children are impacted by parents’ loss of work will vary by the extent to which affected workers are parents. Figure 14 shows family type by ethnic group of those in shut-down industries. While affected workers from all minority groups except black Caribbeans are more likely to be living as couples with dependent children than the white British group, black Africans and black Caribbeans are more likely to be living in lone-parent families.
5 https://www.ifs.org.uk/publications/14791.
0%
10%
20%
30%
40%
50%
60%
% o
f wor
king
age
in s
hut-
dow
n se
ctor
s
Under 30 30–44 45–59 60+
© Institute for Fiscal Studies 21
Figure 14. Family status of those of working age employed in shut-down sectors in England and Wales, by ethnic group
Note: Family types as per Table 2.
Source: Quarterly Labour Force Survey, quarter 1 2016 to quarter 4 2019.
Focusing just on those living in couples, Figure 15 shows the employment status of partners of those working in shut-down sectors. Among two-person households, there is substantial variation in the economic status of partners: while white British and ‘other white’ populations are likely to have an employed or self-employed partner, this is not the case for Pakistani and Bangladeshi workers.
Figure 15. Employment status of partners of those of working age employed in shut-down sectors in England and Wales, by ethnic group of shut-down sector worker
Note: Base is those of working age employed in shut-down industries and who are living in a couple. Ethnic group is that of the person working in the shut-down sector.
Source: Quarterly Labour Force Survey, quarter 1 2016 to quarter 4 2019.
0 10 20 30 40 50 60 70 80 90 100
White British
Other White
Indian
Pakistani
Bangladeshi
Black African
Black Caribbean
% of group in family type
Single without dependent children Couples without dependent children
Couples with dependent children Lone parents with dependent children
0 10 20 30 40 50 60 70 80 90 100
White British
Other White
Indian
Pakistani
Bangladeshi
Black African
Black Caribbean
% of partners by employment status
In paid work Unemployed Inactive
22 © Institute for Fiscal Studies
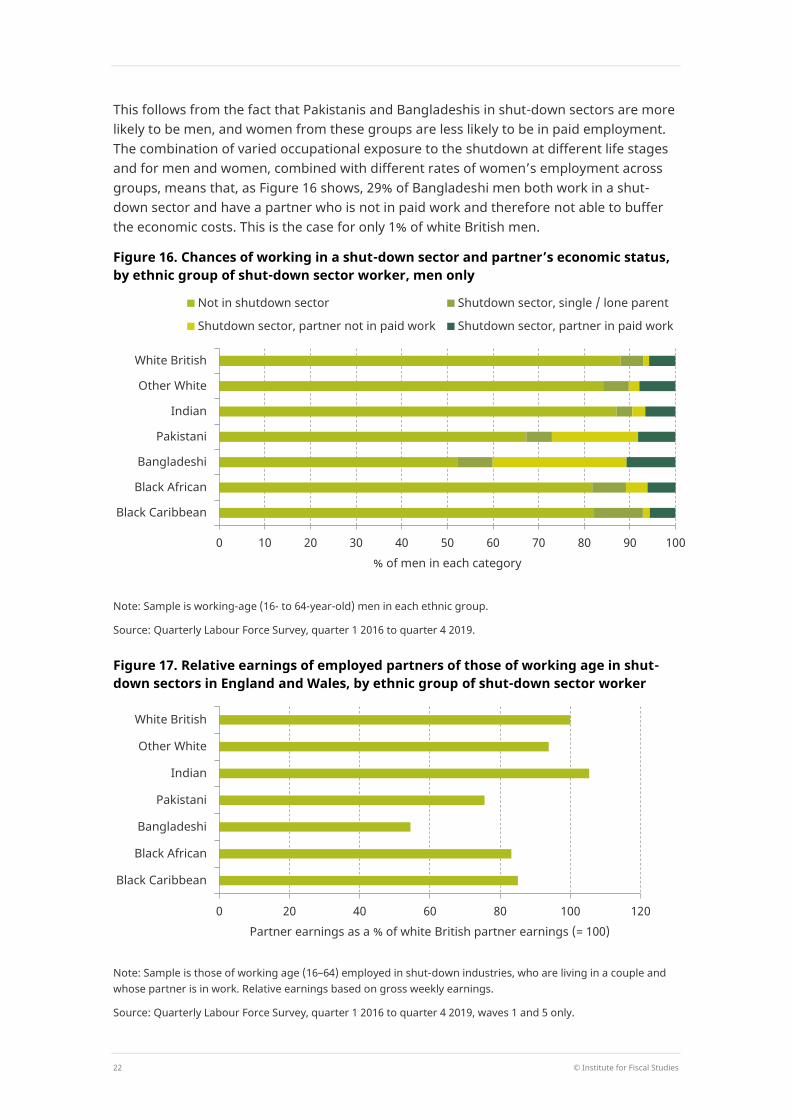
This follows from the fact that Pakistanis and Bangladeshis in shut-down sectors are more likely to be men, and women from these groups are less likely to be in paid employment. The combination of varied occupational exposure to the shutdown at different life stages and for men and women, combined with different rates of women’s employment across groups, means that, as Figure 16 shows, 29% of Bangladeshi men both work in a shut-down sector and have a partner who is not in paid work and therefore not able to buffer the economic costs. This is the case for only 1% of white British men.
Figure 16. Chances of working in a shut-down sector and partner’s economic status, by ethnic group of shut-down sector worker, men only
Note: Sample is working-age (16- to 64-year-old) men in each ethnic group.
Source: Quarterly Labour Force Survey, quarter 1 2016 to quarter 4 2019.
Figure 17. Relative earnings of employed partners of those of working age in shut-down sectors in England and Wales, by ethnic group of shut-down sector worker
Note: Sample is those of working age (16–64) employed in shut-down industries, who are living in a couple and whose partner is in work. Relative earnings based on gross weekly earnings.
Source: Quarterly Labour Force Survey, quarter 1 2016 to quarter 4 2019, waves 1 and 5 only.
0 10 20 30 40 50 60 70 80 90 100
White British
Other White
Indian
Pakistani
Bangladeshi
Black African
Black Caribbean
% of men in each category
Not in shutdown sector Shutdown sector, single / lone parent
Shutdown sector, partner not in paid work Shutdown sector, partner in paid work
0 20 40 60 80 100 120
White British
Other White
Indian
Pakistani
Bangladeshi
Black African
Black Caribbean
Partner earnings as a % of white British partner earnings (= 100)
© Institute for Fiscal Studies 23
Moreover, even for those with partners in paid work, there are substantial differences in average weekly earnings, as Figure 17 shows. Partner earnings for Pakistanis, Bangladeshis, black Africans and black Caribbeans in shut-down industries are all lower than those for the white British majority.
Self-employment and income risks
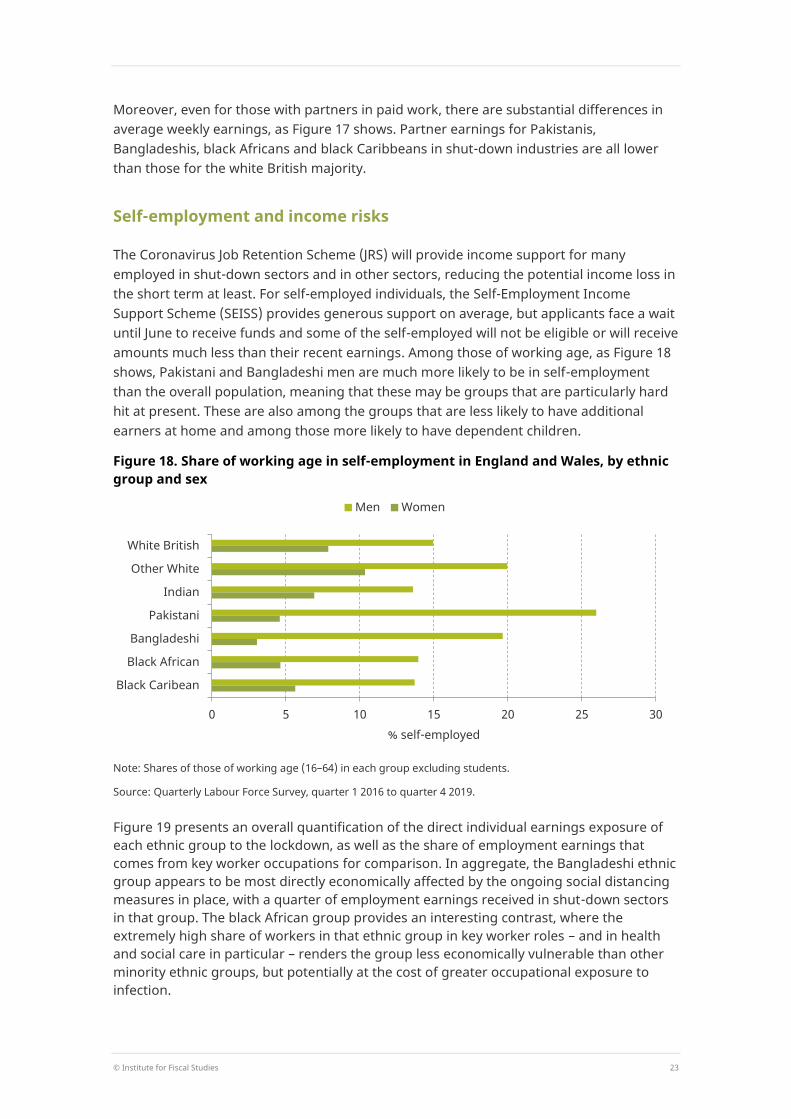
The Coronavirus Job Retention Scheme (JRS) will provide income support for many employed in shut-down sectors and in other sectors, reducing the potential income loss in the short term at least. For self-employed individuals, the Self-Employment Income Support Scheme (SEISS) provides generous support on average, but applicants face a wait until June to receive funds and some of the self-employed will not be eligible or will receive amounts much less than their recent earnings. Among those of working age, as Figure 18 shows, Pakistani and Bangladeshi men are much more likely to be in self-employment than the overall population, meaning that these may be groups that are particularly hard hit at present. These are also among the groups that are less likely to have additional earners at home and among those more likely to have dependent children.
Figure 18. Share of working age in self-employment in England and Wales, by ethnic group and sex
Note: Shares of those of working age (16–64) in each group excluding students.
Source: Quarterly Labour Force Survey, quarter 1 2016 to quarter 4 2019.
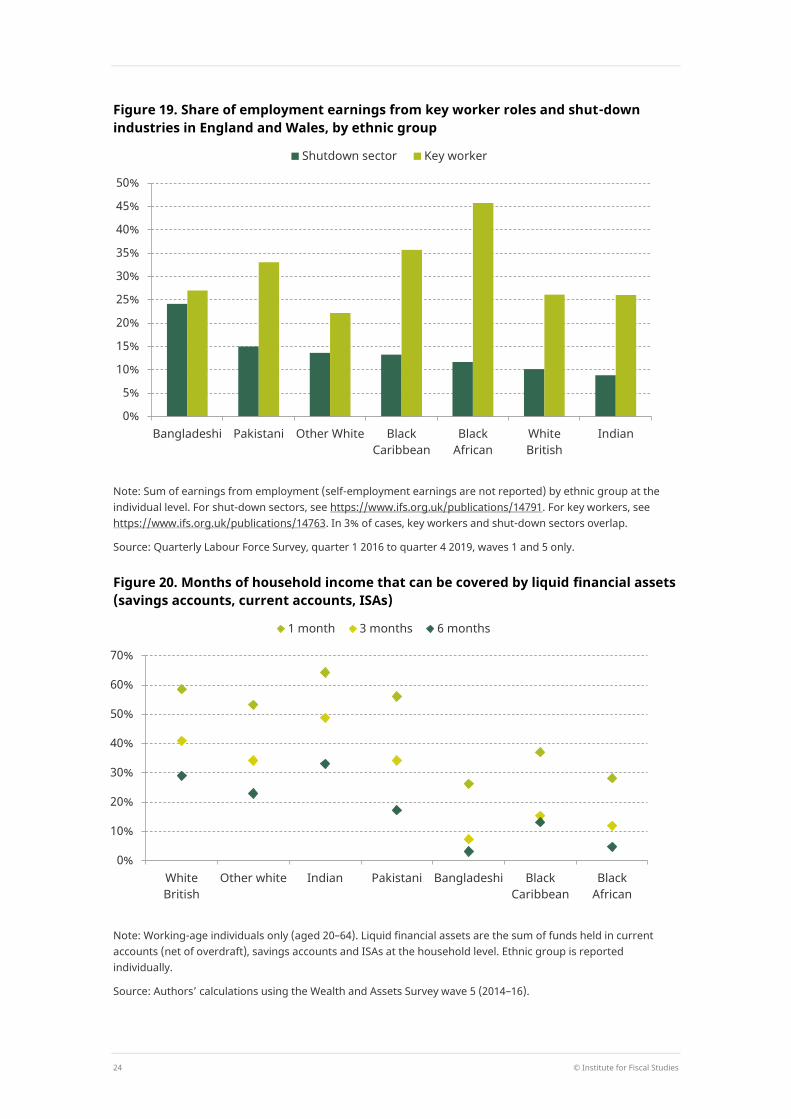
Figure 19 presents an overall quantification of the direct individual earnings exposure of each ethnic group to the lockdown, as well as the share of employment earnings that comes from key worker occupations for comparison. In aggregate, the Bangladeshi ethnic group appears to be most directly economically affected by the ongoing social distancing measures in place, with a quarter of employment earnings received in shut-down sectors in that group. The black African group provides an interesting contrast, where the extremely high share of workers in that ethnic group in key worker roles – and in health and social care in particular – renders the group less economically vulnerable than other minority ethnic groups, but potentially at the cost of greater occupational exposure to infection.
0 5 10 15 20 25 30
White British
Other White
Indian
Pakistani
Bangladeshi
Black African
Black Caribean
% self-employed
Men Women
24 © Institute for Fiscal Studies
Figure 19. Share of employment earnings from key worker roles and shut-down industries in England and Wales, by ethnic group
Note: Sum of earnings from employment (self-employment earnings are not reported) by ethnic group at the individual level. For shut-down sectors, see https://www.ifs.org.uk/publications/14791. For key workers, see https://www.ifs.org.uk/publications/14763. In 3% of cases, key workers and shut-down sectors overlap.
Source: Quarterly Labour Force Survey, quarter 1 2016 to quarter 4 2019, waves 1 and 5 only.
Figure 20. Months of household income that can be covered by liquid financial assets (savings accounts, current accounts, ISAs)
Note: Working-age individuals only (aged 20–64). Liquid financial assets are the sum of funds held in current accounts (net of overdraft), savings accounts and ISAs at the household level. Ethnic group is reported individually.
Source: Authors’ calculations using the Wealth and Assets Survey wave 5 (2014–16).
0%
5%
10%
15%
20%
25%
30%
35%
40%
45%
50%
Bangladeshi Pakistani Other White BlackCaribbean
BlackAfrican
WhiteBritish
Indian
Shutdown sector Key worker
0%
10%
20%
30%
40%
50%
60%
70%
WhiteBritish
Other white Indian Pakistani Bangladeshi BlackCaribbean
BlackAfrican
1 month 3 months 6 months
© Institute for Fiscal Studies 25
For many households, even short-term income shocks can present a serious challenge to their finances. Overall, 60% of working-age individuals live in households with accessible savings sufficient to cover three months of income, but this varies substantially by ethnic group, as shown by Figure 20. Among working-age Bangladeshi, black Caribbean and black African individuals, only around 30% live in households with enough saved in current accounts, savings accounts and ISAs to cover one month of household income, and around 10% can cover three months of income. This latter figure is approximately a fifth of that for the Indian ethnic group, and a quarter of that for the white British majority. For some of those who are self-employed, the wait until June for the SEISS might be particularly difficult.
26 © Institute for Fiscal Studies
3. Conclusion Taken together, Sections 1 and 2 of this report paint a complex picture, with much still unknown about the unequal effects of the COVID-19 crisis on different ethnic groups in England and Wales in the short term and in the future. Some minority groups have already been disproportionately exposed to risk of infection, and the ongoing sector shutdown also has implications for ethnic inequalities. There is no single narrative that can describe or account for the impacts of the current crisis on all minority groups.
Overall, given demographic and geographic profiles, most minority ethnic groups are suffering excess hospital fatalities in England. Official non-hospital deaths can only account for a small part of the disparity compared with the white British majority so far. Age and location clearly play a role – and seem to explain important differences between different minority groups – but they do not tell the full story. Underlying health conditions, occupational exposure and a range of other factors are likely to be important, with some more important for particular groups: Bangladeshi men have high rates of underlying health problems, and black Africans and Indian men are particularly exposed to the virus due to their prevalence in healthcare roles. The importance of each factor for each group will become clearer as more research is undertaken.
Ethnic groups also vary substantially in their economic vulnerability under the restrictions currently in place. ‘Other white’ and Indian ethnic groups face lower economic risks and are more comparable to white British people in this regard. Bangladeshi and Pakistani groups, by contrast, appear to be particularly at risk due to the high percentage of each group working in shut-down sectors and/or in self-employment, combined with the prevalence of single-earner households which reduces the potential for income buffers within the household. The pervasiveness of key worker employment in other minority groups reduces their risk of income losses, while leaving them at a heightened risk of exposure to the virus itself. Both scenarios though are, in part, a consequence of the way the current labour market draws on both immigrant and ethnic minority workers to fulfil roles in care, transport and delivery sectors and in the more marginal hospitality and self-employed sectors.