Embed Size (px)
Citation preview
University of Texas at El PasoDigitalCommonsUTEP
Departmental Papers (E amp F) Department of Economics and Finance
3-2014
Are Online Pharmacy Prices Really Lower inMexicoThomas M Fullerton JrUniversity of Texas at El Paso tomfutepedu
Adam G WalkeUniversity of Texas at El Paso agwalkeutepedu
Follow this and additional works at httpsdigitalcommonsutepeduecon_papers
Part of the E-Commerce Commons and the Health Economics CommonsCommentsUTEP Border Region Modeling ProjectTechnical Report TX14-2A revised version of this study is forthcoming in Asian Economic amp Financial Review
This Article is brought to you for free and open access by the Department of Economics and Finance at DigitalCommonsUTEP It has been acceptedfor inclusion in Departmental Papers (E amp F) by an authorized administrator of DigitalCommonsUTEP For more information please contactlweberutepedu
Recommended CitationFullerton Thomas M Jr and Walke Adam G Are Online Pharmacy Prices Really Lower in Mexico (2014) Departmental Papers (Eamp F) 81httpsdigitalcommonsutepeduecon_papers81
The University of Texas at El Paso
UTEP Border Region Modeling Project
Produced by University Communications March 2014
Technical Report TX14-2
Are Online Pharmacy Prices Really Lower in Mexico
The University of Texas at El Paso
Are Online Pharmacy Prices Really Lower in Mexico
Technical Report TX14-2 UTEP Border Region Modeling Project
UTEP Technical Report TX14-2 bull March 2014 Page 1
This technical report is a publication of the Border Region Modeling Project and the Department of Economics amp Finance at the University of Texas at El Paso For additional Border Region information please visit the wwwacademicsutepeduborder section of the UTEP web site
Please send comments to Border Region Modeling Project - CBA 236 Department of Economics amp Finance 500 West University El Paso TX 79968-0543
UTEP does not discriminate on the basis of race color national origin sex religion age or disability in employment or the provision of services
University of Texas at El Paso Diana Natalicio President Junius Gonzales Provost
Roberto Osegueda Vice Provost
UTEP College of Business Administration Border Economics amp Trade
Bob Nachtmann Dean Steve Johnson Associate Dean
Gary Frankwick Associate Dean Tim Roth Templeton Professor of Banking amp Economics
UTEP Technical Report TX14-2 bull March 2014 Page 2
UTEP Border Region Econometric Modeling Project
Corporate and Institutional Sponsors
Hunt Communities El Paso Water Utilities
Universidad Autoacutenoma de Ciudad Juaacuterez UTEP College of Business Administration
UTEP Department of Economics amp Finance City of El Paso Office of Management amp Budget
UACJ Instituto de Ciencias Sociales y Administracioacuten UTEP Center for the Study of Western Hemispheric Trade
Special thanks are given to the corporate and institutional sponsors of the UTEP Border Region Econometric Modeling Project In particular El Paso Water Utilities Hunt Communities and The University of Texas at El Paso have invested substantial time effort and financial resources in making this research project possible
Continued maintenance and expansion of the UTEP business modeling system requires ongoing financial support For information on potential means for supporting this research effort please contact Border Region Modeling Project - CBA 236 Department of Economics amp Finance 500 West University El Paso TX 79968-0543
UTEP Technical Report TX14-2 bull March 2014 Page 3
Are Online Pharmacy Prices Really Lower in Mexico
Thomas M Fullerton Jr Francisco J Pallares Adam G Walke Department of Economics amp Finance University of Texas at El Paso El Paso TX 79968-0543 Telephone 915-747-7747 Facsimile 915-747-6282 Email tomfutepedu
A revised version of this study is forthcoming in Asian Economic amp Financial Review
Abstract
Empirical research on international pharmaceutical prices has uncovered numerous interesting commonalities and differences across international markets This study examines price differences for brand name medicines sold over the Internet in the United States and Mexico Web sites in both countries advertise their services in English and price their products in dollars Sample data for 50 top selling medicines are from October 2011 for equal dosages on a per unit basis exclusive of shipping fees handling charges and taxes For a few medicines the savings available to consumers who purchase them from companies in Mexico are very large For most medicines in the sample the savings are comparable to those available from Internet sources in other countries Non-parametric test results indicate that the price differences are statistically significant
Keywords Brand Name Medicines Online Pharmacies Price Differences Applied Economics
JEL Category I11 Health Markets M21 Business EconomicsP52 Comparative Studies
Acknowledgements
Financial support for this research was provided by El Paso Water Utilities Hunt Companies of El Paso Hunt Communities Texas Department of Transportation JPMorgan Chase Bank of El Paso a UTEP College of Business Administration Faculty Research Grant and the James Foundation Scholarship Fund Helpful comments and suggestions were provided by Nathan Ashby and Tony Payan Econometric research assistance was provided by Carlos Morales
Introduction
In 2010 United States consumers spent close to $274 billion on pharmaceutical and other medical products (Christopher et al 2011) Many consumers understandably search for savings when purchasing medicine It is commonly believed that Internet prescription medications from Mexican pharmacies are less expensive than those sold at drug stores in the United States but relatively little evidence documents the purported price differentials The potential for consumer savings created by the price differences between countries is limited by United States legislation that restricts overseas online purchases to a maximum of 90-day supplies per customer for personal use (CBP 2011) Mexican online pharmacies benefit by being able to sell medicines subject to the 90-day supply limits to consumers in the United States via mail orders
UTEP Technical Report TX14-2 bull March 2014 Page 4
This study compares online pharmacy prices for Mexico and the United States The principal objective is to quantify whether Mexican online pharmacies truly offer lower prices to United States consumers Recent research indicates that contrary to popular opinion not all medicine prices are lower in Mexico (Fullerton and Miranda 2011) Given that the formal null hypothesis tested is that the unit price of an online prescription drug purchased in Mexico is equal to the Internet unit price of the same medicine ordered in the United States The data utilized for this test are prices for fifty brand name retail medicines These prices were collected on 12 October 2011 from medsmexcom pharmaciesherbalcom and bajapharmacycom in Mexico and from familymeds com and drugstorecom in the United States
The second section of this paper contains a literature review Data and methodology are discussed in the third section The fourth section summarizes the empirical results Concluding remarks and suggestions for further research are included in the fifth section
Literature Review
Most of the research on cross-border sales of Mexican pharmaceuticals focuses on ldquobrick-and-mortarrdquo or ldquowalk-inrdquo pharmacies that cater to medical tourists Survey evidence indicates that the primary reason for crossing the border to purchase medicine is customersrsquo perception that prices are lower in Mexico (de Guzman et al 2007 Byrd and Law 2009) Given the important role of relative prices among the various factors influencing the decision to buy medications across the border it is interesting to ask what percentage of cross-border pharmaceutical shoppers is insured Calvillo and Lal (2003) find that 81 percent of United States residents purchasing medications at a pharmacy in the border town of Nuevo Progreso Mexico have health insurance Similarly Saatsoglou (2004) reports that 62 percent of United States residents who purchase drugs abroad have prescription drug coverage Customers may opt to purchase medications in another country
even when they have insurance if copayments or annual deductibles are high and international price differences are large
Medicine price differences between the United States and other countries have received increasing attention in recent years One branch of the literature on this subject attempts to quantify international price differences while a second branch attempts to document why those differences exist Addressing the latter question Ridley (2005) argues that the prescription drug market meets the three conditions for differential pricing or price discrimination First sellers usually have some degree of market power derived from patents or copyrights Second some consumers are willing to pay more than others for the same product Danzon and Furukawa (2003) note that pharmaceutical prices in developed countries closely correlate with income levels which condition consumersrsquo ability and willingness to pay Finally differential pricing requires restrictions on arbitrage Wagner and McCarthy (2004) note that international arbitrage in pharmaceutical markets is often limited by government-imposed licensing requirements
While price discrimination may account for some portion of cross-country price differentials government intervention in the price-setting process also plays a role Some countries impose stringent cost controls on drugs sold within their borders (APC 2001) Kanavos and Vandoros (2011) find that differences in the extent of government intervention in the price-setting process are associated with variations in pharmaceutical prices across countries In a study of seven developed nations Danzon and Chao (2000) find that while countries with stricter regulatory regimes often have lower prices for certain types of medicine drug prices in those countries are also less likely to decline as a result of competition between pharmaceutical producers Manning (1997) documents that differences in legal systems and product liability laws between the United States and Canada account for at least some of the observed medicine price differentials between those countries
UTEP Technical Report TX14-2 bull March 2014 Page 5
Another branch of the literature attempts to quantify medicine price differences between the United States and other countries Quon et al (2005) find that customers can save approximately 24 percent per unit by purchasing medications from Canadian Internet pharmacies compared to major online United States drug stores Only three medications are found to be more expensive in Canada Similar results reported by Fullerton and Miranda (2011) indicate that medicine purchases at ldquowalk-inrdquo pharmacies in Ciudad Juarez Mexico also permit consumer savings The latter effort also reports evidence that not all medicines are more expensive in El Paso pharmacies The objective of this study is to contribute to this strand of the literature by quantifying online pharmacy price differentials between Mexico and the United States
Data and Methodology
The sample is comprised by the top-selling name brand medicines in the United States in 2010 as listed by the website drugscom Of those medications with the largest sales the ones that are available for both the United States and Mexico are included in the sample Prior research on medicine price differences particularly Quon et al (2005) also employs brand name medicines that constitute large shares of the medicine market at particular points in time The sample utilized in this effort follows that approach Each medication included in the sample had annual sales volumes of $474 million or more in 2010 and the 50 medicines in the sample collectively account for a large share of the pharmaceutical market in the United States
Generic medications are excluded from this study Danzon and Furukawa (2003) indicate that generic medications have lower prices in the United States than in Chile France Germany Italy Japan Mexico and the United Kingdom Generic drug sales represent only 27 percent of total medicine sales in United States (IMS 2012) Because of this the exclusion of these medications should not affect
the accuracy of the results obtained using online pharmacy prices for brand name pharmaceuticals
Price data collected are Internet pharmacy quotes for the United States and Mexico In selecting sources of online drug prices it is important to consider the reputability of each site Rabinovitch (2005) contends that while many online cross-border pharmacies are legitimate ldquoroguerdquo online pharmacies also exist and the products marketed through such sites are more likely to be sub-standard or even hazardous to consumer health Online sources of drug prices are therefore evaluated to screen out potential rogue pharmacies such as those that primarily market recreational and lifestyle drugs The pricing information is retrieved from two online pharmacies with headquarters in the United States (drugstorecom and familymedscom) and three online pharmacies with headquarters located in Mexico (bajapharmacycom pharmaciesherbal com and medsmexcom)
The drugstorecom site lists most of the medicines in the sample The only exceptions are Lantus SoloSTAR Seroquel XR Premarin and Ventolin HFA Prices for these medicines are retrieved from familymedscom to complete the sample In Mexico the online pharmacy site bajapharmacy com is employed because it also advertises most of the medicines The webpage for that site is in English and its prices are quoted in United States dollars Prices for several medicines must be obtained from medsmexcom or pharmaciesherbal com Spiriva Lantus Diovan HCT Viagra Atripla Lantus SoloSTAR Nasonex Truvada Niaspan Cialis Namenda Symbicort Detrol LA Benicar Gleevec Synthroid Xalatan Premarin Ventolin HFA Restasis and Femara Both medsmexcom and pharmaciesherbalcom also list the names of drugs in English and display prices in United States dollars
Prices for all medicines in the sample are collected for 12 October 2011 The online prices collected are those seen by the consumer Shipping fees are excluded because of the minimal effect that these
UTEP Technical Report TX14-2 bull March 2014 Page 6
fees typically contribute to total purchase prices (Quon et al 2005) The prices utilized also exclude taxes since most states in the United States do not levy sales taxes on medications or Internet sales while in Mexico the sale of medicines is tax exempt The number of pills per package generally varies between the United States and Mexico for each product The price comparison is carried out by obtaining the unit price of the medicines as listed for the consumer Unit prices are calculated by dividing the total price of a package by the number of units contained Statistical moments are then calculated for the prices and price differences Skewness and kurtosis estimates are used for normality testing (Bera and Jarque 1981) Dosage strengths are kept the same for each unit price pair
The formal null hypothesis shown in Equation (1) is that the difference between the unit online prices of the medicines in United States and Mexico is equal to zero The alternative hypothesis is that the difference between online unit prices of medicines charged in the United States and Mexico is different from zero Although incomes are higher in the United States recent research conducted using prices for prescription medications sold in brick and mortar pharmacies shows that prices are sometimes higher in Mexico (Fullerton and Miranda 2011)
H P ndash P = 0 vs0 USA MEXH P ndash P ne 0A USA MEX
(1)
In order to formally test the null hypothesis both parametric and non-parametric statistical tests are utilized The t-test assumes a normal distribution With only 50 observations in the sample that may not be a safe assumption Cross-border price data have been previously shown to not follow normal distributions due in part to kurtosis resulting from heavy histogram tails (Fullerton and Coronado 2001) Given that a signed ranks test that makes no assumptions regarding the distribution of the data is also employed (Wilcoxon 1945)
Empirical Results
Summary statistics for the data are shown in Table 1 The average unit price for medicines sold online in the United States is $2348 while it is $1862 for those sold in Mexico As in prior studies (Quon et al 2005 Fullerton and Miranda 2011) not all of the United States prices exceed their international counterparts Forty of the fifty medications included in the sample however are less expensive when purchased from the online pharmacies located south of the border Possible explanations of why these medicines are less expensive in Mexico include differences in income levels regulatory controls and product liability risks (Manning 1997 Ridley 2005 Kanavos and Vandoros 2011) The limited opportunities for pharmaceutical trade between Mexico and the United States along with potential risks of product losses or damages associated with cross-border medicine purchases may contribute to maintaining price differentials between the two countries
Because the Mexican Internet pharmacy sites are published in English and prices are quoted in dollars these pharmacies are likely oriented towards the United States market It is possible that pharmaceutical prices offered to Mexican consumers are lower than those advertised on Mexican Internet sites However Fullerton and Miranda (2011) find that not all brand name drugs available at walk-in pharmacies in Mexico are priced lower than counterpart products sold in the United States In fact the price differentials reported in that study are broadly similar to those shown in Table 1 Pharmaceutical companies may be hesitant to sell medications at lower prices to residents of Mexico due to concerns that these medicines could be imported to the United States and undercut prevailing prices in that market (Danzon and Furukawa 2003)
Chart 1 presents the unit price data from Table 1 in graphical form Each of the 50 medicines in the sample is represented by a dot that lies at
UTEP Technical Report TX14-2 bull March 2014 Page 7
the intersection of the United States unit price corresponding to the horizontal axis and the Mexican unit price corresponding to the vertical axis Because the dollar values of medicines included in the sample span a large range the axes are logarithmically scaled The 45O line emanating from the origin represents equality between US and Mexican unit prices Dots to the northwest of this line represent medications that are more expensive in Mexico while those located to the southeast of the line represent drugs that are more expensive in the United States Although many of the prices are clustered fairly closely to the 45O line it is easy to see that most medications are more expensive when purchased from north of the border internet pharmacies
Although a majority of the Mexico online prices in Table 1 are lower than the corresponding prices from north of the border it is not clear whether those differences are statistically significant The price differences are first examined using a standard parametric t-test The null hypothesis for this test is that the differences in the unit prices of medicines from both countries are equal to zero Although the unit prices of medicines from online pharmacies in Mexico are lower than those from the United States the difference is statistically insignificant at the 5-percent level As noted in Table 2 the calculated t-value is 053 which is less than the critical t-value of 201
However the t-test assumes data normality and previous research indicates that cross-border price data frequently fail to satisfy this assumption (Fullerton and Coronado 2001) Given that the Jarque-Bera test is performed in order to examine whether the normality assumption is satisfied (Bera and Jarque 1981) As shown in Column 9 of Table 1 the null hypothesis of normality for the medicine price differences is rejected at the 1-percent level of significance (Table 1) On the basis of this result it appears that the sample data for the price differences do not follow a normal distribution and an alternative test should be employed
Because the normality assumption is not satisfied a non-parametric test is also utilized A signed rank test (Wilcoxon 1945) is used to test the null hypothesis that the differences in the unit prices of medicines in both countries are equal to zero The Wilcoxon is approximately standard normal for samples with more than 25 observations The test result reported in Table 2 shows that the calculated Wilcoxon T-score is 447 which is greater than the critical t-value of 201 Accordingly the null hypothesis of price equality is rejected at a 5-percent level of significance The evidence provided by this alternative test indicates that differences in online medicine prices between Mexico and the United States are in fact statistically significant
Ten of the medications carry negative signs for the United States-Mexico price differentials Similar to what has been reported for walk-in pharmacies (Fullerton and Miranda 2011) this means that some prescription drugs are less expensive in the United States than in Mexico These medicines are mostly clustered among the treatments for depression and diabetes A possible reason why there are higher prices for diabetes medications in Mexico may be greater demand Mexico has a higher rate of deaths by diabetes than the United States (Alwan 2011) Other factors may also influence this differential including costs of production and price competition (Mujumdar and Pal 2005)
Not all the medicines that exhibit Internet price differences offer consequential monthly savings to consumers In order to calculate the monthly savings per medicine the recommended daily dosages are employed The recommended daily doses are retrieved from the online prescription information for each brand name medication The number of daily units multiplied by the unit price equals the daily cost per medicine This value multiplied by 30 days provides the monthly expenditure for the medication in each country The differences between the monthly expenses in Mexico and those in the United States are the monthly savings associated
UTEP Technical Report TX14-2 bull March 2014 Page 8
with buying the medicines from the websites in either country (Table 1)
The medicines that generate the largest savings for consumers willing to buy them online are Gleevec Atripla and Truvada Gleevec (Imatinib) is manufactured by Novartis Corporation and used in the treatment of certain types of cancer Atripla (Emtricitabine Tenofovir Efavirenz) is manufactured by Gilead Sciences Inc and used for the treatment of human immunodeficiency virus (HIV) Truvada (Tenofovir Emtricitabine) is also manufactured by Gilead Sciences Inc and used in the treatment of HIV Online purchases of these medicines result in savings of greater than $500 dollars per month when they are bought over the Internet from Mexico (Table 1)
The average monthly savings for online purchases from Mexico is $13173 while the sample standard deviation is $30811 Only Gleevec Atripla and Truvada are more than one standard deviation above the mean for nominal savings None of the monthly savings in the sample are more than one standard deviation below the mean (-$17638) The average monthly savings available from brick and mortar pharmacies in Ciudad Juarez is $2427 (Fullerton and Miranda 2011)
The large savings gap is partly due to sample divergences between the two studies If the comparison is limited to medicines that appear in both samples then the average monthly savings for purchases at brick and mortar pharmacies in Ciudad Juarez is $2461 whereas for Mexican online pharmacies it is $2268 This result points to remarkable price similarities among these alternative means for acquiring prescription drugs from Mexico The relatively low monthly savings based on prices alone also implies that much of the savings available to consumers may relate to avoiding doctor appointments when purchasing pharmacy products in Mexico The savings can become proportionately larger however in cases where patients purchase more than one medicine
Consumers make choices on health expenditures that involve several costs The price of medications is one of these costs Another important item is the cost of obtaining the prescription ie the price of doctor appointments and visits In general doctor appointments are less expensive in Mexico than in the United States Arredondo et al (1999) find that the cost of outpatient doctor appointments in Mexico are $790 on average which adjusted for exchange rate fluctuations was $1033 in December 2010 That figure corresponds to a 130 peso per visit charge and approximately matches the fees quoted over the telephone by several doctorrsquos offices in Ciudad Juarez during the first quarter of 2012 By comparison the Medicare fee schedule indicates that the 2010 price for doctor appointments in the United States is approximately $10986 The sizeable bi-national gap in the cost of doctor appointments is similar in magnitude to the gap between per capita total health expenditures in Mexico and the US (WHO 2012)
Most of the medicines in the sample do not however require written prescriptions when purchased in Mexico Sales of Levaquin in Mexico now require prescriptions as a consequence of the 25 August 2010 antibiotics law This law stipulates that the sale of antibiotics requires written prescriptions from doctors who hold medical licenses (Ceacutedula Profesional) in Mexico (Saacutenchez 2010) Internet sales of antibiotics are also covered by this regulation Given the price of doctor appointments in the United States the fact that Mexico does not require prescriptions for most medicines provides a fairly attractive incentive to north-of-the border consumers to consider making international online purchases Depending on how often doctor visits may be required the savings provided by avoiding office appointment fees can be substantial for some patients
Although FDA regulations specify that drugs imported to the United States should be used under medical supervision proof of such supervision is rarely required in practice (FDA 2010 Rabinovitch
UTEP Technical Report TX14-2 bull March 2014 Page 9
2005) Aside from issues regarding legality sales of drugs without medical consultations or prescriptions raise questions of consumer safety (Vargas-Hernaacutendez 2005) While less stringent pharmaceutical purchase regulations in Mexico may reduce consumer costs in some cases it may also lead to mistaken usage of self-prescribed medication and ultimately impose substantial long-term costs It should not however be assumed that most United States residents who purchase medications in Mexico do so with the aim of evading appropriate medical evaluation According to Calvillo and Lal (2003) 59 percent of United States residents who cross the border to purchase medicines at walk-in pharmacies in Mexico report being advised to take the medicine by a physician
Material in Table 1 indicates that online prices for many medicines are less expensive in Mexico Table 3 presents additional evidence regarding the relationship between the online unit prices of medicine in the United States and Mexico The correlation coefficient for both sets of prices is 0843 indicating that there is a strong relationship between the online prices in each country for these medicines Given that an interesting question is whether the prices in one country can serve as reliable explanatory variables for those in the second country
The United States is the target market for online prescription medicines included in this sample Accordingly the Internet pharmacy prices from Mexico are regressed upon their counterparts from north of the border The specification for this arrangement in which the direction of causality is assumed to be from north to south is shown in Equation (2) In (2) PMEXi is the Mexico unit price for medicine i PUSAi is the United States unit price for medicine i and ui is a stochastic disturbance
PMEX = b + b PUSA + ui 0 1 i i (2)
If the unit product prices from the United States provide unbiased estimates of the Mexico web site prices then the intercept in (2) will be equal to zero and the slope coefficient will be equal to one The formal null hypotheses for bias are shown in Equation (3) Parameter estimation results and computed test statistics for Equations (2) and (3) are shown in Table 4
H0 b0 = 0 b1 = 1 vs HA b0 ne 0 b1 ne 0
(3)
In Table 3 the intercept term is -5599 With a standard deviation of 4414 it is not statistically different from zero Given that it is not possible to reject the null hypothesis that the constant term is equal to zero The estimated slope coefficient is 1031 The computed t-statistic for the hypothesis that the slope coefficient is equal to one is -0331 Consequently it is not possible to reject the hypothesis that b1 is equal to one These results indicate that the intercept and slope coefficients are statistically indistinguishable from 0 and 1 respectively That implies that the online unit price of medicine in the United States can serve as a reliable predictor of the Internet unit price of medicine in Mexico
Conclusion
Conventional wisdom indicates that brand name prescription medicine prices are lower at online Mexican pharmacies than at United States Internet drug stores Data collected for this study corroborate that belief at least to a large extent Consumers will save an average of $13173 dollars per month when buying from online pharmacies south of the Rio Grande The savings are even larger when the cross-border differences in the fees charged for doctorrsquos appointments are taken into account However not all medicines are more affordable in Mexico Pharmaceuticals designed to treat diabetes tend to be less expensive in the United States In all ten of the fifty prescription drugs included in the sample are less expensive when purchased in the US
UTEP Technical Report TX14-2 bull March 2014 Page 10
Data in this study indicate that online medicine prices in Mexico are higher than those charged by brick and mortar pharmacies located in Mexico That may be due to the fact that transportation costs and time spent waiting to re-enter the United States make the effective delivery prices for walk-in pharmacies noticeably higher than the shelf prices for the products in question Reduced medical tourism from the United States in response to security concerns in northern Mexico potentially contributes to this pricing pattern also
Linear regression results reported above indicate that the Internet prices listed in the United States provide unbiased estimates of the online pharmacy prices charged in Mexico Because the sample utilized is cross-sectional and includes data only for October 2011 it is not possible to examine how that relationship varies over time A natural extension of this initial study would be to collect these data over time to permit analyzing the dynamic properties associated with online pharmacy prices in these two countries
References
Alwan A (2011) Noncommunicable Diseases and Mental Health (Geneva World Health Organization) Available at httpwwwwhointnmhcountriesen (accessed 23 January 2012)
APC (2001) International Pharmaceutical Price Differences (Canberra Australian Productivity Commission) Available at httpwwwpcgov au__dataassetspdf_file001818153pbspricespdf (accessed 7 November 2011)
Arredondo A R Leyva and P Naacutejera (1999) lsquoAtencioacuten Meacutedica Ambulatoria en Meacutexico El Costo para los Usuariosrsquo Salud Puacuteblica de Meacutexico 41 1 18-46
Bera A K and C M Jarque (1981) lsquoEfficient Tests for Normality Heteroscedasticity and Serial Independence of Regression Residuals Monte Carlo Evidencersquo Economics Letters 7 4 313-18
Byrd TL and JG Law (2009) lsquoCross-Border Utilization of Healthcare Services by United States Residents Living near the Mexican Borderrsquo Pan American Journal of Public Health 26 2 95-100
Calvillo JP and L Lal (2003) lsquoPilot Study of a Survey of US Residents Purchasing Medications in Mexico Demographics Reasons and Types of Medications Purchasedrsquo Clinical Therapeutics 25 2 561-577
Christopher CG A Prlic and Y Li (2011) lsquoConsumer Marketsrsquo US Economic Outlook June 2011 (New York NY IHS Global Insight) 7-19
CBP (2011) FDA Enforcement Policy Regarding the Personal Import of Violative Drugs (Washington DC US Customs and Border Protection) Available at httpwwwcbpgovxpcgovtravelclearing restrictedmedication_drugsxml (accessed 3 October 2011)
Danzon PM and L Chao (2000) lsquoCross-national Price Differences for Pharmaceuticals How Large and Whyrsquo Journal of Health Economics 19 2 159-95
Danzon PM and MF Furukawa (2003) lsquoPrices and Availability of Pharmaceuticals Evidence from Nine Countriesrsquo Health Affairs Web Exclusive 29 October 521-36 Available at httpwww healthaffairsorgWebExclusivesphp (accessed 3 October 2011)
de Guzman GC Khaleghi M Riffenberg RH and RF Clark (2007) lsquoA Survey of the Use of Foreign-Purchased Medications in a Border Community Emergency Department Patient Populationrsquo Journal of Emergency Medicine 33 2 213-221
UTEP Technical Report TX14-2 bull March 2014 Page 11
FDA (2010) Regulatory Procedures Manual (Silver Spring MD Food and Drug Administration) Available at ht tp wwwfdagovICECI ComplianceManualsRegulatoryProceduresManual ucm179266htm (accessed 10 December 2012)
Fullerton Jr TM and R Coronado (2001) lsquoRestaurant Prices and the Mexican Pesorsquo Southern Economic Journal 68 1 145-155
Fullerton Jr TM and O Miranda (2011) lsquoBorderplex Brand Name Medicine Price Differencesrsquo Applied Economics 43 8 929-939
IMS (2012) lsquoThe Use of Medicines in the United States Review of 2011rsquo IMS Institute for Healthcare Informatics Available at httpwwwimshealth comportalsiteims (accessed 4 December 2012)
Kanavos PG and S Vandoros (2011) lsquoDeterminants of Branded Prescription Medicine Prices in OECD Countriesrsquo Health Economics Policy and Law 6 3 337-367
Manning RL (1997) lsquoProducts Liability and Prescription Drug Prices in Canada and the United Statesrsquo Journal of Law and Economics 40 1 203-244
Mujumdar S and D Pal (2005) lsquoDo Price Ceilings Abroad increase US Drug Pricesrsquo Economics Letters 87 1 9-13
Quon BS R Firszt and MJ Eisenberg (2005) lsquoA Comparison of Brand Name Drug Prices Between Canadian-based Internet Pharmacies and Major US Drug Chain Pharmaciesrsquo Annals of Internal Medicine 143 6 397-403
Rabinovitch SR (2005) lsquoOn the Legitimacy of Cross-Border Pharmacyrsquo Alberta Law Review 43 2 327-368
Ridley DB (2005) lsquoPrice Differentiation and Transparency in the Global Pharmaceutical Marketplacersquo Pharmacoeconomics 23 7 651-658
Saa tsoglou P (2004) lsquoPharmaceut ica l Reimportation Magnitude Trends and Consumersrsquo Managed Care 13 3 7-9
Saacutenchez J (2010) lsquoLey para Antibioacuteticos una Necesidadrsquo El Universal 27 May 1
Vargas Hernaacutendez JG (2006) lsquoMercado Transfronterizo en Servicios de Saludrsquo Ciudades 69 58-64
Wagner JL and E McCarthy (2004) lsquoInternational Differences in Drug Pricesrsquo Annual Review of Public Health 25 1 475-4t95
Wilcoxon F (1945) lsquoIndividual Comparisons by Ranking Methodsrsquo Biometrics Bulletin 1 6 80-83
WHO (2012) World Health Statistics 2012 (Geneva World Health Organization) Available at httpwwwwhointghopublicationsworld_health_ statisticsenindexhtml (accessed 1 June 2012)
UTEP Technical Report TX14-2 bull March 2014 Page 12
Table 1 Brand name medication prices for online pharmacies in the United States and Mexico
Name Dosage USA Price of units
USA Unit Price
MEX Price
of units
MEX Unit Price
Difference UUSshy
UMX
Units per day
Monthly Cost USA
Cost Month MEX
Savings Month
Abilify 10 mg 54698 30 1823 11895 10 1190 634 100 54698 35685 19013
Aciphex 20 mg 23399 30 780 14722 28 526 254 100 23399 15774 7625
Actos 30 mg 27899 30 930 13431 14 959 -029 100 27899 28781 -882
Advair Diskus 10050 mg 18999 60 317 10153 60 169 147 200 18999 10153 8846
Aricept 10 mg 30491 30 1016 17668 28 631 385 100 30491 18930 11561
Atripla 600200300 mg 187896 30 6263 48750 30 1625 4638 100 187896 48750 139146
Benicar 4 mg 12549 30 418 9000 30 300 118 100 12549 9000 3549
Boniva 150 mg 12899 1 12899 12120 1 12120 779 003 11609 10908 701
Celebrex 200 mg 14099 30 470 7652 30 255 215 100 14099 7652 6447
Cialis 20 mg 20999 10 2100 10490 4 2623 -523 100 62997 78675 -15678
Crestor 10 mg 15499 30 517 7956 30 265 251 100 15499 7956 7543
Cymbalta 60 mg 17099 30 570 17177 28 613 -043 150 25649 27606 -1957
Detrol LA 4 mg 16899 30 563 7200 30 240 323 100 16899 7200 9699
Diovan 80 mg 9599 30 320 7947 30 265 055 100 9599 7947 1652
Diovan HCT 16025 mg 12699 30 423 17136 28 612 -189 100 12699 18360 -5661
Effexor XR 375 mg 13699 30 457 10030 20 502 -045 250 34248 37613 -3365
Femara 25 mg 51696 30 1723 17400 30 580 1143 100 51696 17400 34296
Flomax 04 mg 15399 30 513 9532 20 477 037 100 15399 14298 1101
Geodon Oral 40 mg 52097 60 868 19302 28 689 179 200 52097 41361 10736
Gleevec 500 mg 150603 30 5020 45000 30 1500 3520 150 225905 67500 158405
Januvia 100 mg 21600 30 720 11145 28 398 322 100 21600 11941 9659
Lantus 01 ml 33198 3 11066 32500 3 10833 233 001 3320 3250 070
Lantus SoloSTAR 01 ml 19617 1 19617 32500 1 32500 -12883 003 17655 29250 -11595
Levaquin 250 mg 48497 30 1617 6958 30 232 1385 100 48497 6958 41539
Lexapro 10 mg 11899 30 397 13986 28 500 -103 100 11899 14985 -3086
Lipitor 20 mg 15999 30 533 21939 30 731 -198 100 15999 21939 -5940
Lyrica 150 mg 9499 30 317 9504 28 339 -023 250 23748 25457 -1710
UTEP Technical Report TX14-2 bull March 2014 Page 13
Namenda 10 mg 22300 60 372 6150 30 205 167 150 16725 9225 7500
Nasonex 50 mcg 13099 1 13099 2699 1 2699 10400 002 6288 1296 4992
Nexium 20 mg 20099 30 670 5176 14 370 300 100 20099 11091 9008
Niaspan 500 mg 8999 30 300 2760 30 092 208 250 22498 6900 15598
Plavix 75 mg 19599 30 653 12204 28 436 217 100 19599 13076 6523
Premarin 0625 mg 6510 30 217 5048 28 180 037 060 3906 3245 661
Protonix 40 mg 19000 30 633 3079 14 220 413 150 28500 9897 18603
Restasis 02 ml 14662 30 489 15083 30 503 -014 200 29324 30166 -842
Seroquel 100 mg 36498 60 608 10935 30 365 244 150 27374 16403 10971
Seroquel XR 300 mg 41040 30 1368 20600 30 687 681 150 61560 30900 30660
Singulair 10 mg 16099 30 537 9392 20 470 067 100 16099 14088 2011
Spiriva 18 mg 24598 30 820 6076 20 304 516 100 24598 9114 15484
Strattera 10 mg 19000 30 633 7848 14 561 073 100 19000 16817 2183
Symbicort 16045 mg 22999 120 192 6880 60 115 077 400 22999 13760 9239
Synthroid 150 mg 3399 30 113 4539 50 091 023 100 3399 2723 676
Truvada 200300 mg 108504 30 3617 49500 30 1650 1967 100 108504 49500 59004
Valtrex 500 mg 23598 30 787 26500 42 631 156 300 70794 56786 14008
Ventolin HFA 90 mcg 4599 1 4599 3743 1 3743 856 003 4139 3369 770
Viagra 50 mg 19399 10 1940 7500 4 1875 065 100 58197 56250 1947
Vytorin 1020 mg 13499 30 450 5118 14 366 084 100 13499 10967 2532
Xalatan 25 ml 10499 1 10499 3999 1 3999 6500 002 6929 2639 4290
Zetia 10 mg 13999 30 467 8830 20 442 025 100 13999 13245 754
Zyprexa 10 mg 62401 30 2080 9812 7 1402 678 100 62401 42051 20350
Mean 29279 2348 13531 1862 486 34149 20977 13173
SD 33888 4032 10965 4927 2646 41539 17994 30811
Skewness 330 272 199 525 -122 325 143 371
Kurtosis 1182 733 384 3060 1639 1194 159 1483
JB Statistic 31734 14618 5444
179310 46046 31949 1955 47436
Notes All data are from the week of 10-14 October 2011 All medicine dosages are equal for both countries
UTEP Technical Report TX14-2 bull March 2014 Page 14
Lantus and Lantus SoloSTAR assume a requirement of 3 unitsml per dayNasonex contains 120 sprays per bottle (50 mcgact) with a suggested application of 2 sprays dailyRestasis contains 2 drops per ampule (0054ml) with a suggested application of 4 drops dailyVentolin HFA contains 200 puffs per inhaler (108-90mcg) with a suggested application of 6 puffs dailyXalatan contains 45 drops per bottle (25ml) with a suggested application of 1 drop dailyNegative numbers indicate savings result from purchases at United States online pharmacies Data are from bajapharmacycom drugstorecom familymedscom medsmexcom and pharmaciesherbalcom If brand name medicines contain ingredients of multiple generic medicines the dosages of those medicines are separated by slashes Negative numbers indicate prices are more expensive at Mexican online pharmacies Significant at 1-percent level
Table 2 Parametric and Non-parametric Tests for Unit Price Equality
Computed Test Statistic 1-Percent Critical Value Decision t-hat = 0535 2678 Fail to reject null hypothesis unit price equality Wilcoxon T-score = 4474 2678 Reject the null hypothesis of unit price equality
UTEP Technical Report TX14-2 bull March 2014 Page 15
Table 3 United States and Mexico Online Pharmacy Price Regression Results
Regression Test for Predictive Bias Ho b0 = 00 b1 = 10 Dependent Variable PMEXi (Mexico Unit Price) Method Least Squares Sample 1 50 Included observations 50
Independent Variable Constant PUSAi (USA Unit Price)
Coefficient -5598827 1031296
Standard Error 4414058 0094604
t-Statistic -1268408 1090124
Probability 02108 00000
R-squared Adjusted R-squared Standard error of regression Sum squared residuals
0712294 0706300 2697199 3491945
Mean dependentStd deviation deLog likelihood F-statistic
variable p variable
1861600 4976926 -2346663 1188370
Notes 1 Rho(PMEXi PUSAi) = 0843 2 For H0 b0 = 00 HA b0 ne 00 t-hat = 1268 lt t-critical= 2010 fail to reject Ho at 5-percent level 3 For H0 b1 = 10 HA b1 ne 10 t-hat = 0331 lt t-critical= 2010 fail to reject Ho at 5-percent level 4 Parameter estimates and test results indicate that USA unit prices are unbiased predictors of Mexico prices
UTEP Technical Report TX14-2 bull March 2014 Page 16
_____________________________________ _____________________________________ _____________________________________ _____________________________________ _____________________________________ _____________________________________ _____________________________________
The University of Texas at El Paso Announces
Borderplex Economic Outlook 2013-2015 UTEP is pleased to announce the 2013 edition of its primary source of border business information Topics covered include demography employment personal income retail sales residential real estate transportation international commerce and municipal water consumption Forecasts are generated utilizing the 255-equation UTEP Border Region Econometric Model developed under the auspices of a corporate research gift from El Paso Electric Company
The authors of this publication are UTEP Professor amp Trade in the Americas Chair Tom Fullerton and UTEP Associate Economist Adam Walke Dr Fullerton holds degrees from UTEP Iowa State University Wharton School of Finance at the University of Pennsylvania and University of Florida Prior experience includes positions as Economist in the Executive Office of the Governor of Idaho International Economist in the Latin America Service of Wharton Econometrics and Senior Economist at the Bureau of Economic and Business Research at the University of Florida Adam Walke holds an MS in Economics from UTEP and has published research on energy economics mass transit demand and cross-border regional growth patterns
The border business outlook for 2013 through 2015 can be purchased for $10 per copy Please indicate to what address the report(s) should be mailed (also include telephone fax and email address)
Send checks made out to University of Texas at El Paso for $10 to
Border Region Modeling Project - CBA 236 UTEP Department of Economics amp Finance 500 West University Avenue El Paso TX 79968-0543
Request information from 915-747-7775 or agwalkeutepedu if payment in pesos is preferred
UTEP Technical Report TX14-2 bull March 2014 Page 17
_____________________________________ _____________________________________ _____________________________________ _____________________________________ _____________________________________ _____________________________________ _____________________________________ _____________________________________
The University of Texas at El Paso Announces
Borderplex Long-Term Economic Trends to 2029 UTEP is pleased to announce the availability of an electronic version of the 2010 edition of its primary source of longshyterm border business outlook information Topics covered include detailed economic projections for El Paso Las Cruces Ciudad Juaacuterez and Chihuahua City Forecasts are generated utilizing the 225-equation UTEP Border Region Econometric Model developed under the auspices of a 12-year corporate research support program from El Paso Electric Company
The authors of this publication are UTEP Professor amp Trade in the Americas Chair Tom Fullerton and former UTEP Associate Economist Angel Molina Dr Fullerton holds degrees from UTEP Iowa State University Wharton School of Finance at the University of Pennsylvania and University of Florida Prior experience includes positions as Economist in the Executive Office of the Governor of Idaho International Economist in the Latin America Service of Wharton Econometrics and Senior Economist at the Bureau of Economic and Business Research at the University of Florida Angel Molina holds an MS Economics degree from UTEP and has conducted econometric research on international bridge traffic peso exchange rate fluctuations and cross-border economic growth patterns
The long-term border business outlook through 2029 can be purchased for $10 per copy Please indicate to what address the report(s) should be mailed (also include telephone fax and email address)
Send checks made out to University of Texas at El Paso for $10 to
Border Region Modeling Project - CBA 236 UTEP Department of Economics amp Finance 500 West University Avenue El Paso TX 79968-0543
Request information at 915-747-7775 or agwalkeminersutepedu if payment in pesos is preferred
UTEP Technical Report TX14-2 bull March 2014 Page 18
The UTEP Border Region Modeling Project amp UACJ Press
Announce the Availability of
Basic Border Econometrics The University of Texas at El Paso Border Region Modeling Project is pleased to announce Basic Border Econometrics a publication from Universidad Autoacutenoma de Ciudad Juaacuterez Editors of this new collection are Martha Patricia Barraza de Anda of the Department of Economics at Universidad Autoacutenoma de Ciudad Juaacuterez and Tom Fullerton of the Department of Economics amp Finance at the University of Texas at El Paso
Professor Barraza is an award winning economist who has taught at several universities in Mexico and has published in academic research journals in Mexico Europe and the United States Dr Barraza currently serves as Research Provost at UACJ Professor Fullerton has authored econometric studies published in academic research journals of North America Europe South America Asia Africa and Australia Dr Fullerton has delivered economics lectures in Canada Colombia Ecuador Finland Germany Japan Korea Mexico the United Kingdom the United States and Venezuela
Border economics is a field in which many contradictory claims are often voiced but careful empirical documentation is rarely attempted Basic Border Econometrics is a unique collection of ten separate studies that empirically assess carefully assembled data and econometric evidence for a variety of different topics Among the latter are peso fluctuations and cross-border retail impacts border crime and boundary enforcement educational attainment and border income performance pre- and post-NAFTA retail patterns self-employed Mexican-American earnings maquiladora employment patterns merchandise trade flows and Texas border business cycles
Contributors to the book include economic researchers from the University of Texas at El Paso New Mexico State University University of Texas Pan American Texas AampM International University El Colegio de la Frontera Norte and the Federal Reserve Bank of Dallas Their research interests cover a wide range of fields and provide multi-faceted angles from which to examine border economic trends and issues
A limited number of Basic Border Econometrics can be purchased for $10 per copy Please contact Professor Servando Pineda of Universidad Autoacutenoma de Ciudad Juaacuterez at spinedauacjmx to order copies of the book Additional information for placing orders is also available from Professor Martha Patricia Barraza de Anda at mbarrazauacjmx
UTEP Technical Report TX14-2 bull March 2014 Page 19
The University of Texas at El Paso Technical Report Series
TX97-1 Currency Movements and International Border Crossings TX97-2 New Directions in Latin American Macroeconometrics TX97-3 Multimodal Approaches to Land Use Planning TX97-4 Empirical Models for Secondary Market Debt PricesTX97-5 Latin American Progress Under Structural Reform TX97-6 Functional Form for United States-Mexico Trade Equations TX98-1 Border Region Commercial Electricity Demand TX98-2 Currency Devaluation and Cross-Border Competition TX98-3 Logistics Strategy and Performance in a Cross-Border Environment TX99-1 Inflationary Pressure Determinants in Mexico TX99-2 Latin American Trade Elasticities CSWHT00-1 Tariff Elimination Staging Categories and NAFTA TX00-1 Borderplex Business Forecasting Analysis TX01-1 Menu Prices and the Peso TX01-2 Education and Border Income Performance TX02-1 Regional Econometric Assessment of Borderplex Water Consumption TX02-2 Empirical Evidence on the El Paso Property Tax Abatement Program TX03-1 Security Measures Public Policy Immigration and Trade with Mexico TX03-2 Recent Trends in Border Economic Analysis TX04-1 El Paso Customs District Cross-Border Trade Flows TX04-2 Borderplex Bridge and Air Econometric Forecast Accuracy 1998-2003 TX05-1 Short-Term Water Consumption Patterns in El Paso TX05-2 Menu Price and Peso Interactions 1997-2002 TX06-1 Water Transfer Policies in El Paso TX06-2 Short-Term Water Consumption Patterns in Ciudad Juaacuterez TX07-1 El Paso Retail Forecast Accuracy TX07-2 Borderplex Population and Migration Modeling TX08-1 Borderplex 911 Economic Impacts TX08-2 El Paso Real Estate Forecast Accuracy 1998-2003 TX09-1 Tolls Exchange Rates and Borderplex Bridge Traffic TX09-2 Menu Price and Peso Interactions 1997-2008 TX10-1 Are Brand Name Medicine Prices Really Lower in Ciudad Juaacuterez TX10-2 Border Metropolitan Water Forecast Accuracy TX11-1 Cross Border Business Cycle Impacts on El Paso Housing 1970-2003 TX11-2 Retail Peso Exchange Rate Discounts and Premia in El Paso TX12-1 Borderplex Panel Evidence on Restaurant Price and Exchange Rate Dynamics TX12-2 Dinaacutemica del Consumo de Gasolina en Ciudad Juaacuterez 2001-2009 TX13-1 Physical Infrastructure and Economic Growth in El Paso 1976-2009 TX13-2 Tolls Exchange Rates and Northbound International Bridge Traffic 1990-2006 TX14-1 Freight Transportation Costs and the Thickening of the US-Mexico Border TX14-2 Are Online Pharmacy Prices Really Lower in Mexico
UTEP Technical Report TX14-2 bull March 2014 Page 20
The University of Texas at El Paso Border Business Forecast Series
SR98-1 El Paso Economic Outlook 1998-2000 SR99-1 Borderplex Economic Outlook 1999-2001 SR00-1 Borderplex Economic Outlook 2000-2002 SR01-1 Borderplex Long-Term Economic Trends to 2020 SR01-2 Borderplex Economic Outlook 2001-2003 SR02-1 Borderplex Long-Term Economic Trends to 2021 SR02-2 Borderplex Economic Outlook 2002-2004 SR03-1 Borderplex Long-Term Economic Trends to 2022 SR03-2 Borderplex Economic Outlook 2003-2005 SR04-1 Borderplex Long-Term Economic Trends to 2023 SR04-2 Borderplex Economic Outlook 2004-2006 SR05-1 Borderplex Long-Term Economic Trends to 2024 SR05-2 Borderplex Economic Outlook 2005-2007 SR06-1 Borderplex Long-Term Economic Trends to 2025 SR06-2 Borderplex Economic Outlook 2006-2008 SR07-1 Borderplex Long-Term Economic Trends to 2026 SR07-2 Borderplex Economic Outlook 2007-2009 SR08-1 Borderplex Long-Term Economic Trends to 2027 SR08-2 Borderplex Economic Outlook 2008-2010 SR09-1 Borderplex Long-Term Economic Trends to 2028 SR09-2 Borderplex Economic Outlook 2009-2011 SR10-1 Borderplex Long-Term Economic Trends to 2029 SR10-2 Borderplex Economic Outlook 2010-2012 SR11-1 Borderplex Economic Outlook 2011-2013 SR12-1 Borderplex Economic Outlook 2012-2014 SR13-1 Borderplex Economic Outlook 2013-2015
Technical Report TX14-2 is a publication of the Border Region Modeling Project and the Department of Economics amp Finance at the University of Texas at El Paso For additional Border Region information please visit the wwwacademicsutepeduborder section of the UTEP web site
UTEP Technical Report TX14-2 bull March 2014 Page 21
Bord
er R
egio
n M
odel
ing
Proj
ect ndash
CBA
236
U
TEP
Depa
rtm
ent o
f Eco
nom
ics
amp F
inan
ce
500
Wes
t Uni
vers
ity A
venu
e El
Pas
o T
X 79
968-
0543
www
utep
edu
The University of Texas at El Paso
UTEP Border Region Modeling Project
Produced by University Communications March 2014
Technical Report TX14-2
Are Online Pharmacy Prices Really Lower in Mexico
The University of Texas at El Paso
Are Online Pharmacy Prices Really Lower in Mexico
Technical Report TX14-2 UTEP Border Region Modeling Project
UTEP Technical Report TX14-2 bull March 2014 Page 1
This technical report is a publication of the Border Region Modeling Project and the Department of Economics amp Finance at the University of Texas at El Paso For additional Border Region information please visit the wwwacademicsutepeduborder section of the UTEP web site
Please send comments to Border Region Modeling Project - CBA 236 Department of Economics amp Finance 500 West University El Paso TX 79968-0543
UTEP does not discriminate on the basis of race color national origin sex religion age or disability in employment or the provision of services
University of Texas at El Paso Diana Natalicio President Junius Gonzales Provost
Roberto Osegueda Vice Provost
UTEP College of Business Administration Border Economics amp Trade
Bob Nachtmann Dean Steve Johnson Associate Dean
Gary Frankwick Associate Dean Tim Roth Templeton Professor of Banking amp Economics
UTEP Technical Report TX14-2 bull March 2014 Page 2
UTEP Border Region Econometric Modeling Project
Corporate and Institutional Sponsors
Hunt Communities El Paso Water Utilities
Universidad Autoacutenoma de Ciudad Juaacuterez UTEP College of Business Administration
UTEP Department of Economics amp Finance City of El Paso Office of Management amp Budget
UACJ Instituto de Ciencias Sociales y Administracioacuten UTEP Center for the Study of Western Hemispheric Trade
Special thanks are given to the corporate and institutional sponsors of the UTEP Border Region Econometric Modeling Project In particular El Paso Water Utilities Hunt Communities and The University of Texas at El Paso have invested substantial time effort and financial resources in making this research project possible
Continued maintenance and expansion of the UTEP business modeling system requires ongoing financial support For information on potential means for supporting this research effort please contact Border Region Modeling Project - CBA 236 Department of Economics amp Finance 500 West University El Paso TX 79968-0543
UTEP Technical Report TX14-2 bull March 2014 Page 3
Are Online Pharmacy Prices Really Lower in Mexico
Thomas M Fullerton Jr Francisco J Pallares Adam G Walke Department of Economics amp Finance University of Texas at El Paso El Paso TX 79968-0543 Telephone 915-747-7747 Facsimile 915-747-6282 Email tomfutepedu
A revised version of this study is forthcoming in Asian Economic amp Financial Review
Abstract
Empirical research on international pharmaceutical prices has uncovered numerous interesting commonalities and differences across international markets This study examines price differences for brand name medicines sold over the Internet in the United States and Mexico Web sites in both countries advertise their services in English and price their products in dollars Sample data for 50 top selling medicines are from October 2011 for equal dosages on a per unit basis exclusive of shipping fees handling charges and taxes For a few medicines the savings available to consumers who purchase them from companies in Mexico are very large For most medicines in the sample the savings are comparable to those available from Internet sources in other countries Non-parametric test results indicate that the price differences are statistically significant
Keywords Brand Name Medicines Online Pharmacies Price Differences Applied Economics
JEL Category I11 Health Markets M21 Business EconomicsP52 Comparative Studies
Acknowledgements
Financial support for this research was provided by El Paso Water Utilities Hunt Companies of El Paso Hunt Communities Texas Department of Transportation JPMorgan Chase Bank of El Paso a UTEP College of Business Administration Faculty Research Grant and the James Foundation Scholarship Fund Helpful comments and suggestions were provided by Nathan Ashby and Tony Payan Econometric research assistance was provided by Carlos Morales
Introduction
In 2010 United States consumers spent close to $274 billion on pharmaceutical and other medical products (Christopher et al 2011) Many consumers understandably search for savings when purchasing medicine It is commonly believed that Internet prescription medications from Mexican pharmacies are less expensive than those sold at drug stores in the United States but relatively little evidence documents the purported price differentials The potential for consumer savings created by the price differences between countries is limited by United States legislation that restricts overseas online purchases to a maximum of 90-day supplies per customer for personal use (CBP 2011) Mexican online pharmacies benefit by being able to sell medicines subject to the 90-day supply limits to consumers in the United States via mail orders
UTEP Technical Report TX14-2 bull March 2014 Page 4
This study compares online pharmacy prices for Mexico and the United States The principal objective is to quantify whether Mexican online pharmacies truly offer lower prices to United States consumers Recent research indicates that contrary to popular opinion not all medicine prices are lower in Mexico (Fullerton and Miranda 2011) Given that the formal null hypothesis tested is that the unit price of an online prescription drug purchased in Mexico is equal to the Internet unit price of the same medicine ordered in the United States The data utilized for this test are prices for fifty brand name retail medicines These prices were collected on 12 October 2011 from medsmexcom pharmaciesherbalcom and bajapharmacycom in Mexico and from familymeds com and drugstorecom in the United States
The second section of this paper contains a literature review Data and methodology are discussed in the third section The fourth section summarizes the empirical results Concluding remarks and suggestions for further research are included in the fifth section
Literature Review
Most of the research on cross-border sales of Mexican pharmaceuticals focuses on ldquobrick-and-mortarrdquo or ldquowalk-inrdquo pharmacies that cater to medical tourists Survey evidence indicates that the primary reason for crossing the border to purchase medicine is customersrsquo perception that prices are lower in Mexico (de Guzman et al 2007 Byrd and Law 2009) Given the important role of relative prices among the various factors influencing the decision to buy medications across the border it is interesting to ask what percentage of cross-border pharmaceutical shoppers is insured Calvillo and Lal (2003) find that 81 percent of United States residents purchasing medications at a pharmacy in the border town of Nuevo Progreso Mexico have health insurance Similarly Saatsoglou (2004) reports that 62 percent of United States residents who purchase drugs abroad have prescription drug coverage Customers may opt to purchase medications in another country
even when they have insurance if copayments or annual deductibles are high and international price differences are large
Medicine price differences between the United States and other countries have received increasing attention in recent years One branch of the literature on this subject attempts to quantify international price differences while a second branch attempts to document why those differences exist Addressing the latter question Ridley (2005) argues that the prescription drug market meets the three conditions for differential pricing or price discrimination First sellers usually have some degree of market power derived from patents or copyrights Second some consumers are willing to pay more than others for the same product Danzon and Furukawa (2003) note that pharmaceutical prices in developed countries closely correlate with income levels which condition consumersrsquo ability and willingness to pay Finally differential pricing requires restrictions on arbitrage Wagner and McCarthy (2004) note that international arbitrage in pharmaceutical markets is often limited by government-imposed licensing requirements
While price discrimination may account for some portion of cross-country price differentials government intervention in the price-setting process also plays a role Some countries impose stringent cost controls on drugs sold within their borders (APC 2001) Kanavos and Vandoros (2011) find that differences in the extent of government intervention in the price-setting process are associated with variations in pharmaceutical prices across countries In a study of seven developed nations Danzon and Chao (2000) find that while countries with stricter regulatory regimes often have lower prices for certain types of medicine drug prices in those countries are also less likely to decline as a result of competition between pharmaceutical producers Manning (1997) documents that differences in legal systems and product liability laws between the United States and Canada account for at least some of the observed medicine price differentials between those countries
UTEP Technical Report TX14-2 bull March 2014 Page 5
Another branch of the literature attempts to quantify medicine price differences between the United States and other countries Quon et al (2005) find that customers can save approximately 24 percent per unit by purchasing medications from Canadian Internet pharmacies compared to major online United States drug stores Only three medications are found to be more expensive in Canada Similar results reported by Fullerton and Miranda (2011) indicate that medicine purchases at ldquowalk-inrdquo pharmacies in Ciudad Juarez Mexico also permit consumer savings The latter effort also reports evidence that not all medicines are more expensive in El Paso pharmacies The objective of this study is to contribute to this strand of the literature by quantifying online pharmacy price differentials between Mexico and the United States
Data and Methodology
The sample is comprised by the top-selling name brand medicines in the United States in 2010 as listed by the website drugscom Of those medications with the largest sales the ones that are available for both the United States and Mexico are included in the sample Prior research on medicine price differences particularly Quon et al (2005) also employs brand name medicines that constitute large shares of the medicine market at particular points in time The sample utilized in this effort follows that approach Each medication included in the sample had annual sales volumes of $474 million or more in 2010 and the 50 medicines in the sample collectively account for a large share of the pharmaceutical market in the United States
Generic medications are excluded from this study Danzon and Furukawa (2003) indicate that generic medications have lower prices in the United States than in Chile France Germany Italy Japan Mexico and the United Kingdom Generic drug sales represent only 27 percent of total medicine sales in United States (IMS 2012) Because of this the exclusion of these medications should not affect
the accuracy of the results obtained using online pharmacy prices for brand name pharmaceuticals
Price data collected are Internet pharmacy quotes for the United States and Mexico In selecting sources of online drug prices it is important to consider the reputability of each site Rabinovitch (2005) contends that while many online cross-border pharmacies are legitimate ldquoroguerdquo online pharmacies also exist and the products marketed through such sites are more likely to be sub-standard or even hazardous to consumer health Online sources of drug prices are therefore evaluated to screen out potential rogue pharmacies such as those that primarily market recreational and lifestyle drugs The pricing information is retrieved from two online pharmacies with headquarters in the United States (drugstorecom and familymedscom) and three online pharmacies with headquarters located in Mexico (bajapharmacycom pharmaciesherbal com and medsmexcom)
The drugstorecom site lists most of the medicines in the sample The only exceptions are Lantus SoloSTAR Seroquel XR Premarin and Ventolin HFA Prices for these medicines are retrieved from familymedscom to complete the sample In Mexico the online pharmacy site bajapharmacy com is employed because it also advertises most of the medicines The webpage for that site is in English and its prices are quoted in United States dollars Prices for several medicines must be obtained from medsmexcom or pharmaciesherbal com Spiriva Lantus Diovan HCT Viagra Atripla Lantus SoloSTAR Nasonex Truvada Niaspan Cialis Namenda Symbicort Detrol LA Benicar Gleevec Synthroid Xalatan Premarin Ventolin HFA Restasis and Femara Both medsmexcom and pharmaciesherbalcom also list the names of drugs in English and display prices in United States dollars
Prices for all medicines in the sample are collected for 12 October 2011 The online prices collected are those seen by the consumer Shipping fees are excluded because of the minimal effect that these
UTEP Technical Report TX14-2 bull March 2014 Page 6
fees typically contribute to total purchase prices (Quon et al 2005) The prices utilized also exclude taxes since most states in the United States do not levy sales taxes on medications or Internet sales while in Mexico the sale of medicines is tax exempt The number of pills per package generally varies between the United States and Mexico for each product The price comparison is carried out by obtaining the unit price of the medicines as listed for the consumer Unit prices are calculated by dividing the total price of a package by the number of units contained Statistical moments are then calculated for the prices and price differences Skewness and kurtosis estimates are used for normality testing (Bera and Jarque 1981) Dosage strengths are kept the same for each unit price pair
The formal null hypothesis shown in Equation (1) is that the difference between the unit online prices of the medicines in United States and Mexico is equal to zero The alternative hypothesis is that the difference between online unit prices of medicines charged in the United States and Mexico is different from zero Although incomes are higher in the United States recent research conducted using prices for prescription medications sold in brick and mortar pharmacies shows that prices are sometimes higher in Mexico (Fullerton and Miranda 2011)
H P ndash P = 0 vs0 USA MEXH P ndash P ne 0A USA MEX
(1)
In order to formally test the null hypothesis both parametric and non-parametric statistical tests are utilized The t-test assumes a normal distribution With only 50 observations in the sample that may not be a safe assumption Cross-border price data have been previously shown to not follow normal distributions due in part to kurtosis resulting from heavy histogram tails (Fullerton and Coronado 2001) Given that a signed ranks test that makes no assumptions regarding the distribution of the data is also employed (Wilcoxon 1945)
Empirical Results
Summary statistics for the data are shown in Table 1 The average unit price for medicines sold online in the United States is $2348 while it is $1862 for those sold in Mexico As in prior studies (Quon et al 2005 Fullerton and Miranda 2011) not all of the United States prices exceed their international counterparts Forty of the fifty medications included in the sample however are less expensive when purchased from the online pharmacies located south of the border Possible explanations of why these medicines are less expensive in Mexico include differences in income levels regulatory controls and product liability risks (Manning 1997 Ridley 2005 Kanavos and Vandoros 2011) The limited opportunities for pharmaceutical trade between Mexico and the United States along with potential risks of product losses or damages associated with cross-border medicine purchases may contribute to maintaining price differentials between the two countries
Because the Mexican Internet pharmacy sites are published in English and prices are quoted in dollars these pharmacies are likely oriented towards the United States market It is possible that pharmaceutical prices offered to Mexican consumers are lower than those advertised on Mexican Internet sites However Fullerton and Miranda (2011) find that not all brand name drugs available at walk-in pharmacies in Mexico are priced lower than counterpart products sold in the United States In fact the price differentials reported in that study are broadly similar to those shown in Table 1 Pharmaceutical companies may be hesitant to sell medications at lower prices to residents of Mexico due to concerns that these medicines could be imported to the United States and undercut prevailing prices in that market (Danzon and Furukawa 2003)
Chart 1 presents the unit price data from Table 1 in graphical form Each of the 50 medicines in the sample is represented by a dot that lies at
UTEP Technical Report TX14-2 bull March 2014 Page 7
the intersection of the United States unit price corresponding to the horizontal axis and the Mexican unit price corresponding to the vertical axis Because the dollar values of medicines included in the sample span a large range the axes are logarithmically scaled The 45O line emanating from the origin represents equality between US and Mexican unit prices Dots to the northwest of this line represent medications that are more expensive in Mexico while those located to the southeast of the line represent drugs that are more expensive in the United States Although many of the prices are clustered fairly closely to the 45O line it is easy to see that most medications are more expensive when purchased from north of the border internet pharmacies
Although a majority of the Mexico online prices in Table 1 are lower than the corresponding prices from north of the border it is not clear whether those differences are statistically significant The price differences are first examined using a standard parametric t-test The null hypothesis for this test is that the differences in the unit prices of medicines from both countries are equal to zero Although the unit prices of medicines from online pharmacies in Mexico are lower than those from the United States the difference is statistically insignificant at the 5-percent level As noted in Table 2 the calculated t-value is 053 which is less than the critical t-value of 201
However the t-test assumes data normality and previous research indicates that cross-border price data frequently fail to satisfy this assumption (Fullerton and Coronado 2001) Given that the Jarque-Bera test is performed in order to examine whether the normality assumption is satisfied (Bera and Jarque 1981) As shown in Column 9 of Table 1 the null hypothesis of normality for the medicine price differences is rejected at the 1-percent level of significance (Table 1) On the basis of this result it appears that the sample data for the price differences do not follow a normal distribution and an alternative test should be employed
Because the normality assumption is not satisfied a non-parametric test is also utilized A signed rank test (Wilcoxon 1945) is used to test the null hypothesis that the differences in the unit prices of medicines in both countries are equal to zero The Wilcoxon is approximately standard normal for samples with more than 25 observations The test result reported in Table 2 shows that the calculated Wilcoxon T-score is 447 which is greater than the critical t-value of 201 Accordingly the null hypothesis of price equality is rejected at a 5-percent level of significance The evidence provided by this alternative test indicates that differences in online medicine prices between Mexico and the United States are in fact statistically significant
Ten of the medications carry negative signs for the United States-Mexico price differentials Similar to what has been reported for walk-in pharmacies (Fullerton and Miranda 2011) this means that some prescription drugs are less expensive in the United States than in Mexico These medicines are mostly clustered among the treatments for depression and diabetes A possible reason why there are higher prices for diabetes medications in Mexico may be greater demand Mexico has a higher rate of deaths by diabetes than the United States (Alwan 2011) Other factors may also influence this differential including costs of production and price competition (Mujumdar and Pal 2005)
Not all the medicines that exhibit Internet price differences offer consequential monthly savings to consumers In order to calculate the monthly savings per medicine the recommended daily dosages are employed The recommended daily doses are retrieved from the online prescription information for each brand name medication The number of daily units multiplied by the unit price equals the daily cost per medicine This value multiplied by 30 days provides the monthly expenditure for the medication in each country The differences between the monthly expenses in Mexico and those in the United States are the monthly savings associated
UTEP Technical Report TX14-2 bull March 2014 Page 8
with buying the medicines from the websites in either country (Table 1)
The medicines that generate the largest savings for consumers willing to buy them online are Gleevec Atripla and Truvada Gleevec (Imatinib) is manufactured by Novartis Corporation and used in the treatment of certain types of cancer Atripla (Emtricitabine Tenofovir Efavirenz) is manufactured by Gilead Sciences Inc and used for the treatment of human immunodeficiency virus (HIV) Truvada (Tenofovir Emtricitabine) is also manufactured by Gilead Sciences Inc and used in the treatment of HIV Online purchases of these medicines result in savings of greater than $500 dollars per month when they are bought over the Internet from Mexico (Table 1)
The average monthly savings for online purchases from Mexico is $13173 while the sample standard deviation is $30811 Only Gleevec Atripla and Truvada are more than one standard deviation above the mean for nominal savings None of the monthly savings in the sample are more than one standard deviation below the mean (-$17638) The average monthly savings available from brick and mortar pharmacies in Ciudad Juarez is $2427 (Fullerton and Miranda 2011)
The large savings gap is partly due to sample divergences between the two studies If the comparison is limited to medicines that appear in both samples then the average monthly savings for purchases at brick and mortar pharmacies in Ciudad Juarez is $2461 whereas for Mexican online pharmacies it is $2268 This result points to remarkable price similarities among these alternative means for acquiring prescription drugs from Mexico The relatively low monthly savings based on prices alone also implies that much of the savings available to consumers may relate to avoiding doctor appointments when purchasing pharmacy products in Mexico The savings can become proportionately larger however in cases where patients purchase more than one medicine
Consumers make choices on health expenditures that involve several costs The price of medications is one of these costs Another important item is the cost of obtaining the prescription ie the price of doctor appointments and visits In general doctor appointments are less expensive in Mexico than in the United States Arredondo et al (1999) find that the cost of outpatient doctor appointments in Mexico are $790 on average which adjusted for exchange rate fluctuations was $1033 in December 2010 That figure corresponds to a 130 peso per visit charge and approximately matches the fees quoted over the telephone by several doctorrsquos offices in Ciudad Juarez during the first quarter of 2012 By comparison the Medicare fee schedule indicates that the 2010 price for doctor appointments in the United States is approximately $10986 The sizeable bi-national gap in the cost of doctor appointments is similar in magnitude to the gap between per capita total health expenditures in Mexico and the US (WHO 2012)
Most of the medicines in the sample do not however require written prescriptions when purchased in Mexico Sales of Levaquin in Mexico now require prescriptions as a consequence of the 25 August 2010 antibiotics law This law stipulates that the sale of antibiotics requires written prescriptions from doctors who hold medical licenses (Ceacutedula Profesional) in Mexico (Saacutenchez 2010) Internet sales of antibiotics are also covered by this regulation Given the price of doctor appointments in the United States the fact that Mexico does not require prescriptions for most medicines provides a fairly attractive incentive to north-of-the border consumers to consider making international online purchases Depending on how often doctor visits may be required the savings provided by avoiding office appointment fees can be substantial for some patients
Although FDA regulations specify that drugs imported to the United States should be used under medical supervision proof of such supervision is rarely required in practice (FDA 2010 Rabinovitch
UTEP Technical Report TX14-2 bull March 2014 Page 9
2005) Aside from issues regarding legality sales of drugs without medical consultations or prescriptions raise questions of consumer safety (Vargas-Hernaacutendez 2005) While less stringent pharmaceutical purchase regulations in Mexico may reduce consumer costs in some cases it may also lead to mistaken usage of self-prescribed medication and ultimately impose substantial long-term costs It should not however be assumed that most United States residents who purchase medications in Mexico do so with the aim of evading appropriate medical evaluation According to Calvillo and Lal (2003) 59 percent of United States residents who cross the border to purchase medicines at walk-in pharmacies in Mexico report being advised to take the medicine by a physician
Material in Table 1 indicates that online prices for many medicines are less expensive in Mexico Table 3 presents additional evidence regarding the relationship between the online unit prices of medicine in the United States and Mexico The correlation coefficient for both sets of prices is 0843 indicating that there is a strong relationship between the online prices in each country for these medicines Given that an interesting question is whether the prices in one country can serve as reliable explanatory variables for those in the second country
The United States is the target market for online prescription medicines included in this sample Accordingly the Internet pharmacy prices from Mexico are regressed upon their counterparts from north of the border The specification for this arrangement in which the direction of causality is assumed to be from north to south is shown in Equation (2) In (2) PMEXi is the Mexico unit price for medicine i PUSAi is the United States unit price for medicine i and ui is a stochastic disturbance
PMEX = b + b PUSA + ui 0 1 i i (2)
If the unit product prices from the United States provide unbiased estimates of the Mexico web site prices then the intercept in (2) will be equal to zero and the slope coefficient will be equal to one The formal null hypotheses for bias are shown in Equation (3) Parameter estimation results and computed test statistics for Equations (2) and (3) are shown in Table 4
H0 b0 = 0 b1 = 1 vs HA b0 ne 0 b1 ne 0
(3)
In Table 3 the intercept term is -5599 With a standard deviation of 4414 it is not statistically different from zero Given that it is not possible to reject the null hypothesis that the constant term is equal to zero The estimated slope coefficient is 1031 The computed t-statistic for the hypothesis that the slope coefficient is equal to one is -0331 Consequently it is not possible to reject the hypothesis that b1 is equal to one These results indicate that the intercept and slope coefficients are statistically indistinguishable from 0 and 1 respectively That implies that the online unit price of medicine in the United States can serve as a reliable predictor of the Internet unit price of medicine in Mexico
Conclusion
Conventional wisdom indicates that brand name prescription medicine prices are lower at online Mexican pharmacies than at United States Internet drug stores Data collected for this study corroborate that belief at least to a large extent Consumers will save an average of $13173 dollars per month when buying from online pharmacies south of the Rio Grande The savings are even larger when the cross-border differences in the fees charged for doctorrsquos appointments are taken into account However not all medicines are more affordable in Mexico Pharmaceuticals designed to treat diabetes tend to be less expensive in the United States In all ten of the fifty prescription drugs included in the sample are less expensive when purchased in the US
UTEP Technical Report TX14-2 bull March 2014 Page 10
Data in this study indicate that online medicine prices in Mexico are higher than those charged by brick and mortar pharmacies located in Mexico That may be due to the fact that transportation costs and time spent waiting to re-enter the United States make the effective delivery prices for walk-in pharmacies noticeably higher than the shelf prices for the products in question Reduced medical tourism from the United States in response to security concerns in northern Mexico potentially contributes to this pricing pattern also
Linear regression results reported above indicate that the Internet prices listed in the United States provide unbiased estimates of the online pharmacy prices charged in Mexico Because the sample utilized is cross-sectional and includes data only for October 2011 it is not possible to examine how that relationship varies over time A natural extension of this initial study would be to collect these data over time to permit analyzing the dynamic properties associated with online pharmacy prices in these two countries
References
Alwan A (2011) Noncommunicable Diseases and Mental Health (Geneva World Health Organization) Available at httpwwwwhointnmhcountriesen (accessed 23 January 2012)
APC (2001) International Pharmaceutical Price Differences (Canberra Australian Productivity Commission) Available at httpwwwpcgov au__dataassetspdf_file001818153pbspricespdf (accessed 7 November 2011)
Arredondo A R Leyva and P Naacutejera (1999) lsquoAtencioacuten Meacutedica Ambulatoria en Meacutexico El Costo para los Usuariosrsquo Salud Puacuteblica de Meacutexico 41 1 18-46
Bera A K and C M Jarque (1981) lsquoEfficient Tests for Normality Heteroscedasticity and Serial Independence of Regression Residuals Monte Carlo Evidencersquo Economics Letters 7 4 313-18
Byrd TL and JG Law (2009) lsquoCross-Border Utilization of Healthcare Services by United States Residents Living near the Mexican Borderrsquo Pan American Journal of Public Health 26 2 95-100
Calvillo JP and L Lal (2003) lsquoPilot Study of a Survey of US Residents Purchasing Medications in Mexico Demographics Reasons and Types of Medications Purchasedrsquo Clinical Therapeutics 25 2 561-577
Christopher CG A Prlic and Y Li (2011) lsquoConsumer Marketsrsquo US Economic Outlook June 2011 (New York NY IHS Global Insight) 7-19
CBP (2011) FDA Enforcement Policy Regarding the Personal Import of Violative Drugs (Washington DC US Customs and Border Protection) Available at httpwwwcbpgovxpcgovtravelclearing restrictedmedication_drugsxml (accessed 3 October 2011)
Danzon PM and L Chao (2000) lsquoCross-national Price Differences for Pharmaceuticals How Large and Whyrsquo Journal of Health Economics 19 2 159-95
Danzon PM and MF Furukawa (2003) lsquoPrices and Availability of Pharmaceuticals Evidence from Nine Countriesrsquo Health Affairs Web Exclusive 29 October 521-36 Available at httpwww healthaffairsorgWebExclusivesphp (accessed 3 October 2011)
de Guzman GC Khaleghi M Riffenberg RH and RF Clark (2007) lsquoA Survey of the Use of Foreign-Purchased Medications in a Border Community Emergency Department Patient Populationrsquo Journal of Emergency Medicine 33 2 213-221
UTEP Technical Report TX14-2 bull March 2014 Page 11
FDA (2010) Regulatory Procedures Manual (Silver Spring MD Food and Drug Administration) Available at ht tp wwwfdagovICECI ComplianceManualsRegulatoryProceduresManual ucm179266htm (accessed 10 December 2012)
Fullerton Jr TM and R Coronado (2001) lsquoRestaurant Prices and the Mexican Pesorsquo Southern Economic Journal 68 1 145-155
Fullerton Jr TM and O Miranda (2011) lsquoBorderplex Brand Name Medicine Price Differencesrsquo Applied Economics 43 8 929-939
IMS (2012) lsquoThe Use of Medicines in the United States Review of 2011rsquo IMS Institute for Healthcare Informatics Available at httpwwwimshealth comportalsiteims (accessed 4 December 2012)
Kanavos PG and S Vandoros (2011) lsquoDeterminants of Branded Prescription Medicine Prices in OECD Countriesrsquo Health Economics Policy and Law 6 3 337-367
Manning RL (1997) lsquoProducts Liability and Prescription Drug Prices in Canada and the United Statesrsquo Journal of Law and Economics 40 1 203-244
Mujumdar S and D Pal (2005) lsquoDo Price Ceilings Abroad increase US Drug Pricesrsquo Economics Letters 87 1 9-13
Quon BS R Firszt and MJ Eisenberg (2005) lsquoA Comparison of Brand Name Drug Prices Between Canadian-based Internet Pharmacies and Major US Drug Chain Pharmaciesrsquo Annals of Internal Medicine 143 6 397-403
Rabinovitch SR (2005) lsquoOn the Legitimacy of Cross-Border Pharmacyrsquo Alberta Law Review 43 2 327-368
Ridley DB (2005) lsquoPrice Differentiation and Transparency in the Global Pharmaceutical Marketplacersquo Pharmacoeconomics 23 7 651-658
Saa tsoglou P (2004) lsquoPharmaceut ica l Reimportation Magnitude Trends and Consumersrsquo Managed Care 13 3 7-9
Saacutenchez J (2010) lsquoLey para Antibioacuteticos una Necesidadrsquo El Universal 27 May 1
Vargas Hernaacutendez JG (2006) lsquoMercado Transfronterizo en Servicios de Saludrsquo Ciudades 69 58-64
Wagner JL and E McCarthy (2004) lsquoInternational Differences in Drug Pricesrsquo Annual Review of Public Health 25 1 475-4t95
Wilcoxon F (1945) lsquoIndividual Comparisons by Ranking Methodsrsquo Biometrics Bulletin 1 6 80-83
WHO (2012) World Health Statistics 2012 (Geneva World Health Organization) Available at httpwwwwhointghopublicationsworld_health_ statisticsenindexhtml (accessed 1 June 2012)
UTEP Technical Report TX14-2 bull March 2014 Page 12
Table 1 Brand name medication prices for online pharmacies in the United States and Mexico
Name Dosage USA Price of units
USA Unit Price
MEX Price
of units
MEX Unit Price
Difference UUSshy
UMX
Units per day
Monthly Cost USA
Cost Month MEX
Savings Month
Abilify 10 mg 54698 30 1823 11895 10 1190 634 100 54698 35685 19013
Aciphex 20 mg 23399 30 780 14722 28 526 254 100 23399 15774 7625
Actos 30 mg 27899 30 930 13431 14 959 -029 100 27899 28781 -882
Advair Diskus 10050 mg 18999 60 317 10153 60 169 147 200 18999 10153 8846
Aricept 10 mg 30491 30 1016 17668 28 631 385 100 30491 18930 11561
Atripla 600200300 mg 187896 30 6263 48750 30 1625 4638 100 187896 48750 139146
Benicar 4 mg 12549 30 418 9000 30 300 118 100 12549 9000 3549
Boniva 150 mg 12899 1 12899 12120 1 12120 779 003 11609 10908 701
Celebrex 200 mg 14099 30 470 7652 30 255 215 100 14099 7652 6447
Cialis 20 mg 20999 10 2100 10490 4 2623 -523 100 62997 78675 -15678
Crestor 10 mg 15499 30 517 7956 30 265 251 100 15499 7956 7543
Cymbalta 60 mg 17099 30 570 17177 28 613 -043 150 25649 27606 -1957
Detrol LA 4 mg 16899 30 563 7200 30 240 323 100 16899 7200 9699
Diovan 80 mg 9599 30 320 7947 30 265 055 100 9599 7947 1652
Diovan HCT 16025 mg 12699 30 423 17136 28 612 -189 100 12699 18360 -5661
Effexor XR 375 mg 13699 30 457 10030 20 502 -045 250 34248 37613 -3365
Femara 25 mg 51696 30 1723 17400 30 580 1143 100 51696 17400 34296
Flomax 04 mg 15399 30 513 9532 20 477 037 100 15399 14298 1101
Geodon Oral 40 mg 52097 60 868 19302 28 689 179 200 52097 41361 10736
Gleevec 500 mg 150603 30 5020 45000 30 1500 3520 150 225905 67500 158405
Januvia 100 mg 21600 30 720 11145 28 398 322 100 21600 11941 9659
Lantus 01 ml 33198 3 11066 32500 3 10833 233 001 3320 3250 070
Lantus SoloSTAR 01 ml 19617 1 19617 32500 1 32500 -12883 003 17655 29250 -11595
Levaquin 250 mg 48497 30 1617 6958 30 232 1385 100 48497 6958 41539
Lexapro 10 mg 11899 30 397 13986 28 500 -103 100 11899 14985 -3086
Lipitor 20 mg 15999 30 533 21939 30 731 -198 100 15999 21939 -5940
Lyrica 150 mg 9499 30 317 9504 28 339 -023 250 23748 25457 -1710
UTEP Technical Report TX14-2 bull March 2014 Page 13
Namenda 10 mg 22300 60 372 6150 30 205 167 150 16725 9225 7500
Nasonex 50 mcg 13099 1 13099 2699 1 2699 10400 002 6288 1296 4992
Nexium 20 mg 20099 30 670 5176 14 370 300 100 20099 11091 9008
Niaspan 500 mg 8999 30 300 2760 30 092 208 250 22498 6900 15598
Plavix 75 mg 19599 30 653 12204 28 436 217 100 19599 13076 6523
Premarin 0625 mg 6510 30 217 5048 28 180 037 060 3906 3245 661
Protonix 40 mg 19000 30 633 3079 14 220 413 150 28500 9897 18603
Restasis 02 ml 14662 30 489 15083 30 503 -014 200 29324 30166 -842
Seroquel 100 mg 36498 60 608 10935 30 365 244 150 27374 16403 10971
Seroquel XR 300 mg 41040 30 1368 20600 30 687 681 150 61560 30900 30660
Singulair 10 mg 16099 30 537 9392 20 470 067 100 16099 14088 2011
Spiriva 18 mg 24598 30 820 6076 20 304 516 100 24598 9114 15484
Strattera 10 mg 19000 30 633 7848 14 561 073 100 19000 16817 2183
Symbicort 16045 mg 22999 120 192 6880 60 115 077 400 22999 13760 9239
Synthroid 150 mg 3399 30 113 4539 50 091 023 100 3399 2723 676
Truvada 200300 mg 108504 30 3617 49500 30 1650 1967 100 108504 49500 59004
Valtrex 500 mg 23598 30 787 26500 42 631 156 300 70794 56786 14008
Ventolin HFA 90 mcg 4599 1 4599 3743 1 3743 856 003 4139 3369 770
Viagra 50 mg 19399 10 1940 7500 4 1875 065 100 58197 56250 1947
Vytorin 1020 mg 13499 30 450 5118 14 366 084 100 13499 10967 2532
Xalatan 25 ml 10499 1 10499 3999 1 3999 6500 002 6929 2639 4290
Zetia 10 mg 13999 30 467 8830 20 442 025 100 13999 13245 754
Zyprexa 10 mg 62401 30 2080 9812 7 1402 678 100 62401 42051 20350
Mean 29279 2348 13531 1862 486 34149 20977 13173
SD 33888 4032 10965 4927 2646 41539 17994 30811
Skewness 330 272 199 525 -122 325 143 371
Kurtosis 1182 733 384 3060 1639 1194 159 1483
JB Statistic 31734 14618 5444
179310 46046 31949 1955 47436
Notes All data are from the week of 10-14 October 2011 All medicine dosages are equal for both countries
UTEP Technical Report TX14-2 bull March 2014 Page 14
Lantus and Lantus SoloSTAR assume a requirement of 3 unitsml per dayNasonex contains 120 sprays per bottle (50 mcgact) with a suggested application of 2 sprays dailyRestasis contains 2 drops per ampule (0054ml) with a suggested application of 4 drops dailyVentolin HFA contains 200 puffs per inhaler (108-90mcg) with a suggested application of 6 puffs dailyXalatan contains 45 drops per bottle (25ml) with a suggested application of 1 drop dailyNegative numbers indicate savings result from purchases at United States online pharmacies Data are from bajapharmacycom drugstorecom familymedscom medsmexcom and pharmaciesherbalcom If brand name medicines contain ingredients of multiple generic medicines the dosages of those medicines are separated by slashes Negative numbers indicate prices are more expensive at Mexican online pharmacies Significant at 1-percent level
Table 2 Parametric and Non-parametric Tests for Unit Price Equality
Computed Test Statistic 1-Percent Critical Value Decision t-hat = 0535 2678 Fail to reject null hypothesis unit price equality Wilcoxon T-score = 4474 2678 Reject the null hypothesis of unit price equality
UTEP Technical Report TX14-2 bull March 2014 Page 15
Table 3 United States and Mexico Online Pharmacy Price Regression Results
Regression Test for Predictive Bias Ho b0 = 00 b1 = 10 Dependent Variable PMEXi (Mexico Unit Price) Method Least Squares Sample 1 50 Included observations 50
Independent Variable Constant PUSAi (USA Unit Price)
Coefficient -5598827 1031296
Standard Error 4414058 0094604
t-Statistic -1268408 1090124
Probability 02108 00000
R-squared Adjusted R-squared Standard error of regression Sum squared residuals
0712294 0706300 2697199 3491945
Mean dependentStd deviation deLog likelihood F-statistic
variable p variable
1861600 4976926 -2346663 1188370
Notes 1 Rho(PMEXi PUSAi) = 0843 2 For H0 b0 = 00 HA b0 ne 00 t-hat = 1268 lt t-critical= 2010 fail to reject Ho at 5-percent level 3 For H0 b1 = 10 HA b1 ne 10 t-hat = 0331 lt t-critical= 2010 fail to reject Ho at 5-percent level 4 Parameter estimates and test results indicate that USA unit prices are unbiased predictors of Mexico prices
UTEP Technical Report TX14-2 bull March 2014 Page 16
_____________________________________ _____________________________________ _____________________________________ _____________________________________ _____________________________________ _____________________________________ _____________________________________
The University of Texas at El Paso Announces
Borderplex Economic Outlook 2013-2015 UTEP is pleased to announce the 2013 edition of its primary source of border business information Topics covered include demography employment personal income retail sales residential real estate transportation international commerce and municipal water consumption Forecasts are generated utilizing the 255-equation UTEP Border Region Econometric Model developed under the auspices of a corporate research gift from El Paso Electric Company
The authors of this publication are UTEP Professor amp Trade in the Americas Chair Tom Fullerton and UTEP Associate Economist Adam Walke Dr Fullerton holds degrees from UTEP Iowa State University Wharton School of Finance at the University of Pennsylvania and University of Florida Prior experience includes positions as Economist in the Executive Office of the Governor of Idaho International Economist in the Latin America Service of Wharton Econometrics and Senior Economist at the Bureau of Economic and Business Research at the University of Florida Adam Walke holds an MS in Economics from UTEP and has published research on energy economics mass transit demand and cross-border regional growth patterns
The border business outlook for 2013 through 2015 can be purchased for $10 per copy Please indicate to what address the report(s) should be mailed (also include telephone fax and email address)
Send checks made out to University of Texas at El Paso for $10 to
Border Region Modeling Project - CBA 236 UTEP Department of Economics amp Finance 500 West University Avenue El Paso TX 79968-0543
Request information from 915-747-7775 or agwalkeutepedu if payment in pesos is preferred
UTEP Technical Report TX14-2 bull March 2014 Page 17
_____________________________________ _____________________________________ _____________________________________ _____________________________________ _____________________________________ _____________________________________ _____________________________________ _____________________________________
The University of Texas at El Paso Announces
Borderplex Long-Term Economic Trends to 2029 UTEP is pleased to announce the availability of an electronic version of the 2010 edition of its primary source of longshyterm border business outlook information Topics covered include detailed economic projections for El Paso Las Cruces Ciudad Juaacuterez and Chihuahua City Forecasts are generated utilizing the 225-equation UTEP Border Region Econometric Model developed under the auspices of a 12-year corporate research support program from El Paso Electric Company
The authors of this publication are UTEP Professor amp Trade in the Americas Chair Tom Fullerton and former UTEP Associate Economist Angel Molina Dr Fullerton holds degrees from UTEP Iowa State University Wharton School of Finance at the University of Pennsylvania and University of Florida Prior experience includes positions as Economist in the Executive Office of the Governor of Idaho International Economist in the Latin America Service of Wharton Econometrics and Senior Economist at the Bureau of Economic and Business Research at the University of Florida Angel Molina holds an MS Economics degree from UTEP and has conducted econometric research on international bridge traffic peso exchange rate fluctuations and cross-border economic growth patterns
The long-term border business outlook through 2029 can be purchased for $10 per copy Please indicate to what address the report(s) should be mailed (also include telephone fax and email address)
Send checks made out to University of Texas at El Paso for $10 to
Border Region Modeling Project - CBA 236 UTEP Department of Economics amp Finance 500 West University Avenue El Paso TX 79968-0543
Request information at 915-747-7775 or agwalkeminersutepedu if payment in pesos is preferred
UTEP Technical Report TX14-2 bull March 2014 Page 18
The UTEP Border Region Modeling Project amp UACJ Press
Announce the Availability of
Basic Border Econometrics The University of Texas at El Paso Border Region Modeling Project is pleased to announce Basic Border Econometrics a publication from Universidad Autoacutenoma de Ciudad Juaacuterez Editors of this new collection are Martha Patricia Barraza de Anda of the Department of Economics at Universidad Autoacutenoma de Ciudad Juaacuterez and Tom Fullerton of the Department of Economics amp Finance at the University of Texas at El Paso
Professor Barraza is an award winning economist who has taught at several universities in Mexico and has published in academic research journals in Mexico Europe and the United States Dr Barraza currently serves as Research Provost at UACJ Professor Fullerton has authored econometric studies published in academic research journals of North America Europe South America Asia Africa and Australia Dr Fullerton has delivered economics lectures in Canada Colombia Ecuador Finland Germany Japan Korea Mexico the United Kingdom the United States and Venezuela
Border economics is a field in which many contradictory claims are often voiced but careful empirical documentation is rarely attempted Basic Border Econometrics is a unique collection of ten separate studies that empirically assess carefully assembled data and econometric evidence for a variety of different topics Among the latter are peso fluctuations and cross-border retail impacts border crime and boundary enforcement educational attainment and border income performance pre- and post-NAFTA retail patterns self-employed Mexican-American earnings maquiladora employment patterns merchandise trade flows and Texas border business cycles
Contributors to the book include economic researchers from the University of Texas at El Paso New Mexico State University University of Texas Pan American Texas AampM International University El Colegio de la Frontera Norte and the Federal Reserve Bank of Dallas Their research interests cover a wide range of fields and provide multi-faceted angles from which to examine border economic trends and issues
A limited number of Basic Border Econometrics can be purchased for $10 per copy Please contact Professor Servando Pineda of Universidad Autoacutenoma de Ciudad Juaacuterez at spinedauacjmx to order copies of the book Additional information for placing orders is also available from Professor Martha Patricia Barraza de Anda at mbarrazauacjmx
UTEP Technical Report TX14-2 bull March 2014 Page 19
The University of Texas at El Paso Technical Report Series
TX97-1 Currency Movements and International Border Crossings TX97-2 New Directions in Latin American Macroeconometrics TX97-3 Multimodal Approaches to Land Use Planning TX97-4 Empirical Models for Secondary Market Debt PricesTX97-5 Latin American Progress Under Structural Reform TX97-6 Functional Form for United States-Mexico Trade Equations TX98-1 Border Region Commercial Electricity Demand TX98-2 Currency Devaluation and Cross-Border Competition TX98-3 Logistics Strategy and Performance in a Cross-Border Environment TX99-1 Inflationary Pressure Determinants in Mexico TX99-2 Latin American Trade Elasticities CSWHT00-1 Tariff Elimination Staging Categories and NAFTA TX00-1 Borderplex Business Forecasting Analysis TX01-1 Menu Prices and the Peso TX01-2 Education and Border Income Performance TX02-1 Regional Econometric Assessment of Borderplex Water Consumption TX02-2 Empirical Evidence on the El Paso Property Tax Abatement Program TX03-1 Security Measures Public Policy Immigration and Trade with Mexico TX03-2 Recent Trends in Border Economic Analysis TX04-1 El Paso Customs District Cross-Border Trade Flows TX04-2 Borderplex Bridge and Air Econometric Forecast Accuracy 1998-2003 TX05-1 Short-Term Water Consumption Patterns in El Paso TX05-2 Menu Price and Peso Interactions 1997-2002 TX06-1 Water Transfer Policies in El Paso TX06-2 Short-Term Water Consumption Patterns in Ciudad Juaacuterez TX07-1 El Paso Retail Forecast Accuracy TX07-2 Borderplex Population and Migration Modeling TX08-1 Borderplex 911 Economic Impacts TX08-2 El Paso Real Estate Forecast Accuracy 1998-2003 TX09-1 Tolls Exchange Rates and Borderplex Bridge Traffic TX09-2 Menu Price and Peso Interactions 1997-2008 TX10-1 Are Brand Name Medicine Prices Really Lower in Ciudad Juaacuterez TX10-2 Border Metropolitan Water Forecast Accuracy TX11-1 Cross Border Business Cycle Impacts on El Paso Housing 1970-2003 TX11-2 Retail Peso Exchange Rate Discounts and Premia in El Paso TX12-1 Borderplex Panel Evidence on Restaurant Price and Exchange Rate Dynamics TX12-2 Dinaacutemica del Consumo de Gasolina en Ciudad Juaacuterez 2001-2009 TX13-1 Physical Infrastructure and Economic Growth in El Paso 1976-2009 TX13-2 Tolls Exchange Rates and Northbound International Bridge Traffic 1990-2006 TX14-1 Freight Transportation Costs and the Thickening of the US-Mexico Border TX14-2 Are Online Pharmacy Prices Really Lower in Mexico
UTEP Technical Report TX14-2 bull March 2014 Page 20
The University of Texas at El Paso Border Business Forecast Series
SR98-1 El Paso Economic Outlook 1998-2000 SR99-1 Borderplex Economic Outlook 1999-2001 SR00-1 Borderplex Economic Outlook 2000-2002 SR01-1 Borderplex Long-Term Economic Trends to 2020 SR01-2 Borderplex Economic Outlook 2001-2003 SR02-1 Borderplex Long-Term Economic Trends to 2021 SR02-2 Borderplex Economic Outlook 2002-2004 SR03-1 Borderplex Long-Term Economic Trends to 2022 SR03-2 Borderplex Economic Outlook 2003-2005 SR04-1 Borderplex Long-Term Economic Trends to 2023 SR04-2 Borderplex Economic Outlook 2004-2006 SR05-1 Borderplex Long-Term Economic Trends to 2024 SR05-2 Borderplex Economic Outlook 2005-2007 SR06-1 Borderplex Long-Term Economic Trends to 2025 SR06-2 Borderplex Economic Outlook 2006-2008 SR07-1 Borderplex Long-Term Economic Trends to 2026 SR07-2 Borderplex Economic Outlook 2007-2009 SR08-1 Borderplex Long-Term Economic Trends to 2027 SR08-2 Borderplex Economic Outlook 2008-2010 SR09-1 Borderplex Long-Term Economic Trends to 2028 SR09-2 Borderplex Economic Outlook 2009-2011 SR10-1 Borderplex Long-Term Economic Trends to 2029 SR10-2 Borderplex Economic Outlook 2010-2012 SR11-1 Borderplex Economic Outlook 2011-2013 SR12-1 Borderplex Economic Outlook 2012-2014 SR13-1 Borderplex Economic Outlook 2013-2015
Technical Report TX14-2 is a publication of the Border Region Modeling Project and the Department of Economics amp Finance at the University of Texas at El Paso For additional Border Region information please visit the wwwacademicsutepeduborder section of the UTEP web site
UTEP Technical Report TX14-2 bull March 2014 Page 21
Bord
er R
egio
n M
odel
ing
Proj
ect ndash
CBA
236
U
TEP
Depa
rtm
ent o
f Eco
nom
ics
amp F
inan
ce
500
Wes
t Uni
vers
ity A
venu
e El
Pas
o T
X 79
968-
0543
www
utep
edu
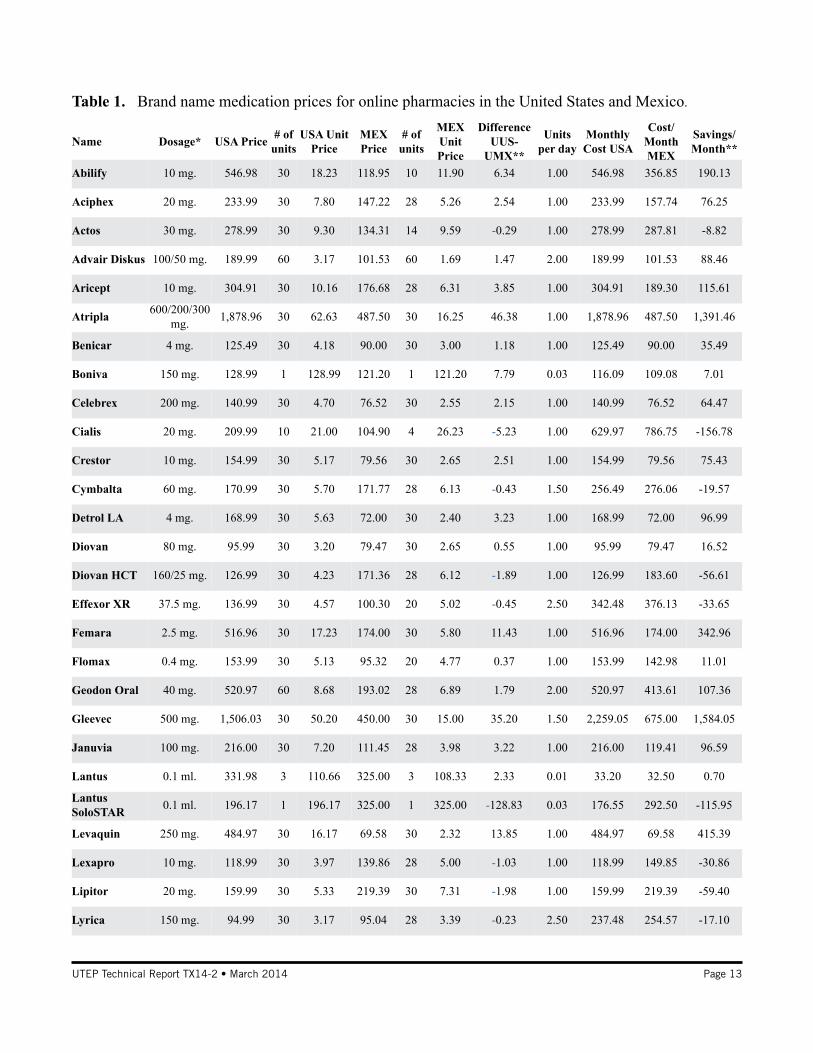
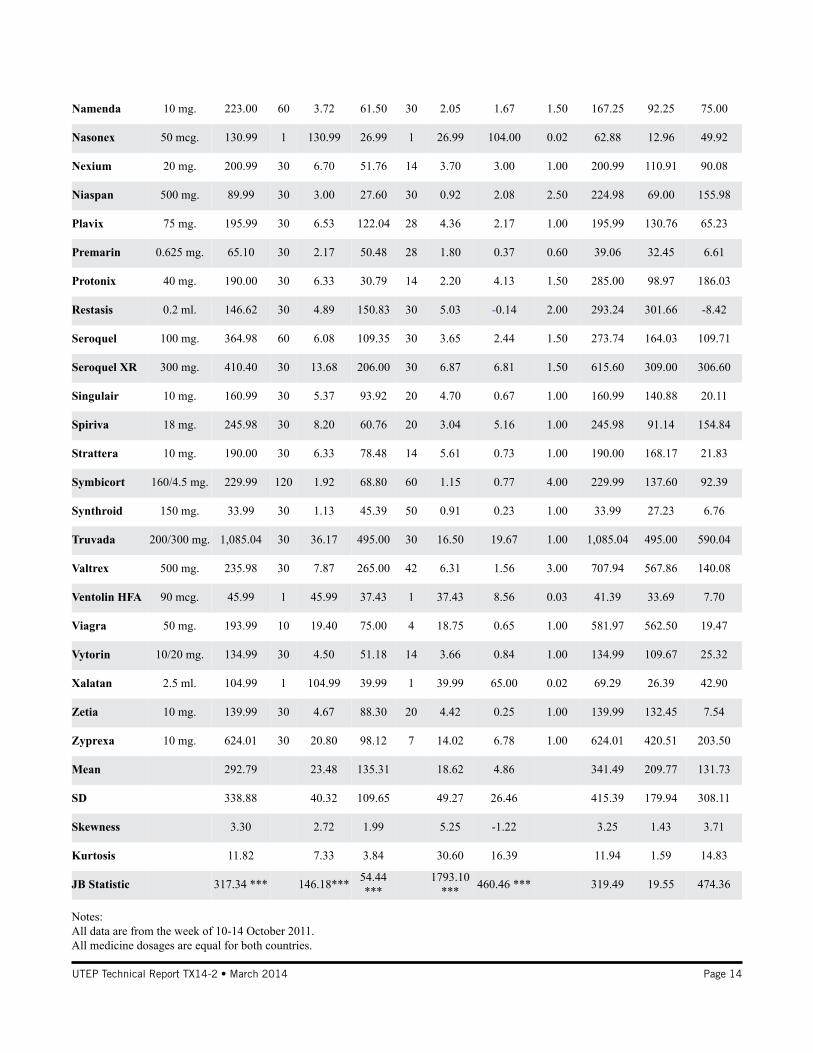
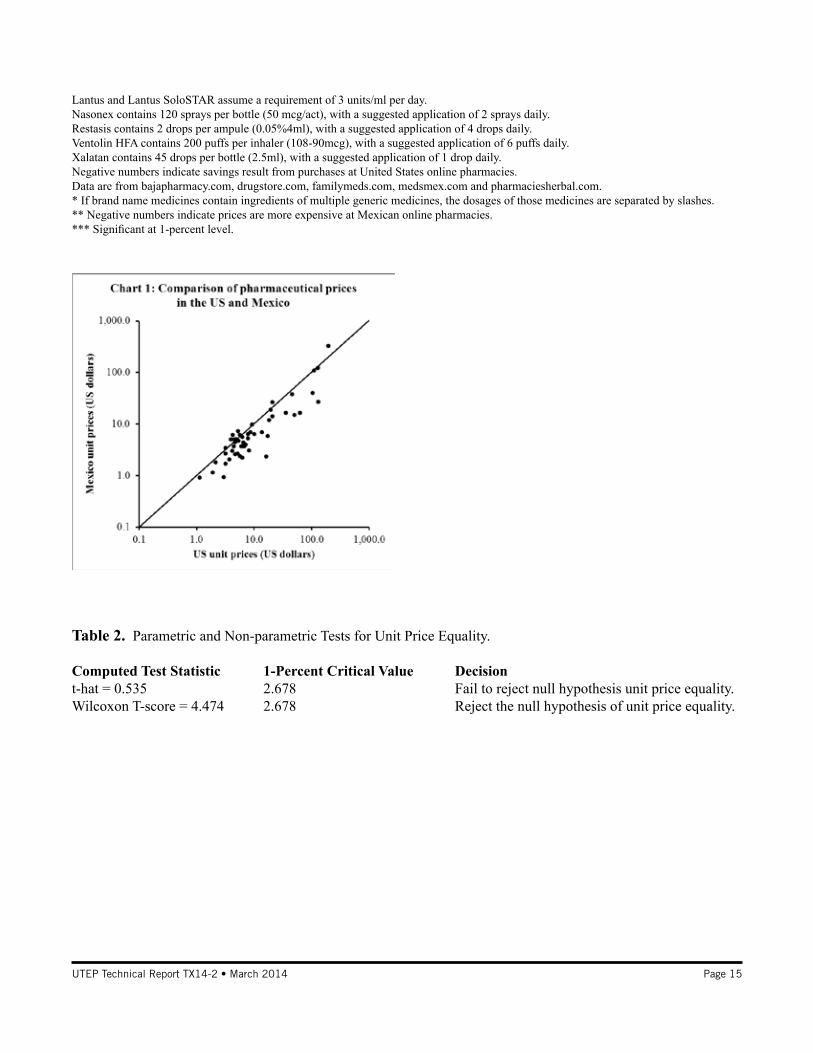
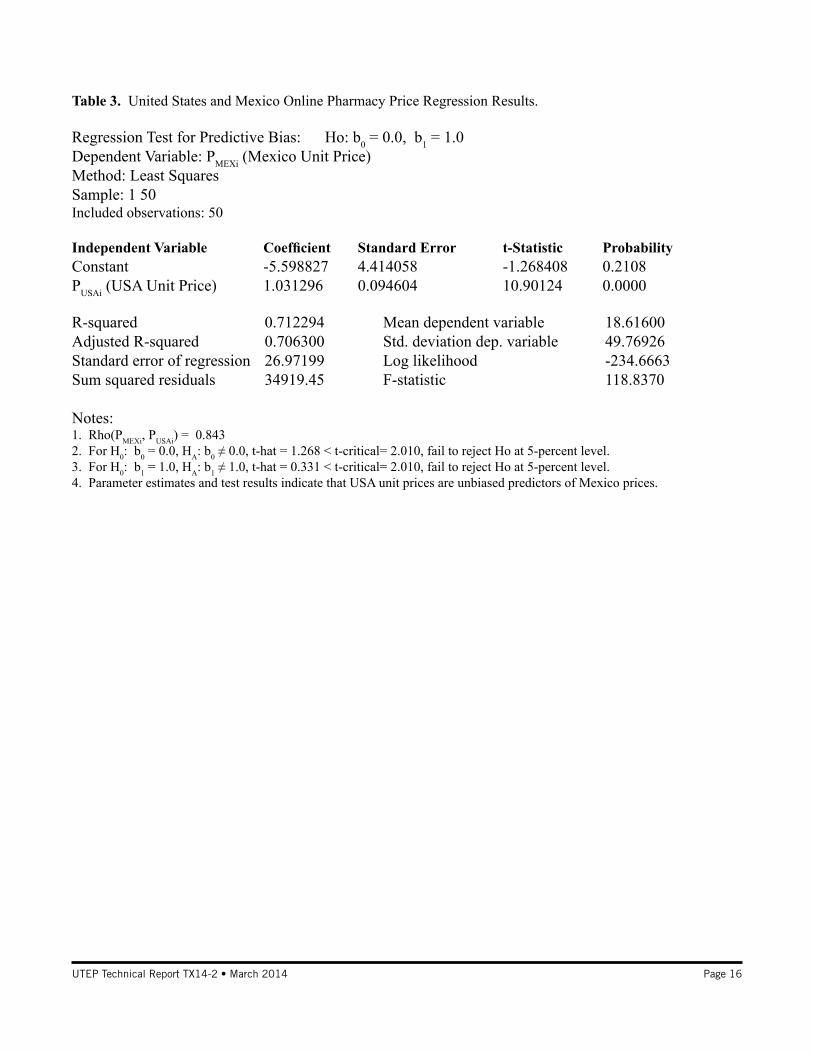
Bord
er R
egio
n M
odel
ing
Proj
ect ndash
CBA
236
U
TEP
Depa
rtm
ent o
f Eco
nom
ics
amp F
inan
ce
500
Wes
t Uni
vers
ity A
venu
e El
Pas
o T
X 79
968-
0543
www
utep
edu


![The Sun. (New York, N.Y.) 1906-11-05 [p 12].€¦ · property market makes Again YORK stocks nerwlad bout second houses T-Ciilrago Wall should prices really really 33 owing current](https://img.pdfslide.us/doc/110x75/6116c29cbc3df1472e39ec6f/the-sun-new-york-ny-1906-11-05-p-12-property-market-makes-again-york-stocks.jpg)