Embed Size (px)
Citation preview

Are Investors Moonstruck? Lunar Phases and Stock Returns
Kathy Yuan∗ [email protected]
Lu Zheng
Qiaoqiao Zhu [email protected]
First Draft: August, 2001 This Draft: September, 2002
∗ Yuan and Zheng are at the University of Michigan Business School, 701 Tappan Street, Ann Arbor, MI 48109. Zhu is at the University of Michigan Economics Department. We thank Wang Jing for research assistance. We are grateful to Keith Brown, Campbell Harvey, David Hirshleifer, Han Kim, Nancy Kotzian, Emre Ozdenoren, Scott Richardson and Tyler Shumway for helpful comments. We thank seminar participants at University of Michigan Business School, Michigan State University, University of Texas at Austin. All errors are our own.

2
Are Investors Moonstruck? Lunar Phases and Stock Returns
Abstract
Biological and psychological evidence suggests that lunar phases affect
human behavior and mood. Do lunar phases affect investors' trading
behavior and thus stock market returns? This paper investigates the
relation between lunar phases and stock market returns in 48 countries.
We find strong global evidence that stock returns are lower on days
around a full moon than on days around a new moon. The magnitude of
the return difference is 5.4 percent per annum based on our 15-day
window analysis of the global portfolio. The return difference is not
due to changes in stock market volatility. Moreover, the lunar effect is
independent of other calendar-related anomalies such as the January
effect, the day-of-week effect, the calendar month effect, the holiday
effect. We also find that the lunar effect is not due to the returns around
lunar holidays.

3
It is the very error of the moon, She comes more near the earth than she was wont. And makes men mad. (Othello, Act V, Scene ii)
Introduction
Moon phases regulate mood and behavior; this belief dates back to ancient times.
The lunar effect on human body and mind is supported anecdotally, as well as
empirically through psychological and biological research. Do moon phases affect the
asset market?
If investors make decisions strictly through rational maximization, then the
answer is no. However, extensive evidence suggests that investors are subject to various
psychological and behavioral biases when making investment decisions, such as loss-
aversion, overconfidence, and mood fluctuation.1 On a general level, numerous
psychological studies suggest that mood can affect human judgment and behavior.2
Behavioral finance literature also finds some evidence of the effect of mood on asset
prices.3 Since lunar phases affect mood, by extension, these phases may affect investor
behavior and thus asset prices. If so, then asset returns during full moon phases may be
different from those during new moon phases. More specifically, since psychological
studies associate full moon phases with depressed mood, we hypothesize that stock
returns are lower during the full moon periods.
1 Odean (1998) tests for the disposition effect and finds that investors demonstrate a strong preference for realizing winners rather than losers. Odean (1999) shows that investors trade excessively. Harlow and Brown (1990) offer a theoretical link between risk tolerance and behavioral traits. 2 For example, Frijda (1988) argues that mood may affect human judgment through misattribution. Schwarz and Bless (1991) show that mood may influence people’s ability to process information. 3 Kamstra, Kramer, and Levi (2000) show that the Friday-Monday return is significantly lower on daylight-saving weekends than other weekends. Hirshleifer and Shumway (2001) also find that sunshine is positively correlated with stock returns. Coval and Shumway (2001) document that traders who experience morning losses are more likely to assume more risks in the afternoon than traders with morning gains. This behavior bias has short-term consequences for afternoon prices.

4
Similar to Hirshleifer and Shumway (2001), this study of the effect of lunar
phases on stock market returns is motivated by a psychological hypothesis and therefore
is not likely subject to the criticism of datasnooping. Moreover, in modern society, the
lunar cycle has little tangible impact on people’s economic and social activities, even less
so than sunshine and seasonal changes. Consequently, it would be difficult to find
rational explanations for any correlations between lunar phases and stock returns.
Besides, the causality would be obvious if there were such a lunar effect on stock returns.
Thus, investigating the lunar effect on stock returns is a strong test of whether investor
mood affects asset prices.
To investigate the relation between lunar phases and stock returns, we first test the
association of lunar phases with the returns of an equal-weighted global portfolio of 48
country stock indices. We find that global stock returns are significantly lower during the
full moon periods than the new moon periods. The mean daily return difference between
the new moon period and the full moon period is 4.34 basis points for the 15-day window
specification and 5.51 basis points for the 7-day window specification. The above
numbers translate into annualized return difference of 5.4 percent and 6.9 percent
respectively, both significant at the 5 percent level.4
To test explicitly for the cyclical pattern of the lunar effect, we estimate a
sinusoidal model. According to this model, the lunar effect reaches its peak at the time of
full moon and declines to a trough at the time of new moon, following a cosine curve
with a period of 29.53 days (the mean length of a lunar cycle). Our test results indicate a
significant cyclical lunar pattern in stock returns.

5
We then test the association of lunar phases and daily stock returns for each of the
48 countries. The results of this investigation indicate that, for all 23 developed stock
markets, stock returns are negatively correlated with 15-day full moon phases. For the
remaining 25 emerging markets, stock market returns are negatively correlated with 15-
day full moon phases in 20 of the markets. The statistical power of these country-by-
country tests is low since there are more shocks in the stock return data at the country
level.
In addition to a 15-day window, we also examine the relation between lunar
phases and stock returns by looking at a 7-day window around the full moon and a 7-day
window around the new moon. This test of the relation between lunar phases and daily
stock returns yields similar results to the findings for the 15-day window for the emerging
markets. For the developed markets, the 7-day window lunar effect is weaker, but still
significant.
To fully utilize our panel data, we estimate a pooled regression with panel
corrected standard errors (PCSE) for the following categories: G-7 countries, other
developed countries, emerging-market countries, and all 48 countries. In all cases, we
find a statistically significant relation between moon phases and stock returns for both the
7-day and the 15-day windows. For all countries, stock returns are, on average, 6.6
percent lower for the 15 days around the full moon than for the 15 days around the new
moon on an annual basis. Using a 7-day window, stock returns are, on average, 8.3
percent lower on the full moon days than on the new moon days on an annual basis.
Furthermore, the magnitude of this lunar effect is larger in the emerging market countries
4 5.4 percent per annum for the 15-day window is computed by multiplying 4.34 basis point difference in Table 2 by 125 days (which is number of full moon and new moon daily return differences in a year). 6.3

6
(a 7.09 basis points daily difference for the 15-day window and a 13.35 basis points daily
difference for the 7-day window) than in the G-7 countries (a 3.47 basis points daily
difference for the 15-day window and a 2.6 basis points daily difference for the 7-day
window).
To relate the lunar effect to investor sentiment, we examine whether the lunar
effect on stock returns is related to stock size, and thus individual vs. institutional
decision-making, since institutional ownership is higher for large cap stocks. Indeed, we
find evidence that the lunar effect is more pronounced for small (although not the
smallest) cap stocks than for large cap stocks. Thus, the evidence suggests that the lunar
effect is stronger for stocks that are held mostly by individuals. This finding is consistent
with the idea that lunar phases affect individual moods, which in turn affect investment
behavior.
To better understand the relation between lunar phases and stock markets, we
investigate how lunar phases relate to stock trading volumes and return volatility. We
find no significant evidence that the lunar effect observed in stock returns is associated
with trading volumes or risk differentials between the full moon and the new moon
periods.
Finally, we explore whether the lunar effect is related to other calendar-related
anomalies, such as the January effect, the day-of-week effect, the calendar month effect,
and the holiday effect. The findings indicate that the lunar effect remains the same after
controlling for other calendar effects. Thus, we conclude that the lunar effect is unlikely
a manifestation of these calendar anomalies.
per cent per annum for the 7-day window is computed similarly.

7
The remainder of the paper is organized as follows. Section I discusses the
literature on how lunar phases affect human mood and behavior. Section II describes the
data. Section III reports the test results. Section IV concludes.

8
I. Literature
One difficulty in testing whether psychological biases and sentiments affect
investor trading behavior and asset prices is to find a proxy variable for sentiment or
mood that is observable and exogenous to economic variables. Nonetheless, there are
several ingenious attempts. For example, in their respective studies of the relation
between mood and stock returns, Saunders (1993) and Hirshleifer and Shumway (2001),
drawing on psychological evidence that sunny weather is associated with an upbeat
mood, find that sunshine is strongly positively correlated with stock returns. Likewise, in
their study of the seasonal time-variation of risk premia in stock market returns, Kamsta,
Kramer and Levi (2001) draw on a documented medical phenomenon, Seasonal Affective
Disorder (SAD) to proxy investor mood and find a statistical significant relationship
between SAD and stock market returns. Kamsta, Kramer and Levi (2001) relate yearly
daylight fluctuations to stock market returns.
In this paper, we appeal to a popular wisdom that lunar phases affect mood and
behavior, and study the relation between lunar phases and stock returns. We argue that
lunar effect is an exogenous proxy for mood since lunar phases do not have tangible
effects on economic and social activities. Furthermore, unlike sunshine, lunar cycles are
predictable. A relationship between lunar cycles and stock returns will indicate that stock
prices are predictable and not correlated with economic fundamentals, which is a stronger
violation of market efficiency hypothesis.
The idea that the moon affects individual moods has ancient roots. The moon has
been associated with mental disorder since olden time, as reflected by the word “lunacy,”
which derives from Luna, the Roman goddess of the moon. Popular belief has linked the

9
full moon to such disparate events as epilepsy, somnambulism, crime, suicide, mental
illness, disasters, accidents, birthrates, and fertility.
Biological evidence suggests that lunar phases have an impact on human body
and behavior. Research that concerns biological rhythms documents a circatrigintan
cycle, a moon-related human cycle. The most common monthly cycle is menstruation. A
woman's menstrual cycle is about the same length as a lunar cycle, which suggests the
influence of the moon. Law (1986) finds a synchronous relationship between the
menstrual cycle and the lunar cycle: a large and significant proportion of menstruation
occurred around new moon. Studies also find a lunar effect on fertility, for example,
Criss and Marcum (1981) document that births vary systematically over lunar cycles with
a peak fertility at 3rd quarter. Besides, lunar phases affect human nutrient intake: de
Castro and Pearcey (1995) document an 8% increase in meal size and a 26% decrease in
alcohol intake at the time of full moon relative to new moon.
Much attention has been paid to the lunar effect on human mood and behavior in
psychology literature. A recent study, Neal and Colledge (2000), documents an increase
in general practice consultations during the full moon. Lieber (1978) and Tasso and
Miller (1976) all indicate a disproportionately high number of criminal offences occur
during full moon. Weiskott (1974) reports evidence that number of crisis calls is higher
during full moon and waning phases. Hicks-Caskey and Potter (1992) suggest an effect
of the day of the full moon on the acting-out behavior of 20 developmentally delayed,
institutionalized women. The study shows that on the day of the full moon there are
significantly more misbehaviors than on any other day during the lunar period. Sands
and Miller (1991) document that the full moon is associated with a significant but slight

10
decrease in absenteeism after controlling for the effects of the day of the week, month,
and proximity to a holiday. Overall, the effect of the moon has been studied informally
and formally for years. However, we must note that, despite the attention this effect has
received, psychological evidence for the lunar hypothesis in general is not conclusive
even though biological evidence is strong. For example, in a review of empirical studies
up to 1978 on the lunar effect, Campbell and Beets (1978) conclude that lunar phases
have little effect on psychiatric hospital admissions, suicides, or homicides. On the other
hand, researchers argue that this lack of relation does not preclude a lunar effect. It may
simply mean that the effect has not been adequately tested due to small sample sizes and
short sample time periods (Cyr and Kaplan 1987; Garzino 1982). Moreover, psychology
literature has focused mostly on trying to link the moon to extreme behavioral problems
in a few disturbed people, rather than less drastic lunar effect on human being in general.
By studying the relationship between lunar phases and asset prices, this paper also
extends psychological understanding of lunar effect on human behavior.
In addition, survey evidence suggests a wide belief in the lunar effect. A US
survey finds that 49.4% of the respondents believe in lunar phenomena (Rotton and Kelly
1985a). Interestingly, among psychiatric nurses, this percentage rises to 74% (Agus
1973). Vance (1995) reports a similar result as the earlier surveys. Danzl (1987) finds
survey evidence that eighty percent of the respondent emergency department nurses and
64% of the emergency physicians believe that the moon affects patients. Scientific
explanations have been proposed to account for the moon’s effect on the brain: sleep
deprivation, heavy nocturnal dew, tidal effect, weather patterns, magnetism and

11
polarization of the moon’s light (Raison, et al 1999; Kelley 1942; Katzeff, 1981, Szpir
1996).
Given the extensive documentation of the correlation between lunar phases and
human feelings, thoughts, and behaviors, more specifically, the correlation between full
moon periods and sleep deprivation, depressed mood, suicidal events, we hypothesize
that investors may value financial assets less during full moon periods than during new
moon periods due to the changes in mood associated with lunar conditions.5
In this paper, we study the relation between lunar phases and stock market returns
across countries. This study is not the first attempt to link lunar phases to stock returns.
Rotton and Kelly (1985) cite a working paper by Rotton and Rosenberg (1984) that
investigates the relation between lunar phases and Dow-Jones average closing prices.
They find no relation when they difference Dow-Jones index prices and correct for first-
order autocorrelations.6 Our study differs from their research. First, we examine returns
rather than prices. Second, we correct for heteroscedasticity and autocorrelations, thus
providing a more precise test for the relation. Most importantly, we examine a sample of
48 countries, which increases the power of tests.
Dichev and Janes (2001) also examine the effect of lunar phases on stock returns.
Their study is concurrent with, and independent of, our paper. Consistent with our
findings, Dichev and Janes (2001) report a significant lunar effect on stock returns using
a different sample of countries and a different time period. The findings of the two
5 We follow the evidence and argument in Hirshleifer and Shumway (2001) that good mood is associated with high asset returns. Since we assume that investors’ mood follows a sinusoidal model AND positive mood is associated with high asset returns, the hypothesis corresponds to a cycle in returns that meet its peak at new moon and its trough at the full moon. Following the same argument, the cycle in price levels (valuations) peaks one week after the new moon and bottoms out one week after the full moon.

12
papers complement each other. Dichev and Janes (2001) focus more on the US market
and use a longer time series of US stock returns. Our paper provides more global
evidence by including 48 countries with different levels of market development in the
sample. In addition, we control for contemporaneous correlation and heteroscedasticity
among country index returns and for autocorrelation within each country’s stock index
returns. Besides documenting return differences between the full moon and the new
moon phases, we find a cyclical pattern in stock returns that corresponds to lunar phases.
Beyond documenting the lunar effect, our paper examines other possible causes of such
an effect. Additional tests lead us to conclude that the lunar effect is unrelated to the
January effect, the day-of- week effect, the calendar month effect, and the holiday effect.
6 We are unable to obtain the working paper by Rotton and Rosenberg (1984) through extensive research. Our comments on the difference between their work and ours are based on the discussion provided in Rotton and Kelly (1985).

13
II. Data
To examine whether stock returns are correlated with lunar phases, we need a
lunar calendar and a sample of stock market returns. We obtain the lunar calendar from
United Sates Naval Observatory (USNO) website.7 This website provides a table that
documents the date and time (Greenwich Mean Time) of four phases of the Moon for the
period 1700 to 2015. The four phases are: new moon, first quarter, full moon and last
quarter. For the year 2000, the length of the mean synodic month (New Moon to New
Moon) is 29.53059 days.
We obtain our stock market information on returns and trading volumes through
Datastream. Our return sample consists of 48 countries listed in the Morgan Stanley
Capital International (MSCI) as developed markets or emerging markets. We use the
country indices calculated by Datastream (Datastream total market index) unless a
country does not have this Datastream series for at least five years. In the case of an
insufficient Datastream series, we collect other indices for the market from Datastream.
All returns are measured as nominal returns in local currencies. We also collect trading
volume data for 40 of the corresponding 48 stock indices. Eight of these 48 indices do
not have trading volume data in Datastream. We report summary statistics for the sample
in Table I.
7 http://aa.usno.navy.mil/AA/

14
III. Test Results
This section describes the empirical results of testing the hypothesis that stock
returns are associated with lunar phases. We first report test results using an equal-
weighted global portfolio of the 48 country stock indices. This set of results indicates the
significance of lunar effect on global stock returns.
We then report test results estimated country by country. It is not realistic to
expect many countries to have statistically significant results due to the large amount of
variation in daily stock returns and the relatively short time-series in our sample. To
increase the power of the test, we estimate joint tests using stock returns for the entire
panel of countries. We also report the joint test results for the following country
categorizations: G-7 countries, other developed countries, and emerging market
countries.
To better understand the lunar effect on stock returns, we further examine whether
such an effect is related to stock sizes and whether lunar phases are associated with
patterns in trading volumes and stock market volatility. We also investigate whether the
lunar effect is related to other calendar-related anomalies, such as the January effect, the
day-of-week effect, the calendar month effect and the holiday effect. We also check the
robustness of the lunar effect to random 30-day cycles, lunar holiday effects and outliers.8
8 Our test results are similar when we exclude the returns of the top and bottom 5 observations as outliers.

15
A. Lunar Effect on the Global Portfolio
Since lunar cycles are common everywhere across world, we estimate the
coefficient of the following regression for an equally-weighted global portfolio of 48
countries:9
Rt = α + β * Lunardummyt + et, (1)
where Lunardummy is a dummy variable indicating the phase of a lunar cycle,
specifically, the number of days around a full moon or a new moon. We define a full
moon period as N days before the full moon day + the full moon day + N days after the
full moon day (N = 3 or 7). Similarly, we define a new moon period as N days before
the new moon day + the new moon day + N days after the new moon day (N = 3 or 7).10
The Lunardummy variable takes on a value of one for a full moon period and zero
otherwise. The coefficient on this dummy variable indicates the difference between the
mean daily return during the full moon periods and that during the new moon periods.
In Table II, Panel A, we report the OLS estimates of β for the global portfolio
using different specifications of a full moon period: N = 3 and 7. The estimated βs
indicate the relation between lunar phases and stock returns. The mean daily return
difference between the new moon period and the full moon period is 4.34 basis points for
the 15-day window specification and 5.51 basis points for the 7-day window
specification. The above numbers translate into annualized return difference of 5.4
percent and 6.9 percent respectively. Under both model specifications, the return
difference is statistically significant at the 5 percent level.
9 At each point of time, we form the global portfolio using countries for which the return information is available. 10 In the case of the 15-day window, a new moon period can be less than 15 days since a lunar month may be less than 30 days. In these cases, the new moon period is defined as the remaining days of the lunar month.

16
To test explicitly for the cyclical pattern of the lunar effect, we next estimate a
sinusoidal model of continuous lunar impact. According to the model, the lunar effect
reaches its peak at the time of the full moon and declines to the trough at the time of the
new moon, following a cosine curve with a period of 29.53 days (the mean length of a
lunar cycle). More specifically, we estimate the following regression for the global
portfolio:
Rt = α + β * cosine(2πdt/29.53) + et (2)
where d is the number of days since the last full moon day and the β coefficient indicates
the association between stock returns and lunar cycles. We report the test result in Table
II, Panel A. Using this estimation, we find a negative relation (β = -2.97) between the
global stock returns and lunar cycles. The test result is statistically significant at the 1
percent level. Figure 1 displays this pattern by plotting the average daily stock returns on
the days of a lunar month for the global index and the estimated sinusoidal curve.
Overall, the sinusoidal model suggests that the lunar effect is cyclical.
In Table II, Panel B, we report the average lunar month return difference between
the full moon and the new moon periods based on the 15-day window. The annualized
return difference is -4.2 percent for the sample period; this difference is statistically
significant at the 5 percent level using the t-test and is significant at the 1 percent level
using Wilcoxon signed rank test. Figure 2 plots the average stock returns of full moon
periods versus new moon periods of the global portfolio.
In summary, we find global evidence on a significant correlation between stock
returns and lunar phases. We document that on average returns are higher in the new
moon periods than in the full moon periods.

17
B. Country-by-Country Tests
In this section, we report the regression results of model (1) and (2) for each
country:
Rit = αi + βi * Lunardummyt + eit, (3)
Rit = αi + βi * cosine(2πdt/29.53) + eit, (4)
In Tables III, IV and V, we report the OLS estimates of βi for each of the G-7
countries, other developed countries and emerging market countries, respectively. In
each table, we also report the results of different specifications of a full moon period: N =
3 and 7.
For the 15-day window, each of the G-7 and other developed countries displays a
negative β coefficient, suggesting that stock returns are, on average, lower around a full
moon in all these countries. For the G-7 countries, 1 of the coefficients is statistically
different from zero at the 5 percent significance level, and 4 of these coefficients are
statistically significant at the 10 percent level. For the 16 other developed countries, 2
have statistically significant coefficients at the 5 percent level, and 3 have statistically
significant coefficients at the 10 percent level. For the emerging market countries in
Table V, 20 out of these 25 countries have negative β estimates, and 3 of these estimates
are significantly different from zero at the 5 percent significance level. We find similar
results using the 7-day window.
Estimating the sinusoidal model of continuous and cyclical lunar impact for each
country, we find that all G-7 countries except Italy display a negative relation between
stock returns and lunar cycles, with 1 estimate significantly different from zero at the 5
percent significance level. Furthermore, we find that 15 of the 16 other developed

18
countries have negative signs, with 1 of these estimates significant at the 5 percent level.
Among the 25 emerging market countries, 21 have negative β estimates, with 4 of these
estimates significant at the 5 percent level.
It is not surprising to observe less statistically significant results using the
country-by-country approach due to the large amount of variation in each country’s daily
stock returns and the relatively short time-series in our sample. To fully utilize our cross-
sectional and time series data, we estimate a pooled regression with panel corrected
standard errors (PCSE):
Rit = αi + β * Lunardummyt + eit (5)
Rit = αi + β * cosine(2πdt/29.53) + eit (6)
The above PCSE specification adjusts for the contemporaneous correlation and
heteroscedasticity among country index returns as well as for the autocorrelation within
each country’s stock index return. Table VI presents regression results for G-7 countries,
other developed countries, emerging market countries, and all markets, respectively, for
the 15-day window specification, the 7-day window specification and the sinusoidal
model. Regardless of model specifications, the coefficients on the lunar dummy variable
are negative; 9 of the 12 coefficients are statistically significant at the 5 percent level.
Interestingly, the magnitude of the lunar effect is larger in the emerging market countries
(a 7.09 basis points daily difference for the 15-day window and a 13.35 basis points daily
difference for the 7-day window) than in the G-7 countries (a 3.47 basis points daily
difference for the 15-day window and a 2.6 basis points daily difference for the 7-day
window). The cosine regressions also show a higher coefficient for the emerging markets
than for the developed markets. Maturity of the stock market and the percentage of

19
institutional investors may help explain the differences in the magnitude of lunar impact
in these markets. 11
In summary, we find that stock returns for the 48 countries are 6.6 percent lower
during the 15-day full moon periods than those during new moon periods on an annual
basis. The cosine regression for all markets also indicates a significant relation between
stock returns and lunar cycles.
C. The Lunar Effect on Returns of Large Cap vs. Small Cap Stocks
In this section, we examine whether lunar effects are related to stock
capitalization. This test is motivated by the empirical finding that institutional ownership
is positively correlated with stock capitalization. Specifically, large capitalization stocks
have a higher percentage of institutional ownership than small capitalization stocks.
Since investment decisions of individual investors are more likely to be affected by
sentiments and mood than those of institutional investors, we expect the lunar effect to be
more pronounced in the pricing of small-cap stocks.
To assess the relation between lunar phases and stock capitalization, we form 10
stock portfolios based on market capitalization for stocks traded on NYSE +AMEX,
NASDAQ, and NYSE+AMEX+NASDAQ, respectively. We estimate Equation (3) for
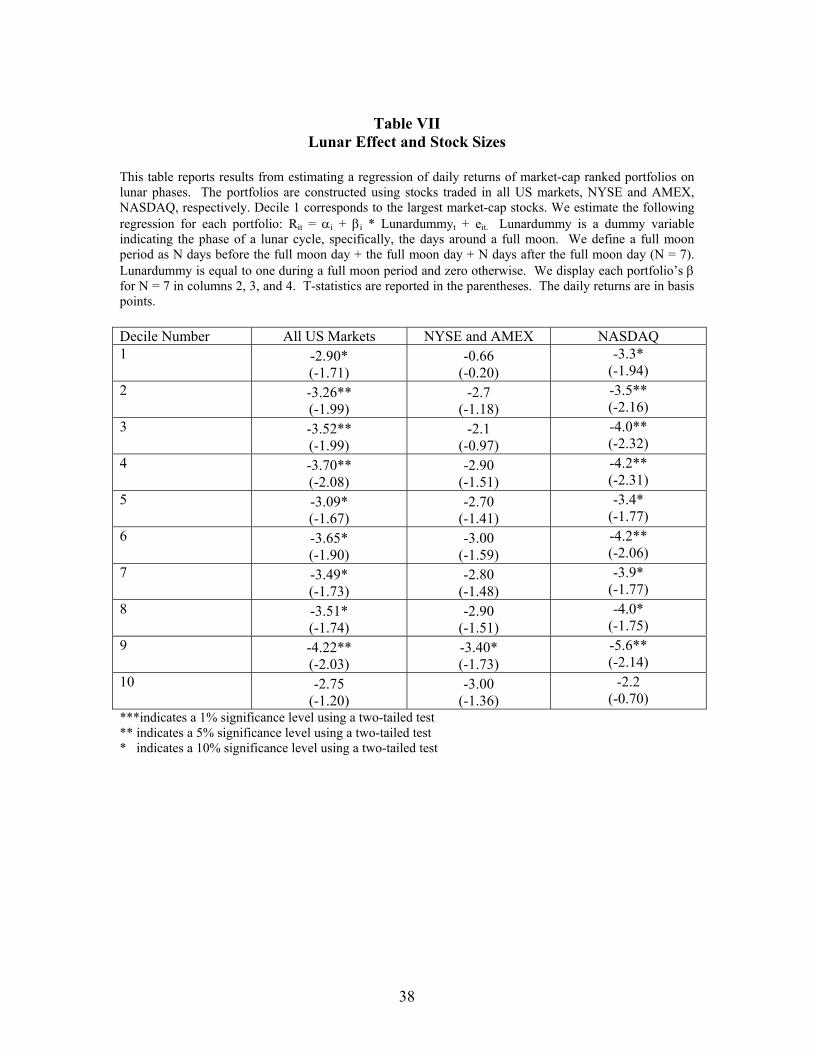
each portfolio. The results in Table VII indicate that the lunar effect has the largest
impact on the 9thdecile12 (the second-smallest) with a coefficient of –4.22 and the
11 Stock markets in emerging market countries in general are less mature, which may magnify the effect of behavioral biases on stock prices. For example, there is a smaller presence of institutional investors in these markets. Institutional investors tend to invest according to some mechanical rules rather than impulses; hence, their involvement should reduce the lunar effect on stock prices. 12 Liquidity is likely to have a first-order effect in pricing extreme small stocks rather than mood, and hence, we expect a weaker lunar effect for stocks that are extremely small in capitalization.

20
smallest impact on the 1st decile (the largest) with a coefficient of –2.9. Tests of market-
cap ranked portfolios using stocks traded on NYSE, AMEX and NASDAQ yield similar
results. Overall, the test results are consistent with our hypothesis that stocks with more
individual investor ownership display a stronger lunar effect and thus provide further
evidence that mood or sentiment affects asset prices.
D. The Lunar Effect on Trading Volume
In this section, we investigate whether the observed lunar effect is related to
trading volumes by estimating the coefficients of the following regressions for each
country for the 15-day full moon window:
normvolumeit = αi + λi * Lunardummyt + eit. (7)
where normvolume is daily trading volume normalized by average daily volume in the
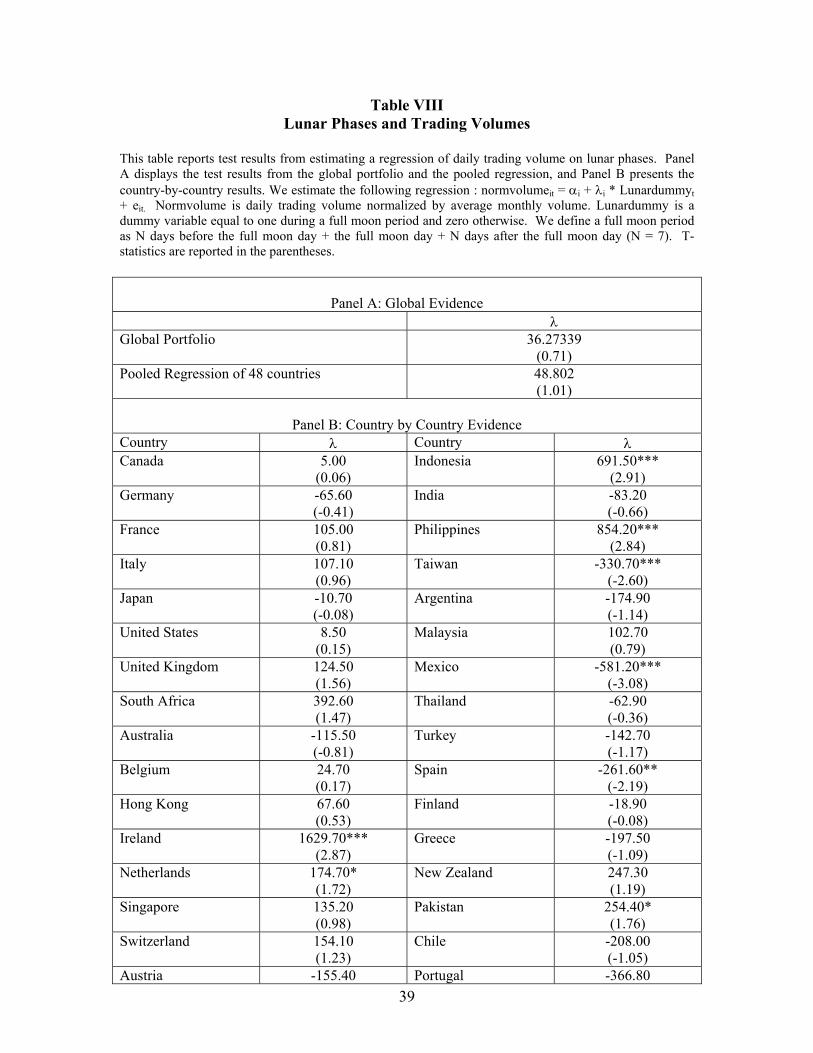
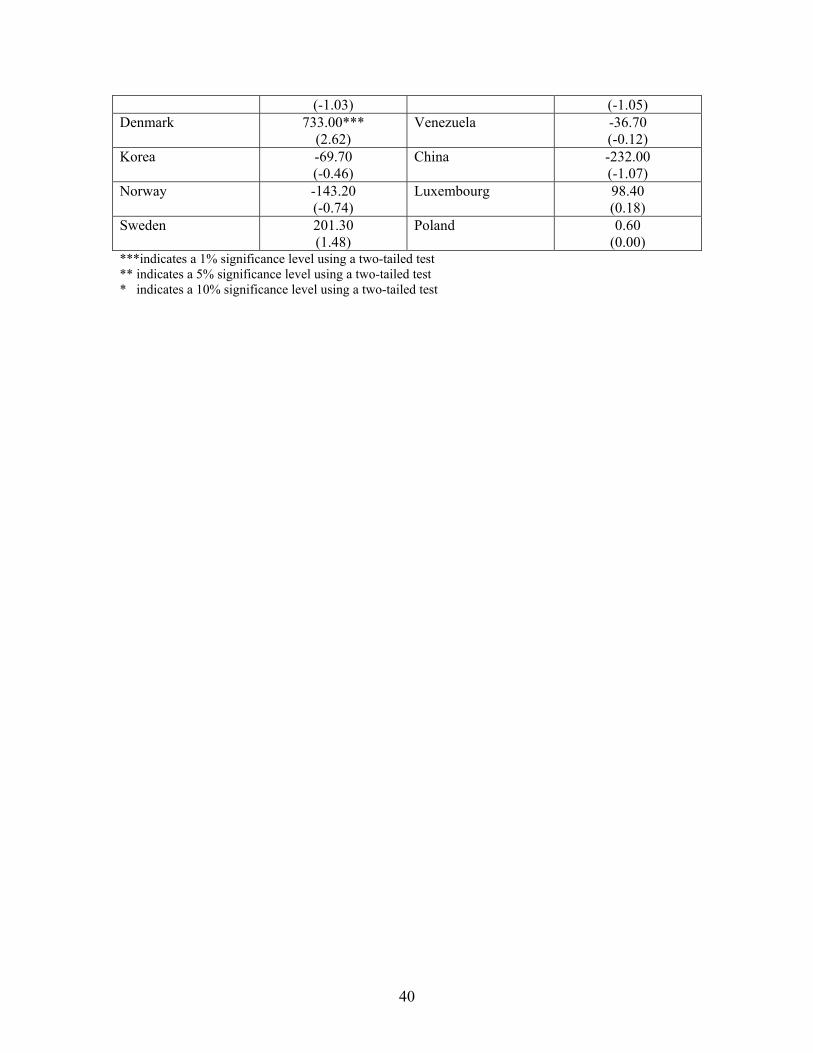
month. Test results are reported in Table VIII. 20 out of 40 countries have higher
trading volumes during full moon periods; 4 of the 20 positive coefficients are
statistically significant at the 5 percent level; 3 of the 20 negative coefficients are
statistically significant at the 5 percent level. The coefficient on the lunar dummy is
positive but not significant for the global portfolio as well as the pooled regression of 48
countries. Thus, there is little evidence that trading volumes are related to lunar phases in
a systematic manner. Therefore, it is unlikely that the lunar effect observed in stock
returns is due to patterns in trading volume that are related to lunar phases.

21
E. Lunar Cycles and Stock Market Volatility
In this section, we examine whether the observed lunar effect is related to stock
market volatility by estimating the coefficients of the following regressions for each
country for the 15-day full moon window:
Volatilityit = αi + λi * Lunardummyt + eit. (8)
where volatility is the standard deviation of daily stock returns in each 15-day full moon
period and each 15-day new moon period for a lunar month. We report the test results in
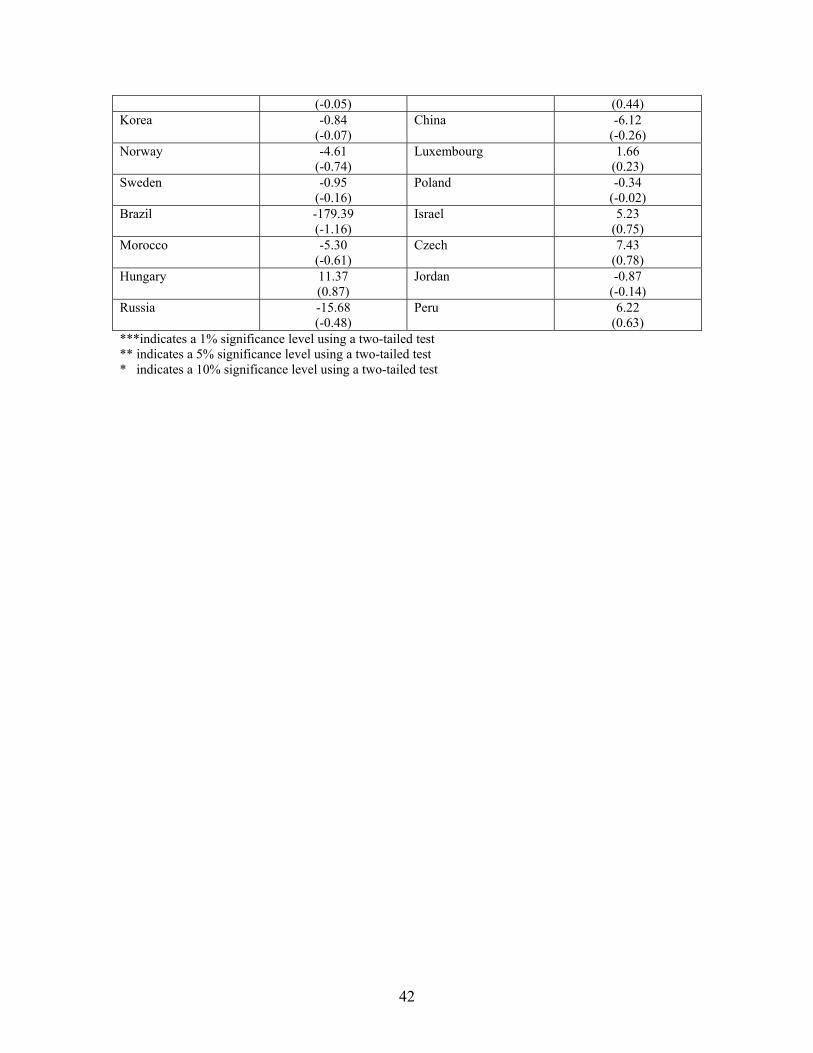
Table IX. As we observe, the coefficient on the lunar dummy of the global portfolio and
the pooled regression is positive but not significant. Moreover, none of the 48 country
lunardummy coefficients is significant. Thus, we find little evidence that volatilities are
related to lunar phases in a systematic manner. As a result, the lunar effect observed in
stock returns is not due to risk differentials between the full moon and the new moon
periods.
F. The Lunar Effect is not a Manifestation of Other Calendar Anomalies
The empirical results reported in Subsections A and B suggest that significantly
different returns accrue to stocks during full moon vs. new moon periods. This section
evaluates possible causes for these return differences other than lunar effects.
January Effect
The lunar effect found in this study is based on a measure of lunar phases using a
lunar calendar. This effect is unlikely to be caused by the January effect13, as lunar
months do not correspond to calendar months. To test for the relation of our results and
13 The January effect has been documented by Rozeff and Kinney (1976) and Reinganum (1983).

22
the January effect, we add a January dummy variable to our regression estimates of
Equations (1) to (2). More specifically, we estimate the following equations for the
global portfolio:
Rt = α + β * Lunardummyt + δ * Januarydummyt + et . (9)
Rt = α + β * cosine(2πd/29.53) + δ * Januarydummyt + et, (10)
where Januarydummy is a dummy variable equal to one in the month of January and zero
otherwise.
As shown in column two of Table X, the January effect is extremely strong across
all regressions and so is the lunar effect. Comparing these results with the findings for
equations that do not control for the January effect (column one), we find that the
magnitude and the significance of the lunar effect remain remarkably unchanged for the
different model specifications. The test result thus indicates that the January effect is not
a driving force behind the observed lunar effect.
Day-of-Week Effect
If most full moon days fall on Monday, it is possible that the Monday effect may
explain the observed lunar effect. We tabulate our sample to check on this possibility.
Figure 3 shows that full moon days fall evenly on each day of the week in the sample.
Hence, we conclude that the lunar effect on stock returns is not related to the Monday
effect.
Calendar Month Effect
Ariel (1987) documents a calendar month effect on stock returns. More
specifically, he shows that the mean US stock return for days during the first half of a
calendar month is higher than the mean stock return during the second half of the month.

23
Thus, it is conceivable that the lunar effect shown in this paper may be a manifestation of
this calendar month effect. To test for this possibility, we include a calendar dummy in
Equations (1) and estimate the following regression using the global portfolio:
Rt = α + β * Lunardummyt + δ *calendardummyt + et, (11)
where Calendardummy is a dummy variable equal to one for the first half of a calendar
month and zero otherwise. As shown in the third column of Table X, the calendar month
effect is not significant for the global portfolio during our sample period. Nevertheless,
the magnitude and significance of the Lunardummy coefficient is highly consistent with
our earlier finding. For all panels, the lunar effect is statistically significant at the 5
percent level. These test statistics suggest that the calendar month effect cannot explain
the observed lunar effect.
Holiday Effect
Ariel (1990) documents that, on the trading day prior to holidays, stocks advance
with disproportionate frequency and show high mean returns averaging nine to fourteen
times the mean return for the remaining days of the year. To examine the relation
between the observed lunar effect and the holiday effect, we exclude the day before
holidays for each country when we construct our global portfolio. We estimate equation
(1) using the holiday adjusted global index returns. As reported in column four of Table
X, the lunar effect is unchanged and remains significant at one percent level. Thus, lunar
effect does not appear to be related to holidays.
Lunar Holidays
Frieder and Subrahmanyam (2002) document that Jewish holidays have a
significant impact on U.S. equity market. Specifically, they find that returns are

24
significantly positive around Rosh HaShanah and significantly negative around Yom
Kippur. We check the robustness of our lunar cycle effect by including a lunar holiday
dummy because many Jewish, Islamic, Hindu, Chinese and Korean holidays fall on the
fixed days of a lunar based calendar.
We present the test results in Table XI. First, we report the country level
regressions where we include the relevant country lunar holiday dummy. Interestingly,
we find that the Jewish holiday dummies are statistically significant for the U.S. and the
Israeli markets while the lunar holiday dummies for other countries are not significantly
different from zero. Our results are consistent with the findings for the U.S. stock market
in Frieder and Subrahmanyam (2002). For both the U.S. and Israeli market, we find that
returns are lower around Yom Kippur and higher around Rosh HaShanah. However, the
coefficients on the lunar dummies do not change much when we include the lunar holiday
dummies, indicating that the Jewish holiday effect is probably independent of the lunar
cycle effect. The test results are similar when we include the holiday (non-lunar)
dummies.
In the last column, we examine the impact of Jewish holidays on the global
portfolio by including the Jewish holiday dummies in Equation (1). We find that the
coefficient on Yom Kippur is significant and the coefficient on Rosh HaShanah is close
to zero. Similar to our earlier results, the coefficient on the lunar dummy is 0.413 and
significant at the one percent level. Our results suggest that Yom Kippur seems to have a
negative impact on the returns of the global portfolio. Nevertheless, the lunar cycle effect
is independent of the Jewish holiday effect.

25
30-day Cycle Effect
To test whether the observed lunar effect in this study reflects a general pattern in
stock returns, rather than a lunar-driven cycle, we shift the lunar phase by 1 to 29 days (as
the average length of a lunar month is 29.53 days). That is, we start a 30-day cycle 1 to
29 days after the first full moon, and estimate the 30-day cycle effect for each
specification, using the following PCSE regression with a 15-day window:
Rit = αi + β * 30daydummyt + eit (12)
where 30daydummy is a dummy variable indicating the phase of a 30-day cycle.
30daydummy takes on a value of one for 7 days before the starting day + the starting day
+ 7 days after the starting day, and a value of zero otherwise.
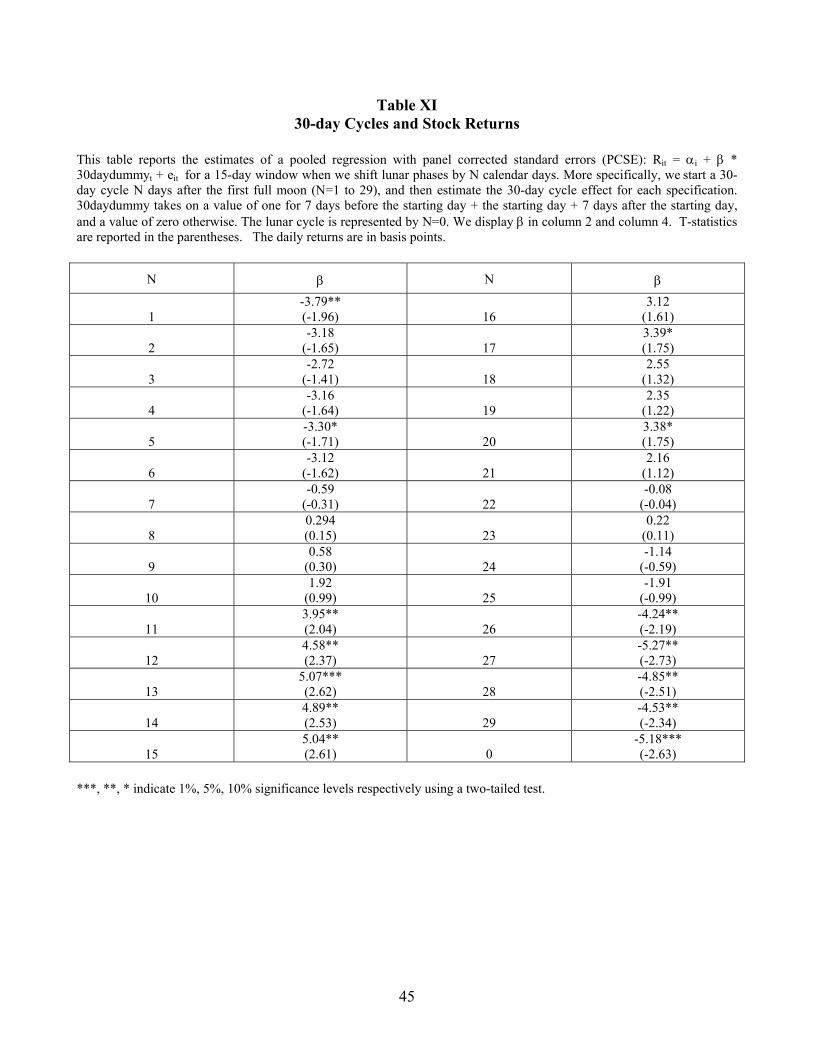
The results in Table XII suggest that the 30-day cycle effects for the cycles
starting 1 to 7 days after the full moon and the cycles starting 24 to 29 days after the full
moon have negative signs. Moreover, the statistical significance of the estimated 30-day
cycle effect declines as these 30-day cycles deviate more from the lunar cycle. In fact, for
the cycles starting 11 to 20 days after the full moon, the pattern is reversed. Figure 4
graphs the estimates of the 30-day cycle effect and shows that the documented lunar
effect cannot arise from any 30-day cycles except for the ones that closely track the lunar
cycle.
After evaluating possible explanations for our results, we conclude that the lunar
effect on stock returns is independent of other calendar-related anomalies, such as the
January effect, the day-of-week effect, the calendar month effect, and the holiday effect.
Our results are also robust to the lunar holiday and the non-lunar 30-day cycle
explanations.

26
IV. Conclusion
This paper investigates the relation between lunar phases and stock returns for a
sample of 48 countries. We find strong global evidence that stock returns are lower on
days around a full moon than on days around a new moon. Constructing a lunar trading
strategy, we find that the magnitude of this return difference is roughly 4.2 percent per
annum. Since lunar phases are likely to be related to investor mood and are not related to
economic activities, our findings are thus not consistent with the predictions of traditional
asset pricing theories that assume fully rational investors. The positive association we
find between lunar phases and stock returns suggests that it might be valuable to go
beyond a rational asset pricing framework to explore the psychological effects of investor
behavior on stock returns.
Psychology literature has provided numerous theories on how mood affects
perceptions and preferences. One theory is that mood affects perception through
misattribution: attributing feelings to wrong sources leads to incorrect judgements (Frijda
1988; Schwarz and Clore 1983). Alternatively, mood may affect people’s ability to
process information. In particular, investors may react to salient or irrelevant information
when feeling good (Schwarz 1990; Schwarz and Bless 1991). Finally, mood may affect
preferences (Loewenstein 1996; Mehra and Sah 2000). This paper is only a first step
towards confirming the effect of mood on asset prices. It would be interesting to better
understand how mood affects asset prices. In his survey paper, Hirshleifer (2001) pointed
out that one area of future research is to conduct experimental testing of behavioral
hypotheses. In a related vein, future work can examine asset market experiments that

27
manipulate mood. For example, is trading behavior in experimental markets different
when the markets are staged at different parts of the lunar cycle?

28
References
Ariel, Robert A., 1990, High stock returns before holidays: existence and evidence on possible causes, Journal of Finance 45, 1611-1626.Ariel, Robert A., 1987, A monthly effect in stock returns, Journal of Financial Economics 18, 161-174. Agus, M.D. ,1973, The rejection of two explanations of belief in a lunar influence on behavior, Unpublished master’s thesis, Simon Fraser University, Burnaby, British Columbia, Canada. Avery, C. and J. Chevalier, 1999, Identifying investor sentiment from price paths: The case of football betting, Journal of Business 72, 493-521. Campbell, D.E. and Beets, J.L., 1978, Lunacy and the moon, Psychological Bulletin 85, 1123-1129. Coval, Joshua D. and Shumway, Tyler, 2001, Do behavioral biases affect prices? Working paper, University of Michigan. Criss, Thomas B. and Marcum, John P., 1981, A lunar effect on fertility, Social Biology, 28, 75-80. Cyr, J.J., and Kaplan, R.A., 1987, The lunar-lunacy relationship: a poorly evaluated hypothesis, Psychological Reports 62, 683-710. Danzl, DF, 1987, Lunacy, Journal of Emergency Medicine. 5(2): 91-5. De Castro, John M. and Pearcey, Sharon M., 1995, Lunar rhythms of the mean and alcohol intake of humans, Physiology & Behavior, 57, 439-444. Dichev, Ilia D. and Janes Troy D, 2001, Lunar cycle effects in stock returns, Working paper, University of Michigan. Frieder, Laura and A. Subrahmanyam, 2002, Non-secular regularities in stock returns: the impact of the high holy days on the U.S. equity market, working paper, UCLA. Frijda, N., 1988, The laws of emotion, Cognition and Emotion 1, 235-258. Garzino, S.J. , 1982, Lunar effects on mental behavior: a defense of the empirical research, Environment and Behavior 14, 395-417. Hicks-Caskey and Potter, 1992, Weekends and holidays and acting-out behavior of developmentally delayed women: a reply to Dr. Mark Flynn, Perceptual & Motor Skills 74(2): 344-6.

29
Hirshleifer, David and Shumway, Tyler, 2001, Good day sunshine: Stock returns and the weather, forthcoming, Journal of Finance. Hirshleifer, David, 2001, Investor psychology and asset pricing, Journal of Finance, 56(4), August (2001):1533-1598. Kamstra, Mark J., Kramer, Lisa A., and Levi, Marice D., 2000, Losing sleep at the market: The daylight-savings anomaly, American Economic Review 12, 1000-1005. Kamstra, Mark. J., Kramer, Lisa A., and Levi, Marice D., 2001, Winter blues: Seasonal affective disorder (SAD) and stock market returns, Working paper, University of British Columbia. Katzeff, K., 1981, Moon madness, Citadel Press, Secaucus, N.J. Harlow, W. V. and Brown, 1990, “Understanding and Assessing Financial Risk Tolerance: A Biological Perspective,” Financial Analysts Journal 46, 50-62. Kelley, D.M., 1942, Mania and the moon, Psychoanalytic Review 9, 406-426. Law, SP, 1986, The regulation of menstrual cycle and its relationship to the moon. Acta Obstet Gynecol Scand 65, 45-48. Liber, Arnold, 1978, Human aggression and lunar synodic cycle, Journal of Clinical Psychiatry 39 (5): 385. Loewenstein G.F., 2000, Emotion in economic theory and economic behavior, American Economic Review, 65, 426-432. Mehra, R. and R. Sah, 2000, Mood, projection bias and equity market volatility, Working paper, University of California, Santa Barbara. Odean, Terence, 1998, Are investors reluctant to realize their losses? Journal of Finance 53, 1775-1798. Odean, Terence, 1999, Do investors trade too much? American Economic Review 89, 1279-1298. Neal, Richard D. and Colledge, Malcolm, 2000, The effect of the full moon on general practice consultation rates, Family Practice 17(6), 472-474. Raison, Charles L., Klein, Haven M., and Steckler, Morgan, 1999, The moon and madness reconsidered, Journal of Affective Disorders 53, 99-106.

30
Reinganum, Marc, 1983, The anomalous stock market behavior of small firms in January: Empirical test for tax-loss selling effects, Journal of Financial Economics 12: 89-104. Rotton, James and Kelly, I. W., 1985a., A scale for assessing belief in lunar effects: reliability and concurrent validity, Psychological Reports 57, 239-245. Rotton, James and Kelly, I. W., 1985b, Much ado about the full moon: a meta-analysis of lunar-lunacy research, Psychological Bulletin 97, 286-306. Rozeff, Michael and William Kinney, Jr., 1976, Capital market seasonality: The case of stock returns, Journal of Financial Economics 3, 379-402. Sands, JM and LE Miller, 1991, Effects of moon phase and other temporal variables on absenteeism, Psychological Reports. 69(3 Pt 1):959-62. Saunders, E.M.J., 1993, Stock prices and Wall Street weather, American Economic Review 83, 1337-1345. Schwarz, N., 1990, Feelings as informational and motivational functions of affective states, in R. Sorrentino, and E.T. Higgins, ed.: Handbook of Motivation and Cognition 2, 527-561 (Guilford Press, New York). Schwarz, N., and H. Bless, 1991, Happy and mindless, but sad and smart? The impact of affective states on analytic reasoning, in J. Forgas, ed.: Emotion and Social Judgments, 55-71 (Pergamon, Oxford). Schwarz, N. and G.L. Clore, 1983, Mood, misattribution, judgments of well-being: Informative and directive functions of affective states, Journal of Personality and Social Psychology 45, 513-523. Szpir, Michael, 1996, Lunar phases and climatic puzzles, American Scientist, 86, 119-120. Tasso J. and Miller, E., 1976, Effects of full moon on human-behavior, Journal of Psychology 93(1), 81-83. Templer DI. And DM Veleber, 1980, The moon and madness: a comprehensive perspective, Journal of Clinical Psychology. 36(4): 865-8. Vance, DE, 1995, Belief in lunar effects on human behavior, Psychological Reports 76(1): 32-4. Weiskott, G.N., 1974, Moon phases and telephone counseling calls, Psychological Reports 35 (2): 752-754.

31
Table I Summary Statistics
This table reports the summary statistics for the 48 country stock indices. All sample periods end on July 31, 2001. Country Code Starting
Date Number of Observations
Mean Daily Return
StdDev of Daily Return
ARGENTINA TOTMKAR 1/88 3510 0.00350 0.03672 AUSTRALIA TOTMKAU 1/73 7213 0.00040 0.01104 AUSTRIA TOTMKOE 1/74 6355 0.00029 0.00859 BELGIUM TOTMKBG 1/73 7124 0.00033 0.00821 BRAZIL BRBOVES 1/72 2475 0.00790 0.07093 CANADA TOTMKCN 1/73 7226 0.00033 0.00839 CHILE TOTMKCL 7/89 3013 0.00087 0.01034 CHINA TOTMKCH 1/91 2443 0.00157 0.02994 CZECH CZPX50I 4/94 1750 -0.00047 0.01270 DENMARK TOTMKDK 1/74 6377 0.00059 0.01089 FINLAND TOTMKFN 1/88 3339 0.00071 0.01834 FRANCE TOTMKFR 1/73 7264 0.00048 0.01111 GERMANY TOTMKBD 1/73 7192 0.00032 0.00950 GREECE TOTMKGR 1/88 3385 0.00097 0.01919 HONG KONG TOTMKHK 1/73 7103 0.00058 0.01895 HUNGARY BUXINDX 2/91 2629 0.00087 0.01761 INDIA IBOMBSE 4/84 2903 0.00081 0.01894 INDONESIA TOTMKID 4/84 2761 0.00020 0.02598 IRELAND TOTMKIR 1/73 7103 0.00053 0.01087 ISRAEL ISTGNRL 1/84 4179 0.00153 0.01438 ITALY TOTMKIT 1/73 7445 0.00052 0.01341 JAPAN TOTMKJP 1/73 7145 0.00023 0.01013 JORDAN AMMANFM 11/88 2176 0.00031 0.00863 KOREA TOTMKKO 1/75 3322 0.00032 0.02083 LUXEMBURG TOTMKLX 1/92 2370 0.00062 0.01005 MALAYSIA TOTMKMY 1/88 3349 0.00049 0.01652 MEXICO TOTMKMX 1/88 3436 0.00132 0.01715 MOROCCO MDCFG25 12/87 1820 0.00124 0.00930 NETHERLAND TOTMKNL 1/73 7219 0.00040 0.00957 NEW ZEALAN TOTMKNZ 1/88 3409 0.00024 0.01147 NORWAY TOTMKNW 1/80 5419 0.00050 0.01419 PAKISTAN PKSE100 12/88 2795 0.00040 0.01628 PERU PEGENRL 1/91 2597 0.00165 0.01591 PHILIPPINES TOTMKPH 9/87 3464 0.00061 0.01553 POLAND TOTMKPO 1/94 1803 0.00006 0.02317 PORTUGAL TOTMKPT 1/90 2858 0.00022 0.00932 RUSSIA RSMTIND 9/94 1676 0.00257 0.03684 SINGAPORE TOTMKSG 1/73 7128 0.00022 0.01443 SOUTH AFRICA TOTMKSA 1/73 7170 0.00065 0.01353 SPAIN TOTMKES 1/88 3623 0.00040 0.01158 SWEDEN TOTMKSD 1/82 4903 0.00070 0.01348 SWITZ TOTMKSW 1/73 7174 0.00032 0.00848 TAIWAN TOTMKTA 9/87 3371 0.00044 0.02235 THAILAND TOTMKTH 1/88 3349 0.00041 0.02012 TURKEY TOTMKTK 1/88 3467 0.00258 0.02995 UNITED KINGDOM TOTMKUK 1/65 8503 0.00048 0.01029 UNITED STATES TOTMKUS 1/73 7216 0.00037 0.00982 VENEZUELA TOTMKVE 1/90 2829 0.00159 0.02525

32
Table II Lunar Phases and Stock Returns: A Global Portfolio
Panel A reports regression results from estimating the relation between daily stock returns and lunar phases. We estimate the following regression for the global portfolio: Rt = α + β * Lunardummyt + et. Lunardummy is a dummy variable indicating the phase of a lunar cycle, specifically, the days around a full moon. We define a full moon period as N days before the full moon day + the full moon day + N days after the full moon day (N = 3 or 7). Lunardummy is equal to one during a full moon period and zero otherwise. In column 3, we report the β coefficient for the following regression: Rt = α + β * cosine(2πdt/29.53) + et, where d is the number of days since the last full moon. Panel B reports the average lunar month return difference between the full moon and the new moon periods. T-statistics are reported in the parentheses. The daily returns are in basis points.
Panel A: Regression Analysis 15-day Window 7-day Window Cosine
-4.34*** (-3.19)
-5.51*** (-2.70)
-2.97*** (-3.09)
Panel B: Average Monthly Return Difference between the Full Moon and the New
Moon Periods based on the 15-day Window
Mean Lunar Month Return Difference -35.09** (-2.32)
Signed-Rank Test (P-value)
0.0009
Number of Lunar Month with Positive Return Difference
258
Number of Lunar Month with Negative Return Difference
144
***indicates a 1% significance level using a two-tailed test ** indicates a 5% significance level using a two-tailed test * indicates a 10% significance level using a two-tailed test

33
Table III Lunar Phases and Stock Returns: G-7 Countries
This table reports country-by-country results from estimating regressions of daily stock returns on lunar phases. We first estimate the following regression for each country: Rit = αi + βi * Lunardummyt + eit. Lunardummy is a dummy variable indicating the phase of a lunar cycle, specifically, the days around a full moon or a new moon. We define a full moon period as N days before the full moon day + the full moon day + N days after the full moon day (N = 3 or 7). Accordingly, we define a new moon period as N days before the new moon day + the new moon day + N days after the new moon day (N = 3 or 7). Lunardummy is equal to one during a full moon period and zero otherwise. We display the country β’s for N =3 and N = 7 in columns 2 and 3, respectively. In column 4, we report the β coefficient for the following regression: Rit = αi + βi * cosine(2πd/29.53) + eit, where d is the number of days since the last full moon. T-statistics are reported in the parentheses. The daily returns are in basis points.
7-Day Window
N = 3 15-Day Window
N = 7 Cosine
Regression CANADA -3.58
(-1.22) -3.87** (-1.96)
-1.70 (-1.22)
FRANCE -1.24 (-0.33)
-3.46 (-1.33)
-1.46 (-0.79)
GERMANY -4.43 (-1.34)
-3.77* (-1.68)
-2.50 (-1.57)
ITALY 3.23 (0.70)
-1.38 (-0.45)
0.00 (0.00)
JAPAN -7.92** (-2.22)
-4.60 (-1.92)*
-3.43** (-2.02)
UK -0.01 (0.00)
-3.85 (-1.72)*
-1.80 (-1.10)
US (1973-2001) -4.52 (-1.32)
-2.70 (-1.18)
-1.07 (-0.62)
***indicates a 1% significance level using a two-tailed test ** indicates a 5% significance level using a two-tailed test * indicates a 10% significance level using a two-tailed test
34
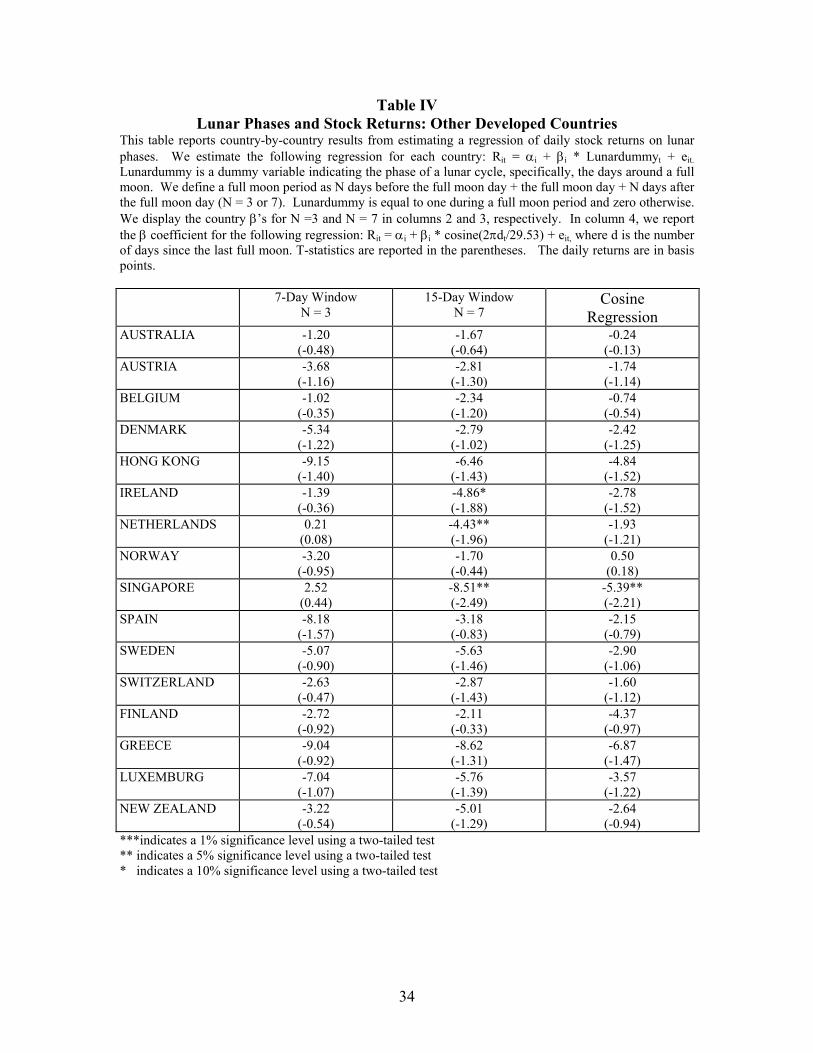
Table IV Lunar Phases and Stock Returns: Other Developed Countries
This table reports country-by-country results from estimating a regression of daily stock returns on lunar phases. We estimate the following regression for each country: Rit = αi + βi * Lunardummyt + eit. Lunardummy is a dummy variable indicating the phase of a lunar cycle, specifically, the days around a full moon. We define a full moon period as N days before the full moon day + the full moon day + N days after the full moon day (N = 3 or 7). Lunardummy is equal to one during a full moon period and zero otherwise. We display the country β’s for N =3 and N = 7 in columns 2 and 3, respectively. In column 4, we report the β coefficient for the following regression: Rit = αi + βi * cosine(2πdt/29.53) + eit, where d is the number of days since the last full moon. T-statistics are reported in the parentheses. The daily returns are in basis points. 7-Day Window
N = 3 15-Day Window
N = 7 Cosine
Regression AUSTRALIA -1.20
(-0.48) -1.67
(-0.64) -0.24
(-0.13) AUSTRIA -3.68
(-1.16) -2.81
(-1.30) -1.74
(-1.14) BELGIUM -1.02
(-0.35) -2.34
(-1.20) -0.74
(-0.54) DENMARK -5.34
(-1.22) -2.79
(-1.02) -2.42
(-1.25) HONG KONG -9.15
(-1.40) -6.46
(-1.43) -4.84
(-1.52) IRELAND -1.39
(-0.36) -4.86* (-1.88)
-2.78 (-1.52)
NETHERLANDS 0.21 (0.08)
-4.43** (-1.96)
-1.93 (-1.21)
NORWAY -3.20 (-0.95)
-1.70 (-0.44)
0.50 (0.18)
SINGAPORE 2.52 (0.44)
-8.51** (-2.49)
-5.39** (-2.21)
SPAIN -8.18 (-1.57)
-3.18 (-0.83)
-2.15 (-0.79)
SWEDEN -5.07 (-0.90)
-5.63 (-1.46)
-2.90 (-1.06)
SWITZERLAND -2.63 (-0.47)
-2.87 (-1.43)
-1.60 (-1.12)
FINLAND -2.72 (-0.92)
-2.11 (-0.33)
-4.37 (-0.97)
GREECE -9.04 (-0.92)
-8.62 (-1.31)
-6.87 (-1.47)
LUXEMBURG -7.04 (-1.07)
-5.76 (-1.39)
-3.57 (-1.22)
NEW ZEALAND -3.22 (-0.54)
-5.01 (-1.29)
-2.64 (-0.94)
***indicates a 1% significance level using a two-tailed test ** indicates a 5% significance level using a two-tailed test * indicates a 10% significance level using a two-tailed test

35
Table V Lunar Phases and Stock Returns: Emerging Market Countries
This table reports country-by-country results from estimating a regression of daily stock returns on lunar phases. We estimate the following regression for each country: Rit = αi + βi * Lunardummyt + eit. Lunardummy is a dummy variable indicating the phase of a lunar cycle, specifically, the days around a full moon. We define a full moon period as N days before the full moon day + the full moon day + N days after the full moon day (N = 3 or 7). Lunardummy is equal to one during a full moon period and zero otherwise. We display the country β’s for N =3 and N = 7 in columns 2 and 3, respectively. In column 4, we report the β coefficient for the following regression: Rit = αi + βi * cosine(2πdt/29.53) + eit where d is the number of days since the last full moon. T-statistics are reported in the parentheses. The daily returns are in basis points.

36
7 Day Window N = 3
15 Day Window N = 7
Cosine Regression
ARGENTINA -24.93 (-1.31)
-20.37 (-1.64)
-12.4 (-1.41)
BRAZIL -92.60* (-1.86)
-29.85 (-1.46)
-27.3 (-1.35)
CHILE -19.06*** (-3.48)
-6.48* (-1.72)
-6.71** (-2.52)
CHINA -14.70 (-0.82)
-9.61 (-0.79)
-10.22 (-1.19)
CZECH 2.70 (0.31)
3.96 (0.65)
2.28 (0.53)
HUNGARY -1.97 (-0.19)
10.22 (1.49)
3.03 (0.62)
INDIA -9.12 (-0.91)
-8.41 (-1.20)
-7.03 (-1.40)
INDONESIA -33.32*** (-2.80)
-19.60** (-1.98)
-16.8** (-2.38)
ISRAEL -10.82 (-1.62)
-17.98 (-1.60)
-6.78** (-2.16)
JORDAN 2.32 (0.45)
-1.25 (-0.34)
0.06 (0.21)
MALAYSIA 0.90 (0.10)
-7.43 (-1.30)
-1.16 (-0.28)
MEXICO 0.90 (0.10)
-14.27** (-2.44)
-9.98** (-2.41)
MOROCCO -0.10 (-0.02)
-1.40 (-0.32)
-0.85 (-0.27)
PAKISTAN -6.99 (-0.82)
-1.25 (-0.20)
-2.27 (-0.52)
PERU 8.99 (1.02)
-4.88 (-0.78)
-1.73 (-0.39)
PHILIPPINES -6.39 (-0.82)
-1.80 (-0.34)
-1.63 (-0.43)
POLAND -15.91 (-1.04)
0.99 (0.09)
-3.39 (-0.44)
PORTUGAL -3.89 (-0.76)
-7.74** (-2.22)
-4.71* (-1.91)
RUSSIA -53.16** (-2.13)
-19.33 (-1.07)
-22.00* (-1.73)
SOUTH AFRICA -0.56 (-0.12)
-1.84 (-0.57)
-1.70 (-0.75)
SOUTH KOREA -14.63 (-1.40)
1.92 (0.27)
-4.56 (-0.89)
TAIWAN -3.12 (-0.28)
-5.43 (-0.71)
-1.98 (-0.36)
THAILAND -5.19 (-0.52)
-2.45 (-0.35)
-2.13 (-0.43)
TURKEY -29.36** (-2.02)
-13.05 (-1.28)
-13.89* (-1.92)
VENEZUELA -4.97 (-0.38)
2.22 (0.23)
2.89 (0.43)
***, **, * indicate 1%, 5%, 10% significance levels using a two-tailed test

37
Table VI Lunar Phases and Stock Returns: Joint Tests
Panels A and B report the estimates of a pooled regression with panel corrected standard errors (PCSE): Rit = αi + β * Lunardummyt + eit for the 7-day window and 15-day window, respectively. The PCSE specification adjusts for the contemporaneous correlation and heteroscedasticity among country indices and for the autocorrelation within each country’s stock index14. Panel C reports the β coefficient for the following regression: Rit = αi + βi * cosine(2πdt/29.53) + eit, where d is the number of days since the last full moon. T-statistics are reported in the parentheses. The daily returns are in basis points.
Panel A: 7-day window
Panel (PCSE)
G7 -2.60 (-1.14)
Other Developed Markets -3.75 (-1.47)
Emerging Markets -13.35*** (-3.55)
All Markets -6.80*** (-2.61)
Panel B: 15-day window
Panel (PCSE)
G7
-3.47** (-2.2)
Other Developed Markets
-4.38** (-2.38)
Emerging Markets
-7.09** (-2.42)
All Markets
-5.18*** (-2.63)
Panel C: Cosine regressions
Panel (PCSE)
G7 -1.75* (-1.56)
Other Developed Markets -2.69** (-2.05)
Emerging Markets -6.24*** (-3.08)
All Markets -3.69*** (-2.76)
***indicates a 1% significance level using a two-tailed test ** indicates a 5% significance level using a two-tailed test * indicates a 10% significance level using a two-tailed test
14 We do not adjust for autocorrelation in stock returns in the 7-day window case.
38
Table VII
Lunar Effect and Stock Sizes This table reports results from estimating a regression of daily returns of market-cap ranked portfolios on lunar phases. The portfolios are constructed using stocks traded in all US markets, NYSE and AMEX, NASDAQ, respectively. Decile 1 corresponds to the largest market-cap stocks. We estimate the following regression for each portfolio: Rit = αi + βi * Lunardummyt + eit. Lunardummy is a dummy variable indicating the phase of a lunar cycle, specifically, the days around a full moon. We define a full moon period as N days before the full moon day + the full moon day + N days after the full moon day (N = 7). Lunardummy is equal to one during a full moon period and zero otherwise. We display each portfolio’s β for N = 7 in columns 2, 3, and 4. T-statistics are reported in the parentheses. The daily returns are in basis points. Decile Number All US Markets NYSE and AMEX NASDAQ 1
-2.90* (-1.71)
-0.66 (-0.20)
-3.3* (-1.94)
2
-3.26** (-1.99)
-2.7 (-1.18)
-3.5** (-2.16)
3 -3.52** (-1.99)
-2.1 (-0.97)
-4.0** (-2.32)
4 -3.70** (-2.08)
-2.90 (-1.51)
-4.2** (-2.31)
5 -3.09* (-1.67)
-2.70 (-1.41)
-3.4* (-1.77)
6 -3.65* (-1.90)
-3.00 (-1.59)
-4.2** (-2.06)
7 -3.49* (-1.73)
-2.80 (-1.48)
-3.9* (-1.77)
8 -3.51* (-1.74)
-2.90 (-1.51)
-4.0* (-1.75)
9 -4.22** (-2.03)
-3.40* (-1.73)
-5.6** (-2.14)
10 -2.75 (-1.20)
-3.00 (-1.36)
-2.2 (-0.70)
***indicates a 1% significance level using a two-tailed test ** indicates a 5% significance level using a two-tailed test * indicates a 10% significance level using a two-tailed test
39
Table VIII Lunar Phases and Trading Volumes
This table reports test results from estimating a regression of daily trading volume on lunar phases. Panel A displays the test results from the global portfolio and the pooled regression, and Panel B presents the country-by-country results. We estimate the following regression : normvolumeit = αi + λi * Lunardummyt + eit. Normvolume is daily trading volume normalized by average monthly volume. Lunardummy is a dummy variable equal to one during a full moon period and zero otherwise. We define a full moon period as N days before the full moon day + the full moon day + N days after the full moon day (N = 7). T-statistics are reported in the parentheses.
Panel A: Global Evidence
λ Global Portfolio 36.27339
(0.71) Pooled Regression of 48 countries 48.802
(1.01)
Panel B: Country by Country Evidence Country λ Country λ Canada 5.00
(0.06) Indonesia 691.50***
(2.91) Germany -65.60
(-0.41) India -83.20
(-0.66) France 105.00
(0.81) Philippines 854.20***
(2.84) Italy 107.10
(0.96) Taiwan -330.70***
(-2.60) Japan -10.70
(-0.08) Argentina -174.90
(-1.14) United States 8.50
(0.15) Malaysia 102.70
(0.79) United Kingdom 124.50
(1.56) Mexico -581.20***
(-3.08) South Africa 392.60
(1.47) Thailand -62.90
(-0.36) Australia -115.50
(-0.81) Turkey -142.70
(-1.17) Belgium 24.70
(0.17) Spain -261.60**
(-2.19) Hong Kong 67.60
(0.53) Finland -18.90
(-0.08) Ireland 1629.70***
(2.87) Greece -197.50
(-1.09) Netherlands 174.70*
(1.72) New Zealand 247.30
(1.19) Singapore 135.20
(0.98) Pakistan 254.40*
(1.76) Switzerland 154.10
(1.23) Chile -208.00
(-1.05) Austria -155.40 Portugal -366.80
40
(-1.03) (-1.05) Denmark 733.00***
(2.62) Venezuela -36.70
(-0.12) Korea -69.70
(-0.46) China -232.00
(-1.07) Norway -143.20
(-0.74) Luxembourg 98.40
(0.18) Sweden 201.30
(1.48) Poland 0.60
(0.00) ***indicates a 1% significance level using a two-tailed test ** indicates a 5% significance level using a two-tailed test * indicates a 10% significance level using a two-tailed test

41
Table IX Lunar Phases and Volatility
This table reports test results from estimating a regression of daily trading volume on lunar phases. Panel A displays the test results for the global portfolio and the pooled regression, and Panel B presents the country-by-country results. We estimate the following regression : normvolumeit = αi + λi * Lunardummyt + eit. Normvolume is daily trading volume normalized by average monthly volume. In this table, we report the following regression estimates for the global portfolio and each of the 48 countries: volatilityit = αi + λi * Lunardummyt + eit. Volatility is the standard deviation of daily stock returns in each 15-day full moon period and each 15-day new moon period for each lunar month. Lunardummy is a dummy variable equal to one during a full moon period and zero otherwise. We define a full moon period as N days before the full moon day + the full moon day + N days after the full moon day (N = 7). T-statistics are reported in the parentheses.
Panel A: Global Evidence
λ Global Portfolio 1.14
(0.47) Pooled Regression of 48 countries 0.8
(0.76)
Panel B: Country by Country Evidence Country
λ
Country
λ
Canada -0.18 (-0.05)
Indonesia 16.07 (0.65)
Germany 1.14 (0.34)
India -9.41 (-0.77)
France 1.36 (0.38)
Philippines 0.85 (0.10)
Italy 6.68 (1.47)
Taiwan 6.23 (0.57)
Japan 2.18 (0.52)
Argentina 11.05 (0.43)
United States 2.04 (0.57)
Malaysia 5.42 (0.43)
United Kingdom -1.44 (-0.40)
Mexico 3.58 (0.39)
South Africa 4.79 (0.94)
Thailand 12.61 (1.11)
Australia 2.18 (0.52)
Turkey -0.07 (-0.00)
Belgium 1.32 (0.42)
Spain 0.06 (0.01)
Hong Kong 2.47 (0.30)
Finland 1.45 (0.12)
Ireland 0.04 (0.01)
Greece 12.93 (1.09)
Netherlands -2.10 (-0.59)
New Zealand -4.81 (-0.72)
Singapore -2.03 (-0.32)
Pakistan -6.19 (-0.63)
Switzerland 3.70 (1.02)
Chile 4.66 (0.92)
Austria -2.90 (-0.77)
Portugal -4.34 (-0.72)
Denmark -0.37 Venezuela 6.85
42
(-0.05) (0.44) Korea -0.84
(-0.07) China -6.12
(-0.26) Norway -4.61
(-0.74) Luxembourg 1.66
(0.23) Sweden -0.95
(-0.16) Poland -0.34
(-0.02) Brazil -179.39
(-1.16) Israel 5.23
(0.75) Morocco -5.30
(-0.61) Czech 7.43
(0.78) Hungary 11.37
(0.87) Jordan -0.87
(-0.14) Russia -15.68
(-0.48) Peru 6.22
(0.63) ***indicates a 1% significance level using a two-tailed test ** indicates a 5% significance level using a two-tailed test * indicates a 10% significance level using a two-tailed test

43
Table X Lunar Phases, Stock Returns and Other Calendar Anomalies
This table reports regression results of daily stock returns on lunar phases controlling for other calendar anomalies. Model 1 is our basic regression as described in equation (1) and (2). Model 2 controls for the January effect. Model 3 controls for the calendar month effect. Model 4 controls for the holiday effect. T-statistics are reported in the parentheses. The daily returns are in basis points. P-values for the non-parametric tests are reported in the last row.
Panel A: 15-day Window
Model 1 Model 2 Model3 Model 415
Lunardummy -4.34*** (-3.19)
-4.32*** (-3.19)
-4.35*** (-3.20)
-4.28*** (-3.15)
Januarydummy 14.14*** (5.85)
Calendardummy 0.78 (0.57)
Panel B: 7-day Window
Model 1 Model 2 Model3 Model 4
Lunardummy -5.51*** (-2.70)
-5.48*** (-2.69)
-5.48*** (-2.68)
-4.92** (-2.41)
Januarydummy 17.67*** (2.86)
Calendardummy -1.57 (-0.77)
Panel C: Cosine Regression
Model 1 Model 2 Model3 Model 4
Cosine -2.97*** (-3.09)
-2.95*** (-3.08)
-2.98*** (-3.10)
-2.80 *** (-2.91)
Januarydummy 14.14*** (5.85)
Calendardummy -0.78 (-0.58)
***indicates a 1% significance level using a two-tailed test ** indicates a 5% significance level using a two-tailed test * indicates a 10% significance level using a two-tailed test
15 To separate out the holiday effect, we exclude the specific country from the return calculation of the global portfolio for the day preceding the country holiday. We then repeat the lunar regression using holiday adjusted returns of the global portfolio.

44
Table XI Lunar Holidays This table reports 15-day window regression results of daily stock returns on lunar phases controlling for the January effect and the lunar holiday returns. Yomcum dummy equals to 1 for the day of and the day following Yom Kippur. Roshcum dummy equals to 1 for the first day of Rosh Hashanah and the day following. Other lunar holiday dummies are constructed for each country/religion specific lunar holidays. Independent variables Dependent variable
Intercept
Lunardummy
January dummy
Yomcum dummy
Roshcum dummy
Other lunar holiday dummry
Panel A: Country-by-country regressions
U.S. 0.042*** (2.45)
-0.019 (-0.82)
0.068* (1.65)
-0.393** (-2.52)
0.173 (1.52)
Israel 0.200*** (6.18)
-0.111** (-2.49)
0.088 (1.11)
-0.526 (-1.26)
0.714** (2.04)
China 0.199** (2.23)
-0.096 (-0.79)
0.047 (0.21)
0.322 (0.60)
Japan 0.039** (2.23)
-0.046* (-1.90)
0.088** (2.00)
0.000 (0.01)
Korea -0.000 (-0.01)
0.017 (0.24)
0.289** (2.23)
-0.039 (-0.12)
India 0.119** (2.32)
-0.084 (-1.19)
0.078 (0.62)
-0.121 (-0.47)
Indonesia 0.104 (1.43)
-0.188* (-1.89)
0.247 (1.35)
-0.290 (-0.86)
Jordan 0.029 (1.07)
-0.012 (-0.33)
0.089 (1.37)
-0.012 (-0.09)
Malaysia 0.083** (1.98)
-0.080 (-1.38)
0.007 (0.07)
0.231 (1.28)
Morocco 0.125*** (3.94)
-0.014 (-0.31)
0.095 (1.21)
-0.097 (-0.67)
Pakistan 0.048 (1.08)
-0.012 (-0.20)
-0.021 (-0.19)
-0.036 (-0.13)
Turkey 0.273*** (3.67)
-0.128 (-1.26)
0.546*** (3.04)
0.034 (0.11)
Panel B: Global portfolio
Global Portfolio 0.076*** (7.65)
-0.041*** (-3.02)
0.140*** (5.81)
-0.182** (-1.96)
0.003 (0.05)
***, **, * indicate 1%, 5%, 10% significance levels respectively using a two-tailed test
45
Table XI 30-day Cycles and Stock Returns
This table reports the estimates of a pooled regression with panel corrected standard errors (PCSE): Rit = αi + β * 30daydummyt + eit for a 15-day window when we shift lunar phases by N calendar days. More specifically, we start a 30-day cycle N days after the first full moon (N=1 to 29), and then estimate the 30-day cycle effect for each specification. 30daydummy takes on a value of one for 7 days before the starting day + the starting day + 7 days after the starting day, and a value of zero otherwise. The lunar cycle is represented by N=0. We display β in column 2 and column 4. T-statistics are reported in the parentheses. The daily returns are in basis points.
N β N β
1 -3.79** (-1.96) 16
3.12 (1.61)
2
-3.18 (-1.65) 17
3.39* (1.75)
3
-2.72 (-1.41) 18
2.55 (1.32)
4
-3.16 (-1.64) 19
2.35 (1.22)
5
-3.30* (-1.71) 20
3.38* (1.75)
6
-3.12 (-1.62) 21
2.16 (1.12)
7
-0.59 (-0.31) 22
-0.08 (-0.04)
8 0.294 (0.15) 23
0.22 (0.11)
9 0.58
(0.30) 24 -1.14
(-0.59)
10 1.92
(0.99) 25 -1.91
(-0.99)
11 3.95** (2.04) 26
-4.24** (-2.19)
12 4.58** (2.37) 27
-5.27** (-2.73)
13 5.07*** (2.62) 28
-4.85** (-2.51)
14 4.89** (2.53) 29
-4.53** (-2.34)
15 5.04** (2.61)
0
-5.18*** (-2.63)
***, **, * indicate 1%, 5%, 10% significance levels respectively using a two-tailed test.

46
Figure 1 Average Daily Return of the Global Portfolio by Lunar Dates
This figure graphs, for each day of the lunar month, the average daily stock returns of an equal-weighted global portfolio of the 48 country stock indices in bars. Day 0 is a full moon day and day 15 is around a new moon day16. The line is the estimated sinusoidal model of the lunar effect on stock returns from the last row of Table V. More specifically, it is : Rit = 7.47 – 3.69 * cosine(2πd/29.53), where d is the number of days since the last full moon.
Average Daily Stock Returns in a Lunar Month (Day 0 is a full moon day)
-5
0
5
10
15
20
0 1 2 3 4 5 6 7 8 9 1011121314151617181920212223242526272829
Day in a Lunar Month
Ave
rage
Dai
ly S
tock
Ret
urn
16 Day 15 is around new moon day since the length of a lunar month varies.

47
Figure 2 Average Daily Stock Returns of Global Portfolio by Lunar Windows
This figure plots the average daily stock returns of an equal-weighted global portfolio of the 48 country stock indices in a full moon period and a new moon period. The two bars on the left are average returns of a 15-day window; the two bars on the right are average returns of a 7-day window. All returns are in basis points.
Average Daily Stock Returns of Full Moon Periods vs. New Moon Periods
0
1
2
3
4
5
6
7
15-Day FullMoon
Window
15-Day NewMoon
Window
7-Day FullMoon
Window
7-Day NewMoon
Window
Aver
age
Dai
ly S
tock
Ret
urn

48
Figure 3 Distribution of Full Moon Days on Days of Week
This figure plots the number of full moon days on days of week in the sample.
Number of Full Moon Days
0
20
40
60
80
100
Monday Tuesday Wednesday Thursday Friday Saturday Sunday
Day of Week
Freq
uenc
y

49
Figure 4 30-Day Cycles and Stock Returns
This figure graphs the estimates of a pooled regression with panel corrected standard errors (PCSE): Rit = αi + β * 30daydummyt + eit for a 15-day window when we shift lunar phases by N calendar days. More specifically, we start a 30-day cycle N days after the first full moon (N=1 to 29), and then estimate the 30-day cycle effect for each specification. 30daydummy takes on a value of one for 7 days before the starting day + the starting day + 7 days after the starting day, and a value of zero otherwise. The lunar cycle is represented by N=0. The X-axis indicates 30-day cycles ordered by N. 0 represents the lunar month cycle. The Y-axis marks β estimates. The daily returns are in basis points.
30-Day Cycle Effect
-6
-4
-2
0
2
4
6
0 1 2 3 4 5 6 7 8 9 10 11 12 13 14 15 16 17 18 19 20 21 22 23 24 25 26 27 28
30-Day Cycles: N = 0 to 29
Diff
eren
ce in
ave
rage
dai
ly s
tock
retu
rns