Embed Size (px)
Citation preview

Are Independent Retailers a Viable Distribution Channel for Local Foods? Evidence from
Vermont
A Jane Kolodinsky, Ph.D., Department of Community Development and Applied Economics,
University of Vermont
Erin Roche, M.S., Research Specialist, Center for Rural Studies, University of Vermont
Sona Desai, MBA, Food Hub Manager, Intervale Center, Vermont
Erica Campbell, M.S., Farm to Plate Program Director, Vermont Sustainable Jobs Fund
Selected Paper prepared for presentation at the Agricultural & Applied Economics
Association’s
2014 AAEA Annual Meeting, Minneapolis, MN, July 27-29, 2014.
Copyright 2014 by [authors]. All rights reserved. Readers may make verbatim copies of this
documentfor non-commercial purposes by any means, provided that this copyright notice
appears on all suchcopies.

Are Independent Retailers a Viable Distribution Channel for Local Foods? Evidence from
Vermont
Introduction
The local food movement has taken hold across the country. In some areas, traditional
channels for selling local food are saturated, including farmer’s markets and community
supported agriculture. In others, consumers and producers alike may be unwilling or unable to
participate in these direct to consumer market channels. In either case, increasing access to local
foods presents an on-going challenge. Developing the independent retailer channel can be a way
to increase market access for both producers and consumers.
Overall, the goal of increasing both distribution and consumption of local food is the
development of Sustainable Food Systems (SFS). SFS include a range of food production,
transformation, distribution, marketing, consumption, and disposal practices, which differ in size
and occur at various scales (local, regional, national, and global). SFS are geographically
diverse, and serve as a means to protect and regenerate natural resources, landscapes, and
biodiversity to ensure that current consumer food and nutrition needs are met are without
compromising the ability of the system to meet the needs of future generations. They support
diverse cultures, socio-demographics, heritages, customs, and lifestyles. They also support fair
and just conditions for communities, and provide equitable access to affordable, culturally
appropriate, and health-promoting food. SFS offer economic opportunities for a range of diverse
stakeholders across geographic regions. Farmers and workers are provided with living wages.
Producers and consumers are able to access information necessary to understand how food is
produced, transformed, distributed, marketed, consumed, and disposed. They are empowered to

participate actively in decision-making throughout the system (Stevenson, 2009). The
production and consumption of local food is a key component of SFS.
Vermont is ahead of many states in their strategies to increase local food consumption.
During the 2009 Vermont legislative session, two member-based public policy organizations,
Vermont Businesses for Social Responsibility and Rural Vermont, crafted and helped win
legislative approval for the creation of a Farm to Plate Investment Program (F2P). The goals of
the legislation were to “increase economic development in Vermont’s food and farm sector,
create jobs in the food and farm economy, and improve access to healthy local foods” (Vermont
Sustainable Jobs Fund, 2013a). Now five years into the initiative, Vermont is implementing
several of the strategic initiatives outlined in the plan. One of these is to increase the distribution
of local food through independent retailers.
This study examines the relatively untapped market characterized by independent
retailers. Using an on-line survey of independent retailers in the state of Vermont, we describe
the characteristics of these retailers and investigate opportunities for and barriers to expanding
the distribution of local food.
Background
Consumers face considerable barriers when accessing fresh food. It can be as simple as
the time it takes to travel to pick-up local produce, prohibitive up-front costs of the pre-pay CSA
model, attitudes about the perceived costs of local foods, the perceived elitism of shopping at a
farmers’ market, or the very real affordability challenges of food (McEntee, 2010). The irony is
that many rural communities are located near farms, but are not able to access the foods

produced by their neighbors (McEntee & Agyeman, 2010; Morton, Bitto, Oakland, & Sand,
2008).
Small to medium sized farming operations may be well suited to using independent
retailers as distribution channels. Selling to wholesalers is often not feasible because smaller
farms do not have the quantities available on a regular basis that many distributors require. In
addition, selling wholesale puts the farmer in the position of price-taker, with little to no
influence over the price received. While using independent grocers for sales may not be as
lucrative as the direct to consumer markets, including farmer’s markets and community
supported agriculture, they can be a fit for farmers with enough production, but without expertise
or resources necessary to compete in the direct to consumer market (Kolodinsky, in press).
Historically, independently owned community stores were the centers for trade and
social gathering in rural communities. Modern life has challenged their viability (Bailey, 2010;
P. Clark, Tsoodle, & Kahl, 2008). Larger centers of commerce are more accessible by car and
many people no longer work in the town they live, choosing to do their shopping elsewhere as
part of their work commute. The community store is also challenged by the limits of scale when
ordering from distributors who are used to larger volume purchases, and some delivery truck
drivers are not able to justify a special trip to reach an out-of-the-way village center. Retail
regulations have become more limiting, and put compliance strain on small operations. Chain
stores have been displacing many locally owned independent grocery stores for a long period of
time (Mayo, 1993).
From a community development perspective, the trend away from independent retailers
has been debilitating to the viability of rural towns and villages that relied on these stores not
only as an anchor for the commercial district, but also as a “third place” away from home and
work where community members can gather. Produce, because of its perishable shelf life, is one
of the product categories that a community store is challenged to keep in stock. When consumers
can no longer access fresh produce from community stores they start to shift their total shopping
dollars to larger centers of commerce. Independently owned community grocery stores are left
losing money on produce or losing customers.
As evidenced in the literature, despite increased agricultural production, fresh food still
accounts for a small segment of U.S. agriculture, and significant barriers still exist for farmers to
access new markets and for consumers to purchase more local foods (Low & Vogel, 2011).
Literature Review
The challenges of increasing local food consumption focus on key drivers of demand that
include geographic proximity, relationships with farmers, and support for local economies. There
are also complicated demographic, psychographic and behavioral attributes of local food
consumers, and issues of consumer access and affordability (Bean Smith & Sharp, 2008; Brown,
2003; D. Conner et al., 2013; D. Conner, Colasanti, Ross, & Smalley, 2010; Ostrom, 2006;
Thilmany, Bond, & Bond, 2008; Zepeda & Leviten-Reid, 2004; Zepeda & Li, 2006).
Yet the benefits of increasing consumption of locally grown food include improved farm
profitability and viability, farmland conservation, improved public health, and closer social ties
between farmers and consumers (Andreatta & Wickliffe, 2002; D. S. Conner & Levine, 2007; D.
Conner et al., 2013, 2010; Lyson, 2004). An increase in consumption of local food is correlated
to indicators of better health and well-being for consumers based on an increase in fruit and
vegetable consumption (D. Conner et al., 2010). And, research shows that consumption of fruits

and vegetable is positively correlated with weight management and lowered risk for chronic
diseases such as diabetes (Gonzalez-Suarez, Worley, Grimmer-Somers, & Dones, 2009;
Gustafson, Cavallo, & Paxton, 2007).
Selling locally grown food is a strategy that allows small and medium sized farms to
differentiate their products. These same farms also contribute to a broad array of indicators of
social, economic and environmental well-being (D. S. Conner & Levine, 2007; Kirschenmann,
Stevenson, Buttel, Lyson, & Duffy, 2008; Lobao, 1990; Lyson & Welsh, 2005).
However, challenges to providing local food exist, including financing, distribution,
marketing research, policy barriers and opportunities, multi-sector collaboration, and store owner
skills and capacity (Karpyn & Burton-Laurison, 2013). While these barriers were developed in
the context of the healthy “corner store,” they also affect independent food retailers across the
board.
In a study of local retailing in New York State, Guptill and Wilkins (2002) conclude that
food retailing, including of local foods, cannot be predicted merely by the size of the store, and
as conventional grocery stores are being increasingly threatened by superstores, there are new
opportunities for collaboration and initiatives for healthy foods such as perishables, natural
foods, or local food products. In their qualitative analysis, they found that interviewees stated
that the decision to stock products, particularly new products, was influenced by predicted
demand, and streamlined procurement processes were very important. In addition, most of the
stated barriers to working with local producers for stores of all sizes were related to marketing.
Other studies have found that retailers emphasize the need for consistent and efficient
ordering systems, which increases with the size of the retailer and can be difficult for smaller
producers to meet (J. K. Clark, Inwood, & Sharp, 2011; Morris & Buller, 2003). For example,

Clark et al. (2011) report that the primary barriers to increasing Ohio-grown produce in retail
sites are a lack of supply and aggregation. Relationships between retailers and producers also
matter, but may need to become more formalized as distance between the two increases. Mid-
size and independent retailers are typically capable of and willing to work with local producers
and sell their products, and there is a growing focus at all size levels for retailers to identify
where their “local” products come from (Martinez et al., 2010).
Morris and Buller (2003), in a study of British retailers, found that retailers perceive local
food sales are more profitable in the direct to consumer market compared to retail channels of
distribution. Yet, Batte et al. (2007) found that consumers are willing to pay (WTP) more for
locally produced food at traditional grocery stores, albeit the premium for retailers was less
compared to the willingness to pay (WTP) for the same items at specialty outlets.
Overall, the literature on the potential of using independent retailers as a channel to
distribute local food is older and scattered. Supply side studies highlight barriers of low
profitability and difficulty in sourcing. Demand side studies show inconsistent demand for local
in grocery outlets and a small WTP a premium for local. However, studies also point to the
potential for local foods sold by independent grocery retailers to support local farmers and
communities and meet a growing consumer demand for local products.
Methods
The Vermont Farm to Plate Network is a self-governing collaborative made up of farm
and food system businesses, nonprofit organizations, government agencies, funders, educational
institutions and community groups all working together to reach the 25 goals in the Farm to Plate
Strategic Plan, as well as to advance their own organizations’ goals (Vermont Sustainable Jobs
Fund, 2013b). Members convene as Working Groups, Cross-cutting Teams, and Task Forces, to
collaborate on high impact projects, as well as to assess gaps, opportunities, and trends and
monitor progress towards F2P goals.
One Task Force is the Independent Retailers Task Force, which focuses on increasing the
availability of local food in small independent grocery stores through targeted marketing and
consumer education support. This task force directly addresses three of the twenty five goals of
the Farm to Plate Strategic Plan: Total Local Consumption; Distribution Infrastructure; and
Local Food Availability (“Food Retailers | The Network | Vermont Food System Atlas,” 2014).
As part of this task force’s work, an online survey of independent grocers was developed
by the Intervale Center and the Center for Rural Studies at the University of Vermont and
reviewed by the Vermont Grocers’ Association and the Vermont Sustainable Jobs Fund Farm to
Plate Initiative. The survey methodology was approved by the University’s Institutional Review
Board. The survey was conducted in August and September of 2013.
A list of grocers was compiled using resources from the Vermont Grocers’ Association
and the Vermont Food System Atlas. The compiled list was checked for duplicates. The Vermont
Grocers’ Association shared the survey link with their members on the list with an email address
available. Other stores were emailed the link by the Intervale Center (if an email address was
available). Approximately 390 stores were contacted by email, and 73 stores completed the
survey. Nineteen stores who did not complete the survey were contacted in October 2013 to
check for any systematic bias; all 19 stated that they did not see or receive the email.
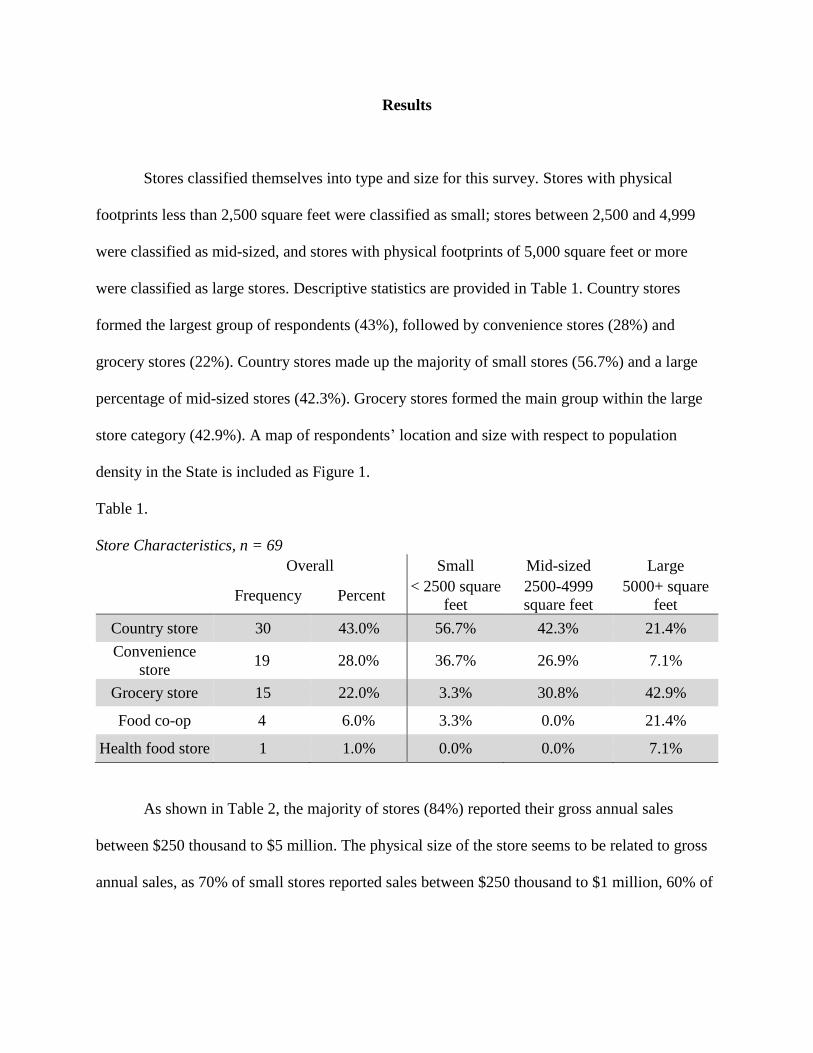
Results
Stores classified themselves into type and size for this survey. Stores with physical
footprints less than 2,500 square feet were classified as small; stores between 2,500 and 4,999
were classified as mid-sized, and stores with physical footprints of 5,000 square feet or more
were classified as large stores. Descriptive statistics are provided in Table 1. Country stores
formed the largest group of respondents (43%), followed by convenience stores (28%) and
grocery stores (22%). Country stores made up the majority of small stores (56.7%) and a large
percentage of mid-sized stores (42.3%). Grocery stores formed the main group within the large
store category (42.9%). A map of respondents’ location and size with respect to population
density in the State is included as Figure 1.
Table 1.
Store Characteristics, n = 69
Overall Small Mid-sized Large
Frequency Percent < 2500 square
feet
2500-4999
square feet
5000+ square
feet
Country store 30 43.0% 56.7% 42.3% 21.4%
Convenience
store 19 28.0% 36.7% 26.9% 7.1%
Grocery store 15 22.0% 3.3% 30.8% 42.9%
Food co-op 4 6.0% 3.3% 0.0% 21.4%
Health food store 1 1.0% 0.0% 0.0% 7.1%
As shown in Table 2, the majority of stores (84%) reported their gross annual sales
between $250 thousand to $5 million. The physical size of the store seems to be related to gross
annual sales, as 70% of small stores reported sales between $250 thousand to $1 million, 60% of

mid-sized stores reported sales between $1 million to $5 million, and all of the large stores
reporting gross annual sales over $1 million and 58.4% over $5 million.
Figure 1.
Independent Retailers in Vermont by location, size and population density.

Table 2.
Reported Gross Annual Sales for 2012, n = 70
Overall Small Mid-sized Large
Frequency Percent
< 2500 square
feet
2500-4999
square feet
5000+ square
feet
Less than
$250,000 1 1.0% 0.0% 4.0% 0.0%
$0.25 - 1 million 30 43.0% 70.6% 28.0% 0.0%
$1-5 million 29 41.0% 26.5% 60.0% 41.7%
$5-15 million 8 11.0% 2.9% 8.0% 41.7%
Over $15 million 2 3.0% 0.0% 0.0% 16.7%
The percentages of stores reporting to carry certain products were largely consistent
across size categories. Exceptions to this occurred at the large stores, which carried more bulk
and non-dairy perishables and less tobacco products than the small and mid-sized stores. Overall,
over 90% of stores reported carrying coffee and other hot beverages (92%), dairy/eggs (92%),
general merchandise (92%), beer and wine (93%), and grocery products (93%).
Table 3.
Reported Product Types Carried by Stores, n = 73 Overall Small Mid-sized Large
Frequency Percent
< 2500 square
feet
2500-4999
square feet
5000+ square
feet
Grocery (non-
alcoholic
beverages, maple
syrup, honey,
jams,
condiments, etc.)
68 93.0% 88.2% 96.2% 92.9%
Beer & Wine 68 93.0% 88.2% 96.2% 92.9%
General
Merchandise
(cleaning
supplies, paper
products, bottle
openers, etc.)
67 92.0% 88.2% 96.2% 85.7%
Dairy/Eggs 67 92.0% 85.3% 96.2% 92.9%

(Milk, Cheese,
Yogurt, Eggs,
etc.)
Coffee / other
Hot Beverages 67 92.0% 85.3% 96.2% 92.9%
Frozen 65 89.0% 82.4% 92.3% 92.9%
Prepared Foods 64 88.0% 76.5% 96.2% 92.9%
Health & Beauty
Products (body
care,
supplements,
etc.)
63 86.0% 82.4% 88.5% 85.7%
Produce 59 81.0% 73.5% 80.8% 92.9%
Bakery 59 81.0% 70.6% 88.5% 85.7%
Tobacco 55 75.0% 76.5% 80.8% 57.1%
Meat & Seafood 57 78.0% 64.7% 84.6% 92.9%
Non-Dairy
Perishables
(hummus, tofu,
etc.)
51 70.0% 61.8% 65.4% 92.9%
Gasoline 36 49.0% 55.9% 42.3% 42.9%
Bulk Foods 23 32.0% 20.6% 23.1% 71.4%
As shown in Table 4, of the 16 product categories, grocery products were most
consistently rated as the top revenue-generating product (49 stores and 72% across all 4
rankings), followed closely by beer and wine (48 stores and 70.7%), while frozen foods and non-
dairy perishables were reported the least (2 stores and 2.9% and 1 store and 1.5% respectively).
Table 4.
Reported Top Four Revenue-Generating Products, n = 68
Frequency of ranking Percent of Ranking
#1 #2 #3 #4 #1 #2 #3 #4
Grocery 24 12 10 3 35.3% 17.6% 14.7% 4.4%
Beer & Wine 5 15 16 12 7.4% 22.1% 23.6% 17.6%
Gasoline 17 4 3 5 25.0% 5.9% 4.4% 7.4%
Prepared Foods 8 4 8 8 11.8% 5.9% 11.8% 11.8%
Dairy/eggs 0 3 9 12 0 4.4% 13.2% 17.7%
Meat & seafood 4 9 4 5 5.9% 13.2% 5.9% 7.4%
Tobacco 5 7 4 3 7.4% 10.3% 5.8% 4.4%

Produce 1 5 4 4 1.8% 7.4% 5.9% 5.9%
Coffee/other hot beverages 0 2 3 5 0 2.9% 4.4% 7.4%
Health & Beauty Products 0 2 3 1 0 2.9% 4.4% 1.5%
Other (deli, liquor, magazines) 3 2 1 0 4.4% 2.9% 1.5% 0
General 0 1 1 4 0 1.5% 1.5% 5.9%
Bakery 1 1 1 2 1.5% 1.5% 1.5% 2.9%
Bulk Foods 0 0 1 2 0 0 1.5% 2.9%
Frozen 0 0 0 2 0 0 0 2.9%
Non-dairy perishables
(hummus, tofu, etc.) 0 1 0 0 0 1.5% 0 0
At least three quarters of stores reported stocking local dairy/eggs (93%), bakery (83%),
produce (78%), grocery products (78%), and beer and wine (75%). No stores reported stocking
local tobacco, and only 1 store reported stocking local gasoline1.
Table 5.
Reported Local Products Stocked by Stores Carrying Products in Relevant Categories, n = 73
Overall
Frequency Percent
Dairy/eggs 62 93.0%
Bakery 53 83.0%
Produce 46 78.0%
Grocery 53 78.0%
Beer & Wine 51 75.0%
Coffee / Other hot beverages 47 70.0%
Bulk Foods 14 61.0%
Prepared Foods 36 56.0%
Meat & seafood 30 53.0%
Non-dairy perishables 23 45.0%
Frozen 25 39.0%
Health & Beauty Products 22 35.0%
General 17 25.0%
Gasoline 1 3.0%
Tobacco 0 0.0%
1 Respondents self-defined what is “local.” The Vermont Origin rule indicates that a Vermont product may be labeled as local if the product is produced in Vermont, the ingredients originate from Vermont, and/or if the company is incorporated in Vermont.

As shown in Table 6, local coffee and prepared hot beverages were reported consistently
as accounting for a high percentage of total revenue, both across store size categories (61% for
small, 56% for mid-sized and 46% for large) and as an overall percentage (55%). Dairy/eggs also
made up sizeable percentages of stores’ total revenues (47% overall), particularly for small and
mid-sized stores (48% and 52% respectively). Mid-sized stores also reported higher percentages
in the non-dairy perishables (37%) and prepared food (51%) categories.
Table 6.
Reported Percentage of Total Revenue of Local Products, n = 73 Overall Small Mid-Sized Large
Frequency Percent < 2500 square
feet
2500-4999
square feet
5000+ square
feet
Coffee/ prepared
hot beverages 47 55.0% 61.0% 56.0% 46.0%
Dairy/eggs 60 47.0% 48.0% 52.0% 35.0%
Prepared food 29 42.0% 32.0% 51.0% 43.0%
Bakery 50 38.0%. 33.0% 39.0% 45.0%
Meat & Seafood 29 37.0% 36.0% 39.0% 37.0%
Produce 43 29.0% 25.0% 30.0% 32.0%
Non-dairy
perishables 23 26.0% 17.0% 37.0% 24.0%
Beer & wine 48 18.0% 18.0% 15.0% 25.0%
Bulk foods 13 17.0% 12.0% 15.0% 20.0%
Frozen 24 15.0% 22.0% 14.0% 9.0%
Grocery 49 15.0% 16.0% 13.0% 17.0%
Health & beauty
products 22 12.0% 17.0% 7.0% 12.0%
General
merchandise 17 5.0% 2.0% 7.0% 6.0%
In response to the question, “What are the current barriers to selling local or Vermont-
made products?” all respondents indicated lack of consumer interest as a significant barrier to
selling local or Vermont-made products. Nearly all respondents (n = 52) also indicated high cost
as an important barrier.

Table 7.
Reported Barriers to Selling Local or Vermont-made Products, n = 61
Frequency of reports as a barrier
Average rank of
barrier
Consumers don’t buy it 61 3.34
Too expensive 52 3.63
Perishable 43 4.02
Distributor doesn't carry 30 4.33
Would displace a product that is currently carried 18 4.22
Inconsistent supply 11 6.18
Requires additional accounting 11 4.82
Takes too much time 8 5.88
Other 3 7.33 Note. Respondents were asked to rank the above potential barriers in order of 1 being most important and 9 = least
important.
There are demand, product characteristic, and supply side barriers to independent
retailers stocking more local products, as shown in Table 7. Both consumer demand and high
price are the two highest barriers, with ranks of 3.34 and 3.63, respectively. The highly
perishable nature of products was ranked by more than half of the respondents and was the third
largest barrier. Following these were distribution issues, such as using a distributor that doesn’t
carry local products. Finally, issues of retailer time cost were reported, including additional
accounting and time to deal with individual suppliers. Inconsistent supply was also reported, but
this was not a large barrier compared with the others listed. We analyzed these results by size of
retailer, as shown in Table 8. Due to the small sample size, perhaps, there are no significant
differences between retailer size for each of the barriers, even though differences in percentages
are relatively large in some cases. For example, large retailers reported needing more consistent
supply, while small retailers reported needing more consumer demand. A need for lower price
points also ranked high by all size retailers.

Table 8.
Reported Top Three Aids to Selling More Local Products, n = 73
Overall Small Mid-Sized Large
Frequency Percent
< 2500 square
feet
2500-4999
square feet
5000+ square
feet
Customer
demand 39 53.0% 55.9% 53.8% 42.9%
Lower prices 36 49.0% 44.1% 53.8% 50.0%
More consistent
supply 30 41.0% 35.3% 34.6% 64.3%
Distributor to
carry more
products
25 34.0% 32.4% 30.8% 42.9%
Bigger store 14 19.0% 14.7% 26.9% 14.3%
Marketing
support 11 15.0% 14.7% 7.7% 28.6%
More non-
perishable items 8 5.0% 14.7% 7.7% 7.1%
Table 9.
Perceived Consumer Interest in Local Products, n = 58
Overall Small Mid-Sized Large
Frequency Percent
< 2500
square feet
2500-4999
square feet
5000+ square
feet
Produce 40 69.0% 44% 50% 86%
Dairy/eggs 36 62.0% 38% 50% 71%
Bakery 35 60.0% 35% 50% 71%
Grocery 29 50.0% 35% 38% 50%
Beer & Wine 29 50.0% 32% 35% 64%
Meat & seafood 25 43.0% 24% 27% 71%
Prepared Foods 23 40.0% 26% 23% 57%
Coffee/other hot
beverages 17 29.0% 15% 19% 50%
Frozen 12 21.0% 6% 15% 43%
Non-dairy
perishables 12 21.0% 9% 8% 50%
Bulk Foods 10 17.0% 3% 8% 50%
Health & Beauty
Products 10 17.0% 3% 15% 36%
General 9 16.0% 3% 12% 36%

Table 9 shows that the largest independent retailers are most interested in a wide variety
of local products, with fresh items topping the list (dairy/eggs at 71% and produce at 86%).
Cheese and yogurt are value-added products. Other opportunities include more value-added
products for the largest retailers, including bakery, meat and seafood, and beer and wine. Mid-
size retailers reported much lower demand for these products, but do report an interest in bakery
items, followed by general grocery and beer and wine. The smallest stores report less consumer
demand for all categories, but report some demand for bakery products, general grocery items,
and beer and wine.
Discussion
Placing these results in the context of the relatively small literature base, it appears that
the previous findings are correct in some ways. There are both demand and supply side issues
that create barriers to the increased distribution and consumption of local food in Vermont.
However, it is not only a marketing, distribution, demand, or price issue (See, Guptill and
Wilkins, 2002; Clark et al., 2011; Morris and Buller, 2003). Issues affecting the retail sector,
even narrowed to the independent retail sector, include the array of barriers outlined by Karpyn
and Burton-Laurison: financing, distribution, marketing, store-owner skills, and capacity (2013).
This study adds perceptions of pricing and consumer demand to the list.
However this does not preclude opportunities for independent retailers. Our analysis
indicates that the opportunities may differ by size of retailer, and that suppliers might need to
strategize in order improve the independent retailer sector as a distribution channel for local
food.

Information in Tables 3, 4, 5, 6, and 9 was triangulated to create Figure 2. Moving from
left to right, the figure represents increasing consumer demand, as reported by the independent
retailers surveyed. Moving from bottom to top represents lower to higher revenue. Bold, yellow
type represents local products that retailers may add to their stock, in addition to products the
non-local products that they already stock in those product categories. White type represents
products for which a retailer may substitute a local product for the product currently stocked.
The arrowhead represents the largest retailers and the arrow direction represents demand as
reported by small, medium and large retailers for each product category. In all cases, as shown
in Table 9, the largest retailers reported more consumer demand for each of the product
categories.
Local beer and wine and grocery items (non-alcoholic beverages, maple syrup, honey,
jams, condiments, etc.) represent the highest demand/highest revenue product categories for
local. Value-added producers in these categories may have the highest probability of gaining
increased access to the independent retailer channel. Local beer and wine (and other spirits,
including cider) is an expanding category in Vermont. Rachel Carter, communications director
with the Vermont Farm to Plate Initiative, reports that Vermont has at least 27 vineyards and
wineries, 31 breweries, 9 cider producers and 15 distilleries (Choate, 2014). This growing sector,
matched with the customer demand reported by large independent grocery retailers, shows
potential for local producers, although they will have to develop distribution and supply that
meets the needs of the larger retailers, at a price point they can afford.

Figure 2.
Opportunities for local foods in independent retail outlets in Vermont.
. Arrows go in direction from smaller stores to larger stores; bold product types represent potential additions of local
products to store stock; non-bold product types represent potential substitution of local product for non-local
counterpart.
For the general grocery category, which also includes value-added products, there is
continued potential in the independent retailer sector. Vermont has long been involved in the
prepared, shelf stable grocery category. Jams, jellies, maple syrup and other shelf-stable value
added products started the “made in Vermont” revolution (de Wit, 1999). More independent
retailers report already selling this category of goods. Therefore, local producers are presented
with opportunities to convince retailers to substitute their local product for the brands currently
being carried. All barriers, including ensuring consistent supply and distribution and price points

that fit within the retailers’ parameters, will have to be addressed by producers. The local
condiment category within grocery items has been growing, and includes innovations in
mustards, salsas and salad dressings.
Local meat is an another expanding category, and is being invested in by the Vermont
Farm to Plate Meat Processing Task Force, which aids in the capitalization of and production of
local meat (Gwin & Thiboumery, 2013). The Vermont Farm to Plate Strategic Plan noted,
“Although demand for Vermont grown meat typically outstrips supply, farmers face considerable
challenges to increased livestock production, including the cost and seasonality of production,
access to slaughter, and insufficient production assistance for the development of high quality
animals for the market” (Calderwood et al., 2013).
Local prepared foods also show some potential for expansion. While prepared foods are
higher revenue items for stores, independent retailers report higher revenues but lower demand
for this food category, compared to grocery items and spirits. The prepared foods category is
likely more of a niche market, as many larger independent retailers prepare their own products,
including salads and deli items (Volpe, 2011). Meeting distribution and consumer price points
will remain a barrier for both the meat and prepared foods category.
Local produce shows potential for all sizes of retailers, but a match must be made for low
demand smaller retailers and high demand larger retailers. Balancing distribution, accounting,
delivery schedules and marketing for produce will require building relationships between
growers and retailers, or a larger distribution method that perhaps aggregates produce from
several farms (Stevenson, 2009).
Local dairy was reported by independent retailers to be a lower revenue, higher demand
product category. While fluid milk is almost all local in the State, there is a growing artisan

cheese industry that is gaining entry into retail outlets. The Vermont Cheese Council includes 44
cheese makers on their “Cheese Trail Map,” and identifies 14 independent retail outlets and five
distributors that carry Vermont cheese (Vermont Cheese Council, 2014). While these products
command high premiums relative to “commodity” cheeses, some Vermont cheese brands are
more competitively priced and are widely available, including Vermont Creamery and Dakin
Farms.
Conclusion
There appears to be potential for distributing local products through the independent
retailer supply chain. The most potential, based on this survey of 74 independent grocers of
various sizes, exists for the newer spirits category and the historically profitable local grocery
items. There is also potential for increases in sale of prepared foods and meats. And, while there
is demand for other product categories, revenue streams are lower. Importantly, the location and
size of independent retailers, and population density of these locations, as shown in Figure 1,
must be considered along with the market opportunities depicted in Figure 2.
Strengths of the study include the use of survey and GIS tools to develop a compilation of
market potential for a variety of local food products based on current conditions and
opportunities as perceived by the independent retailer sector in Vermont. Weaknesses of the
study include a limited sample size.
Overall, barriers to using independent retailers to sell local food are the same highlighted
in the literature for all non-direct-to-consumer channels: distribution, pricing, supply, and ease
of accounting. The analysis presented here cannot be generalized beyond Vermont. However,
the methodology used can provide a useful framework for other geographic areas that are

investigating developing markets for local foods beyond the direct-to-consumer channels that
have become saturated in some areas of the country.
References
Andreatta, S., & Wickliffe, W. (2002). Managing Farmer and Consumer Expectations: A Study
of a North Carolina Farmers Market. Human Organization, 61(2), 167–176.
Bailey, J. M. (2010). Rural grocery stores: importance and challenges. Center for Rural Affairs
Rural Research and Analysis Program. Published October. Retrieved from
http://www.hungerfreecommunities.org/wp-content/uploads/2011/12/rural-grocery-
stores.pdf
Batte, M. T., Hooker, N. H., Haab, T. C., & Beaverson, J. (2007). Putting their money where
their mouths are: Consumer willingness to pay for multi-ingredient, processed organic
food products. Food Policy, 32(2), 145–159. doi:10.1016/j.foodpol.2006.05.003
Bean Smith, M., & Sharp, J. (2008). A Current and Retrospective Look at Local Food
Consumption and Support among Ohioans. Columbus, Ohio: The Ohio State University.
Brown, C. (2003). Consumers’ preferences for locally produced food: A study in southeast
Missouri. American Journal of Alternative Agriculture, 18(04), 213–224.
doi:10.1079/AJAA200353
Calderwood, L., Sawyer, S., Kahler, E., Hoffer, D., Perkins, K., Fuller, S., & Tippet, H. (2013).
Farm to Plate Strategic Plan: Food Production: Livestock and Meat (pp. 255 – 293).
Vermont Sustainable Jobs Fund.

Choate, S. (2014, March 18). Getting In the Spirit: Exploring Vermont’s booming beer and wine
industry : MyFinance Magazine. MyFinance Magazine. Retrieved from
http://www.myfinancemagazine.com/getting-in-the-spirit-exploring-vermonts-booming-
beer-and-wine-industry/
Clark, J. K., Inwood, S., & Sharp, J. S. (2011). Scaling-up Connections between Regional Ohio
Specialty Crop Producers and Local Markets: Distribution as the Missing Link (pp. 1 –
56). Columbus, Ohio: The Ohio State University.
Clark, P., Tsoodle, L., & Kahl, D. (2008). Rural Grocery Sustainability Project: Customer
Survey (pp. 1 – 16). Kansas State University: KSU Center for Engagement and
Community Development.
Conner, D., Becot, F., Hoffer, D., Kahler, E., Sawyer, S., & Berlin, L. (2013). Measuring Current
Consumption of Locally Grown Foods in Vermont: Methods for Baselines and Targets.
Journal of Agriculture, Food Systems, and Community Development, 3(3), 83–94.
doi:10.5304/jafscd.2013.033.004
Conner, D., Colasanti, K., Ross, R. B., & Smalley, S. B. (2010). Locally Grown Foods and
Farmers Markets: Consumer Attitudes and Behaviors. Sustainability, 2(3), 742–756.
doi:10.3390/su2030742
Conner, D. S., & Levine, R. (2007). Circles of Association: The Connections of Community-
Based Food Systems. Journal of Hunger & Environmental Nutrition, 1(3), 5–25.
doi:10.1300/J477v01n03_02
De Wit, C. W. (1999). Food-Place Associations on American Product Labels. In A Taste of
American Place: A Reader on Regional and Ethnic Foods (pp. 101 – 109). Rowman &
Littlefield Publishers.

Food Retailers | The Network | Vermont Food System Atlas. (2014). VT Farm to Plate Food
Atlas. Retrieved May 22, 2014, from http://www.vtfoodatlas.com/network/food-retailers
Gonzalez-Suarez, C., Worley, A., Grimmer-Somers, K., & Dones, V. (2009). School-Based
Interventions on Childhood Obesity. American Journal of Preventive Medicine, 37(5),
418–427. doi:10.1016/j.amepre.2009.07.012
Guptill, A., & Wilkins, J. L. (2002). Buying into the food system: Trends in food retailing in the
US and implications for local foods. Agriculture and Human Values, 19(1), 39–51.
Gustafson, A., Cavallo, D., & Paxton, A. (2007). Linking Homegrown and Locally Produced
Fruits and Vegetables to Improving Access and Intake in Communities through Policy
and Environmental Change. Journal of the American Dietetic Association, 107(4), 584–
585. doi:10.1016/j.jada.2007.02.023
Gwin, L., & Thiboumery, A. (2013). From Convenience to Commitment: Securing the Long-
Term Viability of Local Meat and Poultry Processing (Technical Report). Oregon State
University. Retrieved from http://ir.library.oregonstate.edu/xmlui/handle/1957/38213
Karpyn, A., & Burton-Laurison, H. (2013). Rethinking Research: Creating a Practice-Based
Agenda for Sustainable Small-Scale Healthy Food Retail. Journal of Agriculture, Food
Systems, and Community Development, 1–5. doi:10.5304/jafscd.2013.034.015
Kirschenmann, F., Stevenson, G. W., Buttel, F., Lyson, T. A., & Duffy, M. (2008). Why Worry
about the Agriculture of the Middle? In Food and the Mid-Level Farm (pp. 3 – 22). MIT
Press.
Kolodinsky, J. (in press) Community Supported Agriculture. Food Issues. New York: Sage.
Lobao, L. M. (1990). Locality and Inequality: Farm and Industry Structure and Socioeconomic
Conditions. SUNY Press.

Low, S. A., & Vogel, S. (2011). Direct and intermediated marketing of local foods in the United
States. US Department of Agriculture, Economic Research Service. Retrieved from
http://wallace.webfactional.com/mount_ngfn/ngfn/resources/ngfn-
database/knowledge/ERR128.pdf
Lyson, T. A. (2004). Civic Agriculture: Reconnecting Farm, Food, and Community. UPNE.
Lyson, T. A., & Welsh, R. (2005). Agricultural industrialization, anticorporate farming laws, and
rural community welfare. Environment and Planning A, 37(8), 1479–1491.
doi:10.1068/a37142
Martinez, S., Hand, M., Da Pra, M., Pollack, S., Ralston, K., Smith, T., … Newman, C. (2010).
Local Food Systems: Concepts, Impacts, and Issues (Economic Research Report No.
ERR 97) (pp. 1 – 87). U.S. Department of Agriculture, Economic Research Service.
Mayo, J. M. (1993). The American grocery store: the business evolution of an architectural
space. Westport, Conn: Greenwood Press.
McEntee, J. (2010). Contemporary and traditional localism: a conceptualisation of rural local
food. Local Environment, 15(9-10), 785–803. doi:10.1080/13549839.2010.509390
McEntee, J., & Agyeman, J. (2010). Towards the development of a GIS method for identifying
rural food deserts: Geographic access in Vermont, USA. Applied Geography, 30(1), 165–
176. doi:10.1016/j.apgeog.2009.05.004
Morris, C., & Buller, H. (2003). The local food sector: A preliminary assessment of its form and
impact in Gloucestershire. British Food Journal, 105(8), 559–566.
doi:10.1108/00070700310497318

Morton, L. W., Bitto, E. A., Oakland, M. J., & Sand, M. (2008). Accessing food resources: Rural
and urban patterns of giving and getting food. Agriculture and Human Values, 25(1),
107–119. doi:10.1007/s10460-007-9095-8
Ostrom, M. (2006). Everyday Meanings of “Local Food”: Views from Home and Field.
Community Development, 37(1), 65–78. doi:10.1080/15575330609490155
Stevenson, S. (2009). Values-based food supply chains: Executive Summary (pp. 1 – 12).
Wisconsin Center for Integrated Ag Systems.
Thilmany, D., Bond, C. A., & Bond, J. K. (2008). Going Local: Exploring Consumer Behavior
and Motivations for Direct Food Purchases. American Journal of Agricultural
Economics, 90(5), 1303–1309. doi:10.1111/j.1467-8276.2008.01221.x
Vermont Cheese Council (2014). Website. Available:
http://www.vtcheese.com/contactus.htm. Accessed May 28, 014.
Vermont Sustainable Jobs Fund. (2013a). Farm to Plate Strategic Plan: A 10-Year Strategic
Plan for Vermont’s Food System: Executive Summary (pp. 1 – 51). Vermont. Retrieved
from http://www.vtfoodatlas.com/plan/
Vermont Sustainable Jobs Fund. (2013b). Farm to Plate Strategic Plan: Analysis of Vermont’s
Food System - Overview (pp. 61 – 72). Retrieved from
http://www.vtfoodatlas.com/assets/plan_sections/files/Chapter%203_Analysis_Overview
_MAY%202013.pdf
Volpe, R. (2011). The Relationship Between National Brand and Private Label Food Products:
Prices, Promotions, Recessions, and Recoveries (Economic Research Report No. ERR -
129). U.S. Department of Agriculture, Economic Research Service. Retrieved from
http://www.ers.usda.gov/publications/err-economic-research-
report/err129.aspx#.U4VS9i-cDQM

Zepeda, L., & Leviten-Reid, C. (2004). Consumers’ views on local food. Journal of Food
Distribution Research, 35(3), 1–6.
Zepeda, L., & Li, J. (2006). Who Buys Local Food? Journal of Food Distribution Research,
37(3), 1 – 11.