Embed Size (px)
Citation preview
Are House Prices Rising Too Fast inHong Kong SAR?
Ashvin Ahuja and Nathan Porter
WP/10/273
© 2010 International Monetary Fund WP/10/273
IMF Working Paper
Asia and Pacific Department
Are House Prices Rising Too Fast in Hong Kong SAR?
Prepared by Ashvin Ahuja and Nathan Porter1
Authorized for distribution by Nigel Chalk
December 2010
Abstract
This Working Paper should not be reported as representing the views of the IMF.The views expressed in this Working Paper are those of the author(s) and do not necessarily represent those of the IMF or IMF policy. Working Papers describe research in progress by the author(s) and are published to elicit comments and to further debate.
Sharp increase in house prices in Hong Kong SAR in 2009-2010 has led to concerns of an emergingreal estate bubble. According to our measure of price deviation from fundamentals, which should be taken as an early warning indicator of market exuberance, the current level of house prices in Hong Kong SAR does not seem to be significantly higher than would be justified by underlying fundamentals. Moreover, unlike advanced economies before 2007-8, deviation from fundamentals hasnot been persistent in Hong Kong. Going forward, low interest rate and improving growth prospects, as well as a tight supply, particularly in the mass market, means that house price growth will continue to be strong. This is the period in which vulnerability may be accumulating, and tight prudential standards and fiscal measures will be required to tame price inflation.
JEL Classification Numbers:R21, R31, G10
Keywords:House price, price misalignment, financial stability, prudential measures
Authors’ E-Mail Address:[email protected]; [email protected]
1 We would like to thank Nigel Chalk, Steven Barnett and Papa N’Diaye, as well as seminar participants at the Hong Kong Monetary Authority for helpful comments. Discussion with Nigel Chalk substantially improved the paper.
2
Contents Page
I. Introduction ............................................................................................................................3
II. Salient Features of the Hong Kong Property Market............................................................5
III. How We Assess Price Misalignment: An Empirical Strategy.............................................7A. How We Calculate ..............................................................................................8B. International Comparators.........................................................................................9
IV. Are Hong Kong Residential Properties Already Overvalued? ..........................................12
V. What are the Policy Implications? ......................................................................................15
VI. Conclusion .........................................................................................................................15
Appendix I: Selected property Market Related Policies in Hong Kong SAR .........................18
References................................................................................................................................17
3
I. INTRODUCTION
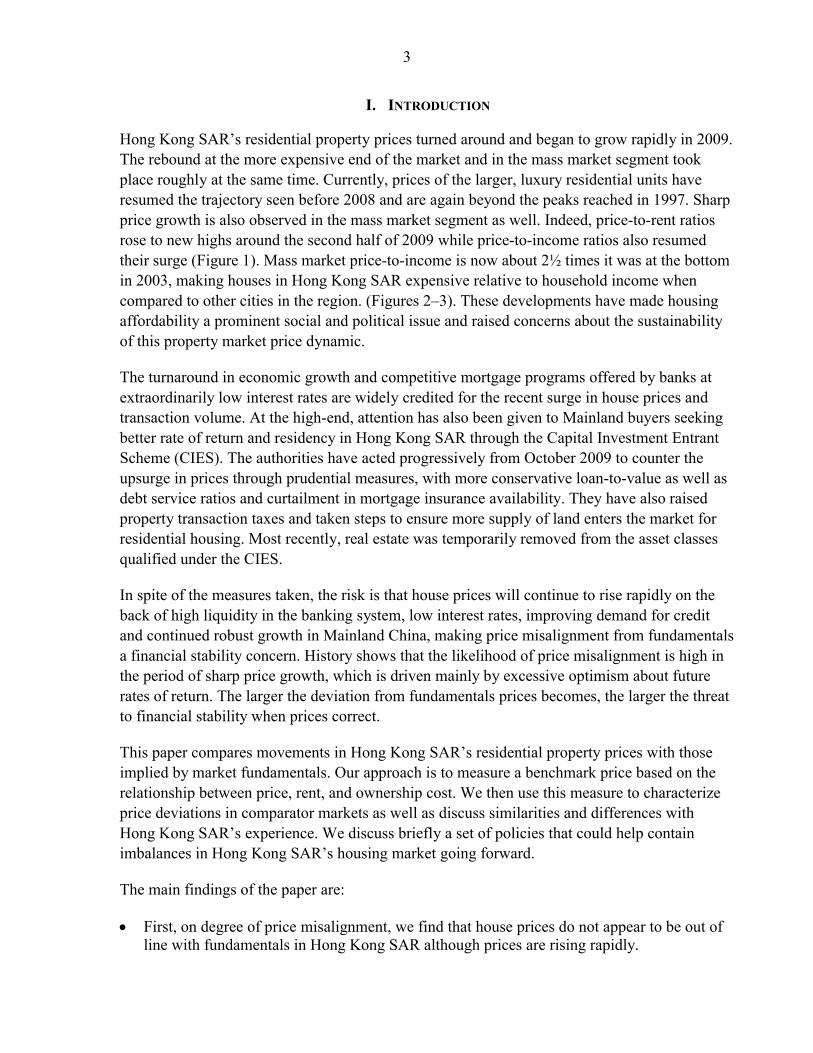
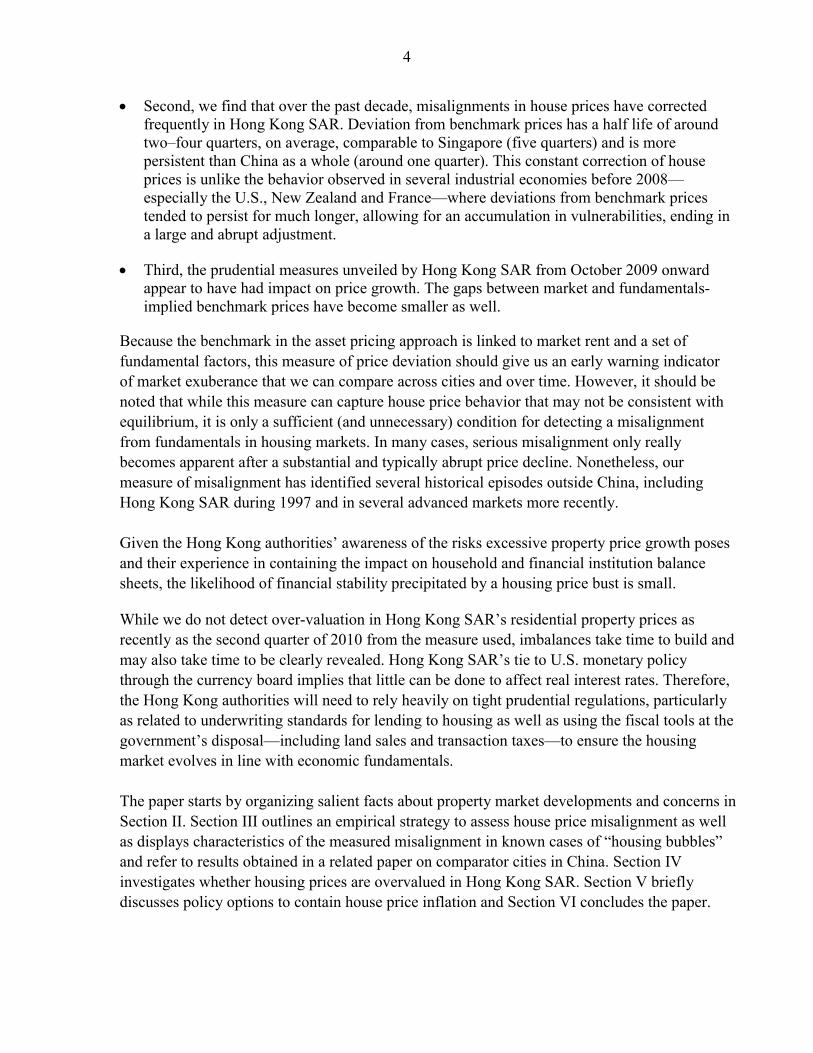
Hong Kong SAR’s residential property prices turned around and began to grow rapidly in 2009. The rebound at the more expensive end of the market and in the mass market segment took place roughly at the same time. Currently, prices of the larger, luxury residential units have resumed the trajectory seen before 2008 and are again beyond the peaks reached in 1997. Sharp price growth is also observed in the mass market segment as well. Indeed, price-to-rent ratios rose to new highs around the second half of 2009 while price-to-income ratios also resumed their surge (Figure 1). Mass market price-to-income is now about 2½ times it was at the bottom in 2003, making houses in Hong Kong SAR expensive relative to household income when compared to other cities in the region. (Figures 2–3). These developments have made housing affordability a prominent social and political issue and raised concerns about the sustainability of this property market price dynamic.
The turnaround in economic growth and competitive mortgage programs offered by banks at extraordinarily low interest rates are widely credited for the recent surge in house prices and transaction volume. At the high-end, attention has also been given to Mainland buyers seeking better rate of return and residency in Hong Kong SAR through the Capital Investment Entrant Scheme (CIES). The authorities have acted progressively from October 2009 to counter the upsurge in prices through prudential measures, with more conservative loan-to-value as well as debt service ratios and curtailment in mortgage insurance availability. They have also raisedproperty transaction taxes and taken steps to ensure more supply of land enters the market for residential housing. Most recently, real estate was temporarily removed from the asset classes qualified under the CIES.
In spite of the measures taken, the risk is that house prices will continue to rise rapidly on the back of high liquidity in the banking system, low interest rates, improving demand for creditand continued robust growth in Mainland China, making price misalignment from fundamentals a financial stability concern. History shows that the likelihood of price misalignment is high in the period of sharp price growth, which is driven mainly by excessive optimism about future rates of return. The larger the deviation from fundamentals prices becomes, the larger the threat to financial stability when prices correct.
This paper compares movements in Hong Kong SAR’s residential property prices with those implied by market fundamentals. Our approach is to measure a benchmark price based on the relationship between price, rent, and ownership cost. We then use this measure to characterize price deviations in comparator markets as well as discuss similarities and differences with Hong Kong SAR’s experience. We discuss briefly a set of policies that could help contain imbalances in Hong Kong SAR’s housing market going forward.
The main findings of the paper are:
• First, on degree of price misalignment, we find that house prices do not appear to be out of line with fundamentals in Hong Kong SAR although prices are rising rapidly.
4
• Second, we find that over the past decade, misalignments in house prices have corrected frequently in Hong Kong SAR. Deviation from benchmark prices has a half life of aroundtwo–four quarters, on average, comparable to Singapore (five quarters) and is more persistent than China as a whole (around one quarter). This constant correction of house prices is unlike the behavior observed in several industrial economies before 2008—especially the U.S., New Zealand and France—where deviations from benchmark prices tended to persist for much longer, allowing for an accumulation in vulnerabilities, ending in a large and abrupt adjustment.
• Third, the prudential measures unveiled by Hong Kong SAR from October 2009 onward appear to have had impact on price growth. The gaps between market and fundamentals-implied benchmark prices have become smaller as well.
Because the benchmark in the asset pricing approach is linked to market rent and a set of fundamental factors, this measure of price deviation should give us an early warning indicator of market exuberance that we can compare across cities and over time. However, it should be noted that while this measure can capture house price behavior that may not be consistent with equilibrium, it is only a sufficient (and unnecessary) condition for detecting a misalignment from fundamentals in housing markets. In many cases, serious misalignment only really becomes apparent after a substantial and typically abrupt price decline. Nonetheless, our measure of misalignment has identified several historical episodes outside China, including Hong Kong SAR during 1997 and in several advanced markets more recently.
Given the Hong Kong authorities’ awareness of the risks excessive property price growth poses and their experience in containing the impact on household and financial institution balance sheets, the likelihood of financial stability precipitated by a housing price bust is small.
While we do not detect over-valuation in Hong Kong SAR’s residential property prices as recently as the second quarter of 2010 from the measure used, imbalances take time to build and may also take time to be clearly revealed. Hong Kong SAR’s tie to U.S. monetary policy through the currency board implies that little can be done to affect real interest rates. Therefore, the Hong Kong authorities will need to rely heavily on tight prudential regulations, particularly as related to underwriting standards for lending to housing as well as using the fiscal tools at the government’s disposal—including land sales and transaction taxes—to ensure the housing market evolves in line with economic fundamentals.
The paper starts by organizing salient facts about property market developments and concerns in Section II. Section III outlines an empirical strategy to assess house price misalignment as well as displays characteristics of the measured misalignment in known cases of “housing bubbles” and refer to results obtained in a related paper on comparator cities in China. Section IV investigates whether housing prices are overvalued in Hong Kong SAR. Section V briefly discusses policy options to contain house price inflation and Section VI concludes the paper.
5
II. SALIENT FEATURES OF THE HONG KONG PROPERTY MARKET2
Price-to-rent has been on a rising trend since 2003. But contrary to other cities in Mainland China, high-end, larger residential units in Hong Kong SAR have commanded significantly higher prices relative to rents from mid-2003 onward (Figure 1). In fact, price-to-rent ratios were more or less similar across property classes until around 2003, after which large units have seen price-to-rent ratios increase more rapidly than smaller units. Since 2005, price-to-rent in larger residential units (Classes C–E) has surpassed their peaks in the late 1990s, while price-to-rent for smaller, mass-market units (Classes A–B) has not reached their previous peaks.
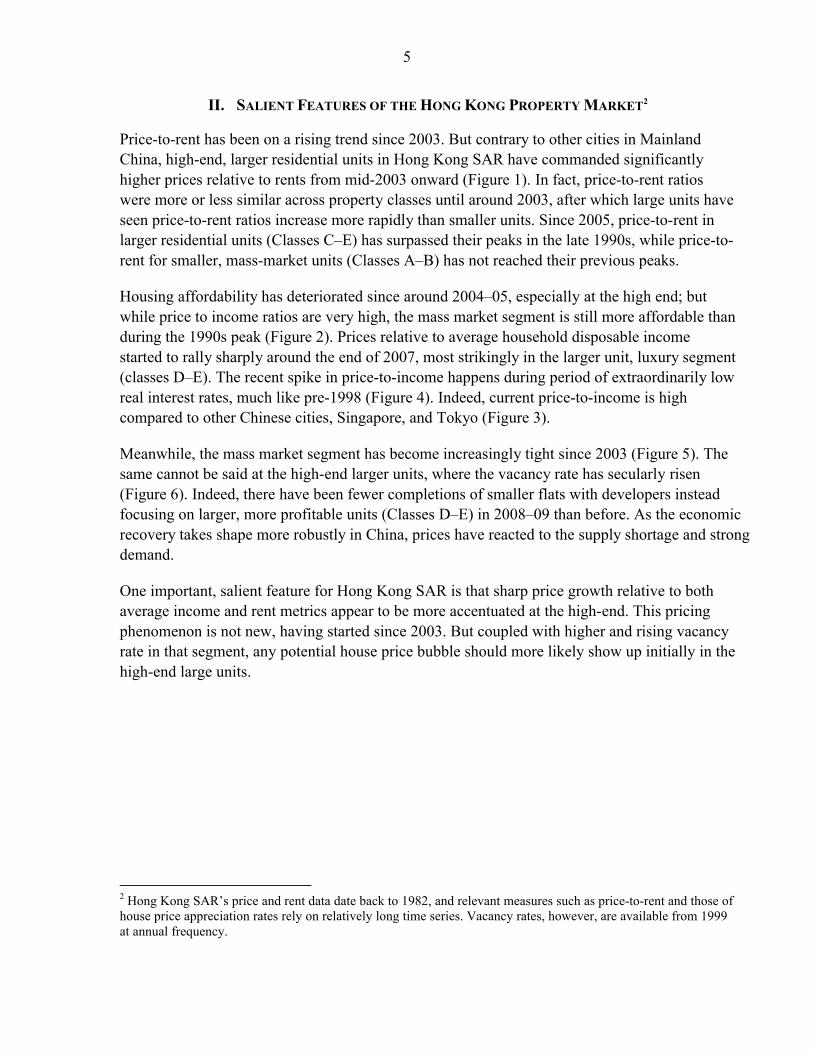
Housing affordability has deteriorated since around 2004–05, especially at the high end; but while price to income ratios are very high, the mass market segment is still more affordable thanduring the 1990s peak (Figure 2). Prices relative to average household disposable income started to rally sharply around the end of 2007, most strikingly in the larger unit, luxury segment (classes D–E). The recent spike in price-to-income happens during period of extraordinarily low real interest rates, much like pre-1998 (Figure 4). Indeed, current price-to-income is high compared to other Chinese cities, Singapore, and Tokyo (Figure 3).
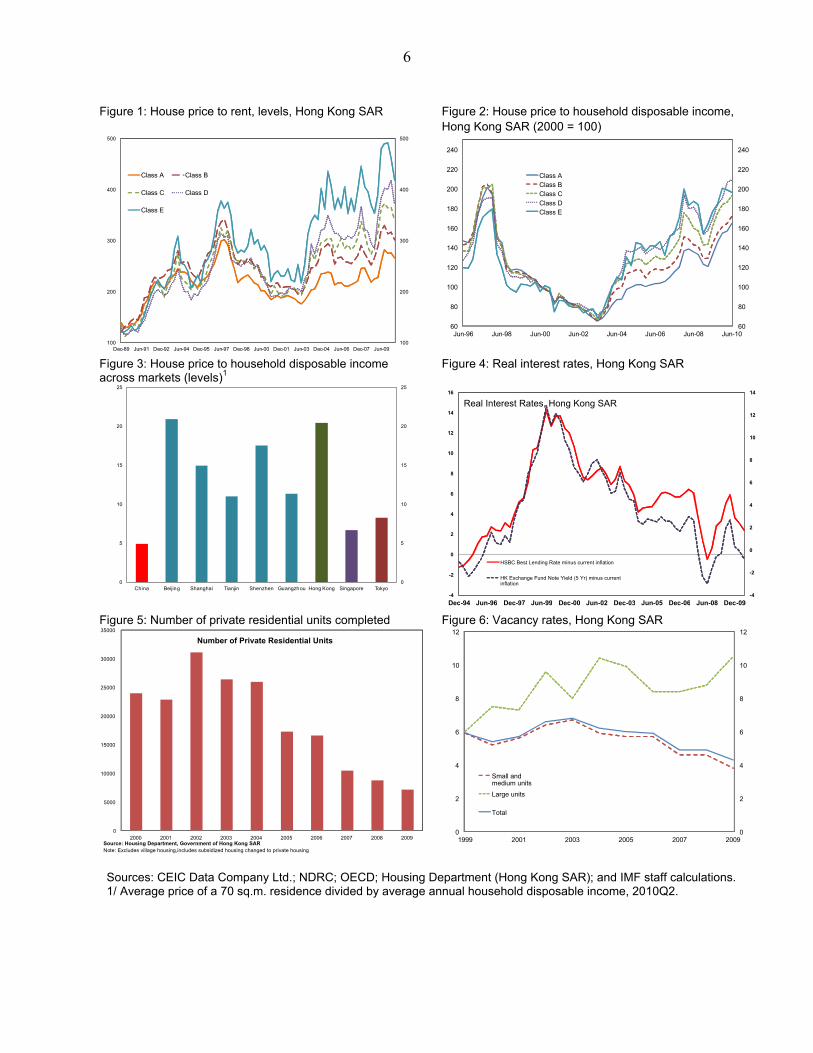
Meanwhile, the mass market segment has become increasingly tight since 2003 (Figure 5). The same cannot be said at the high-end larger units, where the vacancy rate has secularly risen(Figure 6). Indeed, there have been fewer completions of smaller flats with developers instead focusing on larger, more profitable units (Classes D–E) in 2008–09 than before. As the economic recovery takes shape more robustly in China, prices have reacted to the supply shortage and strong demand.
One important, salient feature for Hong Kong SAR is that sharp price growth relative to both average income and rent metrics appear to be more accentuated at the high-end. This pricing phenomenon is not new, having started since 2003. But coupled with higher and rising vacancy rate in that segment, any potential house price bubble should more likely show up initially in the high-end large units.
2 Hong Kong SAR’s price and rent data date back to 1982, and relevant measures such as price-to-rent and those of house price appreciation rates rely on relatively long time series. Vacancy rates, however, are available from 1999 at annual frequency.
6
Figure 1: House price to rent, levels, Hong Kong SAR Figure 2: House price to household disposable income, Hong Kong SAR (2000 = 100)
Figure 3: House price to household disposable income across markets (levels)1
Figure 4: Real interest rates, Hong Kong SAR
0
5
10
15
20
25
0
5
10
15
20
25
China Beijing Shanghai Tianjin Shenzhen Guangzhou Hong Kong Singapore Tokyo
Figure 5: Number of private residential units completed Figure 6: Vacancy rates, Hong Kong SAR
Sources: CEIC Data Company Ltd.; NDRC; OECD; Housing Department (Hong Kong SAR); and IMF staff calculations.1/ Average price of a 70 sq.m. residence divided by average annual household disposable income, 2010Q2.
0
2
4
6
8
10
12
0
2
4
6
8
10
12
1999 2001 2003 2005 2007 2009
Small and medium units
Large units
Total
60
80
100
120
140
160
180
200
220
240
60
80
100
120
140
160
180
200
220
240
Jun-96 Jun-98 Jun-00 Jun-02 Jun-04 Jun-06 Jun-08 Jun-10
Class AClass BClass CClass DClass E
100
200
300
400
500
100
200
300
400
500
Dec-89 Jun-91 Dec-92 Jun-94 Dec-95 Jun-97 Dec-98 Jun-00 Dec-01 Jun-03 Dec-04 Jun-06 Dec-07 Jun-09
Class A Class B
Class C Class D
Class E
0
5000
10000
15000
20000
25000
30000
35000
2000 2001 2002 2003 2004 2005 2006 2007 2008 2009
Number of Private Residential Units
Source: Housing Department, Government of Hong Kong SARNote: Excludes village housing,includes subsidized housing changed to private housing
-4
-2
0
2
4
6
8
10
12
14
-4
-2
0
2
4
6
8
10
12
14
16
Dec-94 Jun-96 Dec-97 Jun-99 Dec-00 Jun-02 Dec-03 Jun-05 Dec-06 Jun-08 Dec-09
HSBC Best Lending Rate minus current inflation
HK Exchange Fund Note Yield (5 Yr) minus current inflation
Real Interest Rates, Hong Kong SAR
7
III. HOW WE ASSESS PRICE MISALIGNMENT: AN EMPIRICAL STRATEGY
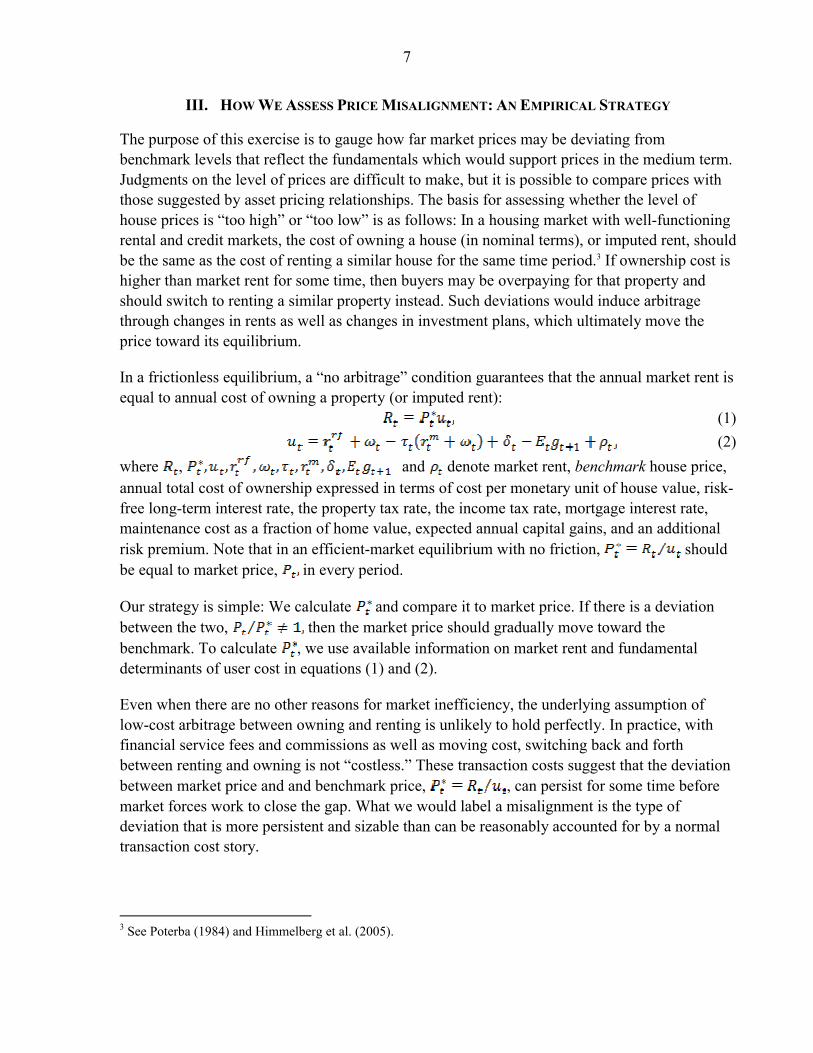
The purpose of this exercise is to gauge how far market prices may be deviating frombenchmark levels that reflect the fundamentals which would support prices in the medium term. Judgments on the level of prices are difficult to make, but it is possible to compare prices with those suggested by asset pricing relationships. The basis for assessing whether the level of house prices is “too high” or “too low” is as follows: In a housing market with well-functioning rental and credit markets, the cost of owning a house (in nominal terms), or imputed rent, should be the same as the cost of renting a similar house for the same time period.3 If ownership cost is higher than market rent for some time, then buyers may be overpaying for that property and should switch to renting a similar property instead. Such deviations would induce arbitrage through changes in rents as well as changes in investment plans, which ultimately move the price toward its equilibrium.
In a frictionless equilibrium, a “no arbitrage” condition guarantees that the annual market rent is equal to annual cost of owning a property (or imputed rent):
(1)(2)
where , and denote market rent, benchmark house price, annual total cost of ownership expressed in terms of cost per monetary unit of house value, risk-free long-term interest rate, the property tax rate, the income tax rate, mortgage interest rate, maintenance cost as a fraction of home value, expected annual capital gains, and an additional risk premium. Note that in an efficient-market equilibrium with no friction, should be equal to market price, in every period.
Our strategy is simple: We calculate and compare it to market price. If there is a deviation between the two, then the market price should gradually move toward the benchmark. To calculate , we use available information on market rent and fundamental determinants of user cost in equations (1) and (2).
Even when there are no other reasons for market inefficiency, the underlying assumption of low-cost arbitrage between owning and renting is unlikely to hold perfectly. In practice, with financial service fees and commissions as well as moving cost, switching back and forth between renting and owning is not “costless.” These transaction costs suggest that the deviation between market price and and benchmark price, , can persist for some time before market forces work to close the gap. What we would label a misalignment is the type of deviation that is more persistent and sizable than can be reasonably accounted for by a normal transaction cost story.
3 See Poterba (1984) and Himmelberg et al. (2005).
8
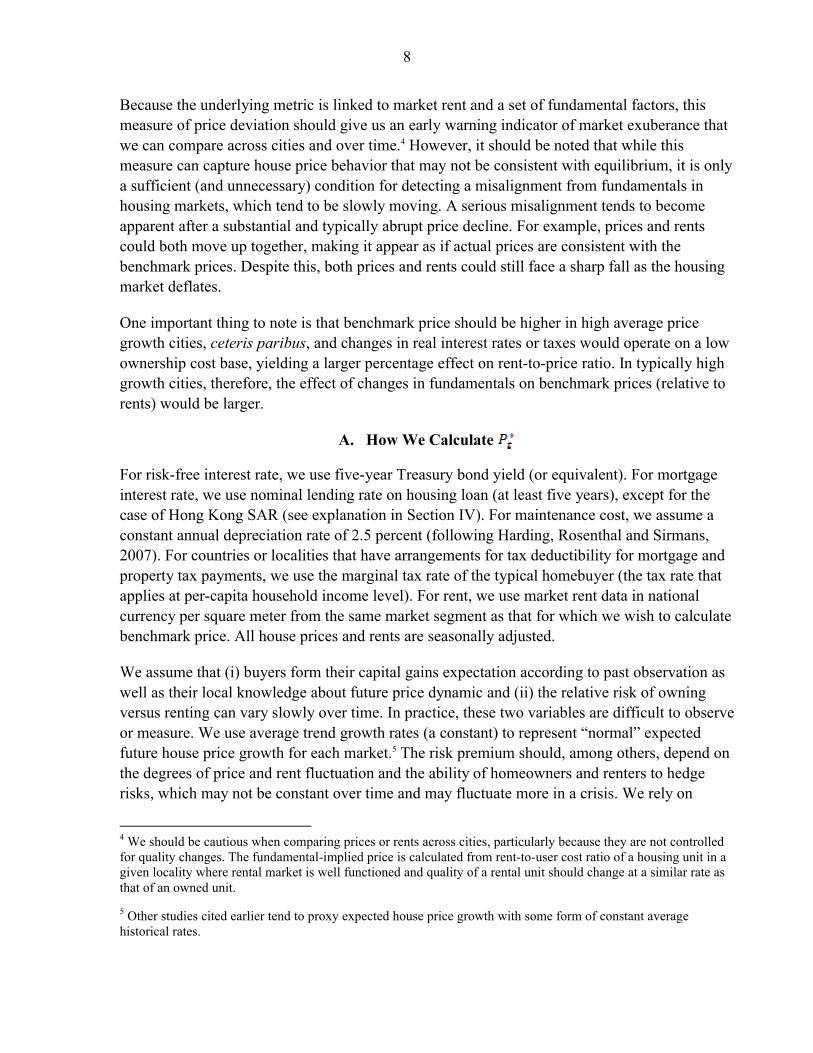
Because the underlying metric is linked to market rent and a set of fundamental factors, this measure of price deviation should give us an early warning indicator of market exuberance that we can compare across cities and over time.4 However, it should be noted that while this measure can capture house price behavior that may not be consistent with equilibrium, it is only a sufficient (and unnecessary) condition for detecting a misalignment from fundamentals in housing markets, which tend to be slowly moving. A serious misalignment tends to become apparent after a substantial and typically abrupt price decline. For example, prices and rents could both move up together, making it appear as if actual prices are consistent with the benchmark prices. Despite this, both prices and rents could still face a sharp fall as the housing market deflates.
One important thing to note is that benchmark price should be higher in high average price growth cities, ceteris paribus, and changes in real interest rates or taxes would operate on a low ownership cost base, yielding a larger percentage effect on rent-to-price ratio. In typically high growth cities, therefore, the effect of changes in fundamentals on benchmark prices (relative to rents) would be larger.
A. How We Calculate
For risk-free interest rate, we use five-year Treasury bond yield (or equivalent). For mortgage interest rate, we use nominal lending rate on housing loan (at least five years), except for the case of Hong Kong SAR (see explanation in Section IV). For maintenance cost, we assume a constant annual depreciation rate of 2.5 percent (following Harding, Rosenthal and Sirmans, 2007). For countries or localities that have arrangements for tax deductibility for mortgage and property tax payments, we use the marginal tax rate of the typical homebuyer (the tax rate that applies at per-capita household income level). For rent, we use market rent data in national currency per square meter from the same market segment as that for which we wish to calculate benchmark price. All house prices and rents are seasonally adjusted.
We assume that (i) buyers form their capital gains expectation according to past observation as well as their local knowledge about future price dynamic and (ii) the relative risk of owning versus renting can vary slowly over time. In practice, these two variables are difficult to observe or measure. We use average trend growth rates (a constant) to represent “normal” expected future house price growth for each market.5 The risk premium should, among others, depend on the degrees of price and rent fluctuation and the ability of homeowners and renters to hedge risks, which may not be constant over time and may fluctuate more in a crisis. We rely on
4 We should be cautious when comparing prices or rents across cities, particularly because they are not controlled for quality changes. The fundamental-implied price is calculated from rent-to-user cost ratio of a housing unit in a given locality where rental market is well functioned and quality of a rental unit should change at a similar rate as that of an owned unit.
5 Other studies cited earlier tend to proxy expected house price growth with some form of constant average historical rates.
9
equations (1) and (2), assuming market price is equal to benchmark price on average, to extract the risk premium from the data and use its slow-moving component to represent the risk premium in our calculation of the user cost.6
In our framework, fluctuations in the benchmark price are associated with changes in market rent and long-term changes in real interest rates, taxes, maintenance costs, “normal” expectation of capital gains, and “normal” premium. They reflect changes in fundamental factors. In fact, as these fundamental factors change smoothly over time, most of the fluctuation in our benchmark price reflect changes in market rent. After these fundamental factors are accounted for, the remaining fluctuations in price are associated with “excessive” fluctuations in house price expectation or in the premium.
B. International Comparators
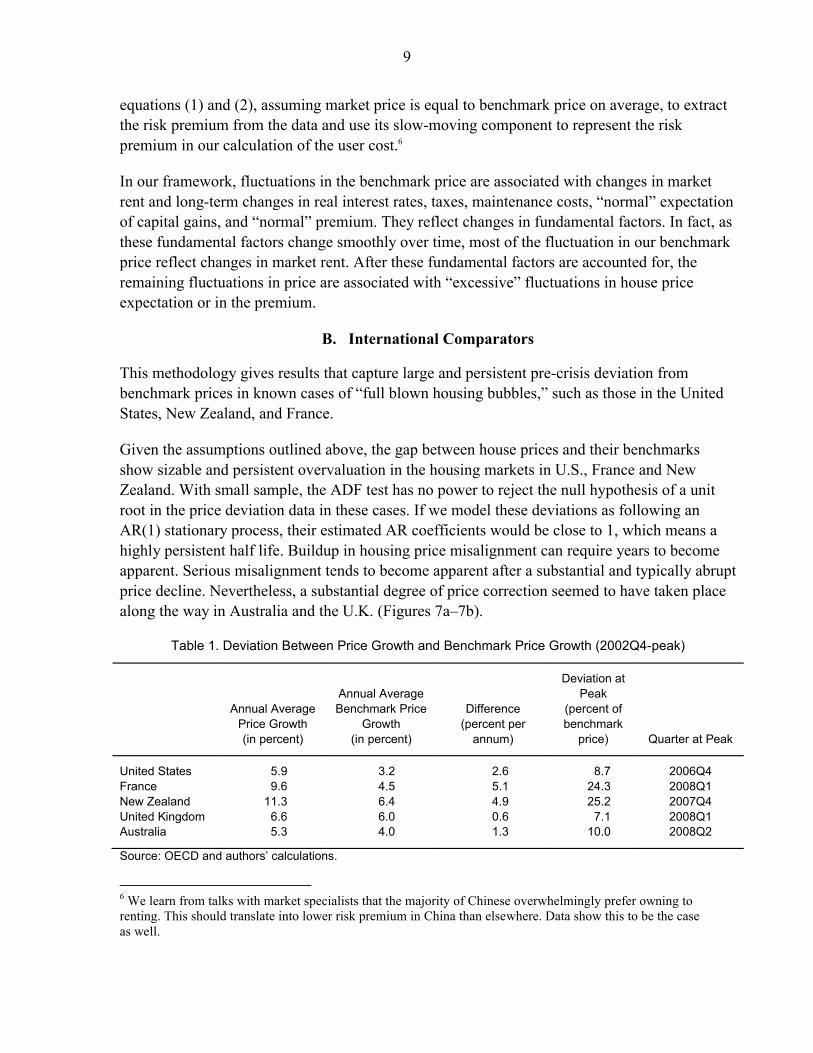
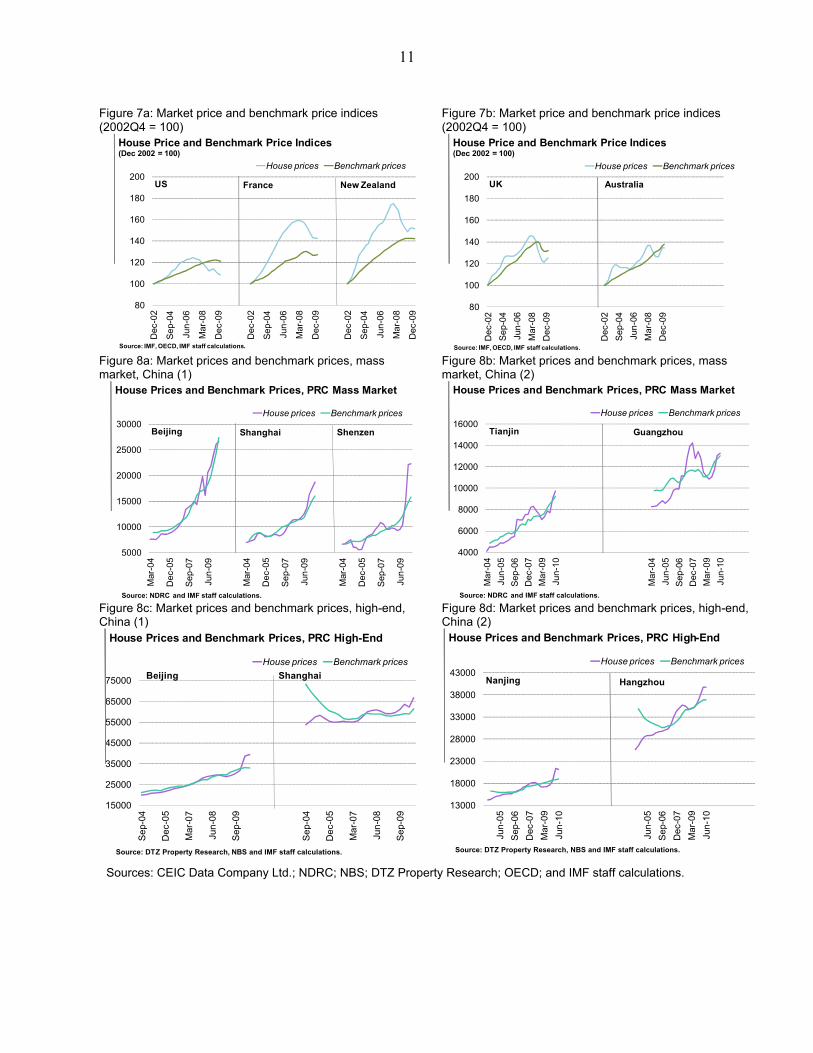
This methodology gives results that capture large and persistent pre-crisis deviation from benchmark prices in known cases of “full blown housing bubbles,” such as those in the United States, New Zealand, and France.
Given the assumptions outlined above, the gap between house prices and their benchmarks show sizable and persistent overvaluation in the housing markets in U.S., France and New Zealand. With small sample, the ADF test has no power to reject the null hypothesis of a unit root in the price deviation data in these cases. If we model these deviations as following an AR(1) stationary process, their estimated AR coefficients would be close to 1, which means a highly persistent half life. Buildup in housing price misalignment can require years to become apparent. Serious misalignment tends to become apparent after a substantial and typically abrupt price decline. Nevertheless, a substantial degree of price correction seemed to have taken place along the way in Australia and the U.K. (Figures 7a–7b).
Table 1. Deviation Between Price Growth and Benchmark Price Growth (2002Q4-peak)
Annual AveragePrice Growth (in percent)
Annual AverageBenchmark Price
Growth (in percent)
Difference (percent per
annum)
Deviation at Peak
(percent of benchmark
price) Quarter at Peak
United States 5.9 3.2 2.6 8.7 2006Q4France 9.6 4.5 5.1 24.3 2008Q1New Zealand 11.3 6.4 4.9 25.2 2007Q4United Kingdom 6.6 6.0 0.6 7.1 2008Q1Australia 5.3 4.0 1.3 10.0 2008Q2
Source: OECD and authors’ calculations.
6 We learn from talks with market specialists that the majority of Chinese overwhelmingly prefer owning to renting. This should translate into lower risk premium in China than elsewhere. Data show this to be the case as well.
10
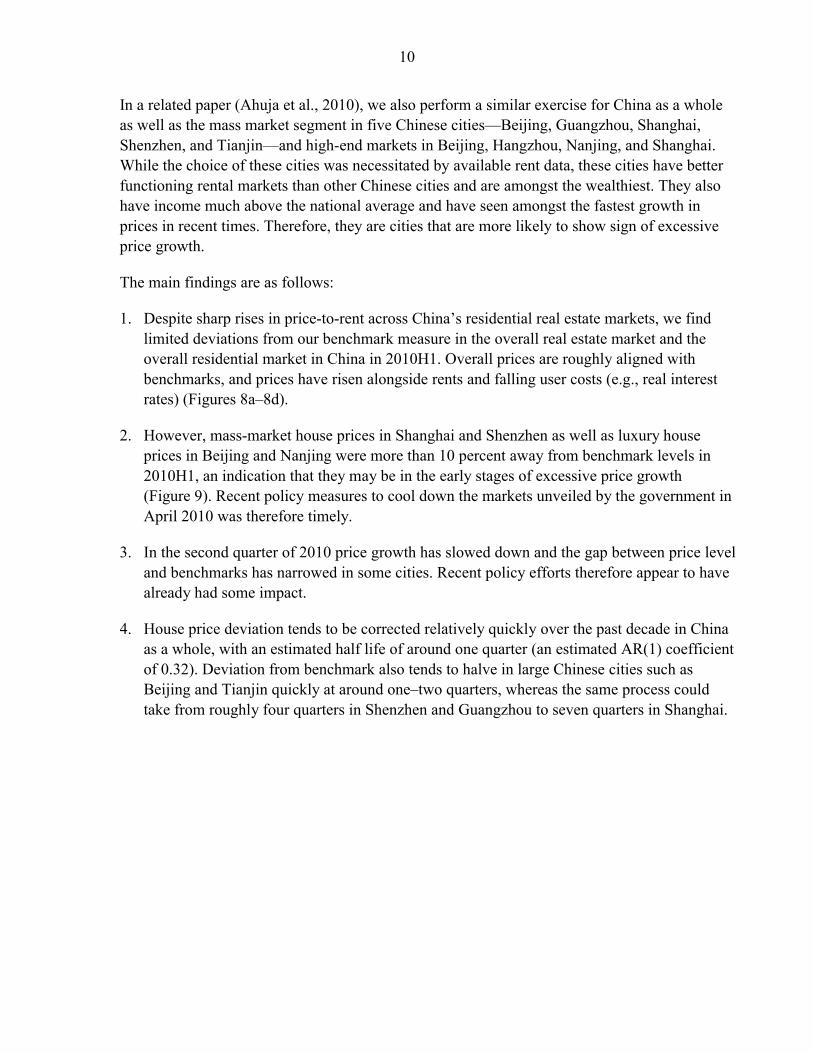
In a related paper (Ahuja et al., 2010), we also perform a similar exercise for China as a whole as well as the mass market segment in five Chinese cities—Beijing, Guangzhou, Shanghai, Shenzhen, and Tianjin—and high-end markets in Beijing, Hangzhou, Nanjing, and Shanghai. While the choice of these cities was necessitated by available rent data, these cities have better functioning rental markets than other Chinese cities and are amongst the wealthiest. They also have income much above the national average and have seen amongst the fastest growth in prices in recent times. Therefore, they are cities that are more likely to show sign of excessive price growth.
The main findings are as follows:
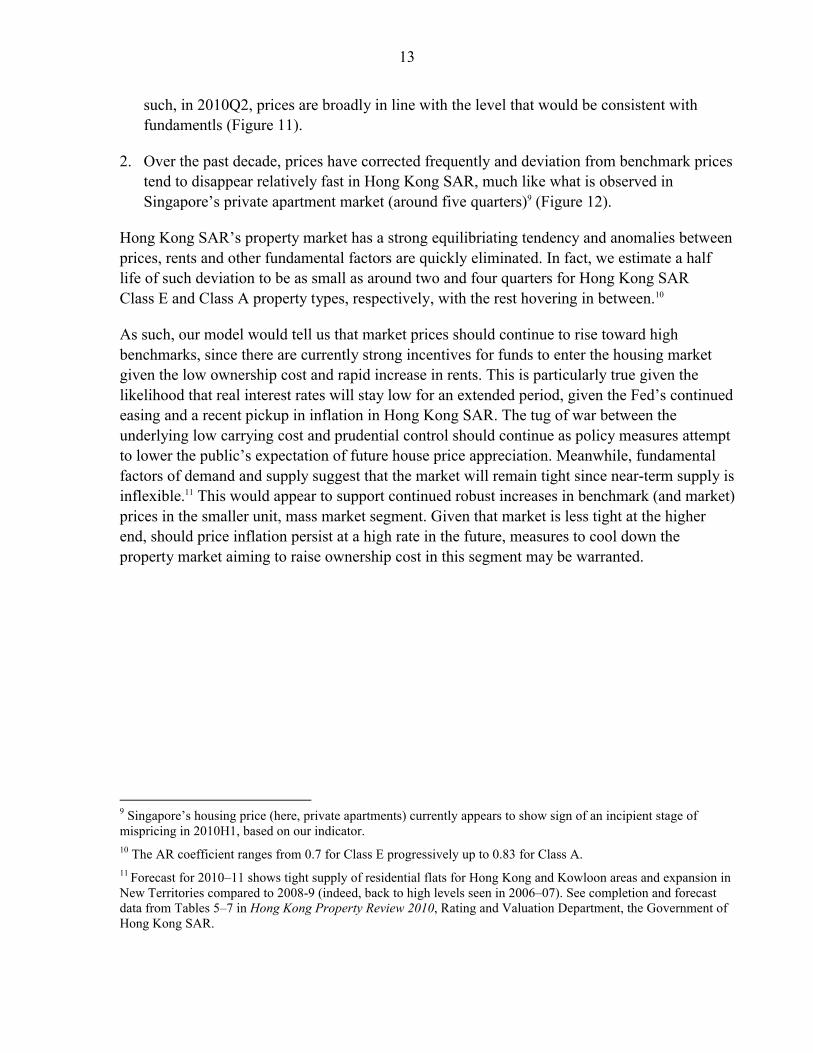
1. Despite sharp rises in price-to-rent across China’s residential real estate markets, we find limited deviations from our benchmark measure in the overall real estate market and the overall residential market in China in 2010H1. Overall prices are roughly aligned with benchmarks, and prices have risen alongside rents and falling user costs (e.g., real interest rates) (Figures 8a–8d).
2. However, mass-market house prices in Shanghai and Shenzhen as well as luxury house prices in Beijing and Nanjing were more than 10 percent away from benchmark levels in 2010H1, an indication that they may be in the early stages of excessive price growth (Figure 9). Recent policy measures to cool down the markets unveiled by the government in April 2010 was therefore timely.
3. In the second quarter of 2010 price growth has slowed down and the gap between price level and benchmarks has narrowed in some cities. Recent policy efforts therefore appear to have already had some impact.
4. House price deviation tends to be corrected relatively quickly over the past decade in China as a whole, with an estimated half life of around one quarter (an estimated AR(1) coefficient of 0.32). Deviation from benchmark also tends to halve in large Chinese cities such as Beijing and Tianjin quickly at around one–two quarters, whereas the same process could take from roughly four quarters in Shenzhen and Guangzhou to seven quarters in Shanghai.
11
Figure 7a: Market price and benchmark price indices (2002Q4 = 100)
Figure 7b: Market price and benchmark price indices (2002Q4 = 100)
80
100
120
140
160
180
200
Dec
-02
Sep-
04
Jun-
06
Mar
-08
Dec
-09
Dec
-02
Sep-
04
Jun-
06
Mar
-08
Dec
-09
Dec
-02
Sep-
04
Jun-
06
Mar
-08
Dec
-09
House prices Benchmark prices
House Price and Benchmark Price Indices(Dec 2002 = 100)
US France
Source: IMF, OECD, IMF staff calculations.
New Zealand
80
100
120
140
160
180
200
Dec
-02
Sep-
04Ju
n-06
Mar
-08
Dec
-09
Dec
-02
Sep-
04Ju
n-06
Mar
-08
Dec
-09
House prices Benchmark prices
House Price and Benchmark Price Indices(Dec 2002 = 100)
UK Australia
Source: IMF, OECD, IMF staff calculations.
Figure 8a: Market prices and benchmark prices, mass market, China (1)
Figure 8b: Market prices and benchmark prices, mass market, China (2)
5000
10000
15000
20000
25000
30000
Mar
-04
Dec
-05
Sep-
07
Jun-
09
Mar
-04
Dec
-05
Sep-
07
Jun-
09
Mar
-04
Dec
-05
Sep-
07
Jun-
09House prices Benchmark prices
House Prices and Benchmark Prices, PRC Mass Market
Beijing Shanghai
Source: NDRC and IMF staff calculations.
Shenzen
4000
6000
8000
10000
12000
14000
16000
Mar
-04
Jun-
05Se
p-06
Dec
-07
Mar
-09
Jun-
10
Mar
-04
Jun-
05Se
p-06
Dec
-07
Mar
-09
Jun-
10
House prices Benchmark prices
House Prices and Benchmark Prices, PRC Mass Market
Tianjin Guangzhou
Source: NDRC and IMF staff calculations.
Figure 8c: Market prices and benchmark prices, high-end, China (1)
Figure 8d: Market prices and benchmark prices, high-end, China (2)
15000
25000
35000
45000
55000
65000
75000
Sep-
04
Dec
-05
Mar
-07
Jun-
08
Sep-
09
Sep-
04
Dec
-05
Mar
-07
Jun-
08
Sep-
09
House prices Benchmark prices
House Prices and Benchmark Prices, PRC High-End
Beijing Shanghai
Source: DTZ Property Research, NBS and IMF staff calculations.
13000
18000
23000
28000
33000
38000
43000
Jun-
05S
ep-0
6D
ec-0
7M
ar-0
9Ju
n-10
Jun-
05S
ep-0
6D
ec-0
7M
ar-0
9Ju
n-10
House prices Benchmark prices
House Prices and Benchmark Prices, PRC High-End
Nanjing Hangzhou
Source: DTZ Property Research, NBS and IMF staff calculations.
Sources: CEIC Data Company Ltd.; NDRC; NBS; DTZ Property Research; OECD; and IMF staff calculations.
12
IV. ARE HONG KONG RESIDENTIAL PROPERTIES ALREADY OVERVALUED?
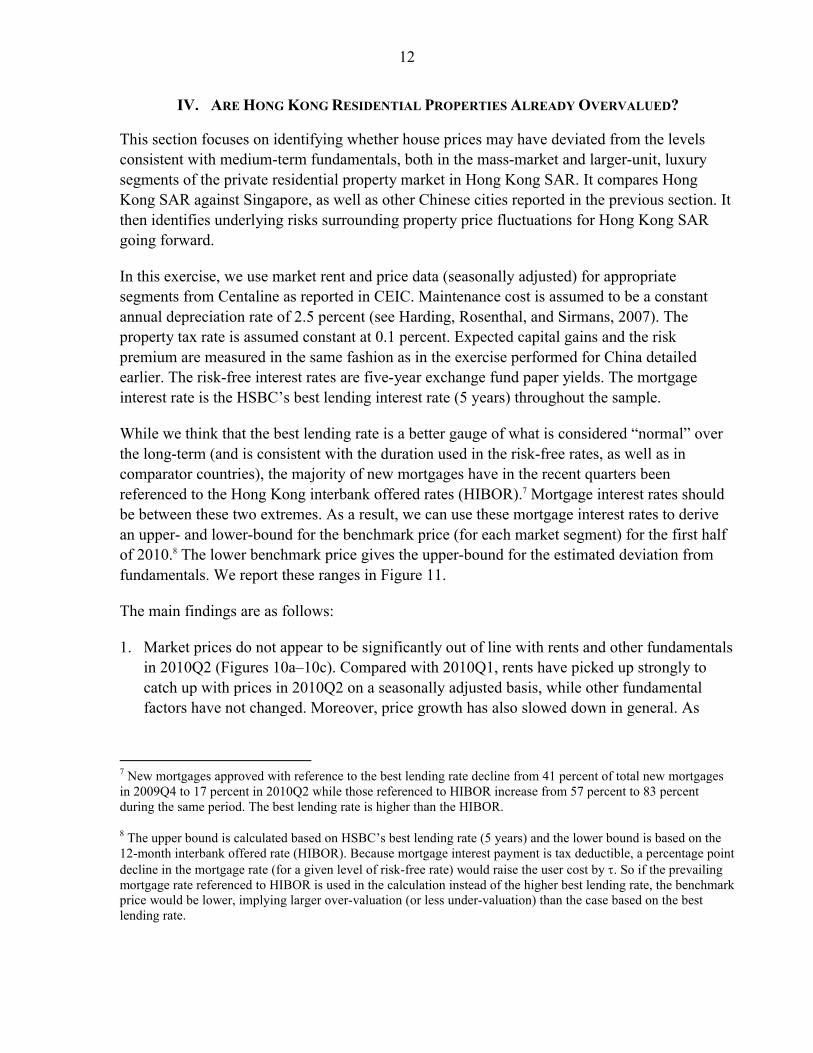
This section focuses on identifying whether house prices may have deviated from the levels consistent with medium-term fundamentals, both in the mass-market and larger-unit, luxury segments of the private residential property market in Hong Kong SAR. It compares Hong Kong SAR against Singapore, as well as other Chinese cities reported in the previous section. It then identifies underlying risks surrounding property price fluctuations for Hong Kong SAR going forward.
In this exercise, we use market rent and price data (seasonally adjusted) for appropriate segments from Centaline as reported in CEIC. Maintenance cost is assumed to be a constant annual depreciation rate of 2.5 percent (see Harding, Rosenthal, and Sirmans, 2007). The property tax rate is assumed constant at 0.1 percent. Expected capital gains and the risk premium are measured in the same fashion as in the exercise performed for China detailed earlier. The risk-free interest rates are five-year exchange fund paper yields. The mortgage interest rate is the HSBC’s best lending interest rate (5 years) throughout the sample.
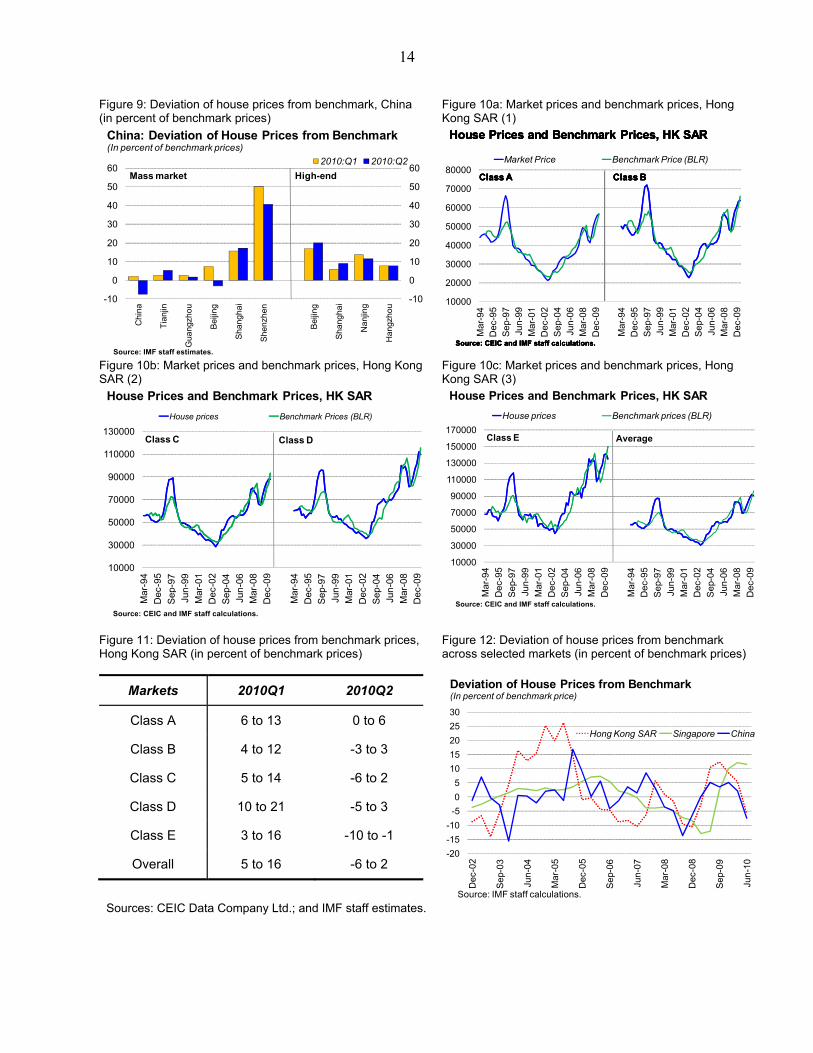
While we think that the best lending rate is a better gauge of what is considered “normal” over the long-term (and is consistent with the duration used in the risk-free rates, as well as in comparator countries), the majority of new mortgages have in the recent quarters been referenced to the Hong Kong interbank offered rates (HIBOR).7 Mortgage interest rates should be between these two extremes. As a result, we can use these mortgage interest rates to derive an upper- and lower-bound for the benchmark price (for each market segment) for the first half of 2010.8 The lower benchmark price gives the upper-bound for the estimated deviation from fundamentals. We report these ranges in Figure 11.
The main findings are as follows:
1. Market prices do not appear to be significantly out of line with rents and other fundamentals in 2010Q2 (Figures 10a–10c). Compared with 2010Q1, rents have picked up strongly to catch up with prices in 2010Q2 on a seasonally adjusted basis, while other fundamental factors have not changed. Moreover, price growth has also slowed down in general. As
7 New mortgages approved with reference to the best lending rate decline from 41 percent of total new mortgages in 2009Q4 to 17 percent in 2010Q2 while those referenced to HIBOR increase from 57 percent to 83 percent during the same period. The best lending rate is higher than the HIBOR.
8 The upper bound is calculated based on HSBC’s best lending rate (5 years) and the lower bound is based on the 12-month interbank offered rate (HIBOR). Because mortgage interest payment is tax deductible, a percentage point decline in the mortgage rate (for a given level of risk-free rate) would raise the user cost by τ. So if the prevailing mortgage rate referenced to HIBOR is used in the calculation instead of the higher best lending rate, the benchmark price would be lower, implying larger over-valuation (or less under-valuation) than the case based on the best lending rate.
13
such, in 2010Q2, prices are broadly in line with the level that would be consistent with fundamentls (Figure 11).
2. Over the past decade, prices have corrected frequently and deviation from benchmark prices tend to disappear relatively fast in Hong Kong SAR, much like what is observed in Singapore’s private apartment market (around five quarters)9 (Figure 12).
Hong Kong SAR’s property market has a strong equilibriating tendency and anomalies between prices, rents and other fundamental factors are quickly eliminated. In fact, we estimate a half life of such deviation to be as small as around two and four quarters for Hong Kong SAR Class E and Class A property types, respectively, with the rest hovering in between.10
As such, our model would tell us that market prices should continue to rise toward high benchmarks, since there are currently strong incentives for funds to enter the housing market given the low ownership cost and rapid increase in rents. This is particularly true given the likelihood that real interest rates will stay low for an extended period, given the Fed’s continued easing and a recent pickup in inflation in Hong Kong SAR. The tug of war between the underlying low carrying cost and prudential control should continue as policy measures attempt to lower the public’s expectation of future house price appreciation. Meanwhile, fundamental factors of demand and supply suggest that the market will remain tight since near-term supply is inflexible.11 This would appear to support continued robust increases in benchmark (and market) prices in the smaller unit, mass market segment. Given that market is less tight at the higher end, should price inflation persist at a high rate in the future, measures to cool down the property market aiming to raise ownership cost in this segment may be warranted.
9 Singapore’s housing price (here, private apartments) currently appears to show sign of an incipient stage of mispricing in 2010H1, based on our indicator.10 The AR coefficient ranges from 0.7 for Class E progressively up to 0.83 for Class A.11 Forecast for 2010–11 shows tight supply of residential flats for Hong Kong and Kowloon areas and expansion in New Territories compared to 2008-9 (indeed, back to high levels seen in 2006–07). See completion and forecast data from Tables 5–7 in Hong Kong Property Review 2010, Rating and Valuation Department, the Government of Hong Kong SAR.
14
Figure 9: Deviation of house prices from benchmark, China (in percent of benchmark prices)
Figure 10a: Market prices and benchmark prices, Hong Kong SAR (1)
-10
0
10
20
30
40
50
60
-10
0
10
20
30
40
50
60
Chi
na
Tian
jin
Gua
ngzh
ou
Bei
jing
Sha
ngha
i
She
nzhe
n
Bei
jing
Sha
ngha
i
Nan
jing
Han
gzho
u
2010:Q1 2010:Q2
China: Deviation of House Prices from Benchmark(In percent of benchmark prices)
Source: IMF staff estimates.
Mass market High-end
10000
20000
30000
40000
50000
60000
70000
80000
Mar
-94
Dec
-95
Sep
-97
Jun-
99M
ar-0
1D
ec-0
2S
ep-0
4Ju
n-06
Mar
-08
Dec
-09
Mar
-94
Dec
-95
Sep
-97
Jun-
99M
ar-0
1D
ec-0
2S
ep-0
4Ju
n-06
Mar
-08
Dec
-09
Market Price Benchmark Price (BLR)
House Prices and Benchmark Prices, HK SAR
Class A Class B
Source: CEIC and IMF staff calculations.
House Prices and Benchmark Prices, HK SAR
Class A Class B
Source: CEIC and IMF staff calculations.
House Prices and Benchmark Prices, HK SAR
Class A Class B
Source: CEIC and IMF staff calculations.
House Prices and Benchmark Prices, HK SAR
Class A Class B
Source: CEIC and IMF staff calculations.
Figure 10b: Market prices and benchmark prices, Hong Kong SAR (2)
Figure 10c: Market prices and benchmark prices, Hong Kong SAR (3)
10000
30000
50000
70000
90000
110000
130000
Mar
-94
Dec
-95
Sep
-97
Jun-
99M
ar-0
1D
ec-0
2S
ep-0
4Ju
n-06
Mar
-08
Dec
-09
Mar
-94
Dec
-95
Sep
-97
Jun-
99M
ar-0
1D
ec-0
2S
ep-0
4Ju
n-06
Mar
-08
Dec
-09
House prices Benchmark Prices (BLR)
House Prices and Benchmark Prices, HK SAR
Class C Class D
Source: CEIC and IMF staff calculations.
10000
30000
50000
70000
90000
110000
130000
150000
170000
Mar
-94
Dec
-95
Sep
-97
Jun-
99M
ar-0
1D
ec-0
2S
ep-0
4Ju
n-06
Mar
-08
Dec
-09
Mar
-94
Dec
-95
Sep
-97
Jun-
99M
ar-0
1D
ec-0
2S
ep-0
4Ju
n-06
Mar
-08
Dec
-09
House prices Benchmark prices (BLR)
House Prices and Benchmark Prices, HK SAR
Class E Average
Source: CEIC and IMF staff calculations.
Figure 11: Deviation of house prices from benchmark prices, Hong Kong SAR (in percent of benchmark prices)
Figure 12: Deviation of house prices from benchmark across selected markets (in percent of benchmark prices)
Markets 2010Q1 2010Q2
Class A 6 to 13 0 to 6
Class B 4 to 12 -3 to 3
Class C 5 to 14 -6 to 2
Class D 10 to 21 -5 to 3
Class E 3 to 16 -10 to -1
Overall 5 to 16 -6 to 2-20-15-10
-505
1015202530
Dec
-02
Sep-
03
Jun-
04
Mar
-05
Dec
-05
Sep-
06
Jun-
07
Mar
-08
Dec
-08
Sep-
09
Jun-
10Hong Kong SAR Singapore China
Source: IMF staff calculations.
Deviation of House Prices from Benchmark (In percent of benchmark price)
Sources: CEIC Data Company Ltd.; and IMF staff estimates.

15
V. WHAT ARE THE POLICY IMPLICATIONS?
While there is no sign of significant over-valuation of residential property prices in Hong Kong SAR in the second quarter of 2010, there is a risk that property values can deviatefrom fundamentals in the environment of strong credit growth and low interest rates.
On top of low real interest rates and independent of leverage, China’s households are more likely than others to be natural buyers of real estate in Hong Kong SAR. They are more likely to be optimistic from past experience of robust growth, have no other investment alternatives for high saving, and prefer collateralizable assets without significant tax consequence on their value. Strong tendency for the wealthy in Mainland China to own property in Hong Kong SAR would continue to lead to significant spill-over into Hong Kong SAR’s property market, given the attempt to clamp down on price speculation there.
As property prices rise beyond fundamentals, an abrupt shift to home buyers’ degree of optimism, rising ownership cost, and disruption to buyers’ ability to borrow could cause a significant fall in prices. Internationally, it is typically the case that real interest rates rise just before a housing bust (IMF, 2003).
When prices fall, there is a risk that they then undershoot their fundamentals for a time damagingthe balance sheets of households, firms, financial intermediaries, and disrupting economic activity (notably real estate investment). At present, given the awareness of the risks, policymakers’ actions to lean against house price inflation through a multi-pronged strategy of stricter prudential rules on loan-to-value and debt service ratios, expand land supply for residential housing construction, and subsidized rent-to-own program for the middle class (the so-called sandwich class), the risk of a sharp and broad-based decline in real estate prices is low.
However, the link to U.S. monetary policy through the currency board implies that real interest rates are likely to remain low for some time. Containing housing prices and mitigating the risk of an asset price boom-bust cycle, therefore, will have to be met solely through a graduated, well-balanced strategy to coordinate expectation around a stable, slower price growth. Given near-term inflexibility of supply condition, this can only be done by pricing buyers out of the market until supply conditions adjust—through tight prudential standards by lowering loan-to-value (and making it inclusive of smaller units as well) and debt service ratios and relying more on fiscal measures (such as expanded provision of land, particularly for developing smaller units where supply conditions are especially tight).
VI. CONCLUSION
We have compared movements in Hong Kong SAR’s residential property prices with those implied by market fundamentals. Our approach to measuring equilibrium price is based on the relationship between price, rent, and ownership cost. Using these measures to provide benchmarks for tracking market prices, we characterize price deviation in comparator marketsas well as discuss similarities and differences with their experiences.
16
We have found that house prices do not appear to be out of line with fundamentals during the second quarter of 2010. Moreover, over the past decade, house prices have corrected frequently in Hong Kong SAR. By and large, our indicators of price misalignment in Hong Kong SAR show less persistence than that was observed in advanced economies before 2008, especially the U.S., New Zealand, and France. In those cases, price misalignments persisted for a number of years and vulnerabilities were able to accumulate, ending in a large, abrupt adjustment in prices.Recent announcements of regulatory changes in Hong Kong SAR also appear to have been effective in tempering price growth. Going forward, to prevent excessive optimism from taking hold in high liquidity environment and given the currency board regime, the authorities will need to rely solely on tight prudential standards as well as fiscal measures to help mitigate the asset price boom, and insulate the balance sheets of households and banks from damage when interest rates rise in the future.
17
References
Ahuja, A. et al., 2010, “Are house prices rising too fast in China?,” IMF Working Paper (forthcoming), (Washington: International Monetary Fund).
Fostel, A., and J. Geanakoplos, 2008, “Leverage cycles and the anxious economy,” American Economic Review 98:4, pp. 1211–44.
Geanakoplos, J., 2010, “The leverage cycle,” Cowles Foundation Discussion Paper No. 1715R, Yale University, New Haven, (January).
Geanakoplos, J., 2010, “Solving the present crisis and managing the leverage cycle,” Cowles Foundation Discussion Paper No. 1751, Yale University, New Haven, (January).
Harding, J., S. Rosenthal, and C. Sirmans, 2007, “Depreciation of housing capital, maintenance and house price inflation: Estimates from a repeat sales model,” Journal of urban Economics, 61:2 (March), pp. 193–217.
Himmelberg, C., C. Mayer, and T. Sinai, 2005, “Assessing high house prices: Fundamentals and misperceptions,” Journal of Economic Perspective, 19:4, (Fall), pp. 67–92.
Hong Kong Property Review 2010, Rating and Valuation Department, the Government of Hong Kong SAR.
IMF, 2003, “When Bubbles Burst,” in World Economic Outlook April 2003: Growth and Institutions, World Economic and Financial Surveys, (Washington:International Monetary Fund), Chapter 2.
Poterba, J., 1984, “Tax subsidies to owner-occupied housing: An asset market approach,” Quarterly Journal of Economics, 99:4, pp. 729–52.
Shin, H. S., 2009, “Discussion of ‘The Leverage Cycle’,” paper prepared for the 2009 NBER Macroeconomic Annual. (June).
18
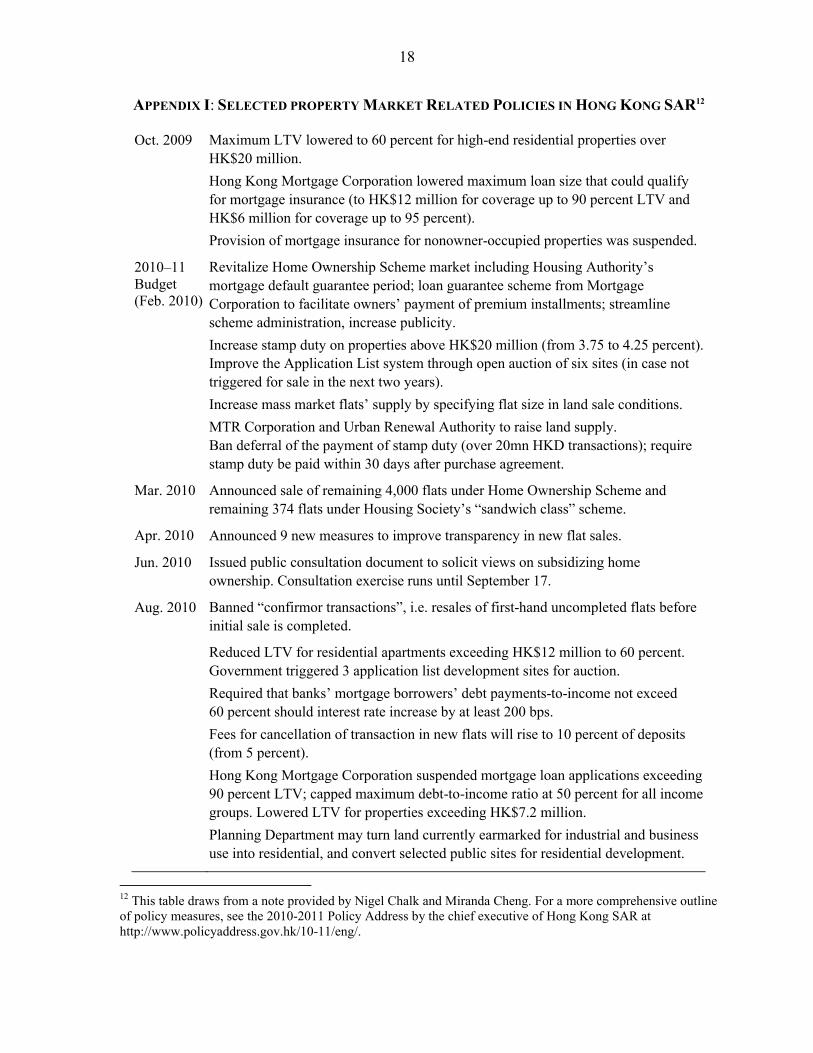
APPENDIX I: SELECTED PROPERTY MARKET RELATED POLICIES IN HONG KONG SAR12
Oct. 2009 Maximum LTV lowered to 60 percent for high-end residential properties over HK$20 million. Hong Kong Mortgage Corporation lowered maximum loan size that could qualify for mortgage insurance (to HK$12 million for coverage up to 90 percent LTV and HK$6 million for coverage up to 95 percent).Provision of mortgage insurance for nonowner-occupied properties was suspended.
2010–11 Budget (Feb. 2010)
Revitalize Home Ownership Scheme market including Housing Authority’s mortgage default guarantee period; loan guarantee scheme from Mortgage Corporation to facilitate owners’ payment of premium installments; streamline scheme administration, increase publicity.Increase stamp duty on properties above HK$20 million (from 3.75 to 4.25 percent).Improve the Application List system through open auction of six sites (in case not triggered for sale in the next two years).Increase mass market flats’ supply by specifying flat size in land sale conditions. MTR Corporation and Urban Renewal Authority to raise land supply.Ban deferral of the payment of stamp duty (over 20mn HKD transactions); require stamp duty be paid within 30 days after purchase agreement.
Mar. 2010 Announced sale of remaining 4,000 flats under Home Ownership Scheme and remaining 374 flats under Housing Society’s “sandwich class” scheme.
Apr. 2010 Announced 9 new measures to improve transparency in new flat sales.
Jun. 2010 Issued public consultation document to solicit views on subsidizing home ownership. Consultation exercise runs until September 17.
Aug. 2010 Banned “confirmor transactions”, i.e. resales of first-hand uncompleted flats before initial sale is completed.
Reduced LTV for residential apartments exceeding HK$12 million to 60 percent. Government triggered 3 application list development sites for auction.Required that banks’ mortgage borrowers’ debt payments-to-income not exceed 60 percent should interest rate increase by at least 200 bps.Fees for cancellation of transaction in new flats will rise to 10 percent of deposits (from 5 percent).Hong Kong Mortgage Corporation suspended mortgage loan applications exceeding 90 percent LTV; capped maximum debt-to-income ratio at 50 percent for all income groups. Lowered LTV for properties exceeding HK$7.2 million.Planning Department may turn land currently earmarked for industrial and business use into residential, and convert selected public sites for residential development.
12 This table draws from a note provided by Nigel Chalk and Miranda Cheng. For a more comprehensive outlineof policy measures, see the 2010-2011 Policy Address by the chief executive of Hong Kong SAR at http://www.policyaddress.gov.hk/10-11/eng/.
19
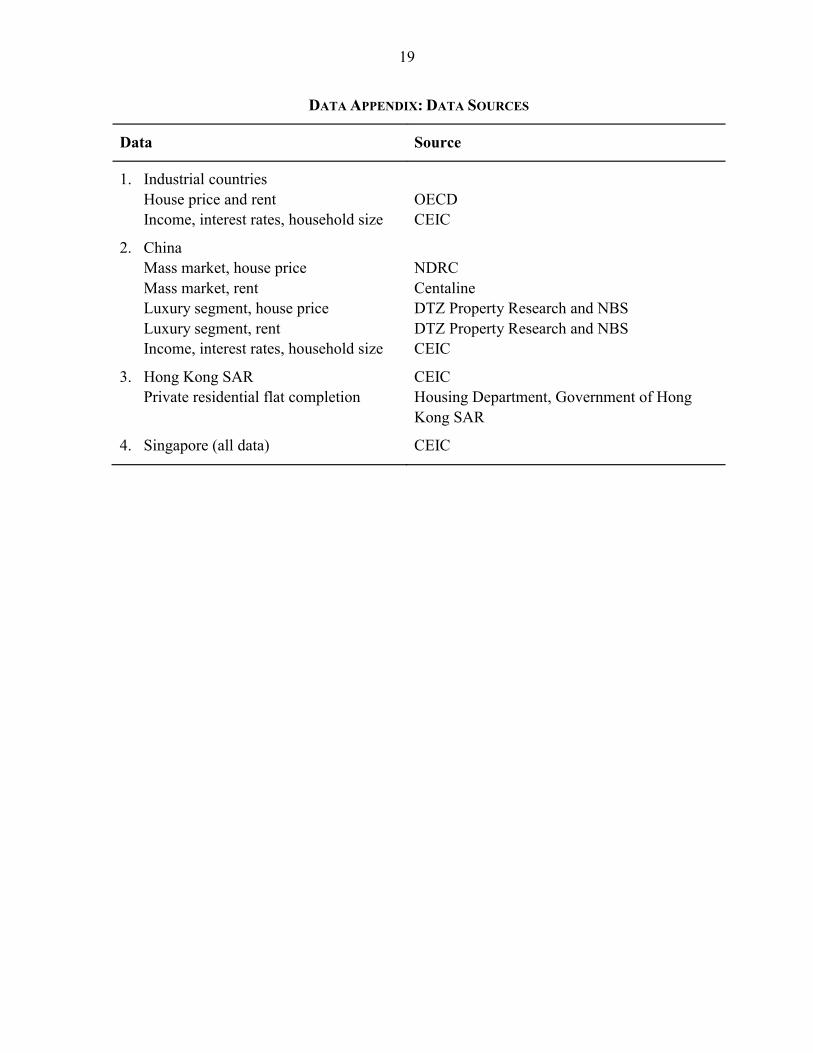
DATA APPENDIX: DATA SOURCES
Data Source
1. Industrial countries House price and rent OECDIncome, interest rates, household size CEIC
2. ChinaMass market, house price NDRCMass market, rent CentalineLuxury segment, house price DTZ Property Research and NBSLuxury segment, rent DTZ Property Research and NBSIncome, interest rates, household size CEIC
3. Hong Kong SAR CEICPrivate residential flat completion Housing Department, Government of Hong
Kong SAR
4. Singapore (all data) CEIC