Embed Size (px)
Citation preview

Draft, June 2007
ARE ELITE UNIVERSITIES LOSING
THEIR COMPETITIVE EDGE?
E. Han Kim University of Michigan
Adair Morse
University of Chicago
Luigi Zingales*
University of Chicago, NBER, & CEPR
ABSTRACT
We study the location-specific component of research productivity for economics and finance faculty over the last three decades. We find that there was a positive effect of being affiliated with a top 25 university in the 1970s; this effect weakened in the 1980s and disappeared in the 1990s. We decompose the elite university fixed effect and find that its decline is due to the reduced importance of physical access to productive research colleagues. Our evidence suggests that the disappearance of the university fixed effect is due to innovations in communication technology. One implication of the de-localization of the spillover effect is that knowledge-based organizations should find it more difficult to capture rents vis-à-vis workers. We find that faculty salaries increased the most where the estimated spillover dropped the most. Despite the loss in local spillovers, elite universities still enjoy an edge in average productivity because of agglomeration of top researchers in prestigious institutions with high long-term research reputations. JEL Classification: D85, I23, J24, J31, J62, L23, L31, O33 Keywords: Faculty productivity, firm boundaries, knowledge-based industries, theory of the firm
*Email: [email protected]; [email protected]; [email protected] E. Han Kim acknowledges financial support from the Mitsui Life Financial Research Center at the University of Michigan; and Luigi Zingales, the CRSP center and the Stigler Center at the University of Chicago. We have greatly benefited from the comments/suggestions of Marianne Bertrand, Susan Dynarski, Caroline Hoxby, James Poterba, and seminar participants at Duke, Harvard, MIT, Northwestern, the University of Chicago, the University of Michigan, and the Society of Labor Economics Summer Meetings. We would like to thank Joyce Buchanan for editorial assistance and ESBCO Information Services and University Archives departments at Berkeley, Carnegie Mellon, Chicago, Columbia, Cornell, Duke, Harvard, Indiana, Michigan, MIT, Northwestern, NYU, OSU, Penn, Princeton, Purdue, Rochester, Stanford, Texas, Washington, UCLA, USC, Wisconsin, and Yale for faculty rosters.

Does a more productive firm make individual employees more productive, or is
the higher productivity of a firm just the result of its ability to attract more productive
individuals? If the former, do individuals become more productive because of positive
spillovers from talented colleagues, or can a firm’s organizational culture affect the
productivity of its members? Moreover, if more productive firms give rise to more
productive individuals, how are firms able to sustain this competitive edge over time?
Although these are important issues in the theory of the firm, they have not been
thoroughly studied empirically because of the difficulty in measuring individual
productivity: For most firms, the observable product is the result of a conglomeration of
inputs from many individuals. Such conglomeration makes the task of disentangling
individual productivity virtually impossible. One environment, however, in which it is
possible to assign the firm observable output to individual members is that of university
research, where individual output can be measured as the number of coauthor-adjusted
pages published in academic journals. The academic environment also allows us to
“value weight” production by using the impact ranking of the journal in which a paper is
published or the citations it receives
In this paper we attempt to address these theory-of-the firm questions by
examining research productivity in the top North American economics and finance
departments over the last three decades. (We focus on economics and finance faculty for
tractability, but our findings should apply generally beyond these fields.) To identify the
university fixed effect as separate from the individual fixed effect, we trace faculty moves
across universities by documenting the location of all faculty who have ever been
affiliated with the top 25 schools over the last three decades.
We find that in the 1970s, residence in an elite university had a sizeable impact on
individual productivity. During that time, a random economics faculty member moving
from a non-top five university to a top five university would see her productivity increase
by 1.68 American Economic Review (AER) impact-equivalent pages (our measure of
quality-adjusted productivity) per year from an average of 2.79 pages. This is a 60%
increase! In the 1990s, this effect all but disappeared. And the disappearance is not just a
top five phenomenon. Of the top 25 economics departments studied, 17 (5) had a
significantly positive (negative) impact on productivity in the 1970s. By the 1990s only 2
1

(9) had a significantly positive (negative) effect. In finance, 16 (3) had a positive
(negative) impact in the 1970s and 4 (7) for the 1990s. One might argue that
classification of 25 universities as being elite may be too broad. As a robustness check,
we run all of our estimations based on only top ten schools. The conclusions do not
change.
These results do not seem to stem from endogenous selection inherent in location
decisions. We carefully consider four selection stories -- quasi-retirement, non-
promotion, complementarities, and tournaments. The patterns of post-move changes in
productivity do not support any of these selection stories. Nevertheless, we formally
address possible selection bias in faculty moves by estimating a two-stage selection
model. We use a logit model to estimate the probability of moving as a function of age,
and a conditional logit model to estimate the probability of being at each location (given
a move) as a function of the desirability of each location for individual faculty.
Desirability is captured by the distance to the individual’s origin (defined as the location
of the undergraduate alma mater), and the relative productivity difference to incumbent
faculty. Using the predicted unconditional probability of being at a location as an
instrument for the university indicators, the results remain materially the same.
We then try to explain the cross sectional differences in the size of these
university fixed effects by relating them to the quality of colleagues in each department
and the differences in organizational culture. The quality of colleagues can generate
positive spillovers through the exchange of expertise and feedback among colleagues
(Laband and Tollison, 2000), including that from star faculty (Goyal et al., 2006;
Azoulay and Zivin, 2006). Not surprisingly, in the 1970s there was a strong positive team
effect on productivity, where team is measured as the (lagged) average productivity of
one’s departmental colleagues. The positive team spillover effect remained positive in the
1980s and disappeared in the 1990s. In addition, the presence of editors of a major
journal on the faculty had a positive effect in the 1970s, which turned into negative by
the1990s.
Organizational culture may likewise be important, but in this realm the influence
from colleagues may not always generate increases in research production. Our primary
measures of culture are the percentage of faculty in a department who have not published
2

in top journals in the recent past and the quality of the Ph.D. program. Non-publishing
faculty may set an example for others that re-directs journal-targeted research to other
activities, which may be important for the department but are not gauged as research
production in our definition. The percentage of non-productive colleagues has a strong
negative effect on the university fixed effect. The quality of the PhD program does not
seem to matter (if anything, its impact is negative). Although important in explaining the
university fixed effects, organizational culture does not explain the decline of the
university fixed effects over the last three decades.
We conjecture that the loss of elite university effects is due to advances in
information technology. While collaboration across universities was common even in the
1970s, local interaction was very important. Communication at a distance was costly
from a monetary and a technical point of view. We argue that the internet and the
concomitant decline in communication costs have changed the localized nature of
research interaction, giving faculty in remote places access to the latest development in
their research area and tools for communicating with distant colleagues for collaboration
and feedback. Throughout the period, the costs of long distance telephone calls and
airfares have declined, easing the burden of voice and person-to-person communication.
Early innovations for exchanging written work included faxes and overnight mail
deliveries. The arrival of the internet in the 1990s, however, initiated a new era of
communication and access to others’ research. Agrawal and Goldfarb (2006) show that
the adoption of the Bitnet (the predecessor to the internet) significantly increased
engineering research collaboration among US universities.
There are, of course, alternative explanations for the disappearance of the
university fixed effects. A simpler explanation is that the quality of the faculty at other
universities is catching up to the top academic universities. Our data tell a different story;
the difference in average individual faculty productivity between the top 25 universities
and the others has increased (not decreased) in the last three decades. Elite universities
seem to attract and retain the most productive researchers, even though these universities
do not make their faculty more productive. We find that top researchers tend to
agglomerate in institutions with prestigious undergraduate programs and in departments
with high past research reputations. This is analogous to the explanation proposed by
3

Glaeser and Berry (2005) for why highly educated cities tend to become even more
highly educated. Such agglomeration may be due to the academic equivalent of Glaeser’s
(2000) non-market interaction; namely, the utility and the prestige of co-location with
other creative minds.
Another possible explanation is that a sudden shift in the production frontier
created a first mover advantage in the 1970s which slowly eroded in the subsequent two
decades. While this explanation is plausible for finance, which really took off as a
separate field in the 1960s, this cannot be true for economics because it was a well-
established discipline four decades ago.
A final possible explanation is related to Ellison (2006). He finds a trend among
Harvard faculty toward forgoing the publication process that for them carries fewer
advantages in terms of visibility as a result of internet article dissemination. If this trend
results in a reduction of our measured productivity of all top department faculty, it could
explain the decrease in the university fixed effect. When we look at the top 25 or top 5
departments, however, we do not see a reduction in average productivity during our
sample period.
Since the alternative explanations are inconsistent with the data, we probe deeper
into the information technology based explanation and test whether the evidence is
consistent with its natural implications. The most direct implication is that the spillover of
having better research colleagues declined over the sample period. Indeed, this is what
we find. Co-authorship at a distance rises steadily during the period, perhaps due to the
reduced barriers stemming from innovations in communications technology. Among all
articles published in the top 41 journals written by scholars residing at a top 25 school,
the percentage of co-authored papers with colleagues in a non-elite school nearly
doubled, from about 32% in the beginning of the 1970s to 61% by 2004, suggesting that
it has become much easier for authors at non-elite universities to access scholars at elite
universities.
These findings are consistent with Laband and Tollison (2000), Rosenblat and
Mobius (2004), Goyal, Van Der Leij, and Moraga (2006), and Agrawal and Goldfarb
(2006) who show that decreasing communication costs have increased distant
collaboration in academia and opened vast research networks. Furthermore, Laband and
4

Tollison (2000) show that formal collaboration (co-authoring) is not replacing the
growing role of informal intellectual feedback on article preparation from a distance. This
finding is consistent with our evidence that proximity is no longer required for spillovers
in research production.
These findings are consistent with Oyer (2006) results for the 1990s. He cleverly
uses the tightness in labor market conditions to identify the benefit that a freshly minted
economic PhDs receive from being placed at the beginning of his career in a top
department. He finds that a top placement has long term benefits in term of career, but he
finds no benefit in term of enhanced productivity, supporting the view that top
departments have no productivity externalities in the 1990s.
The de-localization of the spillover generated by more productive researchers has
important implications in academia. First, it makes the position of leading universities
less stable. De-localization of production spillovers renders faculty more mobile, making
it easier for a new university to attract the most talented researchers with higher salaries.
This is the second important effect. When spillover was localized, universities could
more easily appropriate the rents (see Mailath and Postelwaite, 1990). Today, with
universal access to knowledge, this may no longer be the case. We find evidence
consistent with this prediction in the average salaries at different institutions: Between the
1970s and the 1990s, faculty salaries increase the most at universities where the estimated
spillover drops the most.
These results have implications outside of academia as well. Traditionally,
physical access to the firm was important for knowledge-based production. If – as the
faculty productivity data seem to show – innovations in communication technology have
made low-cost access at a distance possible for production purposes, then firms have lost
a powerful instrument to regulate and control the accumulation and utilization of
knowledge. Appropriating the return to investment in research and development will
become more difficult, and firms’ boundaries will become fuzzier. The implications
extend far beyond what we document here. A firm’s inability to contain spillovers may
force us to rethink the legal boundaries of the firm, changing our current views of
employment and competition.
5

The rest of this paper proceeds as follows. Section I presents the data. Section II
reports estimation of the university fixed effects, followed by an examination of potential
selection biases influencing the results in Section III. Section IV decomposes university
fixed effects onto institution-wide characteristics, while Section V explores different
explanations for the disappearance of university fixed effects. Section VI concludes.
I. Data
To study the effect of location on research productivity, we collect data on individual
research productivity for a large panel of faculty. Special care is exercised to ensure that
we identify the location of faculty during the production of articles, not at the publication
date. Additionally, we cautiously choose measures of productivity that are comparable
over three decades and use alternative measures for robustness checks.
A. Faculty sample selection
Because it is difficult to collect career information for all academic fields, we
restrict our attention to the fields of economics and finance, our areas of research interest.
Because location-specific effects are likely to be strongest among top universities, our
analysis is focused on top research institutions. We collect data on research productivity
for all individuals who ever have been affiliated (tenure track or visiting) with the top 25
universities over years 1970-2001.
To choose the top 25 universities, we average university research rankings
provided by eleven previous studies. These studies employ a broad range of
methodologies and journals to rank departments over 1970-2001 sub-periods. Relying on
these studies alleviates some of the subjectivity inherent in using a single ranking
methodology. Table 1, Panel A lists the sub-periods covered and the methodologies used
by the eleven studies.
Using the Borda Count method (de Borda, 1781) to average the rankings from the
eleven studies, a university that is ranked first in a study is given 20 points; the second
ranked university is allocated 19 points, and so on. We then average the rankings,
individually for finance and economics, weighting each study’s allocated points by the
number of years covered by the study. The scores for finance and economics are
6

averaged (with equal weighting) for each university. The average reported in Table 1,
Panel B, shows a natural break point in score magnitude at the twenty-fifth university.1
Faculty affiliation is based on where individuals self-report their location each
year, not the affiliation reported in published articles. Identifying the physical location of
individuals during the production process is crucial to estimate a university effect on
productivity. Thus we undertake a painstaking three-step procedure to manually compile
the appropriate faculty affiliation.
First, we extract curriculum vitaes (cv’s) from websites for finance and
economics faculty currently employed by the top 25 universities.2 Second, we look at
each individual’s cv for every economics and finance faculty for all universities included
in Business Week’s top 100 business schools and the National Research Council’s top
100 economics programs for 2002 (a total of 138 additional universities). If an individual
in the additional universities ever held a position in any of our top 25 universities, that
person is included in the dataset. Third, we capture faculty who moved to other
professions, retired, or passed away during our sample period by contacting the archives
of each of our 25 universities to request a faculty roster for the economics and finance
departments over 5-year intervals starting in 1973; namely, 1973, 1978, 1983, and 1988.3
These archives and obituary records, supplemented with the Hasselback-Prentice Hall
Guide to the Finance Faculty for 1993, provide the majority of missing names for the
earlier periods.
From faculty cv’s, we extract individuals’ university affiliations and position
ranks over time, as well as doctoral and undergraduate degree institutions and graduation
years. When the websites publish only biographical sketches that do not contain the full
historical detail, we fill in unavailable data following a series of procedures. We email a
subset of individuals to request their full vitae. We also use relevant statistics derived
from the set of full cv’s of other faculty members to fill in estimates of the missing
1 The average of finance and economics rankings may result in the inclusion of schools which would not be ranked highly in one of the two departments. For example, Princeton has no finance department but still made the top 25 because of its high ranking in economics. 2 This work was conducted during the period May, 2003 to March, 2004. 3 A few universities were unable to supply us with the archive reports. For these schools, we searched the university websites for records of department retirements and obituaries from the 1970s and 1980s.
7

variables.4 The result of our efforts is a dataset of 3,262 faculty members whose careers
touch over 800 universities.
B. Publication sample selection
Measuring research productivity requires selecting a reasonable number of
economics and finance journals. To avoid making choices based on our priors, we use all
of the 36 economics journals and the top five of the finance journals used by the ranking
studies summarized in Panel A of Table 1.5 We exclude all but the top five finance
journals in an effort to equalize the minimum quality standard across finance and other
economic subfields. This is important because the calculations of productivity are pooled
across all economics subfields, including finance. Inclusion of top five finance journals
results in a roughly equivalent average (impact-weighted) productivity between finance
and economics faculty.
We obtain article information for the period 1970-2004 from two sources. Our
primary source of data is EBSCO Information Services, a publication data vendor. The
4 Missing Ph.D. years are replaced with the first year that the person appears as an assistant professor in our database. If the first assistant professor year is 1970, which is the start date for our database, or if the person is never an assistant professor in our database, the Ph.D. year is replaced with the undergraduate graduation year plus 6 years, the median time between degrees in our sample of full cv’s. Likewise, missing undergraduate graduation years are inferred from the Ph.D. year. If we are unsure of promotion years, we infer promotion dates using the university department’s decade average time spent in each promotion rank, which is again computed from our sample of full cv’s for that university. Finally, if the individual retired, passed away, or otherwise disappeared such that we are unable to locate a website or a cv at all (less than 10% of the cases), we infer institutional attachment via affiliations cited on journal articles. 5 The list of 36 economics journals comes from the union of all journals covered by the studies shown in Panel A of Table 1 (except the studies using the universe of Social Science Citation Index or EconLit journals). The 36 economics journals are American Economic Review, Econometrica, Economic Development and Cultural Change, Economic Inquiry, Economic Journal, Economica, European Economic Review, Industrial and Labor Relations Review, International Economic Review, Journal of American Statistical Association, Journal of Business, Journal of Business and Economic Statistics, Journal of Development Economics, , Journal of Econometrics, Journal of Economic Dynamics and Control, Journal of Economic History, Journal of Economic Theory, Journal of Finance, Journal of Financial Economics, Journal of Financial and Quantitative Analysis, Journal of Human Resources, Journal of International Economics, Journal of International Money and Finance, Journal of Labor Economics, Journal of Law and Economics, Journal of Law, Economics and Organization, Journal of Legal Studies, Journal of Monetary Economics, Journal of Money, Credit and Banking, Journal of Political Economy, Journal of Public Economics, Journal of Regional Science, Journal of Urban Economics, National Tax Journal, Oxford Economic Papers, Quarterly Journal of Economics, Rand Journal of Economics (Bell Journal), Review of Economic Studies, Review of Economics and Statistics, Review of Financial Studies, and Southern Economic Review..The top five finance journals according to Arnold, Butler, Crack, and Altintig (2003) are Journal of Finance, Journal of Financial Economics, Review of Financial Studies, Journal of Business, and Journal of Financial and Quantitative Analysis.
8

EBSCO download consists of 73,039 articles, representing 48,917 author names and
111,150 unique article-author observations.6 We hand match the EBSCO author names
to our list of 3,262 faculty to capture inconsistencies in naming conventions. Of the
111,150 article-author observations, 25,010 of them correspond to our list of faculty ever
affiliated with the top 25 universities. The second source of publication data is the ISI
Web of Science / Social Science Citation Index (SSCI) from which we collect citation
counts for each article.7
To approximate the timing when the actual work was performed, we lag the
publication date of articles to account for time spent in research and write-up, the peer
review process, and journal publication backlog. The lag adjustment is complicated by
journals having different lags in review and publication process. Fortunately, Ellison
(2002) calculates the decade average submission-to-acceptance time in months for 20
journals included in our sample. For the other journals, we use the average lag time of
the economics or finance journals included in Ellison.8 Ellison’s lag, however, does not
include the lag from acceptance to publication and from work to submission.
The lag between acceptance and publication varies depending on the journal
backlog. To estimate this lag, we look at two journals (the Review of Economic Studies
(RES) and the Journal of Financial Economics (JFE)) that report the acceptance date of
each paper. For each year in 1970-2002, we randomly select 15 articles from the RES
and JFE and calculate the mean lag time from submission to publication. Figure 1, Panels
A and B, present plots of these sampled lag times, depicted as the solid line. Ellison’s lag
times (the dashed line) are smaller because the sampled lag time includes Ellison’s
submission-to-acceptance estimate plus the publication backlog time. To account for the
time spent between acceptance and publication (seven months on average) and the time
6 EBSCO’s classification scheme allows us to discard comments, notes, book reviews, and other non-article publications. We discard articles with less than three pages and verify the page count and content for articles with three-four pages or page counts greater than 69. 7 The Web of Science data have several limitations. Often all but the first author are excluded from the author lists when the number of coauthors is greater than two (Alexander and Mabry, 1994) and the author first names are abbreviated. Although matching the abbreviated names to publications with precision is difficult, we circumvent the problem by mapping the journal issue and page range to the EBSCO data. 8More precisely, for finance journals not included in Ellison, we use the average of the Journal of Finance and the Journal of Financial Economics, the two finance journals covered by Ellison, for the 1980s and 1990. For the 1970s we only use the Journal of Finance lag because the JFE started in the mid-1970s and had an unrepresentatively short publication process time during the 1970s.
9
between the middle-of-writing and submission, we add one year to Ellison’s lag. Our
final lagging time is represented by the upper grey dashed line.
C. Productivity measures
After mapping publications to the year and place of production, we estimate a
measure of impact productivity in terms of AER equivalent pages custom-made to our
needs. The four most commonly used measures of academic productivity are counts of
articles written,9 raw counts of publication pages,10 citations to published articles,11 and
impact-weighted counts of pages where impact is gauged by the citations to the journal in
which the publication occurs.12 Each measure has strengths and weaknesses, which we
discuss briefly as we describe their calculation.13
The count of articles published is the simplest productivity measure and is
calculated by summing the number of articles each individual publishes in the 41 journals
each year. The shortcoming of this measure is its inability to distinguish impact and
length of articles: all of them count the same. The other, easier-to-address problem is that
it is a very discrete measure.
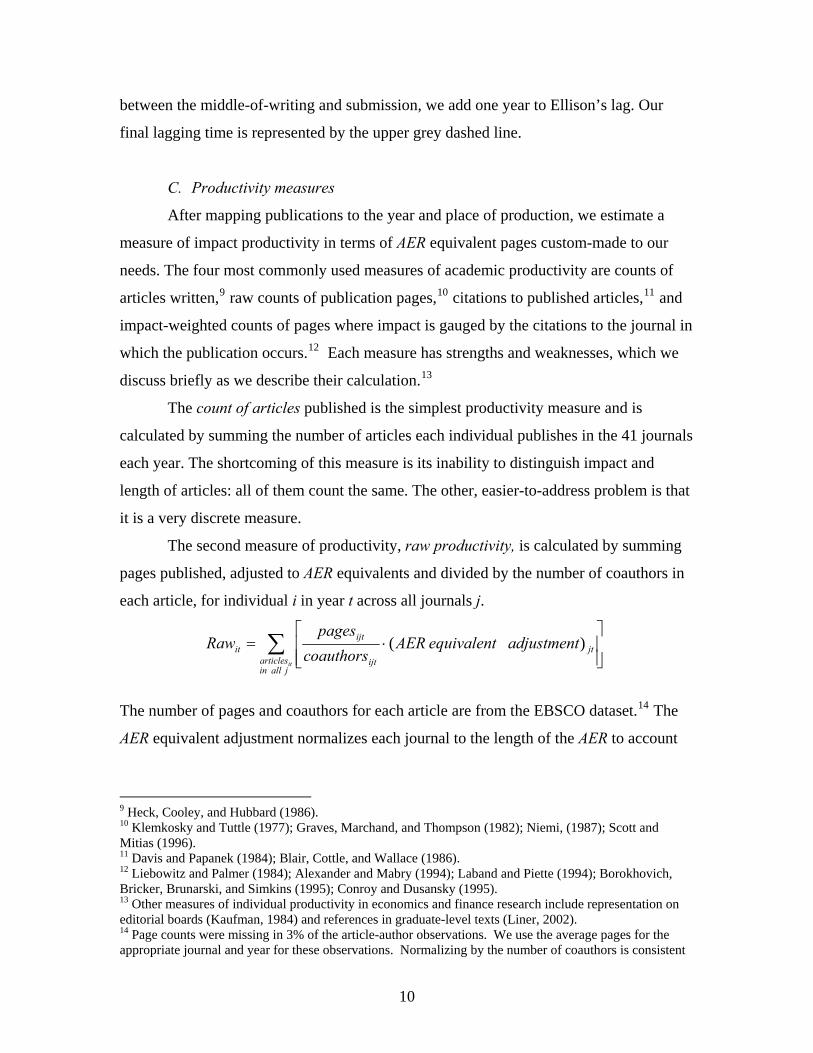
The second measure of productivity, raw productivity, is calculated by summing
pages published, adjusted to AER equivalents and divided by the number of coauthors in
each article, for individual i in year t across all journals j.
∑
⎥⎥⎦
⎤
⎢⎢⎣
⎡⋅=
j all inarticles
jtijt
ijtit
it
adjustment equivalent AERcoauthors
pagesRaw )(
The number of pages and coauthors for each article are from the EBSCO dataset.14 The
AER equivalent adjustment normalizes each journal to the length of the AER to account
9 Heck, Cooley, and Hubbard (1986). 10 Klemkosky and Tuttle (1977); Graves, Marchand, and Thompson (1982); Niemi, (1987); Scott and Mitias (1996). 11 Davis and Papanek (1984); Blair, Cottle, and Wallace (1986). 12 Liebowitz and Palmer (1984); Alexander and Mabry (1994); Laband and Piette (1994); Borokhovich, Bricker, Brunarski, and Simkins (1995); Conroy and Dusansky (1995). 13 Other measures of individual productivity in economics and finance research include representation on editorial boards (Kaufman, 1984) and references in graduate-level texts (Liner, 2002). 14 Page counts were missing in 3% of the article-author observations. We use the average pages for the appropriate journal and year for these observations. Normalizing by the number of coauthors is consistent
10

for different typesetting and conventions in article lengths. We follow Graves, Marchand,
and Thompson (1982) in normalizing both the average number of pages per article and
words per page to the AER.15 The normalization of raw to the AER equivalent allows
productivity assigned to an individual to be interpreted as the number of AER style pages
produced in a given year.
Raw page counts are simple to use and easy to understand, but they do not reflect
the quality of articles. One way to assess quality is to use the citation method, which
weights every article by its number of citations as recorded in the SSCI. Citations are
perhaps the most direct measure of an article’s influence. This method, however, has four
potential flaws, some of which are particularly severe for our purposes.
First, SSCI counts citations from hundreds of journals, not just from journals at
the forefront of the research in the field. Second, citations create a bias in terms of fields
and types of articles. For example, of all economics and finance articles published in the
41 major journals since 1970, 11 of the 20 most-cited articles are econometric foundation
papers, with White (1980) topping the list (see Kim, Morse, and Zingales (2006)).
Third, citations are highly skewed, magnifying possible misidentification of
faculty’s affiliation at a particular point in time. If the time lag applied from publication
to writing is incorrect for a ground-breaking article, a huge number of citations belonging
to one institution would be inappropriately credited to the wrong institution.
Groundbreaking articles are more susceptible to misidentification because they are more
likely to face longer than average delays in the publication process. Given the
disproportionate weights that these articles carry in terms of citations, an error would
have an enormous impact on the estimates. Even without a mistake, the influence factors
of high-citation observations would imply that a few observations completely determine
the OLS estimates, and that the variance of the estimates may tend towards infinity.16
The impact-weighted count of pages, impact productivity, is a compromise
between raw productivity and citation counts, incorporating key features of each. We
with the findings of Sauer (1988) that the salary return to papers coauthored by n authors is approximately 1/n the return of a solo authored paper. 15 In making the page count adjustment, we exclude the AER Proceedings issue. To obtain the word-per-page adjustment, we count the number of words for a standard, non-equation page for each of the 41 journals for three decade observations: 1975, 1985, and 1995. 16 We thank Glenn Ellison for pointing out this.
11

follow the non-iterated method of Liebowitz and Palmer (1984) and Laband and Piette
(1994), in which publication pages are credited to the individual faculty as in the raw
productivity calculation and the credit is weighted by the impact factor of the journal for
decade d. Impact productivity is defined as:
The impact factor for journal j in decade d is the number of citations to journal j
appearing in the references of all articles in the source journals s: s∈{1,…, 41}, defined
according to the formula:
We calculate decade impact factors for articles written in the middle of each of
the three decades. To allow for adequate time required for the writing, publication, and
dissemination of a paper, we choose reference years 1979, 1989, and 1999 for which we
manually count citations to journal j (citessjd) from references in each article of the 41
source journals. We do not include author self-citations. In total, we collect reference
counts for over 6,000 articles. To account for the fact that some journals contain more
articles and/or more pages per journal, we normalize the number of citations to each
journal by the number of pages published during the prior five years. By dividing the
normalized citations by those of AER for each decade, we obtain the impact factor for
journal j in decade d. We then weight the raw productivity by this impact factor, yielding
impact productivity, Impactit, which can be interpreted as the number of AER impact
equivalent pages.
We expend the extra effort to manually create impact factors instead of simply
relying on SSCI impact factors, which are based on citations from the universe of all
journals. The SSCI impact factors count only articles from the reference list published in
the prior two years and normalize by the number of articles published. In contrast, our
∑⎥⎥⎦
⎤
⎢⎢⎣
⎡⋅⋅=
j all inarticles
jdjtijt
ijtit
it
orImpactFactadjustment equivalent AERcoauthors
pagesImpact
,,
41,..,1
dAER
s in articles jd
sjd
jd orImpactFact
shedPagesPublicites
orImpactFact
∑ ⋅
= ∈
12

custom-made impact factors are based on citations from the 41 leading journals, use all
articles in the reference list, and normalize to the page length as well as number of
articles. This explains some slight differences in the two rankings.17
Table 2 shows impact factors and the decade rank of the impact factors for 36
economics journals and 5 finance journals (with the Journal of Business classified as a
finance journal) for the 3 decades. The ranking of journals is generally persistent, with a
Kendall’s tau-b rank correlation of approximately 0.70 across decades. 18
Laband and Piette (1994) report impact factors for roughly the same time periods
as our 1970s and 1980s calculations. Since we follow their character-based impact factor
model, the method of adjusting for article counts and page and font conventions is the
same. The methods differ, however, in their use of the larger set of SSCI journals, which
give more weight to lower-tier journals. Less substantially, their calculations also differ
in that we do not include comments and notes, whereas they do. In spite of these
differences, the correlation between our impact factor and theirs is 0.88 in the 1970s and
0.83 in the 1980s.
D. Summary statistics
Table 3 reports the summary statistics and correlations of the four canonical
measures of individual productivity. The mean raw productivity per faculty (6.3 pages)
is approximately double that of impact (3.1 pages) over the entire period. The average
number of articles is 0.62 per year. Both raw and impact measures increase from the
1970s to the 1980s, with a slight reversion in the 1990s. In contrast, article counts have 17 For example, the SSCI 1999 impact factor rankings list the QJE as the top economics journal whereas our impact ranking put the AER on the top. The difference is due to the fact that the QJE has more pages per article than the AER and has a larger ratio of recent to older citations. 18 Liebowitz and Palmer (1984) also develop an iterated impact factor method, which weights the citations to each journal according to the impact factor of the source journal citing the reference. Calculation of the iterated impact factor results in large impact factors for finance journals vis-à-vis general economics or, in particular, other economics subfields. Specifically, the Journal of Finance and the Journal of Financial Economics rank first and second in the 1990s under this method. Although this is interesting and warrants further study to examine the causes, the large finance impact factor makes it difficult to compare research productivity across economic subfields. If we were to use the iterated impact factors, an economics faculty publishing in a finance journal would be given more weight relative to her colleagues publishing in other subfields, making the comparison somewhat inequitable. The large finance impact factor is also partially due to insular citing within the finance field because, unlike other economics subfields, finance has a separate department. Finally, all the authors of this paper are from finance departments; thus, we would rather take the risk of underestimating the impact of finance rather than the risk of getting caught in a controversy over the relative impact of economics versus finance.
13

steadily declined from 0.75 in the 1970s to 0.53 in the 1990s. The medians are zero for all
three measures over all three decades.
The summary statistics for citations illustrate our reservation in using cites as a
productivity measure. The mean citation count for articles published in the 1990s (7.8
cites) is less than one-third of those of the two previous decades (27.5 cites, 25.7 cites),
demonstrating the timing problem that citations increase over time. Additionally, the
citation standard deviation for the 1970s is 4.4 times as large as the mean, whereas none
of the standard deviations for raw, impact, and article counts exceeds two times the
magnitude of the mean. The skewness for citations is approximately 14; for the other
measures, the skew ranges between 2 and 3.
Table 3, Panels B and C, present the correlations among the four productivity
measures. The rank correlations are very high (above 0.85) for all combinations of
measures. However, the Pearson correlations for citations with any of the other measures
are only half as large, although they remain positively significant and strong. The lower
linear correlations are due to the huge skewness in citations counts, validating our
decision to omit citations as a measure of productivity.
E. Productivity Comparability over Decades
Because we are interested in productivity over time, it is important that we are
able to compare a unit of productivity output across decades. To check the comparability
over time, we first consider the shifts in supply of and demand for manuscripts submitted
for publication during the three decades. The ratio of supply (the number of manuscripts
submitted) to demand (the number of articles published) in AER was 7.2 in the first five
years of the 1970s, almost doubling to 12.7 in the last five years leading to 2002.19 This
19 These data are from the Reports of the Editor published each year. The increase in manuscript submissions may be attributed to three possible sources – more time per faculty for preparing manuscripts, more faculty per university, and more universities participating in the publication market. Although difficult to quantify precisely, teaching loads have been reduced substantially over the three decades, allowing more time for research production. The growth in faculty per university can be estimated using the archive reports of faculty rosters. We find that the growth in the size of economics (finance) faculty for the top 25 schools is cumulatively 26% (69%) from 1973 to 2001. These figures capture only the intensive margin, ignoring the growth in the number of institutions with faculty submitting to top journals. Heck, Cooley, and Hubbard (1996) find that whereas 201 institutions are represented in the JF during 1966-1975, 270 institutions are represented in the 1975-1985 JF publications, corresponding to a 34% growth in the extensive margin for finance. Goyal et al. (2006) document that the number of authors publishing (not
14

suggests that a simple AER article count measure would undervalue productivity in 2000
relative to that in the 1970s. Consistent with this conjecture, Panel A in Table 3 shows a
steady decline in the average article counts over the three decades.
Countering this trend, however, is Ellison’s finding (2002) that a 2000 article is
twice as long as a 1970 article.20 Indeed, the number of pages per article has doubled for
the AER over the same period, making the ratio of pages submitted to pages published
roughly constant over time. Although this might suggest the use of raw productivity as
the time-comparable measure, this calculation does not factor in the increase in the
number of journals. Of the 41 journals in our sample, 17 did not exist in 1970. With the
additional pages supplied by the new journals, raw productivity will over-estimate
productivity in later years.
A compromise measure is found in impact productivity, which removes the effect
of the increase in number of journals. When a new journal arrives, it competes with
existing journals for citations, often diminishing the impact factor of other second-tier
journals. The impact productivity measure also diminishes article inflation because most
article inflation occurs in second-tier journals, which are given lower impact weights.
Consistent with this intuition, Table 3 shows that individual average impact productivity
has remained fairly constant over three decades. Thus we focus on impact productivity as
our main measure, and use raw and article counts for robustness checks.
II. Empirical Results
A. Average Faculty Productivity
Table 4 reports average individual productivity by university and decade in terms
of impact, raw, and article counts for the top 25 schools and others. All non-top 25
universities are clustered into a twenty-sixth university called other. At the bottom of the
table, we average productivities over all individuals in the top 25 and in the top 10 ranked
schools for that decade. The numbers indicate that faculty members are on average more
productive while at the top 10 and 25 universities than while at other universities, and the trying to publish) in existing EconLit journals rose from 22,960 in the 1970s to 32,773 in the 1990s, a 43% increase. 20 Ellison (2002) finds that the number of pages in the average economics article in top tier journals increases by 70-100% from the mid-1970s through the late 1990s. Consistently, the average article length in our data grows from 10.7 pages in 1970 to 21.9 in 2001, exactly doubling over the three decades.
15

difference in average productivity (shown in the bottom two rows) grows larger over
time. This suggests that there is no evidence in our sample period of the forgoing of the
publication process by top department faculty as suggested by Ellison (2006).
The statistics in Table 4 do not imply, however, that the top universities make
individuals more productive. The average productivity levels do not isolate the marginal
effect of universities (the university fixed effect) on individuals’ productivity above and
beyond what the individual brings. All we can conclude from the table is that more
productive researchers agglomerate to top universities, and that tendency has increased
over time. Whether the higher average individual productivity at the top schools is due to
a favorable marginal effect of the top universities on their faculty or simply reflects the
top universities’ ability to attract and retain more productive colleagues is the subject of
our investigation.
B. University Fixed Effects Methodology
To isolate the university fixed effect, the marginal impact that home institutions
have on individual productivity, we remove the individual characteristics affecting
productivity. Then we control for common factors influencing individual productivity –
primarily, experience and position rank. In essence, we view the university fixed effect as
that of a treatment; we would like to remove all other factors influencing productivity
such that we can compare treatments across universities.
A fairly general representation of the identification of productivity effects is given
in (1).
irfutirtirfutirfuty ε+β+α+θ= X (1) The subscripts index individuals (i: i∈1,…, 3262), position rank (r: r ∈ assistant
professor, associate professor, full professor, chaired full professor), fields (f: f ∈
economics, finance), universities (u: u ∈ {top 25 schools}, others), and years (t: t∈
1970,…, 2001). yirfut is the productivity (impact, raw, or article count) of individual i
during year t. θrfut is a general notation for the level effects of rank, field, university,
decade, and all of their interactions. In practice, we make some restrictions on the
interactions for tractability and describe them in Appendix 1.
16
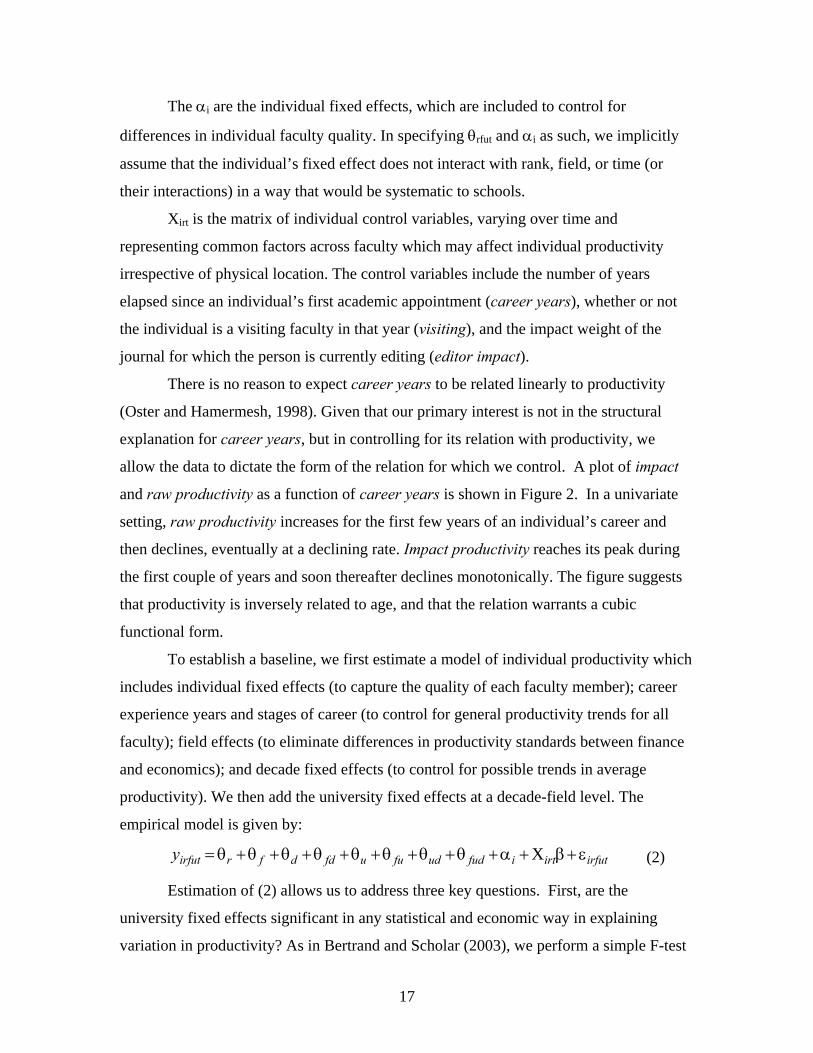
The αi are the individual fixed effects, which are included to control for
differences in individual faculty quality. In specifying θrfut and αi as such, we implicitly
assume that the individual’s fixed effect does not interact with rank, field, or time (or
their interactions) in a way that would be systematic to schools.
Xirt is the matrix of individual control variables, varying over time and
representing common factors across faculty which may affect individual productivity
irrespective of physical location. The control variables include the number of years
elapsed since an individual’s first academic appointment (career years), whether or not
the individual is a visiting faculty in that year (visiting), and the impact weight of the
journal for which the person is currently editing (editor impact).
There is no reason to expect career years to be related linearly to productivity
(Oster and Hamermesh, 1998). Given that our primary interest is not in the structural
explanation for career years, but in controlling for its relation with productivity, we
allow the data to dictate the form of the relation for which we control. A plot of impact
and raw productivity as a function of career years is shown in Figure 2. In a univariate
setting, raw productivity increases for the first few years of an individual’s career and
then declines, eventually at a declining rate. Impact productivity reaches its peak during
the first couple of years and soon thereafter declines monotonically. The figure suggests
that productivity is inversely related to age, and that the relation warrants a cubic
functional form.
To establish a baseline, we first estimate a model of individual productivity which
includes individual fixed effects (to capture the quality of each faculty member); career
experience years and stages of career (to control for general productivity trends for all
faculty); field effects (to eliminate differences in productivity standards between finance
and economics); and decade fixed effects (to control for possible trends in average
productivity). We then add the university fixed effects at a decade-field level. The
empirical model is given by:
irfutirtifududfuufddfrirfuty ε+β+α+θ+θ+θ+θ+θ+θ+θ+θ= X (2)
Estimation of (2) allows us to address three key questions. First, are the
university fixed effects significant in any statistical and economic way in explaining
variation in productivity? As in Bertrand and Scholar (2003), we perform a simple F-test
17

of joint statistical significance of university fixed effects en masse. In our case, this is
only the first, but necessary, step. If the university fixed effects are not significant, then
any additional tests would be irrelevant. Even a finding of no fixed effect would be
interesting, however, because it would suggest that the research environment has no
effect on individual productivity.
If the university fixed effects are significant, it raises another question: what
factors drive the university fixed effects? Is it organizational culture, spillovers from
colleagues, or perhaps weather and other locational factors that drive whether one
university is more conducive to research than another? The final question we address is
whether university fixed effects vary over time. Hopefully, this should give some
insights into the long term sustainability of comparative advantages.
C. University Fixed Effects Results
Table 5 reports the estimates of model (2) for impact productivity (columns 1 and
2), raw productivity (columns 3 and 4), and article count productivity (columns 5 and 6).
Article count productivity is estimated with a Poisson model to incorporate the count
nature of the data, and thus the coefficient magnitudes cannot be directly compared with
the other columns. Columns 2, 4, and 6 include university fixed effects, while columns 1,
3, and 5 do not.
An initial observation is that the effects of career experience, editorship, and
visiting status are not very sensitive to the choice of productivity measure. As already
shown in Figure 2, productivity is the highest in early career years. When we use the
estimates from columns 1, 3, and 5 to plot productivity over career years, we find that
impact productivity is highest during the rookie year. Raw and article count
productivities peak between the fourth and sixth year (not coincidentally the time of
tenure decision in most places) and drop monotonically afterwards. Age has a particularly
large negative influence on impact productivity. Even beyond the effect of rank, a faculty
member produces 1.8 fewer impact pages per year after 20 career years, a drop of 44%
from the rookie year (years zero and one). For raw productivity, the inference is a bit
smaller: the faculty produces 2.1 raw pages per year less than at the peak, a drop of 15%.
18

The fact that the impact productivity peaks at the rookie year and declines
thereafter provides a possible answer to the puzzle of why schools devote so much energy
and resources to recruit rookies when they can hire seasoned junior faculty with proven
track records and more polished teaching abilities. The standard answer used to be that
rookies have a higher option value. We provide a much simpler explanation: To hire
researchers at their peak, the optimal year is the rookie one.
Faculty with higher rank also seem to be less productive. Taking into account
career years and individual differences in talent, the marginal impact of being an
associate professor is one-half page less impact productivity compared to assistant
professors. The marginal impact of being a full professor is almost one page less; for a
chaired professor, it is one and one-third pages less. Since we are already controlling for
career years and since we do not have a measure for time devoted to other duties, it is
impossible to interpret these numbers in a causal way. We are interested in them only as
controls and note that all of our results are robust to their omission. Accounting for career
years and rank, the impact productivity of a chaired professor twenty years after the Ph.D.
is 75% lower than at the beginning of her career. With this result, we are only measuring
academic article productivity. Older faculty might produce in other ways, such as through
greater administrative service and mentoring junior faculty and doctoral students.
Editing a journal is not negatively associated with productivity. One possible
explanation is that editors are a select group; only active senior faculty become editors.
Hence, the editor variable captures not only the negative effect of the time commitment
to editing, but also the positive effect of remaining actively engaged in research despite a
relatively senior rank. Alternatively, it is possible that editors have expertise in writing
papers suited for the publication process and thus can maintain their productivity level in
spite of the time commitment required by the editorship.
The coefficients on the decade dummy variables in columns 1 and 5 show no
increase in impact or article count productivities for economics faculty from the 1970s to
the 1980s or 1990s. In contrast, the decade coefficients for raw productivity in column 3
are significantly positive. This result is due to the publication inflation inherent in raw
productivity described earlier. Thus we rely on the impact productivity hereafter to make
cross-decades comparisons. The coefficients on the interaction of decades with finance
19

faculty are significantly negative by a similar magnitude across decades, implying that
finance faculty are less productive than those in economics departments.
Column 2 adds university fixed effects to the specification. The university fixed
effects are estimated at a decade-field level. In other words, we fit 153 fixed effects (26
schools x 2 departments x 3 decades =156 – 3 for the absence of a finance department at
Princeton). The F-test for joint significance of the university fixed effects is 35.28, well
above conventional significance thresholds, establishing the relevance of examining
university fixed effects. The effects of the control variables on productivity do not
materially change with the inclusion of the university fixed effects.
The only coefficients that change markedly are those on the decade dummies. For
impact productivity, the decade coefficients for the 1980s and1990s are a significantly
positive 0.481 and 1.116, respectively. One must be careful in interpreting the decade
coefficients, as they take on a different interpretation when the university fixed effects are
included. The offset of the university fixed effects structure is an others university in
economics in the 1970s.21 The positive decade coefficients imply that a move from one
of the top 25 universities to one of the others increases productivity relative to the effect
of moving to an other in the 1970s. That is, the relative fixed effect of other schools ha
increased by almost one-half an impact-weighted AER page in the 1980s and by more
than one full impact-weighted AER page in the 1990s.
s
This productivity diffusion from top universities to others over the last two
decades can be seen more clearly in Panel B of Table 5, which presents the university
fixed effects by decades, separately for economics and finance. These coefficients are
interpreted as the influence of each of the 25 universities on faculty publications over and
above that of the same faculty member when residing at an other university. While the
coefficients show that there were 17 and 16 universities with significantly positive effects
in the 1970s for economics and finance, respectively, there were only 2 and 4 universities
with positive effects by the 1990s. In fact, in the 1990s, nine economics and seven
finance departments had negative fixed effects. The declines in the effect of elite
universities on productivity can be seen more clearly in Figure 3, which plots the
21 Although the other set of faculty does not represent the universe of faculty at all other universities, the interpretation of the other fixed effect remains valid in that the individual fixed effects have been removed.
20

coefficients over time for each university, separately for economics (Panel A) and finance
(Panel B).
Caution should be exercised in interpreting these fixed effects results. Although it
may be surprising to see that some of the most elite universities exhibit negative fixed
effects, these effects do not mean that the elite universities have less productive faculty
members relative to other universities. Because the individual fixed effects are removed,
the negative university effects mean that an individual is less productive when residing at
that university than if she were at an other university. It is worth noting that our
exclusion of book publications and case writing from the productivity measure may also
contribute to the negative fixed effects. For example, the Harvard finance group exhibits
consistently negative effects throughout the three decades, perhaps because case writing
is not included in our productivity measure.
To the extent that trade-offs are made in allocating resources to research versus
teaching, our estimate of university fixed effects may bias against schools that emphasize
teaching. It may be argued that since Business Week began ranking MBA programs in
the early 1990s, the top business schools in the US put more emphasis and resources into
teaching, thus contributing to the decline in the university effects during the 1990s.
Economics departments, however, are not under the same pressure (the US News &
World Report ranking does not put the same emphasis on teaching as does Business
Week), and no obvious shift has taken place from research to teaching in economics
departments. Thus, our omission of teaching-related activities in measuring productivity
is not likely to be responsible for the reduction in the positive university effects during
the 1970s.
III. Treatment Selection Bias in University Effects Estimation
A concern with the estimates is that they are subject to a possible treatment
selection bias. The location of an individual at any point in time can best be thought of as
a two-sided search model, in which the university looks for the best person to fill its
needs, and the scholar chooses the best university opportunity to maximize her utility. 22
22 See MacLeod and Parent (1999) and Ackerberg and Botticini (2002) for examples of endogenous matching applications.
21

Factors important to utility may include possible productivity spillovers, proximity to
one’s origin, the school being an alma mater, the level of pressure to produce, etc. Two-
sided matching might bias the university fixed effects upwards or downwards, and the
bias is likely to depend on a faculty’s position. We consider four possible selection bias
stories specific to the position of the faculty and the prestige of the university where the
faculty might move.
To assess the magnitude of the potential sources of biases, we construct a
transition matrix of changes in productivity around moves as a function of the direction
of the move (up, lateral, or down) and as a function of the status of faculty rank (full
professor or not). The change in productivity is the average individual-adjusted
productivity in the two years after a move minus the average individual-adjusted
productivity in the two years before a move. Individual adjusted productivity is defined
as the residual of a regression of individual productivity on career years, career years
squared, career years cubed, rank, visiting, and editor status. We drop the first year at the
new university to account for possible set up costs in moving. An up move is a move
from any university that is not in the top 5 to a top 5 institution or from an others
university to a top 25.23 A down move is any move from a top 5 to a non-top 5 or from a
top 25 to others. A lateral move is a move within the top 5, within the top 25
universities, or within the others universities. The results are reported in Table 6.
A. Quasi-retirement Story
The first source of selection bias arises if our results are driven by full professors
moving to lesser schools to quasi-retire. If full professors leave elite schools to other
universities with the intent of lowering their effort, the other school fixed effect will be
biased downwards.
Although all downward moves of full professors show negative signs in Table 6,
none is significant. Furthermore, the changes in productivity following downward moves
are indistinguishable from those following other types of moves by full professors.
23 The top five universities are defined to be those on a decade level with the highest average impact productivity for the faculty members as reported in Table 5 separately for finance and economics.
22

B. Non-promoted Moving Down Story
A second selection story concerns assistant and associate professors who move to
less prestigious universities because of a failure to obtain tenure or promotion. It is
difficult to predict how individuals’ effort levels respond to such moves. One likely story
is that the post-move productivity level falls because the faculty member has lost some of
his intrinsic motivation to do well, thereby biasing downward the university fixed effect
for the lower-ranked schools. Another possible story is that the pressure for seminal work
at the very top schools might be relieved with a move to a lower-ranked school, resulting
in more publications that would bias the university effect upward for the lower-ranked
schools.
Table 6 shows that the downward movement of assistant and associate professors
in the 1980s has a negative productivity impact, but the effect is positive and insignificant
for the 1970s and 1990s. For this selection story to explain our declining positive
university fixed effect from the 1970s to the 1980s, individuals moving down in the
1970s should exhibit more negative productivity shocks than individuals moving down in
1980s. Since this pattern is not observed in the data, the non-promoted moving down
story cannot explain our results. Nevertheless, we repeat our main estimation of the
university fixed effects while interacting the university fixed effect with faculty rank. The
results from this estimation are presented in Appendix 2, which shows a diminishing
university fixed effect over time for assistant and associate professors as well as for full
and chaired professors.
C. Complementarity Story
The third selection concern arises if universities tend to make offers to people
whom they consider to have good future prospects, and if individuals tend to accept
offers from universities with a research environment complementary to their needs and
attributes. This match is more likely to occur for successful individuals moving to higher
ranked or lateral schools, irrespective of position rank. The complementarity would lead
23

to higher productivity in the new location, generating positive university fixed effects for
the elite schools.24
This story finds only isolated support in the transition matrix. Of the twelve
relevant combinations of ranks and decades for the lateral and up moves, nine are
statistically zero; two are statistically negative; and one is statistically positive. The lone
positive impact on productivity occurs for assistant and associate professors moving
upward in the 1970s, which becomes insignificant in the 1980s and the 1990s. This
pattern is consistent with the pattern in the university fixed effects over the three decades,
rendering some credence to the complementarity selection story. However, it still begs
the question of why the complementarity effects have disappeared in the 1980s and
1990s.
With complementarity, an individual brings something that fits well with the
university to generate synergies that result in higher productivity. That is, the
complementarity effect contributes to the positive component of a university fixed effect.
For example, to explain the disappearance of a top economics department’s positive fixed
effect in the 1980s and 1990s using the complementarity story, one must argue that while
assistant and associate professors in the 1970s were attracted to the university with the
hope for higher productivity, the new set of professors with similar rank no longer have
the same motivation to move to the university in the 1980s and 1990s. That is, in the
1970s younger faculty expected to enjoy a positive spillover from being at that university,
while in the 1980s and 1990s younger faculty did not. But this is tantamount to our
hypothesis: During the last three decades big research centers lost much of their appeal
because the spillover produced by having high-caliber colleagues diffused beyond the
physical limits of a university.
D. Tournament Story
24 The flip side of the complementarity story is that university hiring practices have changed. To explain our results with this story requires that the top universities were more effective in hiring in the 1970s than in the 1990s. To test this story, we compare the productivity, adjusted for age and rank, of individuals coming into a school with that of incumbent faculty. Using the average adjusted productivity from the prior two years, we find the same pattern: new hires have higher productivity than incumbents for every decade (0.67 in the 1970s, 1.44 in the 1980s, and 1.00 in the 1990s). The 1970’s new hire surplus is smaller than that of the 1990s, invalidating this story as a potential explanation for the disappearance of the fixed effect.
24

Finally, our estimates would be biased if there is an implicit tournament. For
example, a tenured faculty at a university ranked relatively low among the elite
institutions might continue to work with the goal of making it to the top economics
department, where a tenured person may have no higher career goal to motivate him
(except for the Nobel prize). A tournament bias would result in a negative university
fixed effect for the very top schools, as individuals who reach the top fail to sustain the
high level of productivity once they arrive.
Table 6 shows that up moves by full professors have statistically zero effects on
productivity in the 1970s and the 1980s, but the impact turned negative in the 1990s. The
negative result in the 1990s is consistent with a regression to the mean hypothesis.
Faculty receiving offers after an exceptional spurt of productivity are unable to sustain
the high productivity after the move. However, this theory cannot explain the inter-
temporal pattern of our university fixed effects because it is difficult to explain why
tournaments appear in the 1990s but not in the 1970s and 1980s.
E. Two-Stage Selection Model
Although Table 6 reveals no convincing evidence in support of the selection bias
stories, as a further robust check we estimate a treatment model in which the selection
into a particular university treatment is not random. The selection model consists of two
pieces – estimating the probabilities both of moving and, given a move, of locating to a
particular university. We estimate the probability of a move with a logit selection based
on age. We then fit McFadden’s (1974) conditional logit model to generate predicted
probabilities for each individual to be at each location at each point in time. A conditional
logit selection specification is a convenient tool when the individual’s observed location
is the result of a multi-choice problem (Trost and Lee, 1984). After fitting the two logits,
we then use the multiplied predicted probabilities as instruments for the university fixed
effects indicators in the second stage. The standard errors are corrected for the first stage
estimation error by bootstrapping the logits 500 times in the first stage and adding the
variance in the predicted probabilities from the first stage estimates to the regression
variance in the second stage following Petrin and Train (2001).
The estimating equations are:
25
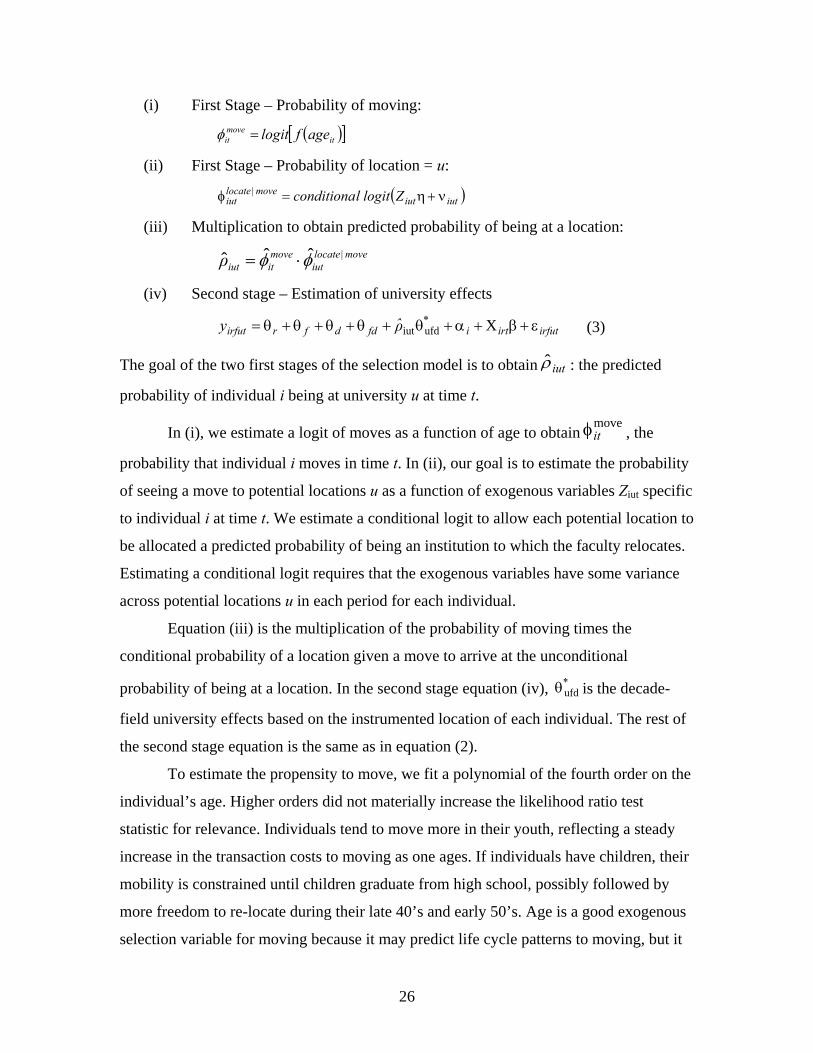
(i) First Stage – Probability of moving:
( )[ ]itmoveit ageflogit =φ
(ii) First Stage – Probability of location = u:
( )iutiutmove | locate
iut Zlogit lconditiona ν+η=φ
(iii) Multiplication to obtain predicted probability of being at a location: move | locate
iutmoveitiutρ φφ ˆˆˆ ⋅=
(iv) Second stage – Estimation of university effects
(3) irfutirti*
fddfrirfut ρ̂y ε+β+α+θ+θ+θ+θ+θ= Xufdiut
The goal of the two first stages of the selection model is to obtain iutρ̂ : the predicted
probability of individual i being at university u at time t.
In (i), we estimate a logit of moves as a function of age to obtain , the
probability that individual i moves in time t. In (ii), our goal is to estimate the probability
of seeing a move to potential locations u as a function of exogenous variables Ziut specific
to individual i at time t. We estimate a conditional logit to allow each potential location to
be allocated a predicted probability of being an institution to which the faculty relocates.
Estimating a conditional logit requires that the exogenous variables have some variance
across potential locations u in each period for each individual.
moveitφ
Equation (iii) is the multiplication of the probability of moving times the
conditional probability of a location given a move to arrive at the unconditional
probability of being at a location. In the second stage equation (iv), is the decade-
field university effects based on the instrumented location of each individual. The rest of
the second stage equation is the same as in equation (2).
*ufdθ
To estimate the propensity to move, we fit a polynomial of the fourth order on the
individual’s age. Higher orders did not materially increase the likelihood ratio test
statistic for relevance. Individuals tend to move more in their youth, reflecting a steady
increase in the transaction costs to moving as one ages. If individuals have children, their
mobility is constrained until children graduate from high school, possibly followed by
more freedom to re-locate during their late 40’s and early 50’s. Age is a good exogenous
selection variable for moving because it may predict life cycle patterns to moving, but it
26

cannot predict which individuals at a certain age will move to universities for either
complementarity or tournament reasons.
Given an estimate of each individual’s probability of a move for each year, we
then estimate the locational choice part of the selection process. The key to the locational
choice estimation is to find good exogenous variables predicting the preference of
location for each individual. We use four variables. The first is peoples’ desire to locate
close to their origin. Because we cannot obtain city of birth information for our sample,
we use the city of their undergraduate alma mater as a proxy. The closeness to one’s
origin is measured by distance in flight times.25 To create this instrument, we search over
4,000 combinations of flights between cities on expedia.com for mid-week, non-holiday
dates. Expedia compares flight times and provides a minimum flight time, simplifying the
travel time search information. Our measure, flight times, is the flight time (expressed in
100s of minutes) to the city of origin from the prior-year university minus the flight time
to the origin from the potential university. If the difference in flight times is a positive
number, reflecting a move closer to home, there should be a higher probability of being
in that location.
Another fairly obvious instrument is prior location. Because of transaction costs
in moving, the prior year location should have high predictive power for the current
location. Using prior location as an instrument should not confound the selection of
university with productivity. Consider the individual who undertakes a move either with
the intent to change her own productivity or to better match her characteristics with a
potential school. For such an individual, the prior location instrument has no predictive
power on potential location.
Because some schools attract back their best former students, our third
instrument, PhD School Location, is a dummy variable equal to one if the potential
university is the Ph.D. alma mater, and the faculty is at one of the top five universities.
Universities generally do not hire their own students in the job market, so we set this
variable equal to one only if the person has more than two years in career experience.
25 We collect these data in November 2005 and assume that the relative time for flight travel has not changed substantially over our sample period.
27

The fourth instrument is the productivity distance between the individual’s prior
two years of work and the potential schools’ average individual productivity over the
same period. Because untenured faculty with below-average productivity can be fired and
faculty with above-average productivity can be hired away, we use the absolute value of
the difference in productivity to each potential school as the metric for assistant and
associate professors. Full professors, unlike their assistant and associate colleagues,
cannot be fired, but they can be recruited away. Full professors generally are recruited
when their productivity is above the recruiting school’s average. Therefore, we use the
unadjusted differences between the individual and the potential school as productivity
distance measure for full professors. We also interact productivity distance with each
position rank to take full benefit from the varying predictions by rank.
Table 7 presents the selection model estimates of model (3). The first stage
estimates are shown in Panels A and B. The second stage estimates and the university
fixed effects coefficients are in Panels C and D.
The first stage instruments perform very well. In Panel A, the likelihood ratio test
has a statistic of 541.2, indicating a high degree of relevance for age in the probability of
a move. Panel B shows that the conditional logit also estimates a statistically relevant
model. The probability of being at a location increases significantly when individuals
move closer to their origin. The probability of being observed at a prior year location is
higher, reflecting the strong role of transaction costs to moving. The most successful
individuals are more likely to be observed at their Ph.D. locations. The Ph.D. location
effect is even stronger for the location choices that are not the prior year location; when
individuals move, they are more likely to move to their Ph.D. alma mater. Finally, faculty
tend to be at a university with an average productivity similar to their own, regardless of
their rank. Overall, our selection model fits the conditional logit model extremely well.
With 816,624 observations, the pseudo R-square is 0.821, and the Wald test statistic is
42,415.
The second stage estimation in Panel C should be compared to column 2 of Table
5, Panel A. In fact, we find results very similar to those in Table 5. Career year
experience decreases productivity, but the bulk of the effect is loaded on the linear term
28

in the selection model, not on the cubic term previously estimated. Productivity decreases
monotonically over rank, but to a slightly lesser degree than the prior estimation.
Turning to the central finding of this paper, Panel C documents that the decade
effect of other universities, captured by the coefficient on the decade dummy variable as
the offset to the 25 elite universities, exhibits the same positive time trend as observed in
the non-selection model. This robustness of the decade effects to the selection model
reconfirms our earlier repudiation of the selection stories explaining our results. That is,
the dissipation of the university fixed effects cannot be explained by selection biases.
Panel D of Table 7, which lists the individual university fixed effects, also shows
that the positive elite university fixed effects of the 1970s and1980s disappeared in the
1990s. The selection model, with the bootstrapped standard error correction, increases the
errors in estimation rendering many of the estimates insignificant relative to those in
Table 5. However, the pattern of diminishing fixed effects for the elite schools is robust:
For both economics and finance we observe a steady decline (increase) in the number of
positive (negative) signs over the three decades. We conclude that the dissipation of the
university fixed effects in the 1990s is robust to selection concerns.
IV. Components of University Fixed Effects
Having established that university fixed effects existed, we attempt to explain
what factors determine them, and why they have disappeared. We are particularly
interested in the roles of spillovers and cultural norms as determinants of these effects.
There are two ways to estimate the factors driving the university fixed effects.
Method 1 takes the university fixed effects at the decade-field level θfud from Table 5,
Panel B and decomposes it into observable determinants of department spillover
potential, cultural norms and university location factors:
fud3flocationu2f
culture deptfud1f
rs spillovedeptfud0ffud νβXβXβXβ +⋅+⋅+⋅+=θ̂ . (4)
The advantage of this approach is in its ease of interpretability.
Method 2 inserts the same observable determinants into our original productivity
estimating equation (2) and estimates the regression directly using the whole sample.
Method 2 will understate the standard errors because the regression is estimated at a
person-year level, and most of the regressors change only at a university-decade level.
29

One of the regressors, the spillover effect from colleagues, is an exception in that it varies
by person-year; therefore, Method 2 will be more efficient for estimating the impact of
the quality of colleagues using the whole sample. The spillover effect changes for each
person-year because the average productivity of each person’s colleagues is different
within the same department and a fortiori over time (e.g., Moretti, 2004). Therefore, to
estimate spillover effects, we use Method 2. To estimate the effect of the other observable
determinants of the university fixed effect, we use Method 1.
The quality of colleagues can generate positive spillovers through the comments
on colleagues’ work (Laband and Tollison, 2000) and spillovers from the expertise of star
faculty (Goyal et al., 2006; Azoulay and Zivin, 2006). We examine whether this spillover
effect sustains over time. As a measure of colleagues’ quality we use, team, the two-year
moving average of productivity of all productive members of the department in each
year.26 We lag the variable one year to remove simultaneity with the productivity
dependent variable. We allow the coefficient on team to vary by decade to test whether
the spillover changes over time. We use the same method as in (2), with impact
productivity as the dependent variable and include individual fixed effects, except that
rather than including university fixed effects, we include university random effects. By
using university random effects, we can identify a team effect, part of whose variation
would otherwise be subsumed in the university fixed effects.
The results are presented in Table 8. The quality of colleagues has a positive and
significant effect on productivity during the 1970s and the 1980s, but the effect turns
negative in the 1990s. A possible explanation for the negative effect is that being
surrounded by highly productive teammates may make a faculty overly cautious and thus
less productive. Such an effect might have existed in the 1970s and 1980s but was
overwhelmed by positive spillover effects.
One potential problem with this estimation procedure is that there is no direct
measure for the quality of team at an others university. In Table 8 we assign the lowest
quality team among the top 25 universities as team for others. In additional tests, we
26 We define a person who has not published in the current or prior year as non-productive and exclude these individuals in our measure of team because later we capture the culture effect through these non-productive faculty.
30

interact the team of others with a dummy to allow its coefficient to differ. Neither of
these approaches is fully satisfactory. Hence, we test the robustness of the team effect by
re-estimating the same regression while restricting the sample to faculty who have always
been at a top 25 university. The results (not reported) are substantially the same.
These results on team effects are consistent with the central university fixed effect
results of the paper; namely, the spillover emanating from superior colleagues either
disappeared or is diffused beyond the restricted boundaries of the home institution, e.g.,
to teammates at other universities. If the team effect is solely responsible for the elite
university fixed effect, the inclusion of the team variable would eliminate all the positive
university fixed effects presented in Table 5, Panel B. Although not reported in a table,
we find that with the team variable, 17(18) of the university fixed effect coefficients are
positive and significant for economics (finance) in the 1970s and only 2 (4) are positive
and significant for the 1990s.27 It is possible that our measure of the colleague spillover is
not properly captured by team. A more likely explanation, however, is that the effect of
highly productive colleagues alone does not fully explain the decrease in the elite
university effect.
To capture the role of alternative variables in determining of the unexplained
portion of the university fixed effects, we take the residual university fixed effects after
removing the team effect and decompose them on the basis of university characteristics
using (4).
The first characteristic is whether a university hosts journal editors or houses a
journal. On one hand, editors may share their know-how on crafting papers for
publication with their colleagues, and having an in-house editor may favor the editor’s
colleagues, whose papers might be accepted more easily (e.g, Laband and Piette, 1994b).
On the other hand, having in-house editors may have a negative effect if editors delegate
more refereeing to colleagues, taking their time away from the production of papers. To
explore how these potential impacts play out, we define editors-in-house to be the natural
log of one plus the average number of editors during each decade for the department. We
27 Although we employ university random effects to identify the team effect, we switch to a fixed effects specification in order to identify the university fixed effect above and beyond the control for team.
31

use the natural log because editorship is clustered in a few key schools and the
incremental impact may be decreasing.
Another potential source of spillovers is the average quality of colleagues’
training. Faculty training quality is measured as the percentage of faculty at a department
whose Ph.D. is obtained from a top five university, where the top five designation is
made by ranking average productivity separately for finance and economics by decade.
In addition to externalities captured by team, editors-in-house, and faculty
training quality, cultural norms may play a role in the university fixed effects. For
instance, in elite schools peer pressure to perform might be very strong.28 Our primary
measure of cultural norms is the presence of non-researching colleagues, referred to as
non-research/service faculty for the lack of a better term. (Again, we want to be clear that
our definition of research is that which appears in top economics and finance journals
only.) Non-research faculty may have a negative impact on the department’s research
output by setting an example and/or diverting new colleague attention and school
resources to non-research related activities. We define non-research/service as the
percent of faculty who have no publication for two years in a row. Admittedly, this
definition is harsh, because the lumpy nature of the publication process might cause very
productive faculty to be classified occasionally as non-research/service.
One may argue that non-research/service. and team capture the same
characteristic of a department, with opposite signs. In fact, the correlation of non-
research/service and team at the yearly observation level is relatively low at 0.21. If high
team values are driven by a few stars, the relation between team and non-research/service
would not be automatic. Additionally, non-research/service captures the negative
research environment that is not measured by a low level of team (a low average
productivity among productive colleagues).
A second measure of cultural norms within the department is measured by the
quality of the Ph.D. program. Presumably, a vibrant and successful Ph.D. program
reflects the research intensity of the department. However, faculty’s research time also
may be absorbed by too much interaction with Ph.D. students. We measure Ph.D.
28 Sacerdote (2001), for example, finds evidence of peer effects on individual outcomes using student living arrangements and subsequent grade performance at Dartmouth. Hoxby (2000) and Angrist and Lang (2004) study peer effects within the classroom.
32

program quality with the decade average count of students who are hired into in the top
25 schools.
We also control for whether a university is a state school. The public or private
nature of the institution might affect financial resources and how they are utilized.
Finally, we want to consider the impact of two environmental variables: the
weather and the distance to the closest metropolitan city. The former may influence
productivity by affecting the opportunity cost of sitting in the office. We measure weather
by the average annual snowfall from weather.com. Distance metro may affect both the
consulting and the distraction opportunities, but at the same time, it may also help
stimulate intellectual curiosity by exposing faculty to topics of current interest in a timely
manner. We measure distance metro as the natural log of miles to the closest city with
more than three-quarters of a million people as measured on mapquest.com.
We are not only interested in showing cross-sectional associations between the
university fixed effects and characteristics of the departments, but also in understanding
the negative trend in university fixed effects identified in Panel B of Table 5. We
examine whether this negative trend can be explained by changes in university
characteristics over time. Furthermore, the relation between the university fixed effects
and certain university characteristics may change over time. We test for this latter
possibility by interacting the most important university characteristics with decade
dummies. Our focus on the trending aspect of the university fixed effects heightens the
concern that an omitted trending factor might bias our coefficients. A Breusch-Pagan test
confirms this concern.29 Ordinarily, we would add decade fixed effects to resolve this
issue. But many of our university characteristics vary only a little over time, so it is
difficult to identify both decade fixed effects and university characteristics interacted
with a decade dummy. Thus, instead of fitting a model with decade fixed effects, Table 9
presents the results with decade random effects. This is without loss of generality. A
Hausman test fails to reject the equality between fixed effects and random effects
estimates.30
29 The test rejects no variance across decades with a χ2(1) = 4.72 corresponding to a p-value of 0.030. 30The test fails to reject equivalence of the fixed effects and random effects coefficients with a χ2(8) = 6.74 corresponding to a p-value of 0.556.
33

Because the nature of publication productivity may not be the same across fields,
we split the decomposition of the university fixed effects into economics (Table 9,
columns 1 and 2) and finance (columns 3 and 4). Columns 1 and 3 in Table 9 show that
non-research/service. has a strong and significant negative effect on the university fixed
effect. At the bottom of the table, a partial R-square analysis shows that excluding non-
research/service. from the estimating equation lowers the percentage of variation
explained by 6% (from 21%) in economics and by 29% (from 42%) in finance. These
results indicate that norms play a role in organizational productivity. The magnitude of
the coefficients, significance, and partial R-squares are greater in finance than in
economics. A possible explanation for this difference is that finance consulting and
executive teaching opportunities tend to be more financially rewarding than the policy-
related consulting opportunities for most economics faculty, making the non-
research/service effect more contagious in finance.
The existence of in-house editors has a negative sign on the productivity of
colleagues in economics and finance, but is significant only for finance. The negative
aspects of in-house editorship seem to outweigh the positive ones. The net effect is
stronger for finance, perhaps because the burden of having an in-house editor is shared by
a smaller number of colleagues in finance than in economics.
The percentage of faculty with Ph.D. degrees from top five universities is
positively significant for economics and insignificant for finance. The Ph.D. program
quality seems to impose more burdens than to provide benefits, but only for economics
departments. These variables, however, do not explain much of the variation across
departments; therefore, we are reluctant to draw definitive inferences based on these
results.
Proximity to cities does not seem to have an impact on the university fixed effect,
nor does being a state school. Surprisingly, snowfall is also insignificant. We expected a
positive coefficient in that good weather might make leisure relatively more attractive.
The result does not change when we replace snowfall with average January temperatures.
In columns 2 and 4, we allow the effect of non-research/service. and editors to
vary over decades. The effect of non-research/service is stable over time, in both
economics and finance. The stability of cultural norms suggests that unlike the spillover
34

from productive colleagues, the cultural aspects of institutions do not easily dissipate
with technological change. In academia, the tenure system may contribute to endemic
cultural norms.
The spillover impact of editorship seems to decline over the three decades, as
does that of having productive colleagues. In economics departments (column 2), the
effect of editors-in-house begins as positive in the 1970s and becomes insignificant in the
1990s. In finance departments (column 4), editors-in-house begins as insignificant in the
1970s and turns negative in the 1990s. Both cases suggest a reduction in the positive
spillover.
V. Understanding the Disappearance of the University Fixed Effects
A. Alternative explanations
Another hypothesis consistent with the data is that a shift has occurred in the
number of elite universities between 1970 and 2000. Restricting our focus to the top 25
universities is driven by the enormous cost of collecting data for others universities. But
there is nothing magic about the number 25. It is possible that in the 1970s there was a
big discontinuity in the quality of the department just below our cutoff and that the
position of this discontinuity had moved down the ranking ladder in the 1990s. If most of
the faculty moving away from the top 25 departments move to departments slightly lower
in quality, this catching-up hypothesis may explain the relative improvement in the fixed
effects of others universities vis-à-vis the top 25.
Several facts are inconsistent with this interpretation, however. First, the catching-
up story cannot explain why the spillover effect of better colleagues decreases over time.
As shown earlier (Section IV.A), the reduction in the spillovers persists even when we
exclude others universities and restrict our analysis only to the top 25 universities.
Second, if it were true that others schools have improved dramatically vis-à-vis
the top 25, we should observe an increase in the average productivity of others relative to
the top 25. We find the opposite in Table 4.
Finally, not all the 25 universities may qualify as elite institutions. Thus, we
repeat our analyses for the top 5 and the top 10 universities only. The key results do not
change, confirming that the choice of the cut-off point at the 25 is not driving the results.
35

B. Diffusion and Technology Advancements
We show that the favorable impact on productivity of working at elite universities
diminishes after the 1970s. We also show that the importance of colleague externalities
vanishes in the 1990s, while the influence of cultural norms remains persistently strong.
To what extent is the progress in information technology responsible for these
trends? Technological advancement can facilitate communication and transfer of ideas
among co-authors at a distance. It can also facilitate access to knowledge itself,
particularly for universities far from the forefront of research. But can we document the
magnitude of this effect in practice?
The reduction in the impact of higher-quality colleagues is consistent with the
reduction of geographical boundaries through better communication technology. Several
papers (Laband and Tollison, 2000; Hamermesh and Oster, 2002; Rosenblat and Mobius,
2004; Goyal et al., 2006; Azoulay and Zivin, 2006) document dramatic increases in co-
authoring at a distance in the latter part of the twentieth century. In particular, Goyal et al.
show that the proportion of the economics profession networked through co-authorship
has increased from nearly 20% in the 1970s to 50% in the 1990s. Our additional
contribution to this literature is to document that most of the increases in co-authorship
took place between elite universities and non-elite ones.
We take the 25,010 author-article observations from the 41 journals with at least
one author residing at a top 25 school and weigh each observation with 1/number of
authors so that articles will have equal weight. The articles are divided into four types; S
= solo articles, X = co-authored articles with all co-authors within the same school, Y =
co-authored articles with at least one co-author not from the same school but all from a
top 25 school, and Z = co-authored articles with at least one co-author outside the top 25
schools.
Figure 4 plots the percentage of the four types of papers in our dataset. The
results are striking. The percentage of multiple author papers with authors in both elite
and non-elite schools steadily increases from about 32% in the beginning of the 1970s,
nearly doubling to 61% by 2004. Papers co-authored with outside authors within the elite
schools also increased from 3% to 9%. These increases contrast sharply with the steady
36

decline in solo authored papers (from 66% to 24%) and essentially no change for in-
house co-authored papers (hovering around 6%).
This evidence is consistent with internet and information technology
advancements making access at a distance easier, which disproportionately favors non-
elite universities. Advancements in information technology include not only the internet,
but also advancements in non-postal delivery systems, such as overnight mail service and
fax machines. These earlier developments may explain the gradual increase in co-
authorship rather a sudden increase that might be expected if the internet were the only a
technological advancement adopted by everyone at the same time.
To investigate whether the sharp increase in participation by scholars in non-elite
schools is due to an increase in the publication market share of others schools, we
compare the percentage of all articles published in the 41 journals with at least one author
affiliated with the top 25 schools with the percentage of articles written exclusively by
authors in others schools in our dataset. There is no evidence of a change in market share
between elite and non-elite schools. The percentage of articles with top school
participation oscillates between 19% and 27%, without a discernable trend, and the
participation by exclusively non-elite school scholars oscillates between 73% and 81%.
A similar lack of pattern holds when we look at market share weighted by the impact of
journals in which the articles were published.
In sum, the available evidence on co-authorship suggests that the reduction in the
university fixed effect is due to a diffusion of the spillover produced by better colleagues
beyond the physical limits of a university.
C. Impact on Salaries
Why does it matter that physical location affects productivity? The diminishing
benefits from physical location have many important implications concerning jobs,
outsourcing, migration, regulation, competition policy, education, etc. In this section, we
focus on its implication to wages, specifically, on the appropriability of the spillover. If
the spillover generated by a better faculty is concentrated within the physical boundaries
of a university, the university can capture some of it. If a faculty member’s productivity
benefits tremendously from being at a top department, she might be willing to accept a
37

lower salary to benefit from this spillover. If that spillover diminishes, so should the
discount in salary. Hence, universities with reductions in their fixed effect should
experience higher increases in salaries. That is, faculty salary should be negatively
correlated with changes in the university fixed effects.
Although we are unable to obtain time series data for economics and finance
professors’ salary, the National Center of Education Statistics of the U. S. Department of
Education conducts faculty salary surveys for all the faculties in US colleges and
universities on a yearly or biennial basis. The data are compiled into the Higher
Education General Information Survey (HEGIS) series for years 1968-1986 and the
Integrated Postsecondary Education Data System (IPEDS) series for 1987-2000. The
surveys collect salary information by gender, position, and contract length (nine- or ten-
month versus full-year contracts) for faculty in all fields. For comparability across time,
we take the average salary across gender for nine- or ten-month contracts of assistant,
associate, and full professors.
While we do not expect that all departments are affected in the same way by
information technology changes, such changes are likely to affect the spillovers in the
production process of research for a substantial portion of the university faculty (see
Agrawal and Goldfarb (2006) for the effect on engineering departments). Hence, we
examine the relation between salaries and the university fixed effects. To this end, we
regress the change in salary (by rank) at each of the twenty-five elite institutions over the
three decades on the change in the university fixed effects for economics faculty. We do
not include finance because finance faculty enjoyed unusually large salary increases over
the past three decades, and business schools often have separate budgets which may lead
to distinct salary structures.
To equilibrate the quality of the faculty input, we control for the change in the
average individual productivity, proxied by the decade-department average of each
individual’s fixed effects. We fit the estimation in a seemingly unrelated regression
(SUR) framework across rank status to account for outside relationships of errors among
the ranks.
38

As predicted, Table 10 reports that changes in the university fixed effects have a
negative and statistically significant effect on salary.31 This relation is robust across
ranks. The results suggest that for each AER impact page decline in the university fixed
effects, assistant professors’ salaries increase by $1,386; associate professors’ by $1,750;
and full professors’ by $2,917.32
In sum, the salary evidence is consistent with leading universities becoming
relatively less attractive places to work in the last three decades. This salary effect
appears to be driven, at least in part, by a reduction in the university fixed effect.
D. Agglomeration in Top Universities
With the diminishing university effects, how do the elite universities maintain
their ability to attract highly productive faculty as Table 4 shows? More generally, how
can we reconcile our evidence with the growing evidence coming from the economic
geography literature that service industries tend to become more geographically
concentrated (Black and Henderson (1999)) and highly educated cities tend to become
even more highly educated because they attract an increasing number of highly educated
people (Glaeser and Berry, 2005)?
Looking more closely at who is agglomerating with whom can help. Glaeser
(2000) argues that non-market interactions are important components in determining
locational choices. Our personal observation also suggests that faculty’s locational
choice is not based solely on the highest monetary return (current salary plus the present
value of future salary increases correlated with future productivity). There seem to be
non-market factors affecting the location choice. For example, the prestige of an
institution and the quality of the students she has to teach may play a role in the decision
making.
To test whether these potential reasons for agglomeration helped elite universities
sustain their ability to attract the highly productive faculty, we relate the yearly average
productivity levels of the 25 elite universities to reputation and prestige features unrelated 31 The observation count of 94 is smaller than the combination of having three ranks, twenty-five schools, and two changes across time because of missing data for Canada and some missing 1970s observations in HEGIS. 32 The monotonic decline in R-squares, from 6% for assistant professors to 1% for full professors, is due partly to the much larger variance in salaries for higher-ranked faculty.
39

to the individual production process of research. The prestige factor, the halo effect, is
proxied with the undergraduate rankings by the Gourman’s Guide to Four Year Colleges.
We define the variable such that the university with the top ranking is assigned a value of
25, the second ranked a value of 24, and so on. Reputation is measured by the
department’s past average impact productivity ten years prior. We take the ten-year lag so
that our reputation variable omits the current university fixed effect. The ten-year lag also
conveniently takes out the 1970s, the period in which we document significant university
fixed effects.
The decade fixed effects regression shows that the average productivity of a
department is significantly positively related to both the halo effect and the department’s
reputation based on their past research:33
,11.022.9311.0
30.3043.0Pr =+⋅+⋅=
⎥⎦⎤
⎢⎣⎡
⎥⎦⎤
⎢⎣⎡
2it R Effects, Fixed DecadeReputationHaloodAve
where t-statistics are reported inside the brackets. Apparently, universities with highly
ranked undergraduate programs enjoy a halo effect in attracting and retaining top
researchers. Departments with good past research records do too, sustaining
agglomeration of top researchers in elite universities even after spillover effects have
dissipated.
VI. Conclusion
In this paper we study the nature and the magnitude of production spillovers in
research activities at elite US universities. We find strong positive spillovers emanating
from superior colleagues during the 1970s. This effect disappeared in the 1990s.
Advances in information technology appear to be an important factor behind this change.
These advances diminish the importance of cooperation within physical boundaries and
greatly facilitate collaboration from a distance, as witnessed by a substantial increase in
co-authorship between scholars at elite and non elite universities.
Our results suggest that elite universities are indeed losing their competitive edge
if this is defined as ability to boost the productivity of their faculty. Nevertheless, elite 33 The undergraduate program rankings are interpolated for missing data. Although the rankings in Gourman’s guides began in 1967, it was sparse, with a second appearance in 1977, and thereafter every two to three years until 1993. The final Gourman guide was in 1998, three years before the end of our sample period.
40

universities still enjoy an edge in average productivity, perhaps because top researchers
agglomerate in institutions with prestigious undergraduate programs and in departments
with high past research reputations. Such agglomeration may be due to the academic
equivalent of Glaeser’s (2000) non-market interaction; namely, the utility and the prestige
of co-location with other creative minds. The perception that affiliation with top ranked
departments enhances the visibility and credibility of their research output also may have
helped elite universities attract and retain productive researchers. In short, elite
universities have been able to maintain superior research productivity because of top
researchers’ tendency to agglomerate for non-market benefits.
In the process of documenting these results, we uncover patterns in research
activities with implications for university administrators. The percentage of faculty
members not producing journal research, a proxy for an organizational culture
engendering alternative goals, has a strong and persistent negative impact on the
productivity of the other faculty members. The influence of non-research colleagues is
analogous to the effect of “bad apples” in the education literature (Hoxby, 2005).
We also find that faculty research productivity reaches its peak well before tenure
and age and higher ranks are associated with substantially lower research productivity.
Part of the age and rank factor, however, could be due to our inability to capture indirect
contributions. Older and higher ranked faculty might produce in other ways such as
assuming greater administrative responsibilities, thereby freeing up the time of younger
colleagues. They also may devote more time to writing books and cases, which are
excluded from our measure of research productivity.
The dissipation of university effects also has implications for knowledge-based
industries. An increasing fraction of production in developed countries consists of
research-like products. If, as our evidence suggests, the physical location for creation of
these products is less important today, the nature of these firms and the way they should
be managed is fundamentally changed. When physical proximity is required for spillover,
firms exercise authority over their employees by controlling access to the physical
premises (Rajan and Zingales, 1998, 2001). In this context, our findings suggest that the
boundaries of firms are becoming fuzzier in knowledge-based industries. As a
consequence, appropriating returns to investment in research and development will
41
become more difficult, tilting the playing field in favor of the key generators of
knowledge, e.g., superstar researchers and inventors.34
The implication of fuzzier firm boundaries goes beyond industries that specialize
in research-like products. Increasingly, back office operations are outsourced overseas.
Industries that can provide service over the internet (e.g., real estate brokerage) are
breaking out of traditional modes of operation. Our results suggest that these innovations
are only the tip of the iceberg. In the not-so-distant future, many industries may find little
need for any locational anchors.
Such disruptions will, of course, vary across industries. When economies of scale
and physical interactions are important, as in traditional manufacturing, the pace and
scope of transformation will be curtailed. Furthermore, the non-market interactions
sustaining agglomeration in cities may also be at work to slow the speed of
transformation. Although advances in information technology threatens the competitive
advantage of cities and countries leading in technology, the non-market benefits of
residing in those locations may help attract and retain the most productive members of
society within their physical boundaries.
34 This might explain the surge in the return to human capital in the top 0.1% of the income distribution documented by Saez (2006).
42

Appendix 1
We discuss the restrictions on θrfut necessary to identify the model. At the risk of
being over-conservative, we begin with the full expansion of θrfut:
θrfut = θr + θf + θu + θt + θrf + θru + θrt + θfu + θft + θut + θrfu + θrft + θrut + θfut + θrfut
The key effect in which we are interested is the effect of university departments on
productivity over time, θfut.
Since faculty rosters are not sufficiently large to estimate the university effect at
the year level (and productivity is noisy even at a year level as the fruits of research do
not ripen consistently), we focus on the decade (d: d∈1970s, 1980s, 1990s including
2000-2001) rather than year effect of universities. So we begin by imposing:
R.1: θt = θd
R.2: θft = θfd
From our analysis of “inflation,” we determine that a page of impact productivity should
roughly be the same across time. Thus, any systematic time effect captured in θt should
be sufficiently small that measuring it at a decade level (rather than at a year level) should
be inconsequential. R.2 requires that this assumption holds within each subfield
(economics and finance).35
Building on R.1 and R.2, we impose that any university effect, field effect, or
university field effect that varies over time can be measured at a decade level without
inducing a bias in θfud:
R.3.: θut = θud
R.4.: θfut = θfud
For a bias to exist, it must be either that the step pattern of applying a decade restriction is
correlated with another variable which does exhibit lumpy changes or that the ad-hoc
slicing of time at the calendar decade end impacts estimation because university effects
are non-monotonic. For example, say a department effect is constant for 1970-1974,
improves from 1975-1984 and declines from 1985-1989. A decade study might miss
35 This assumption is needed in spite of R1 because the year effects for finance and economics could offset each other within decades.
43

such effect. However, in our defense, the pattern of university impacts is likely to be a
slow-moving monotonic trend because the effect of any individual is removed from the
analysis. Nevertheless, to ensure that our results are robust to this assumption, we also
estimate a model that allows the university field effect to trend over time.
The remaining restrictions ensure that our estimated university effects are not
driven by a changing effect of rank over time (R.5-R.7), across fields (R.8-R.9), or across
time-fields (R.10).
R.5.: θrf = 0
R.6.: θrt = 0
R.7.: θrft = 0
Since the procedures embedded in the tenure system are universal across fields, there
would be no reason to expect the rank effect to vary by field. R.5. is easy to test. As in
R.5., the restriction of no rank effect change over time (R.6.) is a facet of the static nature
of the tenure system. Thus, we would not expect the rank effect to vary over time. R.7
becomes innocuous after assuming R.5 and R.6 and accepting that there would be no
reason for rank effects not to vary over time or over fields but to have a non-zero field-
time covariance.
R.8.: θru = 0
R.9.: θrfu = 0
R.8. restricts rank effects to be the same across schools. In robustness checks, we
allow rank effects to vary by school. R.9 adds that, given we are allowing university
effects to vary over schools, any variation does not depend on rank. Beyond the effect of
varying rank effects across schools captured in the two-way interaction in R.8, R.9 is
unlikely to be violated except in cases in which the standards for an economics
department are widely different from those of a finance department within a school.
R.10: θrut = 0
We would like to be able to conduct our analysis allowing the university effect
over time to vary across schools and across school ranks within each school. The number
of faculty in assistant and associate positions who move within a decade is, however, not
sufficiently large to estimate a university-rank effect even by decade. Because it is
plausible that a university pattern we encounter is driven by a time pattern in the effect of
44

rank pressures varying across schools, we repeat all of our results for a breakdown of full
professors versus those still seeking some level of promotion.
Finally, the 4-way interaction θrfut becomes innocuous because we are interested
in analyzing an interaction at a lower level of aggregation. Any possible bias in our
estimates can only come from the failure of one of the 2-way or 3-way restrictions
discussed above.
45

References
Ackerberg, Daniel A., and Maristella Botticini. "Endogenous Matching and the Empirical Determinants of Contract Form." Journal of Political Economy 110, no. 3 (2002): 564-91. Agrawal, Ajay, and Avi Goldfarb. “Restructuring Research: Communication Costs and the Democratization of University Innovation.” University of Toronto Working Paper (2006). Alexander, Jr., John C., and Rodney H. Mabry. "Relative Significance of Journals, Authors and Articles Cited in Financial Research." Journal of Finance 49, no. 2 (1994): 697-712. Angrist, Joshua D., and Kevin Lang. "Does School Integration Generate Peer Effects? Evidence from Boston's Metco Program." American Economic Review 94, no. 5 (2004): 613-1634. Arnold, Tom, Alexander W. Butler, Timothy F. Crack, and Altintig Altintig. "Impact: What Influences Finance Research?" Journal of Business 76, no. 2 (2003): 343-61. Azoulay, Pierre, and Joshua Graff Zivin. "Peer Effects in the Workplace: Evidence from Professional Transitions for the Superstars of Medicine." Columbia University Working Paper (2005). Bertrand, Marianne, and Antoinette Scholar. "Managing with Style: The Effect of Managers on Firm Policies." Quarterly Journal of Economics 118, no. 4 (2003): 1169-208. Black, Duncan and Vernon Henderson, “Spatial Evolution of Population and Industry in the United States (in Evolution of the Geographic Concentration of Industry” The American Economic Review, Vol. 89, No. 2, 1999. Blair, Dudley W., Rex L. Cottle, and Myles S. Wallace. "Faculty Ratings of Major Economics Departments by Citations - an Extension." American Economic Review 76, no. 1 (1986): 264-67. Borokhovich, Kenneth A., Robert J. Bricker, Kelly R. Brunarski, and Betty J. Simkins. "Finance Research Productivity and Influence." Journal of Finance 50, no. 5 (1995): 1691-717. Chan, Kam C., Carl R. Chen, and Thomas L. Steiner. "Production in the Finance Literature, Institutional Reputation, and Labor Mobility in Academia: A Global Perspective." Financial Management 31, no. 4 (2002): 131-56.
46

Ciccone, Antonio and Robert E. Hall, 1996. “Productivity and the Density of Economic Activity.” American Economic Review 86 (1), 54-70. Conroy, M. E., R. Dusansky, D. Drukker, and A. Kildegaard. "The Productivity of Economics Departments in the Us: Publications in the Core Journals." Journal of Economic Literature 33, no. 4 (1995): 1966-71. Davis, Paul, and Gustav F. Papanek. "Faculty Ratings of Major Economics Departments by Citation." American Economic Review 74, no. 1 (1984): 225-30. de Borda, Jean-Charles. "Mémoire Sur Les Élections Au Scrutin." In Histoire De L'académie Royale Des Sciences. Paris, 1781. Dusansky, Richard, and Clayton J. Vernon. "Rankings of U.S. Economics Departments." Journal of Economic Perspectives 12, no. 1 (1998): 157-70. Ellison, Glenn. "The Slowdown of the Economics Publishing Process." Journal of Political Economy 110, no. 5 (2002): 947-93. Ellison, Glenn. “Is Peer Review in Decline?” MIT Working Paper (2006). Ellison, Glenn and Edward L. Glaeser. “The Economic Concentration of Industry: Does Natural Advantage Explain Agglomeration?” American Economic Review 89, no. 2 (1999): 311-316. Glaeser, Edward L. “The Future of Urban Economics: Non-Market Interactions.” Brookings-Wharton Papers on Urban Affairs 1 (2000): 101-150. Glaeser Edward L.and Christopher R. Berry. “The Divergence of Human Capital Levels across Cities” Harvard University Working paper, August 2005. Goyal, Sanjeev, Marco J. Van Der Leij, and Jose-Luis Moraga. "Economics: An Emerging Small World?" Journal of Political Economy, forthcoming (2006). Graves, Philip E., James R. Marchand, and Randall Thompson. "Economics Department Rankings: Research Incentives, Constraints and Efficiency." American Economic Review 72, no. 5 (1982): 1131-41. Hamermesh, Daniel S., and Sharon M. Oster. "Tools or Toys? The Impact of High Technology on Scholarly Productivity." Economic Inquiry 40, no. 4 (2002): 539-55. Heck, J. Louis, Philip L. Cooley, and Carl M. Hubbard. "Contributing Authors and Institutions to the Journal of Finance: 1946-1985." Journal of Finance 41, no. 5 (1986): 1129-40.
47

Hoxby, Caroline M. "Peer Effects in the Classroom: Learning from Gender and Race Variation." NBER Working Paper 7867 (2000). Hoxby, Caroline M., and Gretchen Weingarth. "Taking Race out of the Equation: School Reassignment and the Structure of Peer Effects." Harvard University Working Paper (2005). Kaufman, George G. "Rankings of Finance Departments by Faculty Representation on Editorial Boards of Professional Journals: A Note." Journal of Finance 39, no. 4 (1984): 1189-97. Kim, E. Han, Adair Morse, and Luigi Zingales. “What Has Mattered to Economics Since 1970.” Journal of Economic Perspectives, forthcoming (Fall, 2006). Klemkosky, Robert C., and Donald L. Tuttle. "Institutional Source and Concentration of Financial Research." Journal of Finance 32, no. 3 (1977): 901-07. Laband, David N., and Michael J. Piette. "The Relative Impacts of Economics Journals 1970-1990." Journal of Economic Literature 32, no. 2 (1994): 640-66. Laband, David N., and Robert D. Tollison. "Intellectual Collaboration." Journal of Political Economy 108, no. 3 (2000): 632-62. Levin, Jonathan. "Multilateral Contracting and the Employment Relationship." Quarterly Journal of Economics 117, no. 3 (2002): 1075-103. Liebowitz, Stanley J., and John P. Palmer. "Assesing the Relative Impacts of Economics Journals." Journal of Economic Literature 22, no. 1 (1984): 77-88. Liner, Gaines H. "Core Journals in Economics." Economic Inquiry 40, no. 1 (2002): 138-45. MacLeod, W. Bentley, and Daniel Parent. "Job Characteristics and the Form of Compensation." In Research in Labor Economics, edited by Solomon W. Polachek, 177-242. Stamford, CT: JAI Press, 1999. Marshall, Alfred. Principles of Economics. London: MacMillan Press, 1920. McFadden, Daniel. "Conditional Logit Analysis of Qualitative Choice Behavior." In Frontiers in Econometrics, edited by P. Zarembka, 105-42. New York: Academic Press, 1974. Mailath, George J. and Andrew Postelwaite, “Workers Versus Firms: Bargaining Over a Firm's Value,'' The Review of Economic Studies, 57 (1990), 369-380. Moretti, Enrico. "Workers’ Education, Spillovers, and Productivity: Evidence from Plant-
48

Level Production Functions." American Economic Review 94, no. 3 (2004): 565-690. Niemi, Jr., Albert W. "Institutional Contributions to the Leading Finance Journals, 1975 through 1986: A Note." Journal of Finance 42, no. 5 (1987): 1389-97. Oster, Sharon M., and Daniel S. Hamermesh. "Aging and Productivity among Economists." Review of Economics and Statistics 80, no. 1 (1998): 154-56. Oyer, Paul. “The Macro-Foundations of Microeconomics: Initial Labor Market Conditions and Long-Term Outcomes for Economists.” NBER Working Paper 12157 (2006). Petrin, Amil, and Kenneth Train. "Omitted Product Attributes in Discrete Choice Models." University of California at Berkeley Working Paper (2002). Rajan, Raghuram G., and Luigi Zingales. "Power in a Theory of the Firm." Quarterly Journal of Economics 113, no. 3 (1998): 387-432. ———. "The Firm as a Dedicated Hierarchy: A Theory of the Origins and Growth of Firms." Quarterly Journal of Economics 116, no. 3 (2001): 805-52. Rosenblat, Tanya S., and Markus M. Mobius. "Getting Closer or Drifting Apart." Quarterly Journal of Economics 119, no. 3 (2004): 971 - 1009. Sacerdote, Bruce. "Peer Effects with Random Assignment: Results for Dartmouth Roommates." Quarterly Journal of Economics 116, no. 2 (2001): 681-704. Saez, Emmanuel, and Thomas Piketty. "The Evolution of Top Incomes: A Historical and International Perspective." American Economic Review 96, no. 2 (2006): forthcoming. Sauer, Raymond D. "Estimates of the Returns to Quality and Coauthorship in Economic Academia." Journal of Political Economy 96, no. 4 (1988): 855-66. Scott, Loren C., and Peter M. Mitias. "Trends in Ranking of Economics Departments in the U.S.: An Update." Economic Inquiry 34 (1996): 378-400. Trost, Robert P., and Lung-Fei Lee. "Technical Training and Earnings: A Polychotomous Choice Model with Selectivity." Review of Economics and Statistics 66, no. 1 (1984): 151-56. White, Halbert. "Nonlinear Regression on Cross-Section Data." Econometrica 48, no. 3 (1980): 721-47. ____________. “A Heteroskedasticity-Consistent Covariance-Matrix Estimator and a Direct Test for Heteroskedasticity.” Econometrica 48, no. 4 (1980): 817-838.
49

Panel A: Review of Economic Studies
0
5
10
15
20
25
30
35
40
45
1970 1975 1980 1985 1990 1995 2000 2005
Mon
ths
SampledEllisonEllison + 1 Year
Panel B: Journal of Financial Economics
0
5
10
15
20
25
30
1970 1975 1980 1985 1990 1995 2000 2005
Mon
ths
SampledEllisonEllison + 1 Year
Figure 1: Journal –Specific Time Lags in the Writing to Publication Process
Time from writing a paper to publication in a journal consists of three parts – time from the project commencement to journal submission, time from journal submission to acceptance, and time from acceptance to publication. The Sampled solid line is the time in months from submission to publication for publications in the Review of Economic Studies (Panel A) and Journal of Financial Economics (Panel B) from an average of 15 articles per year for 1970-2002. The Ellison dashed black line is the interpolated decade-average time from submission to acceptance for these journals as reported in Ellison (2002). The Ellison + 1 Year dashed grey line represents a one year addition to Ellison to account for the time from the midpoint in writing the paper to submission plus the time from acceptance to publication.
50

0
2
4
6
8
10
0 2 4 6 8 10 12 14 16 18 20 22 24 26 28 30 32 34 36 38 40 42 44Career Years
Prod
uctiv
ity
Impact Raw
Figure 2: Average Individual Annual Productivity by Career Years
An individual’s raw productivity is measured as the AER equivalent pages for that person for the year in which the article productivity was written, using the Ellison adjustment plus one year to lag from the publication dates of articles to the writing time period. Impact productivity multiplies each article by the decade impact for the journal published. Career years is the number of years since the faculty’s Ph.D. year. If the person has not yet received his/her Ph.D., career years is recorded at zero.
51

-2.0
-1.5
-1.0
-0.5
0.0
0.5
1.0
1.5
2.0
2.5
1970s 1980s 1990s
Decades
Uni
vers
ity F
ixed
Eff
ects
Carnegie Columbia Cornell Duke HarvardIndiana MIT NYU Northwestern Ohio StatePrinceton Purdue Stanford UBC BerkeleyUCLA Chicago Michigan Penn RochesterUSC Texas Washington Wisconsin Yale
Figure 3, Panel A: University Fixed Effects over Decades for Economics Departments
University fixed effects coefficients are taken from the 2nd column estimation of Table 5, Panel A, with values corresponding to Table 5, Panel B, columns 1-3.
52

-3
-2
-1
0
1
2
3
1970s 1980s 1990s
Decades
Uni
vers
ity F
ixed
Eff
ects
Carnegie Columbia Cornell Duke HarvardIndiana MIT NYU Northwestern Ohio StatePurdue Stanford UBC Berkeley UCLAChicago Michigan Penn Rochester USCTexas Washington Wisconsin Yale
Figure 3, Panel B: University Fixed Effects over Decades for Finance Departments
University fixed effects coefficients are taken from the 2nd column estimation of Table 5, Panel A, with values corresponding to Table 5, Panel B, columns 4-6
53

0%
10%
20%
30%
40%
50%
60%
70%
1971 1974 1977 1980 1983 1986 1989 1992 1995 1998 2001 2004
Solo Multi-Authored In-HouseMulti-Authored In Top 25 Multi-Authored with Non-Top 25
S
Z
Y
X
Figure 4: Percent of Articles by Type of Authorship, 1971-2004
For all articles published in the top 41 journals with at least one author residing at a top 25 school, presented are the percentages of articles falling into one of four types: s = solo articles (black dotted line), x = co-authored articles with all co-authors within the same school (black solid line), y = co-authored articles with at least one outside co-author but within the top 25 schools (grey dotted line), and z = co-authored articles with at least one outside co-author outside of the top 25 schools (grey solid line).
54

Table 1, Panel A: Studies Ranking University Research
Study Field Sub-Period Methodology Graves et al. American Economic Review (1982)
Economics 1974-1978 Calculates AER equivalent pages.
Davis and Papanek American Economic Review (1984)
Economics 1978-1981 Counts average number of citations in SSCI.
National Research Council (1983) Economics 1983
Employs methodology based on subjective evaluation of raters plus considerations of an institution’s graduates, library, R&D budget, and program and faculty output.
Scott and Mitias Economic Inquiry (1996)
Economics 1984-1993 Calculates AER equivalents pages. Divides by number of coauthors.
Dusansky and Vernon Journal of Economic Perspectives (1998)
Economics 1990-1994 Weights AER pages by Laband-Piette (1994) impact factor. Divides by number of coauthors.
Coupe Revealed Performance Website: http://student.ulb.ac.be/~tcoupe/ranking.html
Economics 1994-1998 Calculates impact factor (citations/ #articles) for each journal. Divides by number of coauthors.
Coupe Revealed Performance Website: http://student.ulb.ac.be/~tcoupe/ranking.html
Economics 1998-2001 Uses top 10 journals of KMS (1999). Uses Laband Piette (1994) long-term impact factor. Divides by coauthors.
Klemkosky & Tuttle Journal of Finance (1977) Finance 1966-1975
Chooses all articles in primary finance journals and articles in secondary list that meet the criterion: “Would the JF or JFQA consider this article or note suitable for publication in terms of subject matter?” Counts pages. Divides by number of co-authors.
Niemi Journal of Finance (1987) Finance 1975-1986 Counts number of pages for articles. Divides
by number of co-authors.
Borokhovich et al. Journal of Finance (1995) Finance 1989-1993
Weights pages by journal impact factor constructed with the number of citations for the journal. Divides by number of co-authors.
Chan, Chin and Steiner Financial Management (2002)
Finance 1996-2001 Converts pages to JF page equivalents. Divides by number of co-authors.
55

Table 1, Panel B: Research Rankings of Universities
Rank University Borda Count Score
1 University of Chicago 17.74 2 University of Pennsylvania 17.19 3 Harvard University 16.94 4 New York University 13.05 5 Massachusetts Institute of Technology 12.98 6 Stanford University 12.89 7 Northwestern University 11.83 8 University of California at Los Angeles 11.70 9 University of Michigan 10.54
10 Columbia University 9.10 11 University of Rochester 7.74 12 University of California at Berkeley 7.59 13 Yale University 6.78 14 Princeton University 6.20 15 Ohio State University 5.60 16 Cornell University 5.36 17 University of Wisconsin 5.32 18 Duke University 4.63 19 University of British Columbia 2.39 20 Purdue University 2.28 21 University of Washington 2.13 22 Indiana University 1.91 23 University of Texas at Austin 1.81 24 Carnegie-Mellon University 1.79 25 University of Southern California 1.71 26 Boston University 1.42 27 University of Illinois 1.36 28 University of California at San Diego 1.33 29 University of Minnesota 1.18 30 University of Maryland 0.98 31 Johns Hopkins 0.63 32 London School of Business 0.63 33 Rutgers University 0.63 34 Boston College 0.51 35 University of Pittsburgh 0.50 36 London School of Economics 0.43 37 University of North Carolina 0.42 38 Louisiana State University 0.27 39 Virginia Polytechnic University 0.22 40 University of Iowa 0.21 41 University of Toronto 0.20 42 Hong Kong Polytechnique University 0.18 43 Brown University 0.17 44 Oxford University 0.13 45 California Institute of Technology 0.10 46 University of Virginia 0.08
56

Table 2: Impact Factors and Decade Impact Rankings
1970s 1980s 1990s Journal
(Ordered by 1970 Rank) Impact Factor Rank
Impact Factor Rank
Impact Factor Rank
American Economic Review 1.00 (1) 1.00 (2) 1.00 (1) Journal of Political Economy 0.93 (2) 0.75 (4) 0.72 (5) Journal of Financial Economics 0.85 (3) 1.04 (1) 0.88 (3) Review of Economics and Statistics 0.74 (4) 0.43 (11) 0.51 (7) Econometrica 0.71 (5) 0.89 (3) 0.49 (8) Review of Economic Studies 0.69 (6) 0.59 (9) 0.67 (6) Rand Journal of Economics\Bell 0.61 (7) 0.66 (6) 0.41 (9) Journal of Finance 0.60 (8) 0.60 (8) 0.96 (2) Journal of Monetary Economics 0.58 (9) 0.75 (5) 0.37 (11) International Economic Review 0.49 (10) 0.27 (22) 0.33 (16) Quarterly Journal of Economics 0.43 (11) 0.62 (7) 0.80 (4) Journal of American Statistical Association 0.43 (12) 0.37 (14) 0.34 (15) Journal of Economic Theory 0.43 (13) 0.37 (15) 0.17 (29) Journal of Public Economics 0.42 (14) 0.28 (20) 0.27 (21) Journal of Money, Credit, and Banking 0.40 (15) 0.39 (13) 0.32 (17) National Tax Journal 0.40 (16) 0.16 (33) 0.28 (20) Journal of Econometrics 0.35 (17) 0.29 (18) 0.24 (25) Journal of International Economics 0.33 (18) 0.43 (12) 0.35 (13) Economic Inquiry 0.32 (19) 0.27 (23) 0.15 (33) Journal of Business 0.31 (20) 0.37 (16) 0.30 (19) Industrial and Labor Relations Review 0.30 (21) 0.23 (28) 0.31 (18) Journal of Human Resources 0.29 (22) 0.15 (35) 0.24 (26) Journal of Urban Economics 0.28 (23) 0.17 (31) 0.13 (36) Economica 0.27 (24) 0.22 (30) 0.17 (31) Journal of Financial and Quantitative Analysis 0.26 (25) 0.28 (21) 0.35 (14) Journal of Law and Economics 0.21 (26) 0.26 (24) 0.16 (32) Southern Economic Journal 0.20 (27) 0.16 (34) 0.08 (38) Economic Journal 0.18 (28) 0.23 (29) 0.20 (27) Journal of Legal Studies 0.16 (29) 0.24 (26) 0.12 (37) Journal of Economic Dynamics and Control 0.14 (30) 0.15 (36) 0.15 (34) Oxford Economic Papers 0.13 (31) 0.12 (40) 0.15 (35) Journal of Economic History 0.13 (32) 0.13 (37) 0.07 (39) Journal of Regional Science 0.13 (33) 0.12 (39) 0.07 (40) European Economic Review 0.12 (34) 0.17 (32) 0.26 (24) Journal of Development Economics 0.10 (35) 0.13 (38) 0.19 (28) Economic Development and Cultural Change 0.09 (36) 0.05 (41) 0.06 (41) Journal of Business and Economic Statistics -- 0.51 (10) 0.39 (10) Review of Financial Studies -- 0.32 (17) 0.36 (12) Journal of Labor Economics -- 0.29 (19) 0.26 (22) Journal of Law, Economics and Organization -- 0.24 (27) 0.26 (23) Journal of International Money and Finance -- 0.26 (25) 0.17 (30)
57

Table 3: Summary Statistics & Correlations for Individual Productivity Measures
Panel A presents the mean, median, maximum and standard deviation for our 4 measures of productivity. Panels B and C present Spearman Rank Correlation and Pearson Correlation among the four productivity measures. Impact and raw productivities are measured as the count of AER equivalent pages written by each faculty in 41 economics and finance journals. Adjustment to AER equivalents normalizes by font, typesetting, and average article length. Publication pages are divided by 1/n coauthors. Impact productivity multiplies each article by the decade impact factor of the journal published. Article counts is the simple sum of articles published by year. Citations sums the count of cites received as of May 2005 for each article written by the faculty in that year.
Panel A: Summary Statistics
Productivity Decade Mean Median Max St. Dev. Raw 1970s 5.8 0 105.4 10.1 1980s 6.7 0 112.7 11.5 1990s 6.2 0 138.4 11.9 Overall 6.3 0 138.4 11.5 Impact 1970s 3.2 0 74.6 6.2 1980s 3.4 0 70.1 6.5 1990s 3.0 0 103.9 6.3 Overall 3.1 0 103.9 6.3 Article Counts 1970s 0.75 0 9 1.10 1980s 0.70 0 13 1.05 1990s 0.53 0 8 0.89 Overall 0.62 0 13 0.99 Citations 1970s 27.5 0 3467 120.1 1980s 25.7 0 3396 92.8 1990s 7.8 0 693 28.8 Overall 16.7 0 3467 75.3
Panel B: Spearman Rank Correlation
Impact Raw Article Count Citations Impact 1 Raw 0.981 1
Article Counts 0.969 0.974 1 Citations 0.862 0.851 0.860 1
Panel C: Pearson Correlation
Impact Raw Article Count Citations Impact 1 Raw 0.871 1
Article Counts 0.783 0.850 1 Citations 0.421 0.357 0.401 1
58

Table 4: Average Individual Productivities for Faculty by University and Decade Individual raw productivity is measured as the count of AER equivalent pages written by each faculty in 41 economics and finance journals. Adjustment to AER equivalents requires normalizing by font, typesetting and average article length such to equilibrate words across journals. Publication pages are divided by 1/n coauthors. Impact productivity multiplies each article by the decade impact factor of the journal published. Article count is the simple sum of articles published by year. The 1990s decade includes 2000 and 2001. The Others category reports the productivity of individuals who have ever been or will be at top 25 universities but who are at non-top 25 universities in the observation year. The method for determining the top 25 universities is discussed in the data section and Table 1. All averages are averages over faculty in the set of universities, not raw averages across universities. Impact Productivity Raw Productivity Article Counts 1970s 1980s 1990s 1970s 1980s 1990s 1970s 1980s 1990s MIT 5.94 6.58 6.64 10.04 11.80 12.00 1.26 1.13 0.97 Chicago 5.65 6.07 5.84 9.03 10.28 10.00 0.99 0.94 0.80 OSU 5.17 3.54 3.66 9.01 7.41 7.81 1.14 0.83 0.75 Harvard 4.93 4.62 5.16 8.44 8.77 9.10 0.94 0.92 0.80 Carnegie 4.51 4.96 2.47 7.35 9.21 5.31 0.93 0.90 0.49 Rochester 4.48 4.81 3.23 7.33 8.40 6.33 0.77 0.78 0.52 UCLA 4.27 5.06 4.03 7.51 9.59 8.46 0.96 0.93 0.69 Yale 4.20 3.92 3.08 7.46 7.99 7.17 0.83 0.79 0.56 Princeton 3.82 7.34 5.67 6.91 12.80 10.25 0.92 1.27 0.84 Penn 3.66 3.93 4.18 6.67 7.39 8.25 0.82 0.77 0.74 Stanford 3.59 4.64 4.19 6.35 8.32 7.76 0.86 0.83 0.61 Columbia 3.01 2.73 2.61 5.06 6.08 5.41 0.69 0.61 0.46 UBC 2.77 2.64 2.54 5.50 5.69 6.05 0.74 0.60 0.50 Berkeley 2.57 2.77 2.82 4.39 5.55 6.21 0.52 0.65 0.53 Northwestern 2.54 4.08 3.45 4.73 7.59 7.38 0.63 0.73 0.61 NYU 2.50 2.34 3.00 4.63 4.30 5.50 0.74 0.53 0.53 Purdue 2.48 2.15 2.08 5.19 4.43 3.77 0.86 0.55 0.40 Michigan 2.22 3.19 2.54 4.08 5.63 5.57 0.61 0.61 0.48 Washington 2.09 2.48 1.79 4.27 5.07 4.88 0.48 0.51 0.41 USC 2.00 2.09 2.64 3.76 5.08 5.95 0.52 0.48 0.50 Wisconsin 1.96 2.10 2.70 4.16 4.84 6.40 0.59 0.54 0.53 Cornell 1.87 2.65 2.18 4.17 6.26 5.46 0.59 0.72 0.47 Indiana 1.61 1.63 1.45 3.78 3.44 3.89 0.45 0.38 0.34 Duke 0.94 2.92 2.59 2.30 6.27 5.34 0.41 0.62 0.43 Texas 0.38 1.03 2.10 0.86 2.36 4.73 0.12 0.26 0.36 Top 10 4.71 5.18 4.78 8.04 9.48 8.93 0.97 0.94 0.74 Top 25 3.37 3.86 3.55 6.01 7.34 7.09 0.76 0.75 0.60 Others 2.82 2.48 2.11 5.29 5.51 5.05 0.72 0.61 0.45 All Schools 3.23 3.43 3.01 5.83 6.77 6.33 0.75 0.70 0.54 Top 10-Others 1.89 2.70 2.67 2.74 3.97 3.87 0.25 0.34 0.29 Top 25-Others 0.55 1.38 1.44 0.71 1.83 2.04 0.04 0.14 0.15
59
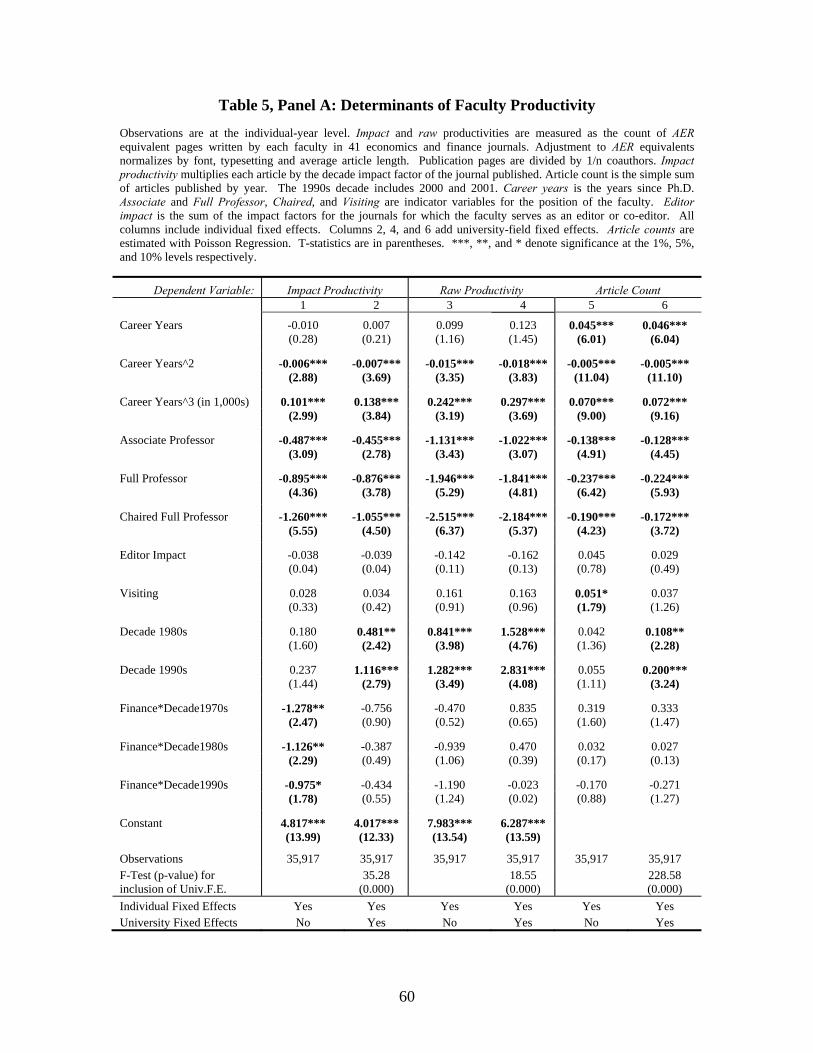
Table 5, Panel A: Determinants of Faculty Productivity
Observations are at the individual-year level. Impact and raw productivities are measured as the count of AER equivalent pages written by each faculty in 41 economics and finance journals. Adjustment to AER equivalents normalizes by font, typesetting and average article length. Publication pages are divided by 1/n coauthors. Impact productivity multiplies each article by the decade impact factor of the journal published. Article count is the simple sum of articles published by year. The 1990s decade includes 2000 and 2001. Career years is the years since Ph.D. Associate and Full Professor, Chaired, and Visiting are indicator variables for the position of the faculty. Editor impact is the sum of the impact factors for the journals for which the faculty serves as an editor or co-editor. All columns include individual fixed effects. Columns 2, 4, and 6 add university-field fixed effects. Article counts are estimated with Poisson Regression. T-statistics are in parentheses. ***, **, and * denote significance at the 1%, 5%, and 10% levels respectively.
Dependent Variable: Impact Productivity Raw Productivity Article Count 1 2 3 4 5 6
Career Years -0.010 0.007 0.099 0.123 0.045*** 0.046*** (0.28) (0.21) (1.16) (1.45) (6.01) (6.04)
Career Years^2 -0.006*** -0.007*** -0.015*** -0.018*** -0.005*** -0.005*** (2.88) (3.69) (3.35) (3.83) (11.04) (11.10)
Career Years^3 (in 1,000s) 0.101*** 0.138*** 0.242*** 0.297*** 0.070*** 0.072*** (2.99) (3.84) (3.19) (3.69) (9.00) (9.16)
Associate Professor -0.487*** -0.455*** -1.131*** -1.022*** -0.138*** -0.128*** (3.09) (2.78) (3.43) (3.07) (4.91) (4.45)
Full Professor -0.895*** -0.876*** -1.946*** -1.841*** -0.237*** -0.224*** (4.36) (3.78) (5.29) (4.81) (6.42) (5.93)
Chaired Full Professor -1.260*** -1.055*** -2.515*** -2.184*** -0.190*** -0.172*** (5.55) (4.50) (6.37) (5.37) (4.23) (3.72)
Editor Impact -0.038 -0.039 -0.142 -0.162 0.045 0.029 (0.04) (0.04) (0.11) (0.13) (0.78) (0.49)
Visiting 0.028 0.034 0.161 0.163 0.051* 0.037 (0.33) (0.42) (0.91) (0.96) (1.79) (1.26)
Decade 1980s 0.180 0.481** 0.841*** 1.528*** 0.042 0.108** (1.60) (2.42) (3.98) (4.76) (1.36) (2.28)
Decade 1990s 0.237 1.116*** 1.282*** 2.831*** 0.055 0.200*** (1.44) (2.79) (3.49) (4.08) (1.11) (3.24)
Finance*Decade1970s -1.278** -0.756 -0.470 0.835 0.319 0.333 (2.47) (0.90) (0.52) (0.65) (1.60) (1.47)
Finance*Decade1980s -1.126** -0.387 -0.939 0.470 0.032 0.027 (2.29) (0.49) (1.06) (0.39) (0.17) (0.13)
Finance*Decade1990s -0.975* -0.434 -1.190 -0.023 -0.170 -0.271 (1.78) (0.55) (1.24) (0.02) (0.88) (1.27)
Constant 4.817*** 4.017*** 7.983*** 6.287*** (13.99) (12.33) (13.54) (13.59)
Observations 35,917 35,917 35,917 35,917 35,917 35,917 F-Test (p-value) for inclusion of Univ.F.E. 35.28
(0.000) 18.55 (0.000) 228.58
(0.000) Individual Fixed Effects Yes Yes Yes Yes Yes Yes University Fixed Effects No Yes No Yes No Yes
60

Table 5, Panel B: University Fixed Effects across Decades and Field
University fixed effects estimates for the impact productivity estimation from Table 5, Panel A, column 2.
Dependent Variable: Impact Productivity Economics Departments Finance Departments 1970s 1980s 1990s 1970s 1980s 1990s Carnegie Mellon -1.190*** 0.432* -0.109 1.717*** 0.550 -1.062* (4.89) (1.90) (0.56) (4.25) (1.06) (1.90) Columbia 1.077*** -0.044 -0.847* 1.174*** -0.227 -0.347** (3.96) (0.13) (1.94) (8.43) (1.06) (2.03) Cornell -0.499** -0.332 -0.255 -0.045 -0.937*** -0.551 (2.34) (0.90) (0.68) (0.11) (4.44) (1.06) Duke -0.401* 0.367 -0.619*** -0.535*** 0.233* -0.656*** (1.84) (1.64) (2.86) (2.62) (1.95) (4.78) Harvard 2.127*** 0.250 -1.781*** -2.249*** -2.114*** -2.781** (11.33) (1.00) (5.53) (3.90) (3.33) (2.30) Indiana 0.349*** 0.819*** 0.149 1.846*** -0.883*** 0.246** (2.65) (4.73) (0.87) (29.39) (3.39) (2.36) MIT 1.003*** 0.560*** -1.208*** 1.533* 0.819 -0.128 (5.28) (3.10) (3.30) (1.92) (0.81) (0.20) New York U -0.307 -0.300 -0.279 1.457*** 0.340** 0.991*** (0.95) (0.67) (0.59) (10.99) (1.97) (7.95) Northwestern 0.892*** 1.377*** 0.351 0.427* 0.743*** -0.253 (5.59) (6.68) (1.01) (1.75) (3.47) (0.75) Ohio State U 1.535*** -0.348* -0.892*** 2.365*** -0.181 -0.270 (7.48) (1.68) (3.22) (11.58) (0.69) (0.47) Princeton 1.220*** 1.530*** -0.439 (4.16) (4.81) (0.96) Purdue -0.276 -0.911*** -0.821*** 0.952** 1.396** 0.056 (0.50) (3.49) (2.59) (2.24) (2.18) (0.11) Stanford 1.313*** 0.332 -1.074*** 1.193*** 2.719*** 1.141** (7.62) (1.25) (3.29) (3.83) (6.82) (2.17) U British Columbia 0.564*** 0.196 0.415* 3.285*** 0.320 0.497 (2.61) (0.80) (1.80) (3.01) (1.29) (1.49) UC Berkeley -0.475** -0.147 -0.932*** 0.214 -0.866** -0.319 (2.32) (0.56) (3.29) (0.64) (2.26) (0.94) UC Los Angeles 1.425*** 0.635 -0.345 2.025*** 0.987** 0.508* (3.61) (1.56) (1.11) (11.25) (2.26) (1.72) U of Chicago 1.796*** 0.889*** -0.463 2.466*** 1.465*** -0.460 (8.66) (2.91) (1.56) (12.08) (6.12) (1.19) U of Michigan 0.892*** 1.149*** 0.357* 1.259*** 1.001*** -0.621** (6.10) (7.56) (1.74) (4.19) (3.11) (2.17) U of Pennsylvania 1.217*** 0.868*** -0.167 0.591*** -0.539* -0.210 (5.11) (5.18) (0.89) (3.47) (1.76) (0.66) U of Rochester 1.420*** 1.552*** 0.166 -0.163 -1.045*** -0.558* (5.89) (5.74) (0.60) (0.29) (3.38) (1.65) U of Southern Calif. 0.293*** -0.437*** 0.031 -0.101 1.338*** -0.485 (2.69) (4.95) (0.15) (0.19) (3.97) (1.58) U of Texas -0.059 -0.138 -0.171 -0.631** -0.193 -0.180 (0.17) (0.47) (0.34) (2.35) (0.59) (0.32) U of Washington -0.600*** -0.501* -1.462*** 1.094 -0.036 -1.041 (2.95) (1.85) (4.15) (1.48) (0.04) (1.09) U of Wisconsin 0.316** -0.227 -0.676 0.687*** 0.060 0.497 (2.51) (1.09) (1.49) (3.32) (0.30) (1.63) Yale 1.029*** -0.028 -0.100 1.882*** 1.036*** -1.660*** (3.35) (0.07) (0.26) (2.72) (3.56) (4.19) Significant (+) Count 17 9 2 16 10 4 Significant (-) Count 5 4 9 3 6 7
61

Table 6: Change in Individual Adjusted Impact Productivity following Moves
The transition matrix below presents the change in Individual Adjusted Impact Productivity around a move, where Individual Adjusted Impact Productivity is the residual of regressing impact productivity on rank, career years, career years squared, career years cubed, visiting, and editor impact. To construct the statistics below, we calculate the average of the two years of adjusted productivity following a move and subtract from it the average of the two years of adjusted productivity prior to the move. We exclude the move year in both pre- and post-measures. A move up is defined to be a move into a top 5 university by anyone or a move into a top 25 university by those from other school. The top 5 are chosen as those with the highest decade average individual productivity in the field. A lateral move is moving within the top 5, within the top 6-25 universities or within others. A move down is a move from top 5 to top 6-26 or from top 25 to others. The observation counts for moves in each category are given below the change in productivity. Asterisks *, **, and *** denote significance at a 10%, 5%, and 1% level.
Assistant and Associate Professors 1970s 1980s 1990s Move Down 0.558 -0.806* 0.337
54 119 145
Lateral -0.795 -0.484 0.240
63 131 124
Up 2.013** 0.454 -0.254
31 75 60
All Moves 0.287 -0.385 0.193
148 325 329
Full Professors 1970s 1980s 1990s Move Down -1.008 -0.151 -0.692
37 104 123
Lateral -1.938** -0.493 -0.172
40 111 164
Up -0.067 1.326 -1.119*
28 66 95
All Moves -1.112* 0.061 -0.575**
105 281 382
62

Table 7: Determinants of Faculty Productivity – Selection Model
Panel A presents the logit estimation of the probability of moving as in equation (3) (i). The dependent variable is an indicator for a move. We estimate a fourth order polynomial of the individual’s age, calculated as the current year minus the undergraduate year plus 22. A likelihood ratio test (LRT) is given for testing joint relevance of the variables in estimating the probability of a move. Panel B presents the conditional logit selection estimation of the probability of being at a given location as in equation (3) (ii). The dependent variable is an indicator variable for the faculty being at the potential school for each year. Flight Time is the difference in flight times (expressed in 100s of minutes) to the origin home city, defined as the city of the undergraduate institution, from the prior year location and potential location. Prior Location is an indicator for the potential location being a different university than the university from the prior year. Not Prior Location = 1 – Prior Location, for convenience of interpretation. PhDSchool Location is an indicator for whether the potential school is the location of the individuals’ Ph.D. degree. It is allowed to equal 1 only for individuals whose prior year school is a top 5 school and who have graduated from their Ph.D. program more than 2 years prior. Productivity distance is the difference between the individual’s two-prior-year average productivity and the potential locations’ average two prior year productivity. For assistant and associate professors, we take the absolute value of this number, as described in the text. Associate, Full, and Chaired are rank indicator variables. Robust standard errors are clustered at the school level. A Wald test statistic is provided for testing joint relevance of the variables in the estimation. Panels C and D present the estimation results from the second stage of the selection model. The only difference in these estimations from those of Table 5 is that the contrast matrix setting up the university fixed effects estimation has been replaced by the predicted probability of each individual being at each location, estimated in the conditional logit in step 1. Impact productivity is the dependent variable and is measured as the count of AER equivalent pages written by each faculty in 41 economics and finance journals with each article multiplied by the decade impact factor of the journal published. Adjustment to AER equivalents normalizes by font, typesetting and average article length. Publication pages are divided by 1/n coauthors. The 1990s decade includes 2000 and 2001. Career years is the years since Ph.D. The model is fit with individual fixed effects. Standard errors are adjusted to account for the first stage variance by bootstrapping the first stage, taking the variance of the predicted probabilities and adding the variance to the regression variance in the second stage following Petrin and Train (2002). In all panels, T-statistics are in parentheses. ***, **, and * denote significance at the 1%, 5%, and 10% levels, respectively.
Panel A: First Stage – Selection to Move
Dependent variable: Indicator for Moves Age 7.29*** (7.89) Age2 -0.23*** (7.27) Age3 (/1,000) 3.23*** (6.63) Age4 (/1,000,000) -16.37*** (6.04) Constant -84.83*** (8.72) Observations 35,993 Pseudo R-Square 0.037 LRT Test Statistic for Relevance 541.2
63
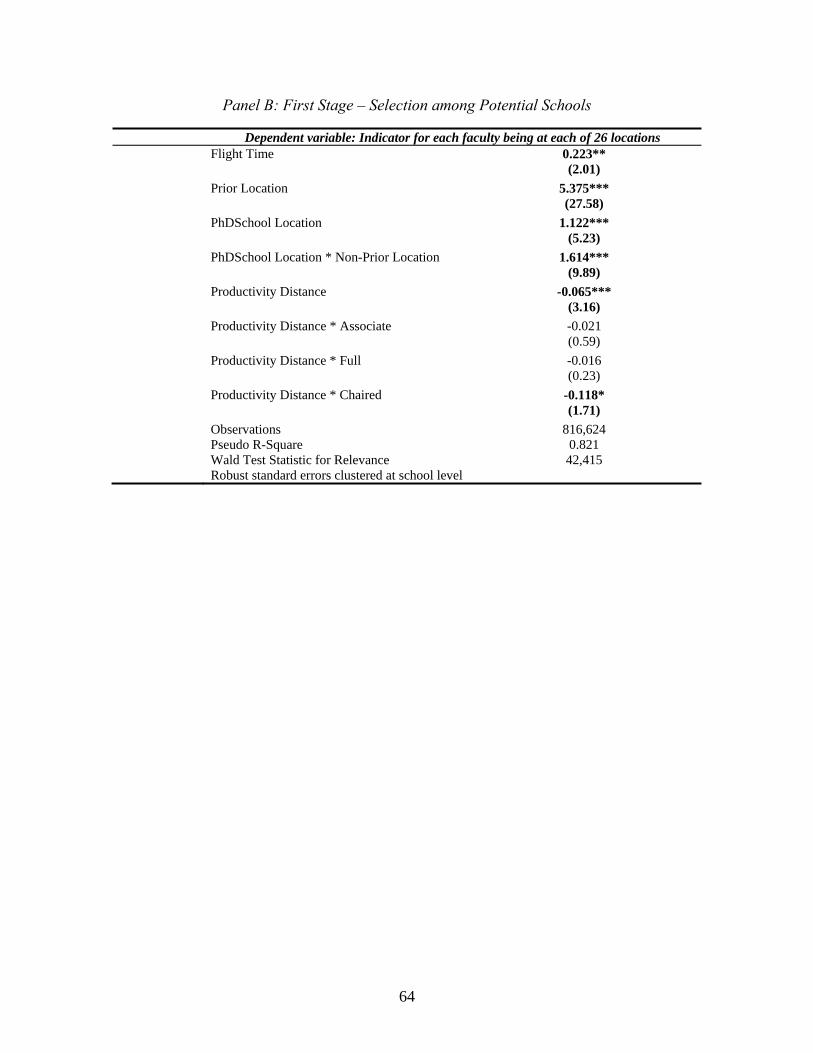
Panel B: First Stage – Selection among Potential Schools Dependent variable: Indicator for each faculty being at each of 26 locations Flight Time 0.223** (2.01) Prior Location 5.375*** (27.58) PhDSchool Location 1.122*** (5.23) PhDSchool Location * Non-Prior Location 1.614*** (9.89) Productivity Distance -0.065*** (3.16) Productivity Distance * Associate -0.021 (0.59) Productivity Distance * Full -0.016 (0.23) Productivity Distance * Chaired -0.118* (1.71) Observations 816,624 Pseudo R-Square 0.821 Wald Test Statistic for Relevance 42,415 Robust standard errors clustered at school level
64

Panel C: Determinants of Faculty Productivity – Selection Model
Dependent variable: Impact Productivity Career Years -0.222***
(4.99) Career Years^2 0.004* (1.94) Career Years^3 -0.048 (1.32) Associate Professor -0.425*** (2.77) Full Professor -0.651*** (3.18) Chaired Full -0.855*** (3.55) Editor Impact -0.348 (0.94) Visiting 0.022 (0.16) Decade 1980s 0.704*** (2.96) Decade 1990s 1.100*** (3.65) Finance*Decade1970s -0.427 (0.35) Finance*Decade1980s 0.060 (0.05) Finance*Decade1990s 0.204 (0.19) Constant 4.969*** (12.60) Observations 29,754 Individual Fixed Effects Yes
65

Panel D: University Fixed Effects across Decades and Field – Selection Model
Dependent Variable: Impact Productivity Economics Departments Finance Departments 1970s 1980s 1990s 1970s 1980s 1990s Carnegie Mellon -34.81* 15.44 0.02 81.72*** -2.00 -20.78 (1.74) (1.46) 0.00 (2.64) (0.12) (1.18) Columbia 49.82*** -5.59 5.28 36.54 5.50 -0.17 (2.84) (0.63) (0.55) (1.57) (0.56) (0.02) Cornell 0.61 -3.88 6.30 -10.62 -32.49 -15.95 (0.05) (0.44) (0.52) (0.32) (1.20) (0.48) Duke -5.57 9.14 -5.29 21.82 27.62 23.29 (0.40) (0.86) (0.32) (0.56) (1.39) (1.27) Harvard 81.69*** 14.61** -18.66** -2.52 -21.89 -25.49 (6.31) (2.05) (2.34) (0.03) (1.18) (1.36) Indiana 29.26 11.80 8.52 24.94 -11.25 3.69 (1.44) (0.97) (0.49) (0.60) (0.65) (0.17) MIT 26.41*** 32.51*** -1.51 19.83 24.42 -3.59 (2.60) (3.87) (0.19) (0.82) (1.62) (0.23) NYU -17.31 -23.15** -25.90** 5.91 2.06 23.25* (1.33) (2.43) (2.23) (0.31) (0.21) (1.91) Northwestern 6.71 14.31* 17.39* 12.07 7.73 -24.06** (0.56) (1.79) (1.88) (0.59) (0.72) (2.01) Ohio State 50.32** -15.68 -47.57* 31.27 6.80 -7.19 (2.18) (0.99) (1.86) (0.87) (0.43) (0.28) Princeton 21.80** 30.98*** -14.22* -- -- -- (1.96) (3.83) (1.74) -- -- -- Purdue 39.68 -27.50* -29.12 -9.49 -3.03 -23.52 (1.26) (1.72) (1.45) (0.33) (0.16) (1.03) Stanford 16.75 10.78 -10.62 11.68 30.47** -2.08 (1.45) (1.39) (1.00) (0.52) (2.27) (0.12) UBC 15.93 -19.89* -4.83 43.48 -4.12 -16.88 (1.12) (1.79) (0.36) (1.03) (0.28) (1.01) UC Berkeley 11.39 2.77 -13.31 -19.23 8.85 7.41 (0.96) (0.32) (1.36) (0.69) (0.52) (0.36) UCLA -14.06 9.52 6.48 40.20 18.95 12.01 (0.78) (0.71) (0.50) (1.25) (1.26) (0.66) U of Chicago 1.98 4.72 -11.82 21.16 19.14** -15.59 (0.18) (0.59) (1.34) (1.03) (2.10) (1.37) U of Michigan 4.96 27.73*** 26.81** -1.46 20.68* 3.25 (0.48) (2.93) (2.47) (0.04) (1.73) (0.27) U of Pennsylvania 25.36** 25.36*** 1.90 13.29 -11.77 -1.02 (2.17) (3.07) (0.21) (0.89) (1.31) (0.10) U of Rochester 21.84 29.65** -3.57 -29.69 -12.43 -5.16 (1.27) (2.42) (0.29) (1.30) (1.03) (0.34) USC -10.97 -21.11 -17.36 8.64 14.12 -15.06 (0.55) (1.38) (1.11) (0.25) (0.63) (0.80) U of Texas -19.79 -11.67 -16.52 -3.33 -3.34 6.60 (0.76) (0.69) (1.03) (0.17) (0.25) (0.31) U of Washington -9.13 -8.44 -22.44 5.58 6.46 -15.09 (0.57) (0.57) (1.25) (0.27) (0.42) (0.63) U of Wisconsin 7.94 -6.58 -6.71 84.26 4.68 25.17 (0.70) (0.77) (0.62) (1.20) (0.19) (1.27) Yale 2.92 -4.66 -12.01 144.10*** 38.30** -24.23 (0.29) (0.58) (1.32) (3.07) (2.44) (1.04) Significant (+) Count 6 7 2 2 4 1 Significant (-) Count 1 2 4 0 0 1
66

Table 8: Determinants of Faculty Productivity & Team Externality Only two differences distinguish the regression from column 2 of Table 5. First, included is the variable team, calculated as the prior two year average productivity of all colleagues in one’s department who are productive for the years considered. Second, all columns include individual fixed effects and university random effects. As before, observations are at the individual-year level. Impact productivity is measured as the count of AER equivalent pages written by each faculty in 41 economics and finance journals, normalized by font, typesetting and average article length, divided by 1/n coauthors and multiplied by the decade impact factor of the journal. Career years is the years since Ph.D. Associate and Full Professor, Chaired, and Visiting are indicator variables for the position of the faculty. Editor impact is the sum of the impact factors for the journals for which the faculty serves as an editor or co-editor. T-statistics are in parentheses. ***, **, and * denote significance at the 1%, 5%, and 10% levels, respectively.
Dependent Variable: Impact Productivity
Career Years -0.005 (0.13) Career Years^2 -0.006*** (3.27) Career Years^3 (in 1,000s) 0.117*** (3.42) Associate Professor -0.501*** (3.09) Full Professor -0.914*** (4.06) Chaired Full Professor -1.169*** (4.90) Editor Impact 0.004 0.00 Visiting 0.043 (0.56) Decade 1980s 0.310** (2.45) Decade 1990s 0.993*** (4.02) Finance*Decade1970s -1.024* (1.78) Finance*Decade1980s -0.883 (1.53) Finance*Decade1990s -0.701 (1.21) Team*Decade1970s 0.160** (2.76) Team*Decade1980s 0.119*** (3.60) Team*Decade1990s -0.131*** (2.94) Constant 4.342*** (11.64) Observations 35,917 Individual Fixed Effects Yes University Random Effects Yes
67

Table 9: Decomposition of University Fixed Effects The dependent variable is the field-decade university fixed effects from the estimation of Table 8 in which the team externality effect has been removed. Non-research/service is decade average of each year’s percentage of faculty who have not published an article in the prior two years. Editors In-House is the natural logarithm of the count of editors housed by the department for a year, averaged over the decade. Faculty Training Quality is the decade average percentage of faculty trained in top 5 schools, where the top 5 schools have the highest average productivity in the field for the decade. Ph.D. Program Quality is average number of students placed in top 25 universities from that department. Distance Metro is the natural log of the distance to the closest metropolitan area. State School is an indicator of whether the university is a public institution. Snowfall is the average snowfall in January for the university location. T-statistics are in parentheses. ***, **, and * denote significance at the 1%, 5%, and 10% levels, respectively.
Dependent Variable: University Fixed Effects Estimates Economics Finance
Editors In-House -0.109 -0.273** (1.31) (2.32)
Editors In-House*Decade 1970s 0.422*** 0.142 (3.66) (0.48)
Editors In-House *Decade 1980s 0.193* -0.079 (1.84) (0.49)
Editors In-House *Decade 1990s -0.106 -0.367** (1.03) (2.49)
Faculty Training Quality 1.384* 0.925 -0.955 -0.943 (1.91) (1.58) (1.50) (1.48)
Non-research/service -1.975** -3.404*** (2.26) (5.66)
Non-research/service*1970s Decade -0.776 -2.694*** (1.01) (4.05)
Non-research/service*1980s Decade -1.242 -3.739*** (1.59) (4.89)
Non-research/service*1990s Decade -1.299 -3.499*** (1.49) (5.18)
Ph.D. Program Quality -0.083 -0.207* 0.195 0.326 (0.59) (1.77) (0.74) (1.26)
Distance Metro 0.052 0.023 0.083 0.082 (0.95) (0.52) (1.20) (1.21)
State School -0.079 0.138 -0.179 -0.061 (0.36) (0.77) (0.65) (0.23)
Snowfall 0.001 0.004 -0.010 -0.012* (0.11) (1.02) (1.53) (1.90)
Constant 0.557 -0.008 2.337*** 2.196*** (0.98) (0.02) (5.09) (4.85)
Observations 75 75 72 72 Decade Random Effects Yes Yes Yes Yes Partial R-Square (Type III SSE) Model (R-Squared) 0.21 0.53 0.42 0.50 Non-research/service 0.06 0.02 0.29 0.27 Editors 0.02 0.16 0.05 0.06 Training of Faculty 0.04 0.02 0.02 0.02 Ph.D. Program 0.01 0.02 0.00 0.01 Metro Distance 0.01 0.00 0.01 0.01 State School 0.00 0.00 0.00 0.00 Snow 0.00 0.00 0.02 0.03 Both Non-research & Editors 0.08 0.40 0.36 0.44
68

Table 10: Differences in Salaries SUR Estimation Salaries are the decade average university 9 or 10 month salaries as collected in the National Center of Education Statistics (HEGIS and IPEDS series) yearly survey broken down by assistant, associate and full professorship. F.E.Impact is the estimated university fixed effects for economics departments by decade. F.E.Individual is the estimated individual fixed effects for economics departments by decade. Differences are taken at the decade level. The difference estimations are fitted using a seemingly unrelated regression to capture cross-equation correlation in the errors. Z-statistics are in parentheses. ***, **, and * denote significance at the 1%, 5%, and 10% levels, respectively. The estimating equation is given by:
itititt IndividualEFImpactEFSalary εβββ +Δ+Δ+=Δ .... 210
Coefficient z-statistics
Assistant Professors ΔF.E.Impact -1,385.8 ** (2.23) ΔF.E.Individual 267.4 (0.51) Constant 18,739.5 *** (28.44) R-Squared 0.059 Observations 94
Associate Professors ΔF.E.Impact -1,749.5 *** (2.45) ΔF.E.Individual 262.1 (0.44) Constant 21,201.7 *** (28.01) R-Squared 0.032 Observations 94
Full Professors ΔF.E.Impact -2,916.5 *** (2.66) ΔF.E.Individual 902.4 (0.98) Constant 31,750.8 *** (27.26) R-Squared 0.091 Observations 94
69

Appendix 2 Panel A: Determinants of Faculty Productivity by Rank Observations are at the individual-year level. Impact and raw productivities are measured as the count of AER equivalent pages written by each faculty in 41 economics and finance journals. Adjustment to AER equivalents normalizes by font, typesetting and average article length. Publication pages are divided by 1/n coauthors. Impact productivity multiplies each article by the decade impact factor of the journal published. Article count is the simple sum of articles published by year. The 1990s decade includes 2000 and 2001. Career years is the years since Ph.D. Associate and Full Professor, Chaired, and Visiting are indicator variables for the position of the faculty. Editor impact is the sum of the impact factors for the journals for which the faculty serves as an editor or co-editor. All columns include individual fixed effects. Columns 2, 4 and 6 add university-field fixed effects. Article counts are estimated with Poisson Regression. T-statistics are in parentheses. ***, **, and * denote significance at the 1%, 5%, and 10% levels, respectively.
Dependent Variable: Impact Productivity Raw Productivity Article Count 1 2 3 4 5 6
Career Years -0.102*** -0.072* -0.100 -0.044 0.025*** 0.029*** (2.63) (1.80) (1.31) (0.56) (4.08) (4.65)
Career Years^2 -0.001 -0.004* -0.006 -0.010** -0.004*** -0.004*** (0.72) (1.93) (1.53) (2.38) (10.10) (10.49)
Career Years^3 (1,000s) 0.045 0.092*** 0.122* 0.198*** 0.056*** 0.061*** (1.51) (2.68) (1.85) (2.63) (7.85) (8.28)
Chaired Full Professor -0.282** -0.416*** -0.444** -0.696*** 0.050* -0.019 (2.27) (4.06) (2.50) (4.69) (1.87) (0.51)
Editor Impact 0.092 0.077 0.046 0.060 0.050 0.023 (0.12) (0.09) (0.04) (0.05) (0.87) (0.38)
Visiting 0.032 0.037 0.162 0.142 0.053* 0.034 (0.37) (0.45) (0.93) (0.84) (1.85) (1.15)
Decade 1980s 0.449** 0.725*** 1.265*** 1.986*** 0.078** 0.150*** (2.32) (3.20) (3.72) (5.79) (1.99) (2.59)
Decade 1990s 0.772*** 1.657*** 2.239*** 4.036*** 0.041 0.175** (2.62) (3.15) (3.98) (4.69) (0.71) (2.36)
Finance*Decade1970s -1.229** -1.327 -0.308 0.793 0.344* 0.497** (2.12) (1.20) (0.32) (0.46) (1.70) (2.08)
Finance*Decade1980s -1.150** -1.160 -0.921 -0.026 0.058 0.116 (2.36) (1.10) (1.07) (0.02) (0.29) (0.52)
Finance*Decade1990s -1.166** -1.278 -1.717* -1.240 -0.150 -0.193 (2.36) (1.40) (1.85) (0.83) (0.75) (0.86)
Full*Decade 1970s 0.203 0.684** 0.198 1.239*** -0.074 0.008 (0.77) (2.46) (0.35) (2.63) (1.62) (0.13)
Full*Decade 1980s -0.436*** -0.115 -0.805** -0.245 -0.130*** -0.072 (2.60) (0.70) (2.44) (0.92) (3.55) (1.46)
Full*Decade 1990s -0.824*** -0.623** -1.594*** -1.428*** -0.058 0.010 (2.69) (2.37) (3.41) (3.40) (1.45) (0.19)
Full*Finance*1970s -0.037 0.079 -0.316 -0.802 -0.160* -0.374** (0.09) (0.11) (0.38) (0.59) (1.73) (2.33)
Full*Finance*1980s 0.002 0.321 -0.127 0.176 -0.095 -0.076 (0.01) (0.74) (0.23) (0.25) (1.34) (0.79)
Full*Finance*1990s 0.191 0.282 0.587 1.004 -0.023 0.006 (0.50) (0.73) (0.92) (1.61) (0.32) (0.08)
Constant 4.607*** 3.821*** 7.640*** 5.671*** (12.36) (10.38) (11.00) (9.45)
Observations 35,917 35,917 35,917 35,917 35,917 35,917
Individual Fixed Effects Yes Yes Yes Yes Yes Yes University Fixed Effects No Yes No Yes No Yes
70

Appendix 2, Panel B: University Fixed Effects for Assistant & Associate Professors University fixed effects estimates for the impact productivity estimation from Appendix 2, Panel A,
olumn 2. C
Dependent Variable: Impact Productivity Economics Departments Finance Departments 1970s 1980s 1990s 1970s 1980s 1990s Carnegie Mellon -1.008** 0.272 0.338** 1.888*** -0.045 -1.432** (2.23) (1.26) (2.14) (6.53) (0.09) (2.05) Columbia 1.676*** 0.123 -1.180** 1.328*** 0.096 -0.113 (6.45) (0.44) (2.41) (7.34) (0.44) (0.55) Cornell -0.261 -0.209 -0.448 0.393 -0.157 -0.580 (1.18) (0.68) (1.35) (1.13) (0.65) (1.31) Duke -0.604*** 1.099*** -0.532** -0.830*** 0.461 0.848** (3.27) (4.21) (2.35) (3.51) (1.64) (2.43) Harvard 2.012*** 0.548** -1.284*** -1.640*** -1.498** -2.762** (10.40) (2.25) (4.05) (3.22) (2.38) (2.00) Indiana 1.492*** 0.732*** -0.052 2.165*** -0.869*** 0.439*** (7.55) (4.09) (0.21) (8.85) (2.58) (2.77) MIT 0.488* 0.957*** -0.780*** 1.989*** 2.366 -0.029 (1.84) (3.75) (2.59) (2.61) (1.63) (0.05) New York U 0.331 -0.374 -0.021 1.639*** 0.613 2.047*** (1.06) (0.80) (0.04) (6.66) (1.51) (9.02) Northwestern 0.920*** 2.252*** -0.343 0.884* 1.097*** -0.237 (5.08) (15.09) (1.17) (1.95) (4.05) (0.70) Ohio State U 1.551*** 0.358 0.758** 2.498*** 0.543*** -0.653 (7.95) (1.64) (1.97) (9.77) (3.08) (1.37) Princeton 1.064*** 2.573*** 0.513 (3.50) (7.97) (0.98) Purdue 0.161 -0.954*** -0.992*** 0.629 1.483*** 0.554 (0.27) (5.74) (2.77) (1.48) (2.93) (1.10) Stanford 1.771*** 1.240*** -0.405 1.129*** 3.932*** 0.649 (9.86) (5.58) (1.03) (4.41) (12.28) (1.05) U British Columbia 0.954*** 0.117 0.703** 2.945** 0.247 0.266 (3.78) (0.51) (2.15) (2.43) (1.23) (0.81) UC Berkeley -0.399** 0.305 -0.667 0.309 0.602 -0.641 (2.45) (1.20) (1.64) (0.81) (1.61) (1.51) UC Los Angeles 2.110*** -0.256 -0.707 2.268*** 1.521*** -0.522 (6.27) (0.62) (1.49) (14.13) (3.83) (1.16) U of Chicago 2.470*** 0.881*** -0.210 2.709*** 2.063*** -0.262 (11.33) (4.00) (0.71) (9.02) (8.40) (0.69) U of Michigan 1.301*** 1.828*** 0.063 1.832*** 1.201*** -0.196 (5.88) (5.16) (0.24) (4.10) (2.81) (0.78) U of Pennsylvania 1.366*** 1.063*** -0.287 0.728*** -0.393 -0.173 (4.97) (6.28) (1.25) (4.54) (1.55) (0.65) U of Rochester 0.411 1.569*** 0.914*** -0.469 -1.410*** 0.380 (1.23) (5.28) (2.99) (0.92) (4.88) (0.98) U of Southern Calif. 0.428** -0.313 0.338 0.460 1.513*** -0.471 (2.43) (1.59) (1.15) (0.75) (4.48) (1.41) U of Texas 1.330*** -0.355 0.255 -0.369 0.023 -0.396 (4.44) (1.53) (0.41) (1.17) (0.09) (0.54) U of Washington 0.142 -0.237 -2.093*** 1.110** 1.062 -1.071 (0.39) (0.77) (5.59) (1.99) (1.08) (0.95) U of Wisconsin 0.784*** -0.299 -0.541 -0.270 0.593*** 0.654* (4.94) (1.19) (1.23) (0.52) (3.32) (1.96) Yale 1.987*** -0.305 0.395 3.573*** 0.744* -1.763*** (7.08) (0.80) (1.06) (7.61) (1.86) (3.95) Significant (+) Count 17 11 4 15 10 4 Significant (-) Count 3 1 6 2 3 3
71

Appendix 2, Panel C: University Fixed Effects for Full Professors University fixed effects estimates for the impact productivity estimation from Appendix 2, Panel A, Column 2.
Dependent Variable: Impact Productivity Economics Departments Finance Departments 1970s 1980s 1990s 1970s 1980s 1990s Carnegie Mellon -1.080*** 1.276*** -0.513 3.250*** -1.431* (3.90) (5.06) (1.50) (4.79) (1.71) Columbia -0.066 -0.281 0.100 0.494 -1.003*** -0.756** (0.16) (0.47) (0.25) (0.85) (2.79) (2.28) Cornell -0.410 -0.504 -0.025 -2.157*** -2.064*** -0.679** (0.92) (0.83) (0.05) (5.12) (11.05) (2.51) Duke -0.521* -0.540** -0.746*** -2.329*** -2.094*** (1.84) (2.24) (2.93) (5.19) (6.88) Harvard 2.394*** 0.218 -2.248*** -3.889*** -3.497*** -1.752** (10.11) (0.82) (6.07) (4.80) (4.64) (2.32) Indiana -1.117*** 0.351 -0.109 -0.808*** -1.026*** -0.808*** (3.46) (1.18) (0.33) (4.72) (3.28) (4.72) MIT 0.912*** 0.177 -1.569*** 0.101 -1.049 -0.512 (4.04) (0.65) (3.34) (0.09) (0.93) (0.65) New York U -1.474*** -0.589 -0.459 0.019 -0.440** -0.444*** (2.66) (0.86) (0.74) (0.04) (2.49) (2.67) Northwestern 0.347 0.480 1.273*** -0.465 0.021 0.200 (1.06) (1.41) (2.66) (1.11) (0.08) (0.70) Ohio State U 1.771*** -0.978** -2.001** 1.565* -2.291* 0.369 (4.16) (2.16) (2.42) (1.85) (1.71) (0.13) Princeton 0.669** 0.228 -1.592*** (2.42) (0.55) (3.99) Purdue -0.423 -0.084 -0.587 3.030*** 3.234*** -0.898 (1.06) (0.15) (1.51) (7.16) (3.30) (0.33) Stanford 0.204 -0.819** -1.824*** 1.056* 0.552 2.712*** (0.73) (2.42) (5.47) (1.71) (1.20) (5.23) U British Columbia -0.265 0.043 0.152 1.472 0.806 1.472 (0.70) (0.11) (0.59) (1.23) (0.69) (1.23) UC Berkeley -0.702* -0.400* -0.914*** -0.059 -3.081*** 1.795*** (1.94) (1.69) (4.23) (0.10) (4.94) (3.30) UC Los Angeles 0.896 1.099* -0.152 1.446** -1.148* 1.408*** (1.28) (1.93) (0.43) (2.35) (1.75) (4.07) U of Chicago 0.580** 0.653*** -0.257 1.472*** -0.105 -0.766* (2.13) (2.73) (1.10) (2.98) (0.20) (1.70) U of Michigan 0.020 0.630*** 0.459** 1.239*** 1.553*** -2.633*** (0.09) (2.70) (2.15) (3.27) (6.43) (7.26) U of Pennsylvania 0.869** 0.779** 0.170 0.261 -0.170 0.522 (2.44) (2.28) (1.00) (1.20) (0.41) (1.31) U of Rochester 2.084*** 2.203*** -0.789** 1.975** 0.427 -1.804*** (7.46) (9.42) (2.14) (2.09) (0.60) (6.03) U of Southern Calif. 0.060 -0.408*** -0.114 -1.180* -0.722*** -0.722*** (0.24) (2.67) (0.45) (1.95) (2.84) (2.84) U of Texas -1.506** -0.184 -0.644 -1.395** -0.607 0.158 (2.50) (0.33) (1.06) (2.15) (1.33) (0.39) U of Washington -1.452*** -0.482 -0.757** -0.211 -1.369 -1.123 (3.45) (0.99) (2.09) (0.16) (1.19) (1.24) U of Wisconsin -0.314* -0.114 -0.550 1.088*** -0.390 0.721*** (1.75) (0.65) (1.39) (2.80) (1.21) (3.00) Yale -1.745*** -0.117 -1.092** -1.863*** 1.798*** -0.853 (3.61) (0.22) (2.23) (3.99) (2.78) (1.10) Significant (+) Count 7 6 2 8 4 4 Significant (-) Count 9 5 10 6 9 12
72

73