Embed Size (px)
Citation preview
595
Are Elementary Teachers Better Prepared in theContent of Elementary Mathematics in the 1980s?
,/
Thomas Gibney John GintherCollege of EducationUniversity of ToledoToledo, Ohio 43606
Math DepartmentEastern Michigan UniversityYpsUanti, Michigan 48197
Fred PiggeCollege of EducationBowling Green State UniversityBowling Green, Ohio 43403
^Those students taking the test, regardless of thedecade, all had completed at least one college-levelcourse in mathematics covering the real-number systemand geometric topics.^
Among the issues being discussed as part of the widening public interest in the qualityof our schools is the depth of knowledge possessed by elementary teachers. Morespecifically, of central importance in the present technological era is the level ofmathematical competence of the elementary teacher. Related to this issue is the questionof trends in the general mathematical competence level of new elementary teacherscompared to that of inservice elementary teachers.
This article relates the results of a sequence of three studies over the past 18 yearswhich were primarily designed to measure selected concepts, skills, and knowledgerelated to the mathematics competency of elementary teachers. Six previous articles (seefirst six references) have reported the findings of data analyses related to thesemathematical understandings of elementary teachers in 1967-69 and/or 1975-77. Thepresent article discusses and then compares the mathematical understandings (asrevealed by performance on the same 65-item test) of 1983-85 elementary teachers withsimilar teachers of the two earlier testing periods. Its primary purpose is to report anddiscuss the changes, if any, that have occurred during the past eighteen years in themeasured mathematical competency levels of preservice and inservice elementaryteachers.
Procedures
To assess the mathematical understandings of elementary teachers in the 1980s, theauthors administered a concept/knowledge/skill test to 755 elementary teachers in threemidwestern universities (Bowling Green State University, Eastern Michigan University,and the University of Toledo) during 1983-85. The test was administered to preservice
School Science and MathematicsVolume 88 (7) November 1988
596 Better Prepared
and inservice elementary-education students during their first week in mathematicseducation classes at the three universities.The same knowledge test consisting of sixty-five items was used during each of the
three two-year testing periods. Those students taking the test, regardless of the decade,all had completed at least one college-level course in mathematics covering thereal-number system and geometric topics. Although some of the inservice teachers wereenrolled in undergraduate mathematics education courses, most of them were enrolled ingraduate mathematics education courses at the three universities.
TABLE 1
Item classification for the test
Number ofItems Subtests Items
10Geometry1,9,40,41,43,47,52,53,58,6410Number Theory5,13,20,27,28,44,51,56,59,628Numeration Systems3,11,18,29,34,42,48,5711Fractions7,16,17,24,31,37,39,45,50,54,6010Structural Properties 8,15,22,25,38,49,55,61,63,656Sets2,10,23,30,35,3610Operations (+. -, x, -) 4,6,12,14,19,21,26,32,33,46
65 = Total
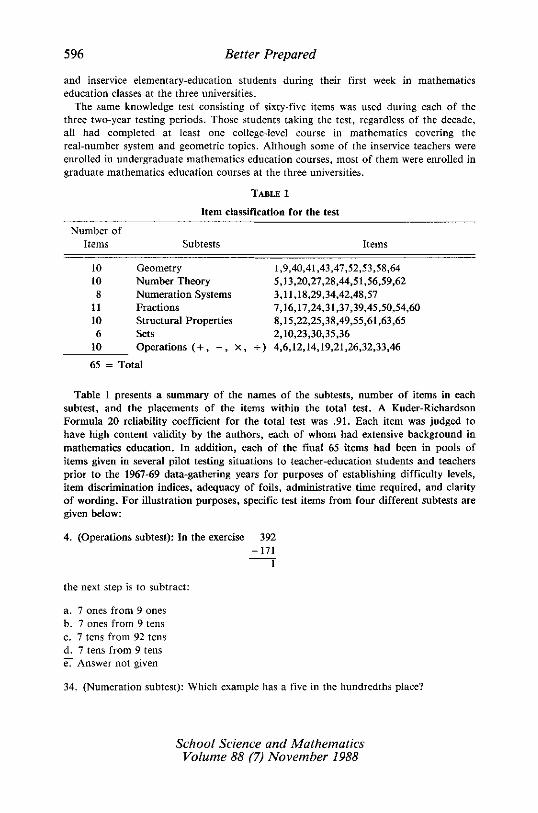
Table 1 presents a summary of the names of the subtests, number of items in eachsubtest, and the placements of the items within the total test. A Kuder-RichardsonFormula 20 reliability coefficient for the total test was .91. Each item was judged to
have high content validity by the authors, each of whom had extensive background inmathematics education. In addition, each of the final 65 items had been in pools ofitems given in several pilot testing situations to teacher-education students and teachersprior to the 1967-69 data-gathering years for purposes of establishing difficulty levels,item discrimination indices, adequacy of foils, administrative time required, and clarityof wording. For illustration purposes, specific test items from four different subtests aregiven below:
4. (Operations subtest): In the exercise 392-171
the next step is to subtract:
a. 7 ones from 9 onesb. 7 ones from 9 tensc. 7 tens from 92 tensd. 7 tens from 9 tense7 Answer not given
34. (Numeration subtest): Which example has a five in the hundredths place?
School Science and MathematicsVolume 88 (7) November 1988
Better Prepared 597
a. 53.07b. 115.51c. 117.035d. 7.0516e7 5.005
39. (Fractions subtest): The value of a common fraction remains unchanged if�
a. Both terms are increased by the same amountb. Both terms are squared
c^ Both terms are multiplied by the same numberd. Both terms are reduced by the same amounte. Answer not given
41. (Geometry subtest): Which of the following is not a simple closed figure?
a. A triangleb. A square
c^ An angled. A circlee. Answer not given
A reader of this article could well question the validity of an instrument that was usedto measure the mathematical competency levels of teachers in three different decades.During these years there were certainly changes that occurred in suggested teachingmethods and in specific mathematics curricular emphases in the education of elementaryteachers as well as in the curricula for the elementary pupils themselves, i.e., the contentand teaching of elementary mathematics did not remain constant and static over theseyears. However, and as the above sample of test items suggests, there are manymathematics concepts that have been, are, and will be basic and integral to the teachingand learning of elementary mathematics. Because the test items measured "basics" thattend not to change over time, the authors believe that the test was as fair and valid forthe teachers in the 1980s as it was for the 1960s and 1970s teachers.For the first study (1967-69), data related to the mathematical understandings of 887
preservice and 177 inservice teachers were collected; for the second study (1975-77), datafrom the same test were collected from 761 preservice and 176 inservice teachers; and,for the 1983-85 study, from 548 preservice and 185 inservice teachers. The proportionsof teaching personnel from Bowling Green, Toledo, and Eastern Michigan wereapproximately 2:2:1 for each of the three studies.
The Findings
Knowledge Levels of the Three Groups of Preservice Teachers
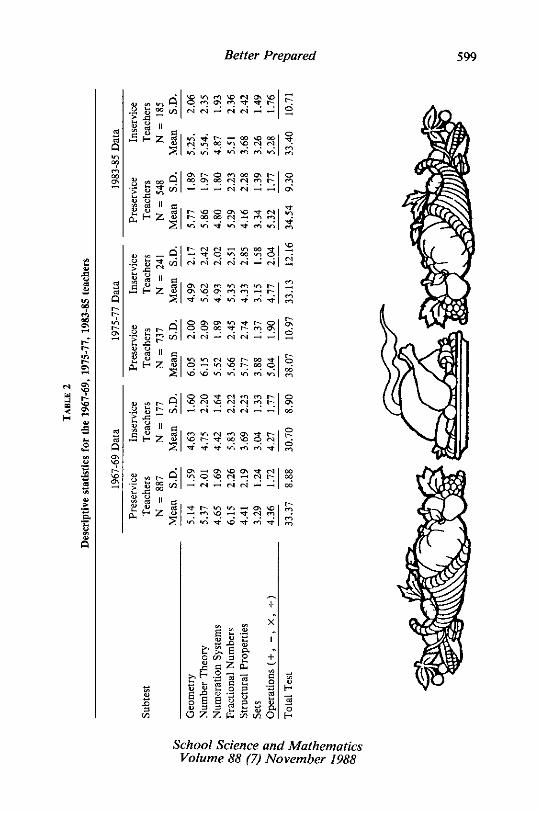
Table 2 presents descriptive statistics for the three studies* preservice and inservicegroups of teachers. For each of the first two data collection periods, the preserviceteachers had a higher numerical mean for each subtest, as well as for the total test, thandid the inservice teachers. However, for the 1983-85 group, there were two instances(numeration systems and fractional numbers) where the inservice teachers’ means werehigher than the preservice means.
School Science and MathematicsVolume 88 (7) November 1988
598 Better Prepared
Five of the eight preservice means in 1967-69, six in 1975-77, but only two in 1983-85were significantly higher (t-test of independent means, p < .05) than the comparableinservice means. The two subtests on which the preservice teachers’ means, for each ofthe three time periods, were significantly higher than those of the inservice teachers weregeometry and structural properties. The five preservice means that were significantlyhigher in the first two time periods were the total test and the subtests on geometry,number theory, structural properties, and sets. A significant mean different in favor ofpreservice teachers over inservice teachers was found in 1975-77 but not in the other twotime periods for numeration systems. No significant mean differences were foundbetween the preservice and inservice teachers in any of the three time periods forfractional numbers and operations on whole numbers.Data in Table 2 also show that the 1975-77 group of preservice teachers, compared to
the other two groups of preservice teachers, had the numerically highest means for sixof the eight scores (subtests and total test) and second highest on the other two scores;the 1983-85 preservice means were second on five tests, third on two, and first on one;and the 1967-69 preservice means were third on six tests, first on one, and second onanother. There were significant mean differences (again independent t’s, p < .05)between the 1967-69 and 1975-77 groups for each of the eight scores, seven in favor ofthe 1975-77 group and one (fractional numbers) in favor of the 1967-69 group. Therewere six significant mean differences between the 1967-69 and 1983-85 groups, four infavor of the 1983-85 group and the other two (fractional numbers and structuralproperties) favoring the 1967-69 teachers. There were eight significant mean differencesbetween the 1975-77 and 1983-85 groups, seven favoring the 1975-77 group and one(operations) favoring the 1983-85 group. From these comparisons and as measured bytheir scores on the criterion test, it may be concluded that the 1983-85 preserviceteachers did not possess as much mathematical knowledge and understanding as did the1975-77 preservice group but in general displayed higher knowledge levels than did the1967-69 preservice teachers.
Knowledge Levels of the Three Groups of Inservice Teachers
Similarly, data in Table 2 permit a comparison of the three groups of inservice teachersfor each of the eight means (subtests and total test). Comparing the means of the threegroups, it may be shown that the 1983-85 inservice teachers were highest on four,second on three, and third or last on one; the 1975-77 inservice teachers were first on
three, second on four, and third on one; and the 1967-69 inservice group was first onone, second on one, and third on six of the tests. There were seven significant meandifferences (independent t-tests, p < .05) between the 1967-69 and 1975-77 groups ofinservice teachers, six favoring the 1975-77 group and one (fractional numbers) favoringthe 1967-69 teachers. There were five significant mean differences between the 1967-69and 1983-85 groups, all in favor of the 1983-85 teachers. There were only two
significant mean differences between the 1975-77 and 1983-85 teachers, one in favor ofthe 1975-77 group (structural properties) and the other in favor of the 1983-85 group(operations). In summary, it would appear that both the 1983-85 and the 1975-77inservice teachers, while not markedly differing between themselves, were, in general,superior to the inservice teachers of 1967-69 in the possession of the mathematicalunderstandings that were measured by the criterion test.
School Science and MathematicsVolume 88 (7) November 1988
Better Prepared
2<&>�g531>
1̂f^r-
r̂-OSt-<
^M 0^
^ .!5 1L^ -^
r^(UX!
e205.g.vi
^VIU>
.I3"
Q
c3
Q̂in00
en00ON
rtrtQr-r~~«/"ir-o\
<?$
Q̂o>^0
So(^
Is3GO
<U c^i V~> ^.^ ^3 00 GO
§ ^ 112 S c
^ ^ ^ SS
^ 2 °?Q
�g|^<u <-> ii
^ rt 11 c;
£^2|
» » - Q
^l?."S a 11 a£^ZSs
8 2 !?Q
�ElP^(U U i.S/3 « 11 C
^2|^
sg^s> J3 ’"’
^ ^ || �
^^2 §"1
s " >- Q
�g^g^<u o 11y ctf 11 a
£^z|
8 vi m ^0 rsl 0\ \om ON m �T ^t- t-~
(S (^ ’-< ^ C^ »� ’-<
»n �^t t~~- ’-< oo ^o oo(M »n oo >rt so rs) rst
ON r~- o rn oo o\ r~-oo o\ oo r^ r<i rri r~~^ ^ ^ <M (^ - -<
f- \o o c?\ ^o ’<t CMr~- oo oo <M ’-< m m*r> Ti ^ »n ^ m v-i
r"- (N <^ ’-^ i^> oo ^t’-< ^T 0 «n oo m 0CM CM r^ ro r^ *-< CM
ON so <^ m m ’�i r--^t- »rt ^ »n Tf m Tf
8cy» o^ «n -^ r-- o0 oo ^t- r- m o\
r^i r^ »-< c^ CM ’�i ’�<
»n »n CM ^o r- oo ’<to ’�< v> ^o r~~ oo o
SO ’^" CM m m i--c^ so CM CM m r--
^ r^ ^ CM CM »-<’-<
m m CM m <^ ’’t r~~so r- ’^- oo so 0 CM
�^ ’<t ’<t *n m m ’<t
CT\ ^^ 0\ v0 ON ’^- CMVt 0 SO CM »-< CM t--’-< CM ^^ CM CM ’�i ^-<
’<t r-’ »n ir> »-< o\ so’-< m so »-^ ’tf CM mvi »n �^ so "�1 m ’^t
7yi ys ^6 ^ ^^ ^ S ’^ ^ 6 &
0 00 3 g +S c Z £ -"
^ ^>2 i ^ i^ g 2 g s �§fi X> (U �-<�*-� CTtg 6 6 " S ^ ^3U 3 3 g t- -S aa z z £ ^ (% o
F^d
$mm
0mON
"t�^m̂
so
CM
m
r^CO
r--o\
0
r-000m
^000r-~0r^i
0000
00
r-r^
r<m̂
Efi�S0F
School Science and MathematicsVolume 88 (7) November 1988
600Better Prepared
suee|/\|
School Science and MathematicsVolume 88 (7) November 1988
Better Prepared 601
TABLE 3
Comparison of 1967-69, 1975-77, and 1983-85 groups by years of teaching experience
1967-69 Data 1975-77 Data 1983-85 Data
Group of TeachersNMeanNMeanNMean
A. Preservice 887 33.37 737 38.07 548 34.54B. Inservice
0-2 years experience 101 30.80 92 31.86 58 31.603-5 years experience 44 30.45 59 35.36 48 34.146-10 years experience 16 31.38 50 34.12 38 35.03more than 10 years experience 16 30.06 40 31.55 41 33.56
Total Inservice17730.7024133.1318533.40
Group Knowledge Levels Analyzed by Years of Experience
The three groups of inservice teachers were asked to indicate the lengths of theirteaching experience by marking one of the following classifications: 0-2 years, 3-5 years,6-10 years, and more than 10 years. Table 3 presents the basic total test data for thethree time periods for the preservice teachers and for four levels of experience for theinservice teachers. Statistical analyses (one way ANOVA, p < .05) indicated that themean of the preservice teachers in 1967-69 (33.37) and again in 1975-77 (38.07) wassignificantly higher than each of the individual means of the four concerned groups ofinservice teachers. However, for the 1983-85 teachers there was only one significantcomparison based on teaching experience; the preservice mean of 34.54 was significantlyhigher than the mean of the 0-2 years experience group (31.60). It is also interesting tonote that the mean for the 6-10 years experience group (35.03) was numerically highestof all the 1983-85 means. It is quite probable that several of these 1980s 6-10 yearinservice teachers were related to the rather superior scores of the 1975-77 preservicegroup and are now teaching in the geographical areas surrounding the three universitiesand working toward their masters’ degrees. Another possible reason for the increasedknowledge of the 1983-85 inservice teachers may be the new competency basededucation in Ohio, where teachers are now required to identify, teach, and evaluatemathematics subject objectives per grade level. The observed increase in mean scores ofinservice teachers may be a positive outcome of this movement.
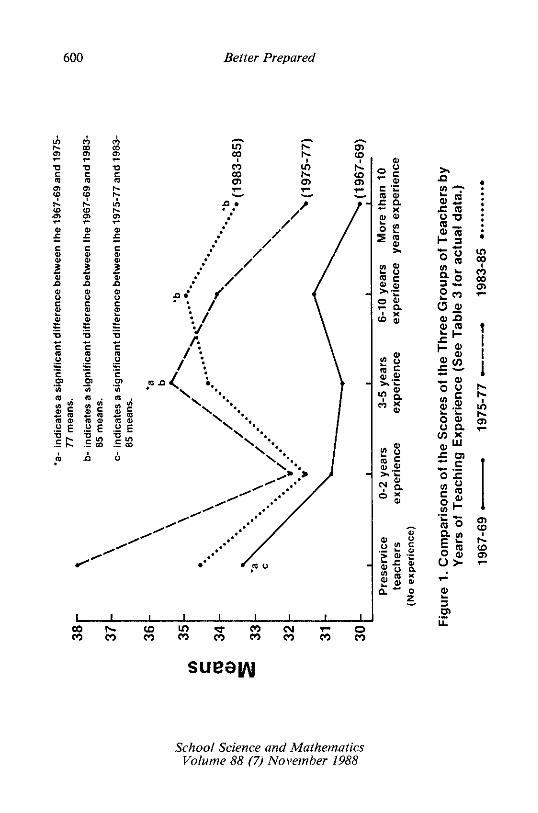
Figure 1 shows graphically the comparative data presented in Table 3. In addition,Figure 1 presents conclusions from testing the equality of the teachers’ means acrossdecades for each of the five experience classifications (see Note 1). It may be observedthat the 1975-77 preservice mean was significantly higher than the preservice means forthe 1967-69 and 1983-85 groups; a significant mean difference was not indicatedbetween the 1967-69 and 1983-85 preservice teachers. There were three instances of the1983-85 inservice teachers’ means being significantly higher than the 1967-69 inservicemeans (3-5 years, 6-10 years, and more than 10). There were two instances where the1983-85 means were higher than the 1975-77 means and two instances where theopposite was true. And lastly, there was one instance where a 1975-77 inservice meanwas significantly greater than a 1967-69 mean (viz., 3-5 years).The total mean test scores in Table 2 for the preservice and inservice teachers from
1967-69, 1975-77, and 1983-85 ranged from 30.70 to 38.07 correct responses on the
School Science and MathematicsVolume 88 (7) November 1988
602 Better Prepared
65-item test. As noted earlier in this article, undergraduates and teachers were testedduring their first week in mathematics education classes at three universities. Thesemean scores indicate that undergraduates and teachers knew less than 60% of thecontent included in this test when they enrolled in the education methods courses. Thisis a continuing sad commentary on the mathematics content knowledge of elementaryundergraduates and teachers.
Summary and Conclusions
As a brief summary of the findings, it was observed (especially via Figure 1) that the1970s and 1980s teachers, regardless of teaching experience patterns, had higher levels ofmathematical understandings as measured by the criterion test than did the teachers ofthe 1960s. Additionally, it was shown that (1) the preservice teachers of the 1980s didnot possess as high a level of mathematical understandings as did the preservice teachersof the 1970s, and (2) per decade, the levels of mathematical understandings were higherfor preservice teachers than for the inservice teachers, significantly higher in the 1960sand 1970s, but to a smaller extent (just numerically higher) in the 1980s.
In conclusion, the findings of this study would seem to indicate that the level of themathematical understandings, as measured by the concerned criterion instrument, of theelementary teachers being prepared at the preservice stages in the 1980s at these threeinstitutions is lower than that of preservice teachers in the 1970s. This apparent loweringof the academic quality of our beginning elementary teachers over the last few yearsgenerally agrees with the findings of researchers such as Pigge (1985), Weaver (1984),Roberson, et al. (1983), and Vance and Schlechty (1982) who have indicated generaldeclines in the academic ability of recent students who have decided to teach. Weaver(1984, p. 110) further explained that the <(
. . . early 1980s have been characterized byextremely limited opportunities in teaching for both men and women; not surprisingly,during this interval the field has attracted individuals of limited academic talent."
It should be noted that no significant differences in mathematical understandings werefound between the inservice elementary teachers of the 1970s and 1980s, whereas eachof these groups was generally superior to the inservice teachers of the 1960s (overallmean for 1970s teachers was 2.43 points higher than the 1960s mean�the 1980s meanwas 2.70 points higher). Of particular interest were the differences in group means forthe inservice teachers with 6-10 years of experience and those with more than 10 yearsexperience.Note 1. For the "across years" mean comparisons, the following decision rules wereused: a significant difference was judged to be present between a 1967-69 mean and a1975-77 mean when the 95% confidence interval of the latter mean did not contain theformer mean; between a 1967-69 mean and a 1983-85 mean when the 95% confidenceinterval of the latter did not contain the former; and between a 1975-77 mean and a1983-85 mean when the 95% confidence interval of the latter did not contain theformer.
References
Gibney, T. C., J. L. Ginther, and F. L. Pigge. (1970). A comparison of the number ofmathematics courses taken by elementary teachers and their mathematicalunderstandings. School Science and Mathematics, 70, 377-381.
School Science and MathematicsVolume 88 (7) November 1988
Better Prepared 603
Gibney, T. C., J. L. Ginther, and F. L. Pigge. (1970). The mathematical understandingsof pre-service and in-service teachers. The Arithmetic Teacher, 77, 155-62.
Gibney, T. C., J. L. Ginther, and F. L. Pigge. (1970). What influences themathematical understandings of elementary school teachers. The Elementary SchoolJournal, 70, 367-73.
Pigge, Fred L. (1985). Teacher education graduates: comparisons of those who teachand do not teach. Journal of Teacher Education, 36, 27-28.
Pigge, F. L., T. C. Gibney, and J. L. Ginther. (December 1980). An updatedcomparison of the number of mathematics courses taken by elementary teachers andtheir mathematical understanding. School Science and Mathematics, 80, 643-650.
Pigge, F. L., T. C. Gibney, and J. L. Ginther. (1979). Today’s elementary-schoolteachers are better prepared in mathematics. The Arithmetic Teacher, 26, 48-51.
Pigge, F. L., T. C. Gibney, and J. L. Ginther. (1978). An update on what influencesthe mathematical understanding of elementary school teachers. The ElementarySchool Journal, 79:30-39.
Roberson, S. D., T. Z. Keith, and E. B. Page. (1983). Now who aspires to teach?Educational Researcher, 12, 13-21.
Vance, V. S. and P C. Schlechty. (1982). The distribution of academic ability in theteaching force: policy implications. Phi Delta Kappan, 64, 23-27.
Weaver, W. Timothy. (1984). Solving the problem of teaching quality, part 1. Phi DeltaKappan, 66, 108-115.
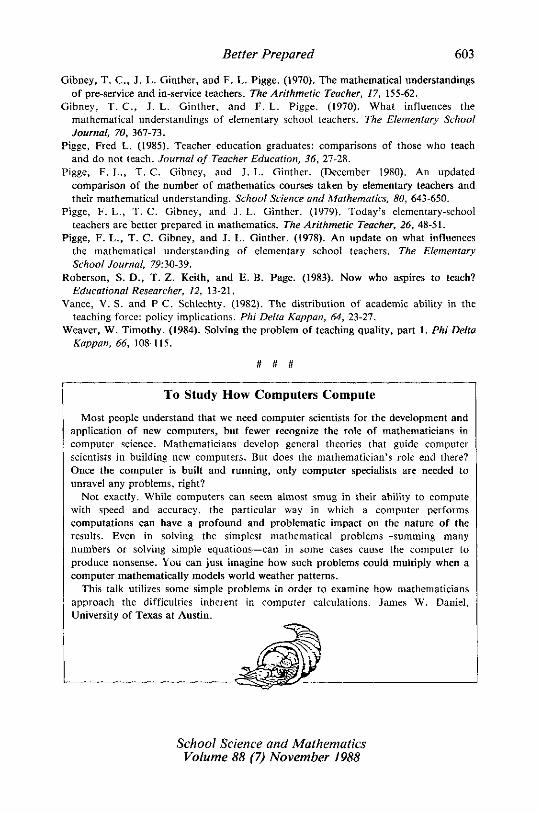
To Study How Computers Compute
Most people understand that we need computer scientists for the development andapplication of new computers, but fewer recognize the role of mathematicians incomputer science. Mathematicians develop general theories that guide computerscientists in building new computers. But does the mathematician’s role end there?Once the computer is built and running, only computer specialists are needed tounravel any problems, right?Not exactly. While computers can seem almost smug in their ability to compute
with speed and accuracy, the particular way in which a computer performscomputations can have a profound and problematic impact on the nature of theresults. Even in solving the simplest mathematical problems�summing manynumbers or solving simple equations�can in some cases cause the computer toproduce nonsense. You can just imagine how such problems could multiply when acomputer mathematically models world weather patterns.
This talk utilizes some simple problems in order to examine how mathematiciansapproach the difficulties inherent in computer calculations. James W. Daniel,University of Texas at Austin.
School Science and MathematicsVolume 88 (7) November 1988


![Mathematics for elementary teachers 10ed [2013]](https://img.pdfslide.us/doc/110x75/58756d8e1a28abd80a8b682f/mathematics-for-elementary-teachers-10ed-2013.jpg)