Embed Size (px)
Citation preview
ARE BANKSAFFECTED BYTHEIR HOLDINGSOF GOVERNMENTDEBT?
CHIARA ANGELONI AND GUNTRAM B. WOLFF
Highlights
• Banking and sovereign risk in the euro area are highly correlated.This working paper sheds light on the link. We study the stockmarket performance and the holdings of government debt of thebanks stress tested by the European Banking Authority in July andDecember 2011. Banks’ holdings of the sovereign bonds ofvulnerable countries generally decreased during the periodDecember 2010 to September 2011.
• The average stock market performance of each country’s bankswas very uneven. The European Central Bank’s long-termrefinancing operation (LTRO) had no material effect on banks’stock market values in the countries under consideration. Greekdebt holdings had an effect on banks’ market values in the periodJuly to October 2011. After October, this effect disappeared.Holdings of Italian and Irish debt had a material effect on banks’market value in the period October to December 2011. Holdingsof debt of other periphery countries, in particular Spain, were notan issue. The July PSI deal did not substantially affect the riskresulting from holdings of debt other than Greek debt.
• The location of banks matters for their market value. Thishighlights the need to form a banking union in the euro area.
Chiara Angeloni ([email protected]) is a Research Assistantat Bruegel. Guntram B. Wolff ([email protected]) is DeputyDirector of Bruegel.
BRUE
GEL
WOR
KING
PAP
ER 20
12/0
7
MARCH 2012
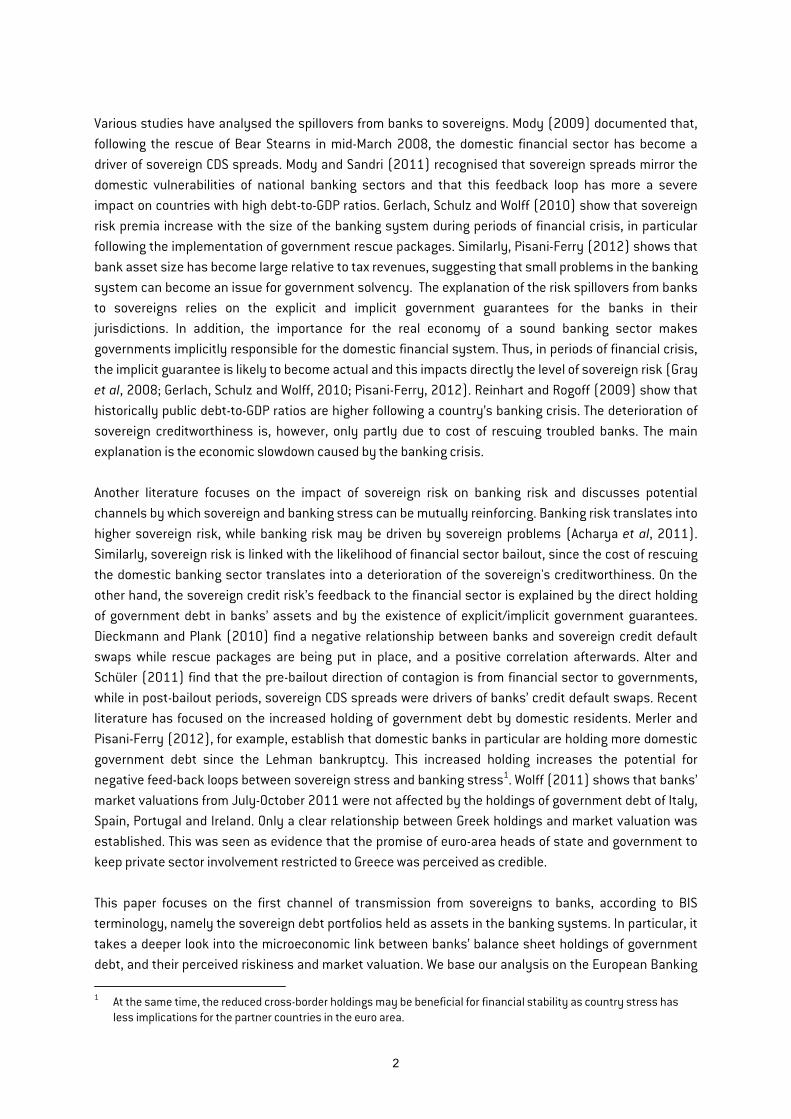
Introduction The strong link between sovereign and banking stress is frequently emphasised, especially since the start of the European sovereign debt crisis. Figure 1 underscores the interdependence between sovereign and banking risk by showing that sovereign and bank credit default swaps (CDS) were positively correlated during 2011 for a number of euro-area countries. It is worth noting that the same graphical result holds not only for periphery countries but also for stronger EU economies such as Germany and France. However, the reasons for the interconnectedness between financial and sovereign sector risk are little understood. Our paper sheds light on this link. A recent paper (BIS, 2011) recognises four main channels through which a deterioration in the creditworthiness of a sovereign can have an impact on the banking system. First, banks’ holdings of sovereign government debt have a negative impact on banks’ assets in case the sovereign has problems. Second, higher sovereign risk reduces the value of collateral that can be used for funding. Third, sovereign downgrades normally translate into lower ratings for banks located in the downgraded country. Lastly, increased sovereign risk reduces the value of the implicit/explicit government guarantees to banks. However, Gray (2009) highlights the lack of proper measurement and analysis of risks associated with the interdependence of financial and sovereign sectors. The literature so far has not strongly and empirically established that the holding of government debt by banks actually matters for bank stress. Our paper aims to deal with this issue in the context of the euro area. Figure 1: Correlation between sovereign and banking credit default swaps
Source: Bruegel calculations with data from Datastream and Macrobond. Note: Weekly averages from January 2011 to February2012. Banking CDS by country are calculated as weighted averages of CDS of the individual banks considered for each country. The graph for Greece is not displayed since it is characterised by hyperbolic pattern. The same graphical result holds not only for periphery countries but also for stronger EU economies such as Germany and France.
R² = 0.675
R² = 0.9678
R² = 0.8055
R² = 0.8802
0
200
400
600
800
1000
1200
1400
1600
1800
0 200 400 600 800 1000 1200 1400 1600 1800
CDS_
Sove
reig
n
CDS_Bank
IE IT PT ES
1
Various studies have analysed the spillovers from banks to sovereigns. Mody (2009) documented that, following the rescue of Bear Stearns in mid-March 2008, the domestic financial sector has become a driver of sovereign CDS spreads. Mody and Sandri (2011) recognised that sovereign spreads mirror the domestic vulnerabilities of national banking sectors and that this feedback loop has more a severe impact on countries with high debt-to-GDP ratios. Gerlach, Schulz and Wolff (2010) show that sovereign risk premia increase with the size of the banking system during periods of financial crisis, in particular following the implementation of government rescue packages. Similarly, Pisani-Ferry (2012) shows that bank asset size has become large relative to tax revenues, suggesting that small problems in the banking system can become an issue for government solvency. The explanation of the risk spillovers from banks to sovereigns relies on the explicit and implicit government guarantees for the banks in their jurisdictions. In addition, the importance for the real economy of a sound banking sector makes governments implicitly responsible for the domestic financial system. Thus, in periods of financial crisis, the implicit guarantee is likely to become actual and this impacts directly the level of sovereign risk (Gray et al, 2008; Gerlach, Schulz and Wolff, 2010; Pisani-Ferry, 2012). Reinhart and Rogoff (2009) show that historically public debt-to-GDP ratios are higher following a country’s banking crisis. The deterioration of sovereign creditworthiness is, however, only partly due to cost of rescuing troubled banks. The main explanation is the economic slowdown caused by the banking crisis. Another literature focuses on the impact of sovereign risk on banking risk and discusses potential channels by which sovereign and banking stress can be mutually reinforcing. Banking risk translates into higher sovereign risk, while banking risk may be driven by sovereign problems (Acharya et al, 2011). Similarly, sovereign risk is linked with the likelihood of financial sector bailout, since the cost of rescuing the domestic banking sector translates into a deterioration of the sovereign's creditworthiness. On the other hand, the sovereign credit risk’s feedback to the financial sector is explained by the direct holding of government debt in banks’ assets and by the existence of explicit/implicit government guarantees. Dieckmann and Plank (2010) find a negative relationship between banks and sovereign credit default swaps while rescue packages are being put in place, and a positive correlation afterwards. Alter and Schüler (2011) find that the pre-bailout direction of contagion is from financial sector to governments, while in post-bailout periods, sovereign CDS spreads were drivers of banks’ credit default swaps. Recent literature has focused on the increased holding of government debt by domestic residents. Merler and Pisani-Ferry (2012), for example, establish that domestic banks in particular are holding more domestic government debt since the Lehman bankruptcy. This increased holding increases the potential for negative feed-back loops between sovereign stress and banking stress1. Wolff (2011) shows that banks’ market valuations from July-October 2011 were not affected by the holdings of government debt of Italy, Spain, Portugal and Ireland. Only a clear relationship between Greek holdings and market valuation was established. This was seen as evidence that the promise of euro-area heads of state and government to keep private sector involvement restricted to Greece was perceived as credible. This paper focuses on the first channel of transmission from sovereigns to banks, according to BIS terminology, namely the sovereign debt portfolios held as assets in the banking systems. In particular, it takes a deeper look into the microeconomic link between banks’ balance sheet holdings of government debt, and their perceived riskiness and market valuation. We base our analysis on the European Banking 1 At the same time, the reduced cross-border holdings may be beneficial for financial stability as country stress has
less implications for the partner countries in the euro area.
2
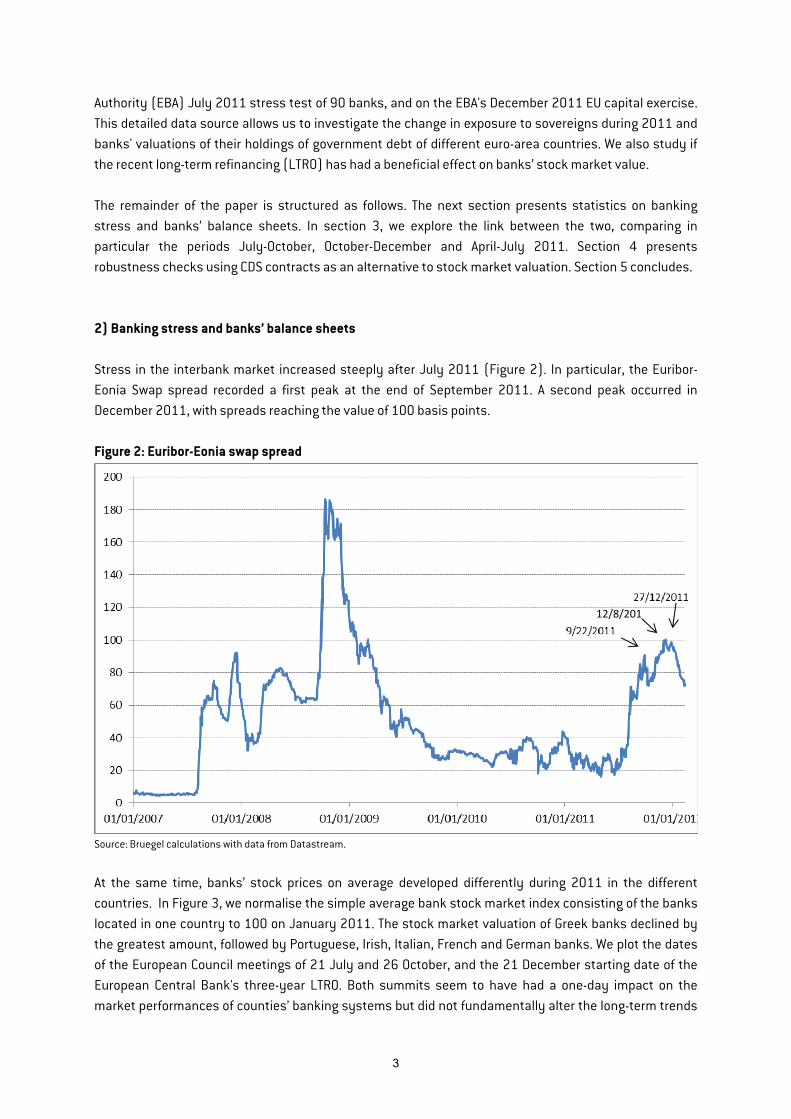
Authority (EBA) July 2011 stress test of 90 banks, and on the EBA's December 2011 EU capital exercise. This detailed data source allows us to investigate the change in exposure to sovereigns during 2011 and banks' valuations of their holdings of government debt of different euro-area countries. We also study if the recent long-term refinancing (LTRO) has had a beneficial effect on banks’ stock market value. The remainder of the paper is structured as follows. The next section presents statistics on banking stress and banks’ balance sheets. In section 3, we explore the link between the two, comparing in particular the periods July-October, October-December and April-July 2011. Section 4 presents robustness checks using CDS contracts as an alternative to stock market valuation. Section 5 concludes. 2) Banking stress and banks’ balance sheets Stress in the interbank market increased steeply after July 2011 (Figure 2). In particular, the Euribor-Eonia Swap spread recorded a first peak at the end of September 2011. A second peak occurred in December 2011, with spreads reaching the value of 100 basis points. Figure 2: Euribor-Eonia swap spread
Source: Bruegel calculations with data from Datastream.
At the same time, banks’ stock prices on average developed differently during 2011 in the different countries. In Figure 3, we normalise the simple average bank stock market index consisting of the banks located in one country to 100 on January 2011. The stock market valuation of Greek banks declined by the greatest amount, followed by Portuguese, Irish, Italian, French and German banks. We plot the dates of the European Council meetings of 21 July and 26 October, and the 21 December starting date of the European Central Bank's three-year LTRO. Both summits seem to have had a one-day impact on the market performances of counties’ banking systems but did not fundamentally alter the long-term trends
12/8/201
3
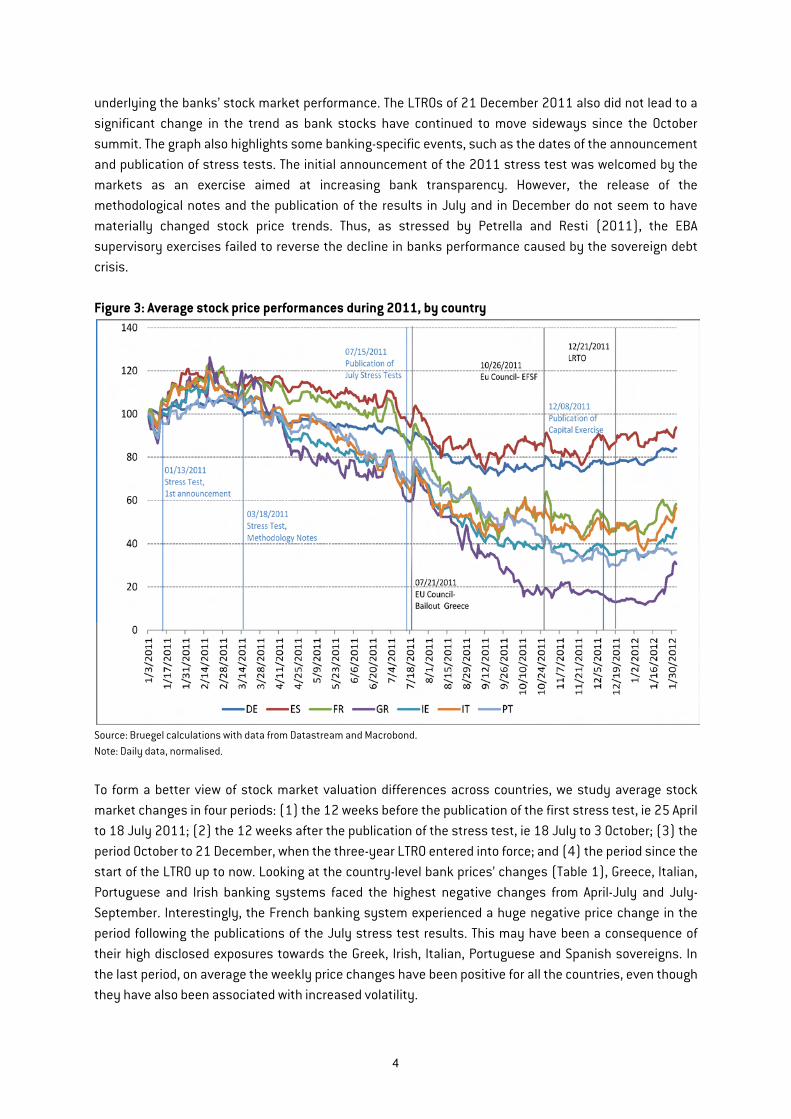
underlying the banks’ stock market performance. The LTROs of 21 December 2011 also did not lead to a significant change in the trend as bank stocks have continued to move sideways since the October summit. The graph also highlights some banking-specific events, such as the dates of the announcement and publication of stress tests. The initial announcement of the 2011 stress test was welcomed by the markets as an exercise aimed at increasing bank transparency. However, the release of the methodological notes and the publication of the results in July and in December do not seem to have materially changed stock price trends. Thus, as stressed by Petrella and Resti (2011), the EBA supervisory exercises failed to reverse the decline in banks performance caused by the sovereign debt crisis. Figure 3: Average stock price performances during 2011, by country
Source: Bruegel calculations with data from Datastream and Macrobond. Note: Daily data, normalised.
To form a better view of stock market valuation differences across countries, we study average stock market changes in four periods: (1) the 12 weeks before the publication of the first stress test, ie 25 April to 18 July 2011; (2) the 12 weeks after the publication of the stress test, ie 18 July to 3 October; (3) the period October to 21 December, when the three-year LTRO entered into force; and (4) the period since the start of the LTRO up to now. Looking at the country-level bank prices’ changes (Table 1), Greece, Italian, Portuguese and Irish banking systems faced the highest negative changes from April-July and July-September. Interestingly, the French banking system experienced a huge negative price change in the period following the publications of the July stress test results. This may have been a consequence of their high disclosed exposures towards the Greek, Irish, Italian, Portuguese and Spanish sovereigns. In the last period, on average the weekly price changes have been positive for all the countries, even though they have also been associated with increased volatility.
4
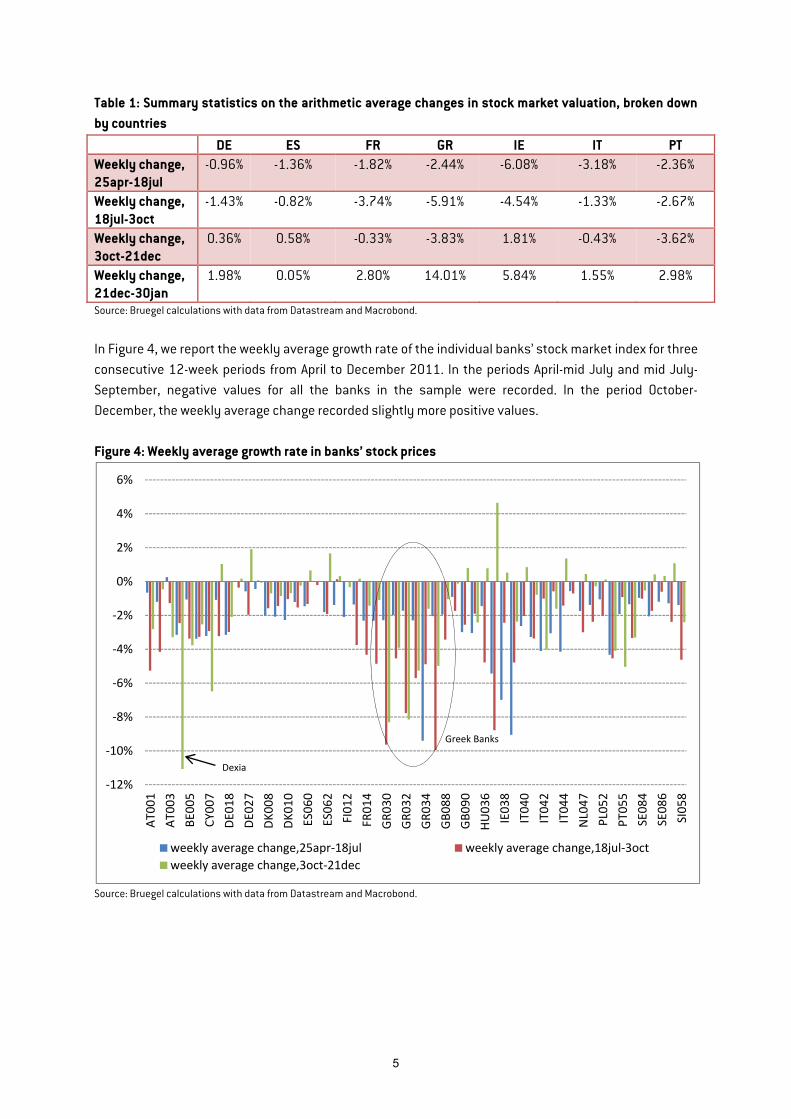
Table 1: Summary statistics on the arithmetic average changes in stock market valuation, broken down by countries DE ES FR GR IE IT PTWeekly change, 25apr-18jul
-0.96% -1.36% -1.82% -2.44% -6.08% -3.18% -2.36%
Weekly change, 18jul-3oct
-1.43% -0.82% -3.74% -5.91% -4.54% -1.33% -2.67%
Weekly change, 3oct-21dec
0.36% 0.58% -0.33% -3.83% 1.81% -0.43% -3.62%
Weekly change, 21dec-30jan
1.98% 0.05% 2.80% 14.01% 5.84% 1.55% 2.98%
Source: Bruegel calculations with data from Datastream and Macrobond.
In Figure 4, we report the weekly average growth rate of the individual banks’ stock market index for three consecutive 12-week periods from April to December 2011. In the periods April-mid July and mid July-September, negative values for all the banks in the sample were recorded. In the period October-December, the weekly average change recorded slightly more positive values. Figure 4: Weekly average growth rate in banks’ stock prices
Source: Bruegel calculations with data from Datastream and Macrobond.
-12%
-10%
-8%
-6%
-4%
-2%
0%
2%
4%
6%
AT00
1AT
003
BE00
5CY
007
DE01
8DE
027
DK00
8DK
010
ES06
0ES
062
FI01
2FR
014
GR03
0GR
032
GR03
4GB
088
GB09
0HU
036
IE03
8IT
040
IT04
2IT
044
NL0
47PL
052
PT05
5SE
084
SE08
6SI
058
weekly average change,25apr-18jul weekly average change,18jul-3octweekly average change,3oct-21dec
Dexia
Greek Banks
5
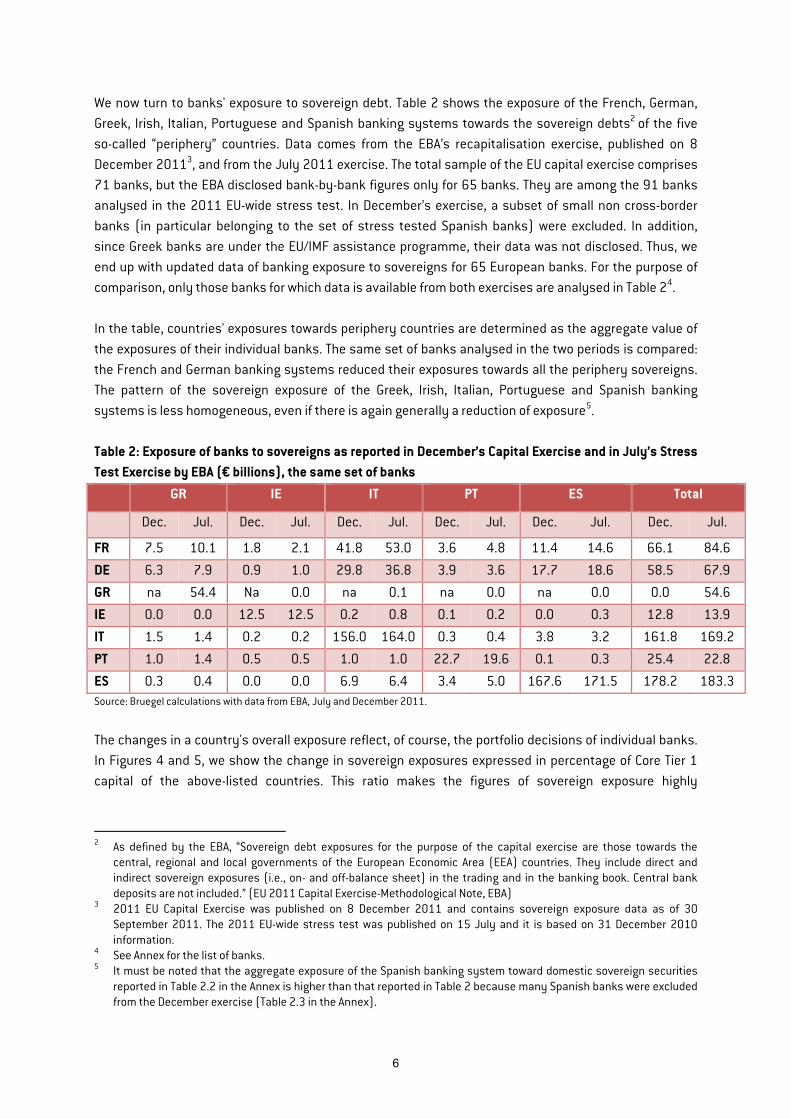
We now turn to banks' exposure to sovereign debt. Table 2 shows the exposure of the French, German, Greek, Irish, Italian, Portuguese and Spanish banking systems towards the sovereign debts2 of the five so-called “periphery” countries. Data comes from the EBA’s recapitalisation exercise, published on 8 December 20113, and from the July 2011 exercise. The total sample of the EU capital exercise comprises 71 banks, but the EBA disclosed bank-by-bank figures only for 65 banks. They are among the 91 banks analysed in the 2011 EU-wide stress test. In December’s exercise, a subset of small non cross-border banks (in particular belonging to the set of stress tested Spanish banks) were excluded. In addition, since Greek banks are under the EU/IMF assistance programme, their data was not disclosed. Thus, we end up with updated data of banking exposure to sovereigns for 65 European banks. For the purpose of comparison, only those banks for which data is available from both exercises are analysed in Table 24. In the table, countries' exposures towards periphery countries are determined as the aggregate value of the exposures of their individual banks. The same set of banks analysed in the two periods is compared: the French and German banking systems reduced their exposures towards all the periphery sovereigns. The pattern of the sovereign exposure of the Greek, Irish, Italian, Portuguese and Spanish banking systems is less homogeneous, even if there is again generally a reduction of exposure5. Table 2: Exposure of banks to sovereigns as reported in December’s Capital Exercise and in July’s Stress Test Exercise by EBA (€ billions), the same set of banks
GR IE IT PT ES Total
Dec. Jul. Dec. Jul. Dec. Jul. Dec. Jul. Dec. Jul. Dec. Jul.
FR 7.5 10.1 1.8 2.1 41.8 53.0 3.6 4.8 11.4 14.6 66.1 84.6
DE 6.3 7.9 0.9 1.0 29.8 36.8 3.9 3.6 17.7 18.6 58.5 67.9
GR na 54.4 Na 0.0 na 0.1 na 0.0 na 0.0 0.0 54.6
IE 0.0 0.0 12.5 12.5 0.2 0.8 0.1 0.2 0.0 0.3 12.8 13.9
IT 1.5 1.4 0.2 0.2 156.0 164.0 0.3 0.4 3.8 3.2 161.8 169.2
PT 1.0 1.4 0.5 0.5 1.0 1.0 22.7 19.6 0.1 0.3 25.4 22.8
ES 0.3 0.4 0.0 0.0 6.9 6.4 3.4 5.0 167.6 171.5 178.2 183.3Source: Bruegel calculations with data from EBA, July and December 2011.
The changes in a country's overall exposure reflect, of course, the portfolio decisions of individual banks. In Figures 4 and 5, we show the change in sovereign exposures expressed in percentage of Core Tier 1 capital of the above-listed countries. This ratio makes the figures of sovereign exposure highly
2 As defined by the EBA, “Sovereign debt exposures for the purpose of the capital exercise are those towards the
central, regional and local governments of the European Economic Area (EEA) countries. They include direct and indirect sovereign exposures (i.e., on- and off-balance sheet) in the trading and in the banking book. Central bank deposits are not included.” (EU 2011 Capital Exercise-Methodological Note, EBA)
3 2011 EU Capital Exercise was published on 8 December 2011 and contains sovereign exposure data as of 30 September 2011. The 2011 EU-wide stress test was published on 15 July and it is based on 31 December 2010 information.
4 See Annex for the list of banks. 5 It must be noted that the aggregate exposure of the Spanish banking system toward domestic sovereign securities
reported in Table 2.2 in the Annex is higher than that reported in Table 2 because many Spanish banks were excluded from the December exercise (Table 2.3 in the Annex).
6
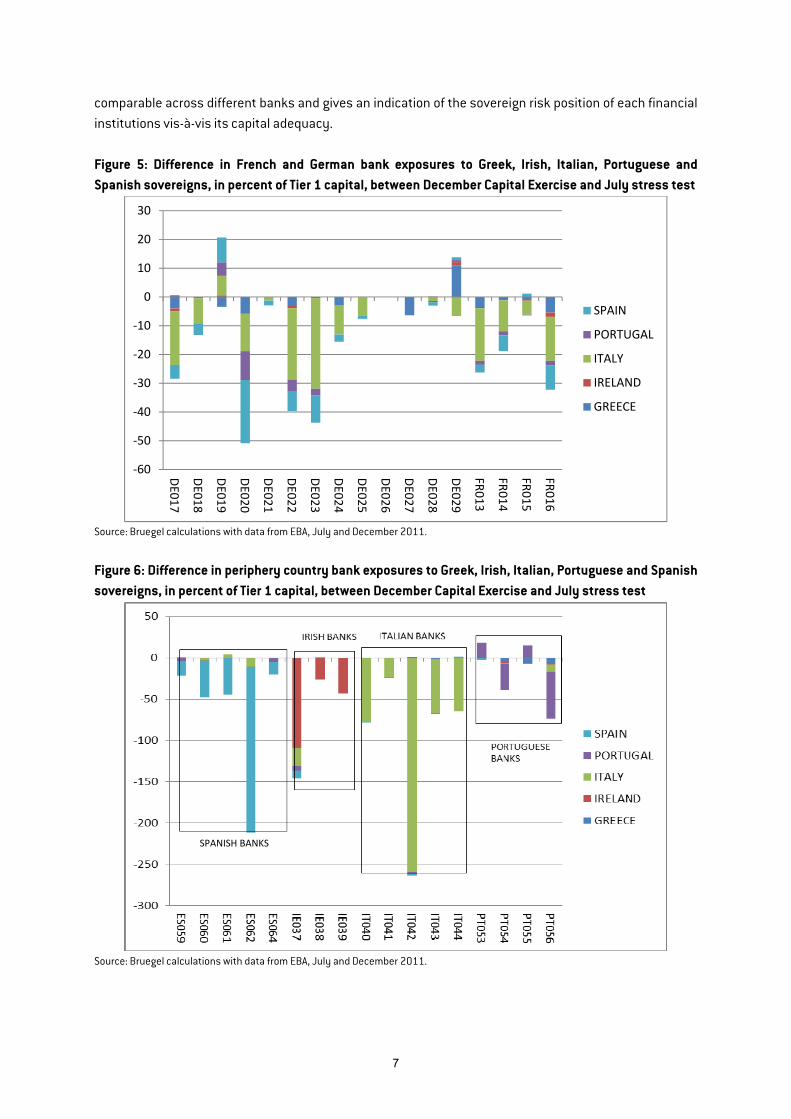
comparable across different banks and gives an indication of the sovereign risk position of each financial institutions vis-à-vis its capital adequacy. Figure 5: Difference in French and German bank exposures to Greek, Irish, Italian, Portuguese and Spanish sovereigns, in percent of Tier 1 capital, between December Capital Exercise and July stress test
Source: Bruegel calculations with data from EBA, July and December 2011.
Figure 6: Difference in periphery country bank exposures to Greek, Irish, Italian, Portuguese and Spanish sovereigns, in percent of Tier 1 capital, between December Capital Exercise and July stress test
Source: Bruegel calculations with data from EBA, July and December 2011.
-60
-50
-40
-30
-20
-10
0
10
20
30
DE017
DE018
DE019
DE020
DE021
DE022
DE023
DE024
DE025
DE026
DE027
DE028
DE029
FR013
FR014
FR015
FR016
SPAIN
PORTUGAL
ITALY
IRELAND
GREECE
SPANISH BANKS
7
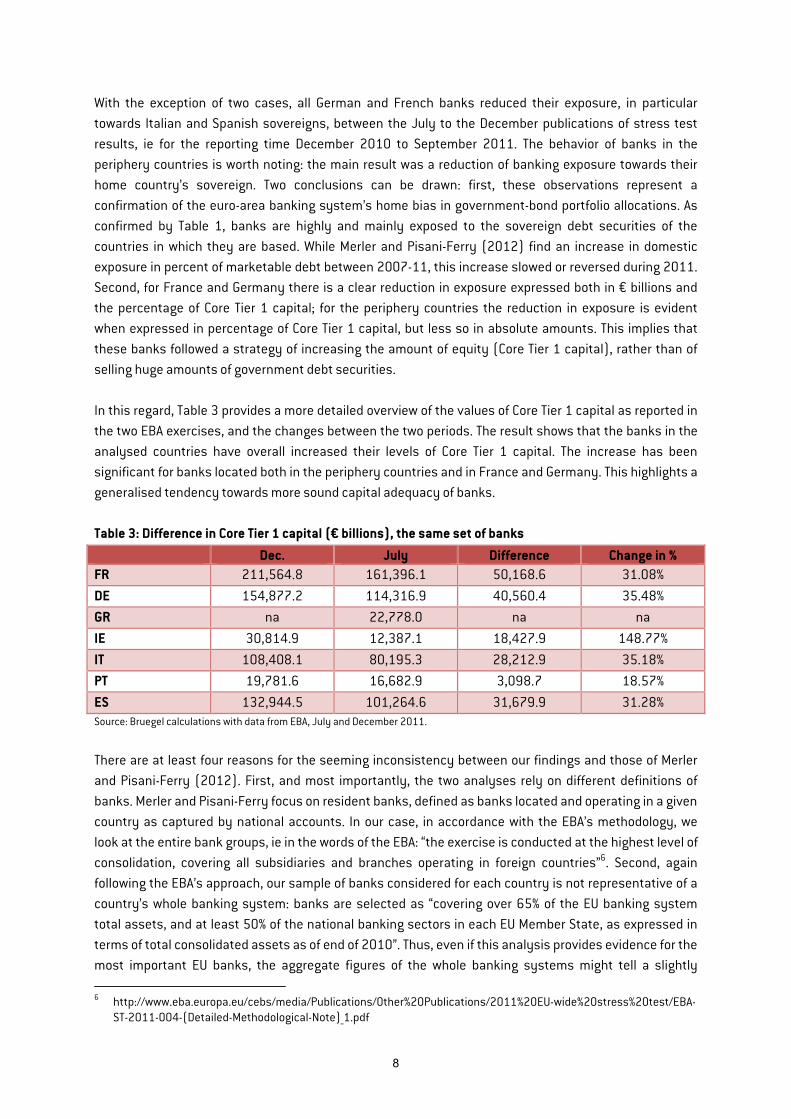
With the exception of two cases, all German and French banks reduced their exposure, in particular towards Italian and Spanish sovereigns, between the July to the December publications of stress test results, ie for the reporting time December 2010 to September 2011. The behavior of banks in the periphery countries is worth noting: the main result was a reduction of banking exposure towards their home country’s sovereign. Two conclusions can be drawn: first, these observations represent a confirmation of the euro-area banking system’s home bias in government-bond portfolio allocations. As confirmed by Table 1, banks are highly and mainly exposed to the sovereign debt securities of the countries in which they are based. While Merler and Pisani-Ferry (2012) find an increase in domestic exposure in percent of marketable debt between 2007-11, this increase slowed or reversed during 2011. Second, for France and Germany there is a clear reduction in exposure expressed both in € billions and the percentage of Core Tier 1 capital; for the periphery countries the reduction in exposure is evident when expressed in percentage of Core Tier 1 capital, but less so in absolute amounts. This implies that these banks followed a strategy of increasing the amount of equity (Core Tier 1 capital), rather than of selling huge amounts of government debt securities. In this regard, Table 3 provides a more detailed overview of the values of Core Tier 1 capital as reported in the two EBA exercises, and the changes between the two periods. The result shows that the banks in the analysed countries have overall increased their levels of Core Tier 1 capital. The increase has been significant for banks located both in the periphery countries and in France and Germany. This highlights a generalised tendency towards more sound capital adequacy of banks. Table 3: Difference in Core Tier 1 capital (€ billions), the same set of banks
Dec. July Difference Change in %FR 211,564.8 161,396.1 50,168.6 31.08%DE 154,877.2 114,316.9 40,560.4 35.48%GR na 22,778.0 na na IE 30,814.9 12,387.1 18,427.9 148.77%IT 108,408.1 80,195.3 28,212.9 35.18%PT 19,781.6 16,682.9 3,098.7 18.57%ES 132,944.5 101,264.6 31,679.9 31.28%Source: Bruegel calculations with data from EBA, July and December 2011.
There are at least four reasons for the seeming inconsistency between our findings and those of Merler and Pisani-Ferry (2012). First, and most importantly, the two analyses rely on different definitions of banks. Merler and Pisani-Ferry focus on resident banks, defined as banks located and operating in a given country as captured by national accounts. In our case, in accordance with the EBA’s methodology, we look at the entire bank groups, ie in the words of the EBA: “the exercise is conducted at the highest level of consolidation, covering all subsidiaries and branches operating in foreign countries”6. Second, again following the EBA’s approach, our sample of banks considered for each country is not representative of a country’s whole banking system: banks are selected as “covering over 65% of the EU banking system total assets, and at least 50% of the national banking sectors in each EU Member State, as expressed in terms of total consolidated assets as of end of 2010”. Thus, even if this analysis provides evidence for the most important EU banks, the aggregate figures of the whole banking systems might tell a slightly 6 http://www.eba.europa.eu/cebs/media/Publications/Other%20Publications/2011%20EU-wide%20stress%20test/EBA-
ST-2011-004-(Detailed-Methodological-Note)_1.pdf
8
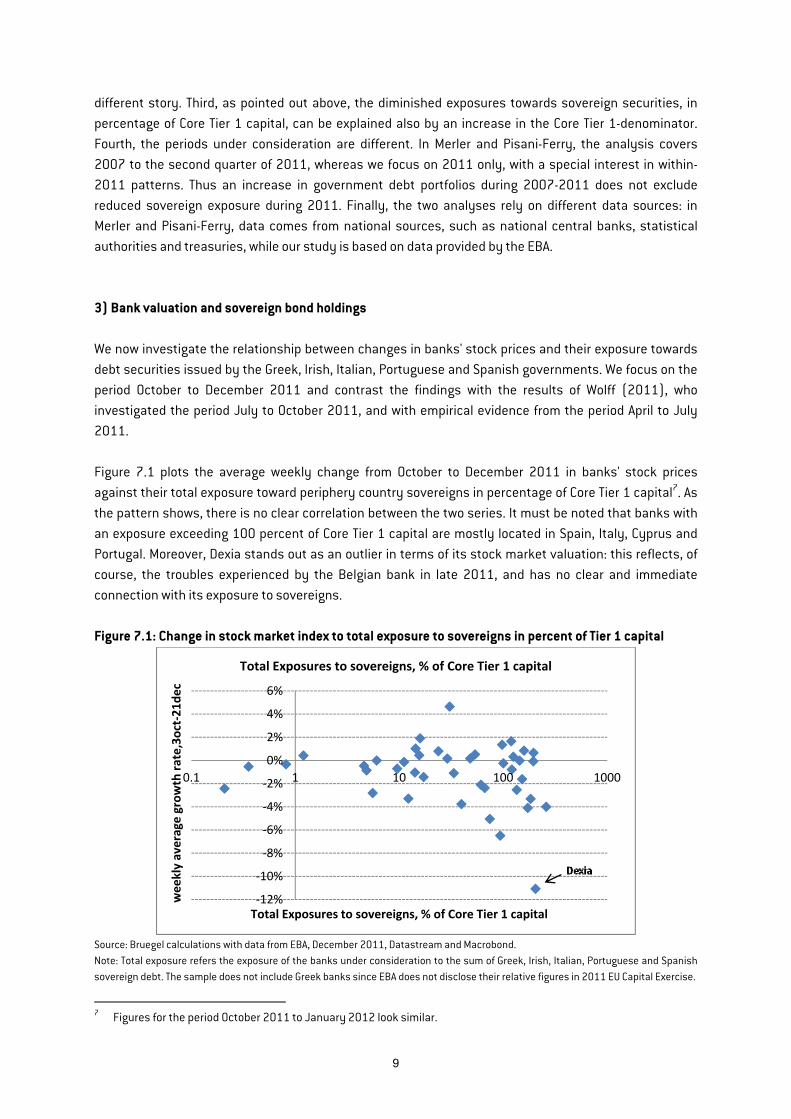
different story. Third, as pointed out above, the diminished exposures towards sovereign securities, in percentage of Core Tier 1 capital, can be explained also by an increase in the Core Tier 1-denominator. Fourth, the periods under consideration are different. In Merler and Pisani-Ferry, the analysis covers 2007 to the second quarter of 2011, whereas we focus on 2011 only, with a special interest in within-2011 patterns. Thus an increase in government debt portfolios during 2007-2011 does not exclude reduced sovereign exposure during 2011. Finally, the two analyses rely on different data sources: in Merler and Pisani-Ferry, data comes from national sources, such as national central banks, statistical authorities and treasuries, while our study is based on data provided by the EBA. 3) Bank valuation and sovereign bond holdings We now investigate the relationship between changes in banks' stock prices and their exposure towards debt securities issued by the Greek, Irish, Italian, Portuguese and Spanish governments. We focus on the period October to December 2011 and contrast the findings with the results of Wolff (2011), who investigated the period July to October 2011, and with empirical evidence from the period April to July 2011. Figure 7.1 plots the average weekly change from October to December 2011 in banks' stock prices against their total exposure toward periphery country sovereigns in percentage of Core Tier 1 capital7. As the pattern shows, there is no clear correlation between the two series. It must be noted that banks with an exposure exceeding 100 percent of Core Tier 1 capital are mostly located in Spain, Italy, Cyprus and Portugal. Moreover, Dexia stands out as an outlier in terms of its stock market valuation: this reflects, of course, the troubles experienced by the Belgian bank in late 2011, and has no clear and immediate connection with its exposure to sovereigns. Figure 7.1: Change in stock market index to total exposure to sovereigns in percent of Tier 1 capital
Source: Bruegel calculations with data from EBA, December 2011, Datastream and Macrobond. Note: Total exposure refers the exposure of the banks under consideration to the sum of Greek, Irish, Italian, Portuguese and Spanish sovereign debt. The sample does not include Greek banks since EBA does not disclose their relative figures in 2011 EU Capital Exercise.
7 Figures for the period October 2011 to January 2012 look similar.
-12%
-10%
-8%
-6%
-4%
-2%
0%
2%
4%
6%
0.1 1 10 100 1000
wee
kly
aver
age
grow
th ra
te,3
oct-
21de
c
Total Exposures to sovereigns, % of Core Tier 1 capital
Total Exposures to sovereigns, % of Core Tier 1 capital
9
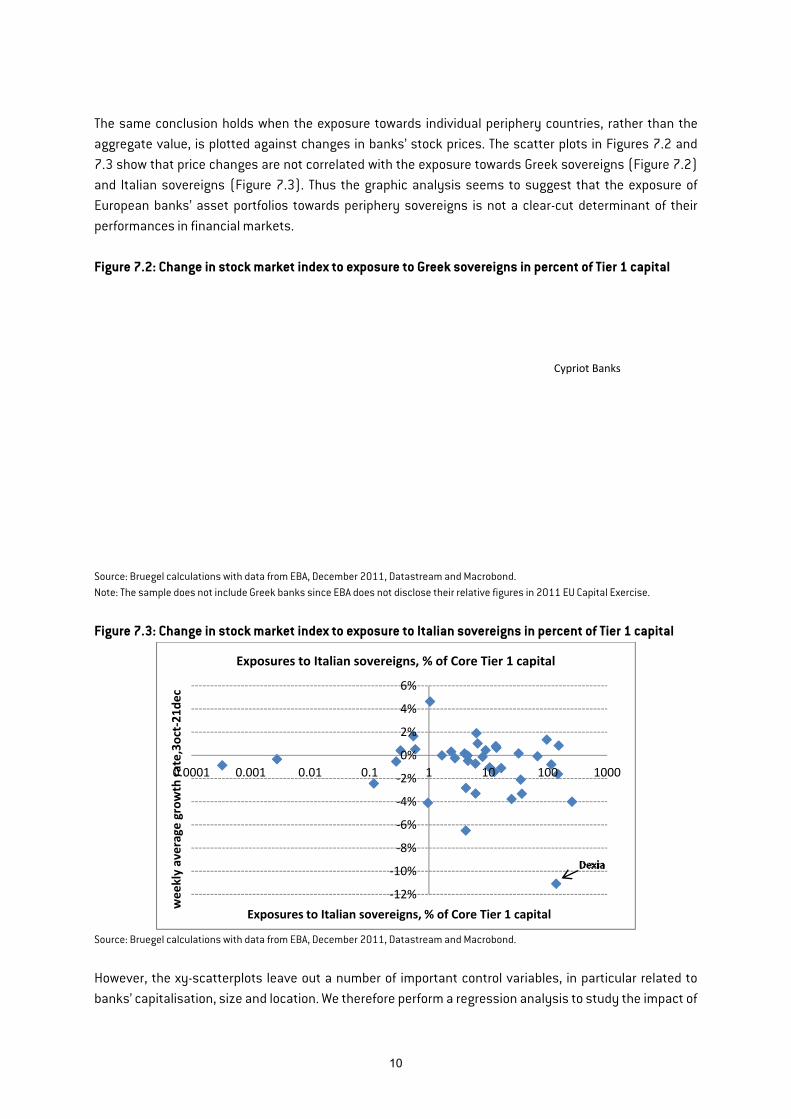
The same conclusion holds when the exposure towards individual periphery countries, rather than the aggregate value, is plotted against changes in banks’ stock prices. The scatter plots in Figures 7.2 and 7.3 show that price changes are not correlated with the exposure towards Greek sovereigns (Figure 7.2) and Italian sovereigns (Figure 7.3). Thus the graphic analysis seems to suggest that the exposure of European banks’ asset portfolios towards periphery sovereigns is not a clear-cut determinant of their performances in financial markets. Figure 7.2: Change in stock market index to exposure to Greek sovereigns in percent of Tier 1 capital
Source: Bruegel calculations with data from EBA, December 2011, Datastream and Macrobond. Note: The sample does not include Greek banks since EBA does not disclose their relative figures in 2011 EU Capital Exercise.
Figure 7.3: Change in stock market index to exposure to Italian sovereigns in percent of Tier 1 capital
Source: Bruegel calculations with data from EBA, December 2011, Datastream and Macrobond.
However, the xy-scatterplots leave out a number of important control variables, in particular related to banks’ capitalisation, size and location. We therefore perform a regression analysis to study the impact of
-12%
-10%
-8%
-6%
-4%
-2%
0%
2%
4%
6%
0.0001 0.001 0.01 0.1 1 10 100 1000
wee
kly
aver
age
grow
th ra
te,3
oct-
21de
c
Exposures to Italian sovereigns, % of Core Tier 1 capital
Exposures to Italian sovereigns, % of Core Tier 1 capital
Cypriot Banks
10
sovereign debt portfolios on banks’ market performances. More precisely, the dependent variable is the average growth rate of banks’ stock prices. We consider as explanatory variables the exposures towards each of the five periphery countries in percent of Core Tier 1 capital. Moreover, Core Tier 1 ratio and risk-weight assets are included in the regression as controls for banks’ size. The analysis is conducted both without and with the inclusion of country dummies, and with a restricted sample that excludes banks headquartered in the periphery countries. Considering the stock price growth rate in the period October-December 20118, exposure towards the Italian sovereign (as reported in December's exercise) is estimated to have had a negative impact on banks’ market performances, with its coefficient negative and statistically significant in most specifications. In particular, in specification 2 (Table 4), in which we include all banks in all countries and control for banks’ average performance per country with country dummies, we find a statistically highly significant and negative coefficient for banks’ holdings of Italian government debt. In specifications 3-5, we exclude the banks located in the five concerned periphery countries. In specification 3, the coefficient fails to be statistically significant. Apparently, when looking only at banks outside of the five countries and when controlling for the location of that country, no significant effect is found. When we stop controlling for the country location of the bank, ie drop the country dummies in specification 4, we find a highly significant coefficient. In specification 5, we control only for the average performance of French and German banks and continue to find a significant effect. It thus appears that cross-country variations of holdings of Italian debt matter. A similar story emerges for the holdings of Irish sovereign debt and to a lesser extent for Portuguese debt. In contrast, the holdings of Spanish debt do not appear to matter at all for the market valuation of banks, within the concerned countries or in the EU as whole. Interestingly, when the dependent variable is the stock price change during the period July-September 2011 (Table 5), neither Italian nor Spanish nor Portuguese sovereign exposures (as reported in July exercise) are found to be a determinant of banks’ stock prices. The coefficient of Greek exposure and Irish exposure turns out to be negative and significant only in those specifications in which the banks of the periphery countries are included. We replicate the regression by Wolff (2011) for convenience.
8 The same results hold if the regression analysis is performed with the stock price growth rates in the periods October-
January and with the exclusion of the outlier Dexia.
11
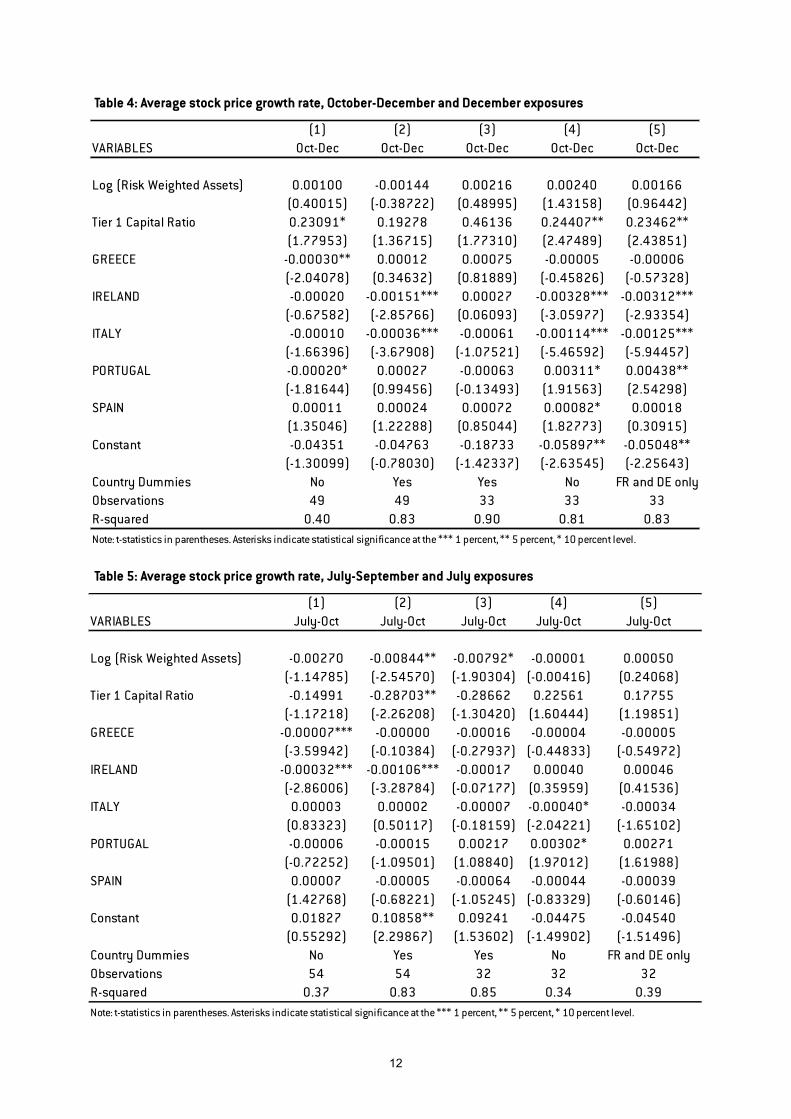
Table 4: Average stock price growth rate, October-December and December exposures
Table 5: Average stock price growth rate, July-September and July exposures
(1) (2) (3) (4) (5)VARIABLES Oct-Dec Oct-Dec Oct-Dec Oct-Dec Oct-Dec
Log (Risk Weighted Assets) 0.00100 -0.00144 0.00216 0.00240 0.00166(0.40015) (-0.38722) (0.48995) (1.43158) (0.96442)
Tier 1 Capital Ratio 0.23091* 0.19278 0.46136 0.24407** 0.23462**(1.77953) (1.36715) (1.77310) (2.47489) (2.43851)
GREECE -0.00030** 0.00012 0.00075 -0.00005 -0.00006(-2.04078) (0.34632) (0.81889) (-0.45826) (-0.57328)
IRELAND -0.00020 -0.00151*** 0.00027 -0.00328*** -0.00312***(-0.67582) (-2.85766) (0.06093) (-3.05977) (-2.93354)
ITALY -0.00010 -0.00036*** -0.00061 -0.00114*** -0.00125***(-1.66396) (-3.67908) (-1.07521) (-5.46592) (-5.94457)
PORTUGAL -0.00020* 0.00027 -0.00063 0.00311* 0.00438**(-1.81644) (0.99456) (-0.13493) (1.91563) (2.54298)
SPAIN 0.00011 0.00024 0.00072 0.00082* 0.00018(1.35046) (1.22288) (0.85044) (1.82773) (0.30915)
Constant -0.04351 -0.04763 -0.18733 -0.05897** -0.05048**(-1.30099) (-0.78030) (-1.42337) (-2.63545) (-2.25643)
Country Dummies No Yes Yes No FR and DE onlyObservations 49 49 33 33 33R-squared 0.40 0.83 0.90 0.81 0.83Note: t-statistics in parentheses. Asterisks indicate statistical significance at the *** 1 percent, ** 5 percent, * 10 percent level.
(1) (2) (3) (4) (5)VARIABLES July-Oct July-Oct July-Oct July-Oct July-Oct
Log (Risk Weighted Assets) -0.00270 -0.00844** -0.00792* -0.00001 0.00050(-1.14785) (-2.54570) (-1.90304) (-0.00416) (0.24068)
Tier 1 Capital Ratio -0.14991 -0.28703** -0.28662 0.22561 0.17755(-1.17218) (-2.26208) (-1.30420) (1.60444) (1.19851)
GREECE -0.00007*** -0.00000 -0.00016 -0.00004 -0.00005(-3.59942) (-0.10384) (-0.27937) (-0.44833) (-0.54972)
IRELAND -0.00032*** -0.00106*** -0.00017 0.00040 0.00046(-2.86006) (-3.28784) (-0.07177) (0.35959) (0.41536)
ITALY 0.00003 0.00002 -0.00007 -0.00040* -0.00034(0.83323) (0.50117) (-0.18159) (-2.04221) (-1.65102)
PORTUGAL -0.00006 -0.00015 0.00217 0.00302* 0.00271(-0.72252) (-1.09501) (1.08840) (1.97012) (1.61988)
SPAIN 0.00007 -0.00005 -0.00064 -0.00044 -0.00039(1.42768) (-0.68221) (-1.05245) (-0.83329) (-0.60146)
Constant 0.01827 0.10858** 0.09241 -0.04475 -0.04540(0.55292) (2.29867) (1.53602) (-1.49902) (-1.51496)
Country Dummies No Yes Yes No FR and DE onlyObservations 54 54 32 32 32R-squared 0.37 0.83 0.85 0.34 0.39Note: t-statistics in parentheses. Asterisks indicate statistical significance at the *** 1 percent, ** 5 percent, * 10 percent level.
12
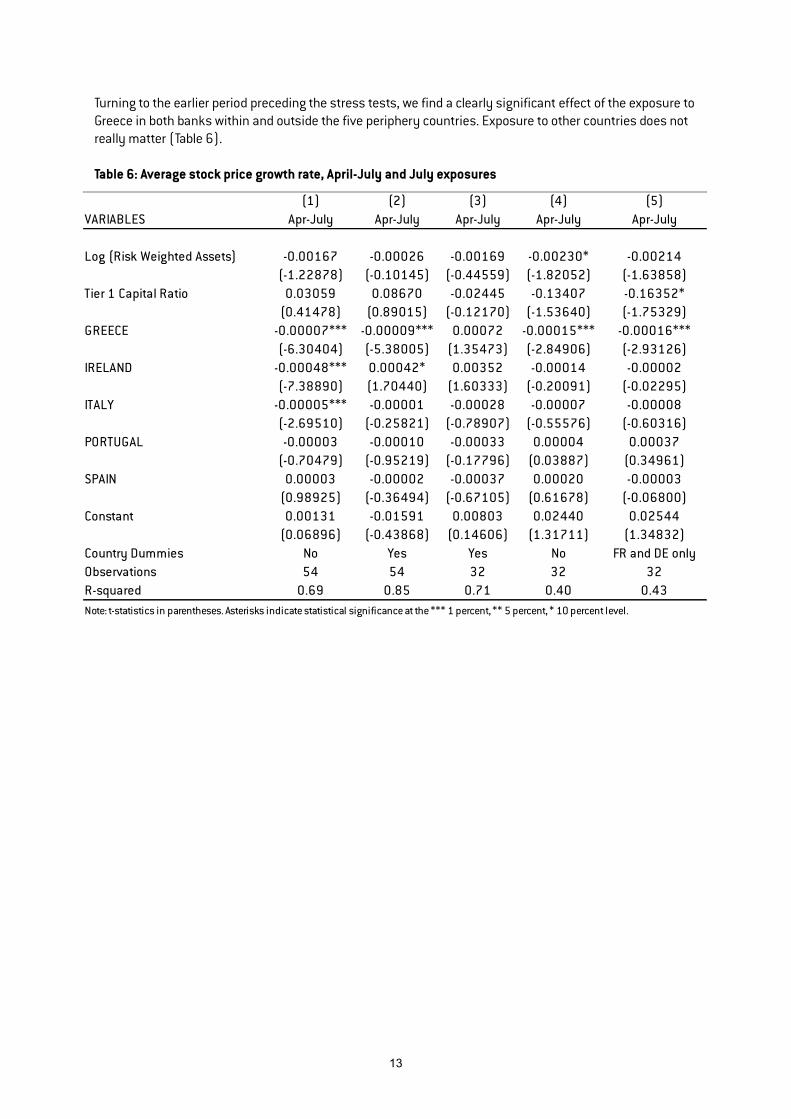
Turning to the earlier period preceding the stress tests, we find a clearly significant effect of the exposure to Greece in both banks within and outside the five periphery countries. Exposure to other countries does not really matter (Table 6).
Table 6: Average stock price growth rate, April-July and July exposures
(1) (2) (3) (4) (5)VARIABLES Apr-July Apr-July Apr-July Apr-July Apr-July
Log (Risk Weighted Assets) -0.00167 -0.00026 -0.00169 -0.00230* -0.00214(-1.22878) (-0.10145) (-0.44559) (-1.82052) (-1.63858)
Tier 1 Capital Ratio 0.03059 0.08670 -0.02445 -0.13407 -0.16352*(0.41478) (0.89015) (-0.12170) (-1.53640) (-1.75329)
GREECE -0.00007*** -0.00009*** 0.00072 -0.00015*** -0.00016***(-6.30404) (-5.38005) (1.35473) (-2.84906) (-2.93126)
IRELAND -0.00048*** 0.00042* 0.00352 -0.00014 -0.00002(-7.38890) (1.70440) (1.60333) (-0.20091) (-0.02295)
ITALY -0.00005*** -0.00001 -0.00028 -0.00007 -0.00008(-2.69510) (-0.25821) (-0.78907) (-0.55576) (-0.60316)
PORTUGAL -0.00003 -0.00010 -0.00033 0.00004 0.00037(-0.70479) (-0.95219) (-0.17796) (0.03887) (0.34961)
SPAIN 0.00003 -0.00002 -0.00037 0.00020 -0.00003(0.98925) (-0.36494) (-0.67105) (0.61678) (-0.06800)
Constant 0.00131 -0.01591 0.00803 0.02440 0.02544(0.06896) (-0.43868) (0.14606) (1.31711) (1.34832)
Country Dummies No Yes Yes No FR and DE onlyObservations 54 54 32 32 32R-squared 0.69 0.85 0.71 0.40 0.43Note: t-statistics in parentheses. Asterisks indicate statistical significance at the *** 1 percent, ** 5 percent, * 10 percent level.
13
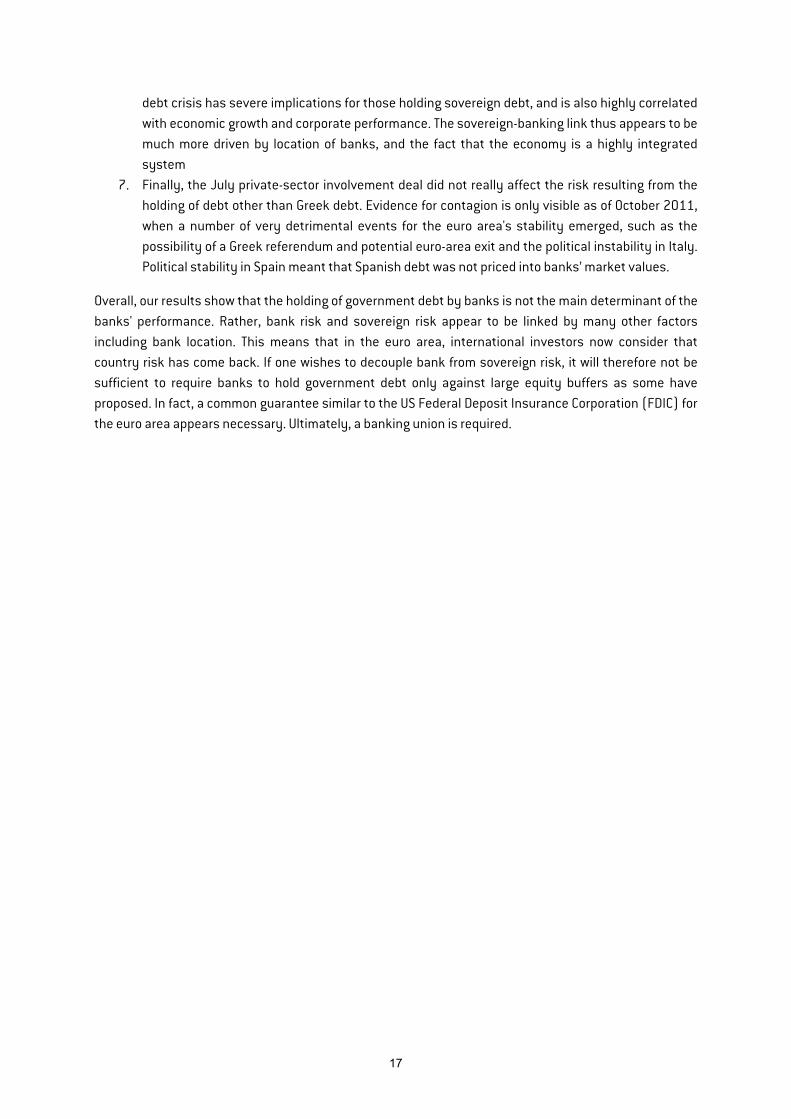
Banks holding significant amounts of Greek debt lost significant market value in the period July to October and in particular April to July 2011. However, the further European Council decisions of 26 October did not seem to have any consequences in terms of further falls in the value of banks stocks; furthermore, stock prices did not react to larger holdings of Greek debt in this period. Instead, large holdings of Italian government bonds are now weighing on the stock market performance of banks. This also holds true, when banks located in the five periphery countries are excluded from the sample. However, when one controls for the location of the bank, the effect of holding Italian debt seems to disappear, suggesting that country location interacts with sovereign exposure to Italy. Similarly, we find such effects for Irish and Portuguese debt. Attitudes towards Italian debt seem to have changed in the period October-December 2011, with more market participants believing that Italian bond holdings could reduce banks’ profits and market values. A number of potential explanations can be offered. First, domestic political difficulties in Italy were particularly virulent and contrasted with the relatively stable political situation in Spain. This difference in political stability may explain why Italy’s solvency risk was seen to be increasing significantly. Second, the 26 October summit was followed by a very difficult time in the euro area because of the possibility of a Greek referendum with implications for Greece's euro-area membership. The integrity of the euro area was increasingly brought into question, with political problems in Italy adding fuel to the fire. It is noteworthy that this effect appears to be restricted to Italy, Ireland and Portugal. For Spain, throughout the period we do not find a significant effect. Overall, the regression results suggest that before October 2011, bank shareholders were really only concerned about Greece. After the discussions in October, the floating of the idea of a Greek referendum and the political difficulties in Italy, the debt of Italy, Ireland and Portugal was increasingly considered to be risky. Only Spanish debt was considered to not be affected by the crisis. 4) Robustness check with CDS data As a robustness check of our results, we look at the change in the CDS price for sovereign bonds. A priori, we expect the results to look relatively similar to the effects on stock market valuation, because the CDS price measures the cost of insurance against losses for bank bonds, while the stock market price measures expectations for the performance of the corporation and its profits. Both measures convey different information but should be correlated9. Indeed, a simple scatter-plot analysis shows that the two measures have a fair degree of correlation. We present our typical scatter plots relating CDS performance to the exposure of individual bank to sovereign bonds. The simple graphical analysis corroborates our previous results. Indeed, Figure 8.1 suggests that no general link between the periphery’s debt holdings and the price of insuring the respective banks can be found. However, exposure to Italy does have an effect on the price of insuring the bank holding such debt (Figure 8.3).
9 The annex shows the average CDS price behaviour over 2011 by country (Figure 9). While Figure 2 show a clear
downward trend for all countries, CDS price pattern is characterised by upward trend. The comparison of the two figures allows to conclude that the two series move together in opposite directions.
14
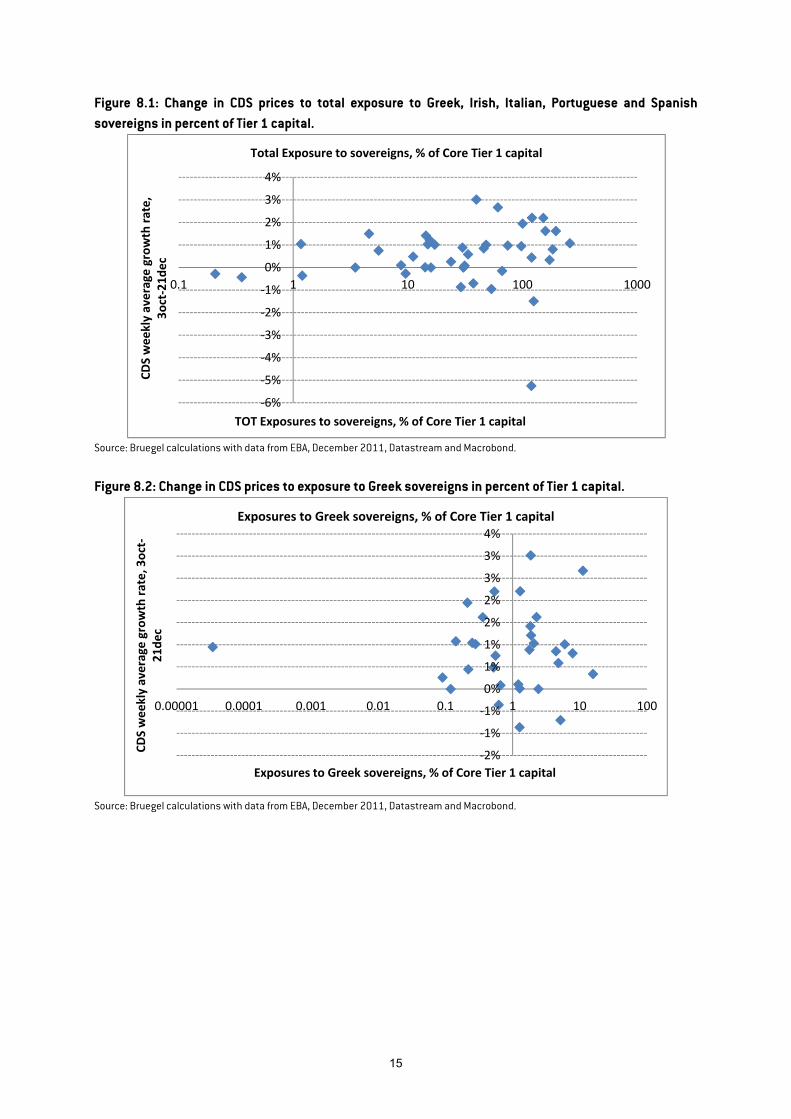
Figure 8.1: Change in CDS prices to total exposure to Greek, Irish, Italian, Portuguese and Spanish sovereigns in percent of Tier 1 capital.
Source: Bruegel calculations with data from EBA, December 2011, Datastream and Macrobond.
Figure 8.2: Change in CDS prices to exposure to Greek sovereigns in percent of Tier 1 capital.
Source: Bruegel calculations with data from EBA, December 2011, Datastream and Macrobond.
-6%
-5%
-4%
-3%
-2%
-1%
0%
1%
2%
3%
4%
0.1 1 10 100 1000
CDS
wee
kly
aver
age
grow
th ra
te,
3oct
-21d
ec
TOT Exposures to sovereigns, % of Core Tier 1 capital
Total Exposure to sovereigns, % of Core Tier 1 capital
-2%
-1%
-1%
0%
1%
1%
2%
2%
3%
3%
4%
0.00001 0.0001 0.001 0.01 0.1 1 10 100
CDS
wee
kly
aver
age
grow
th ra
te, 3
oct-
21de
c
Exposures to Greek sovereigns, % of Core Tier 1 capital
Exposures to Greek sovereigns, % of Core Tier 1 capital
15
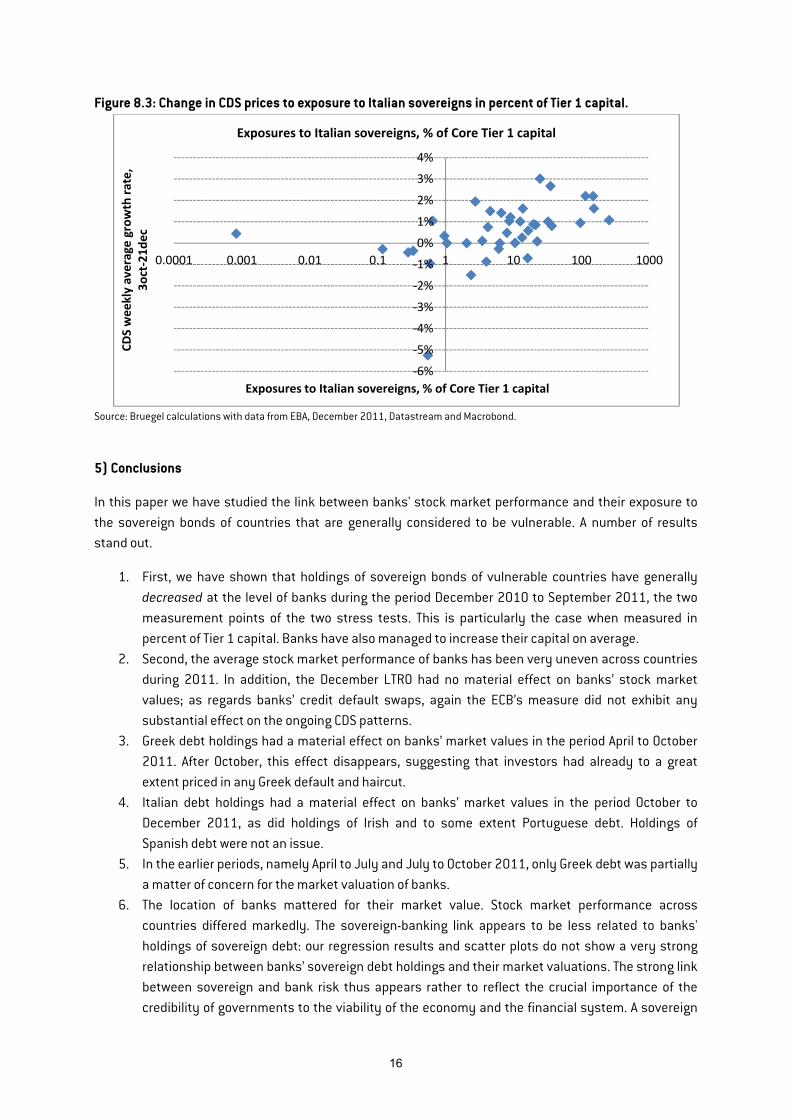
Figure 8.3: Change in CDS prices to exposure to Italian sovereigns in percent of Tier 1 capital.
Source: Bruegel calculations with data from EBA, December 2011, Datastream and Macrobond.
5) Conclusions
In this paper we have studied the link between banks' stock market performance and their exposure to the sovereign bonds of countries that are generally considered to be vulnerable. A number of results stand out.
1. First, we have shown that holdings of sovereign bonds of vulnerable countries have generally decreased at the level of banks during the period December 2010 to September 2011, the two measurement points of the two stress tests. This is particularly the case when measured in percent of Tier 1 capital. Banks have also managed to increase their capital on average.
2. Second, the average stock market performance of banks has been very uneven across countries during 2011. In addition, the December LTRO had no material effect on banks’ stock market values; as regards banks’ credit default swaps, again the ECB’s measure did not exhibit any substantial effect on the ongoing CDS patterns.
3. Greek debt holdings had a material effect on banks’ market values in the period April to October 2011. After October, this effect disappears, suggesting that investors had already to a great extent priced in any Greek default and haircut.
4. Italian debt holdings had a material effect on banks’ market values in the period October to December 2011, as did holdings of Irish and to some extent Portuguese debt. Holdings of Spanish debt were not an issue.
5. In the earlier periods, namely April to July and July to October 2011, only Greek debt was partially a matter of concern for the market valuation of banks.
6. The location of banks mattered for their market value. Stock market performance across countries differed markedly. The sovereign-banking link appears to be less related to banks' holdings of sovereign debt: our regression results and scatter plots do not show a very strong relationship between banks’ sovereign debt holdings and their market valuations. The strong link between sovereign and bank risk thus appears rather to reflect the crucial importance of the credibility of governments to the viability of the economy and the financial system. A sovereign
-6%
-5%
-4%
-3%
-2%
-1%
0%
1%
2%
3%
4%
0.0001 0.001 0.01 0.1 1 10 100 1000
CDS
wee
kly
aver
age
grow
th ra
te,
3oct
-21d
ec
Exposures to Italian sovereigns, % of Core Tier 1 capital
Exposures to Italian sovereigns, % of Core Tier 1 capital
16
debt crisis has severe implications for those holding sovereign debt, and is also highly correlated with economic growth and corporate performance. The sovereign-banking link thus appears to be much more driven by location of banks, and the fact that the economy is a highly integrated system
7. Finally, the July private-sector involvement deal did not really affect the risk resulting from the holding of debt other than Greek debt. Evidence for contagion is only visible as of October 2011, when a number of very detrimental events for the euro area's stability emerged, such as the possibility of a Greek referendum and potential euro-area exit and the political instability in Italy. Political stability in Spain meant that Spanish debt was not priced into banks’ market values.
Overall, our results show that the holding of government debt by banks is not the main determinant of the banks' performance. Rather, bank risk and sovereign risk appear to be linked by many other factors including bank location. This means that in the euro area, international investors now consider that country risk has come back. If one wishes to decouple bank from sovereign risk, it will therefore not be sufficient to require banks to hold government debt only against large equity buffers as some have proposed. In fact, a common guarantee similar to the US Federal Deposit Insurance Corporation (FDIC) for the euro area appears necessary. Ultimately, a banking union is required.
17
References Acharya V.V., I. Drechsler and P. Schnabl (2011) "A Pyrrhic Victory?- Bank Bailouts and Sovereign Credit Risk",
NBER Working Papers 17136, National Bureau of Economic Research, Inc.
Alter A. and Y. S. Schüler (2011) "Credit Spread Interdependencies of European States and Banks during the Financial Crisis," Working Paper Series of the Department of Economics, University of Konstanz 2011-24, Department of Economics, University of Konstanz
Bank for International Settlement (BIS) (2011) “The impact of sovereign credit risk on bank funding conditions”, CGFS Papers n’43
Bolton P. and O. Jeanne (2011) "Sovereign Default Risk and Bank Fragility in Financially Integrated Economies," IMF Economic Review, Palgrave Macmillan, vol. 59(2), pages 162-194, June
Ejsing J. and W. Lemke (2011) “The Janus-Headed Salvation: Sovereign and Bank Credit Risk Premia during 2008-2009,” Economics Letters 110, 28–31
European Banking Authority (EBA) (2011) “2011 EU-Wide Stress Test: Methodological Note”, March
European Banking Authority (EBA) (2011) “Capital buffers for addressing market concerns over sovereign exposures-Methodological Note”, December
Gerlach S., A.Schulz and G.B.Wolff (2010) “Banking and Sovereign Risk in the euro area”, CEPR DP 7833
Gray D. F., (2009) “Modeling Financial Crises and Sovereign Risks,” Annual Review of Financial Economics 1 117–144
Gray D. F., R. C Merton and Z. Bodie (2008) “New Framework for Measuring and Managing Macrofinancial Risk and Financial Stability,” Working Paper
Iara A. and Wolff G.B. (2011) “Rules and risk in the euro area”, Bruegel Working Paper /2011/10
Marzinotto B., A. Sapir and G.B. Wolff (2011) “What kind of fiscal union?”, Bruegel Policy Brief No 2011/06
Merler S. and J. Pisani-Ferry (2012) “Who is afraid of sovereign bonds?”, Bruegel Policy Contribution No 2012/02
Mody A. (2009) "From Bear Stearns to Anglo Irish: How Eurozone Sovereign Spreads Related to Financial Sector Vulnerability", IMF Working Papers 09/108, International Monetary Fund
Mody A. and S. Damiano (2011) “The Eurozone Crisis: How Banks and Sovereigns Came to be Joined at the Hip”, WP/11/269 November, International Monetary Fund
Petrella G. and A. Resti, “Do Stress Tests Reduce Bank Opaqueness? Lesson from the 2011 European Exercise”, working paper, http://papers.ssrn.com/sol3/papers.cfm?abstract_id=1968681
Pisani-Ferry J. (2012) “The euro area crisis and the new impossible trinity”, Bruegel Policy Contribution No 2012/01
Reinhart C.M. and K.S. Rogoff (2009) "The Aftermath of Financial Crises," American Economic Review, American Economic Association, vol. 99(2), pages 466-72, May
Wolff G.B.(2011) “Is recent bank stress really driven by the sovereign debt crisis?”, Bruegel Policy Contribution No 2011/12
18

Annex
Data Country BankCode Bank Name July
Stress Test
December Capital
Exercise
Stock Prices Data
CDSs Data
AT AT001 Erste Group Bank AG yes yes yes yesAT AT002 Raiffeisen Zentralbank Österreich
AG yes yes yes yes
AT AT003 Österreichische Volksbank AG yes yes yes missingBE BE004 DEXIA yes yes yes missingBE BE005 KBC BANK yes yes yes yesCY CY006 MARFIN POPULAR BANK PUBLIC CO
LTD yes yes yes missing
CY CY007 BANK OF CYPRUS PUBLIC CO LTD yes yes yes missingDK DK008 DANSKE BANK yes yes yes yesDK DK009 Jyske Bank yes yes yes missingDK DK010 Sydbank yes yes yes missingDK DK011 Nykredit yes yes missing missingFI FI012 OP-Pohjola Group yes yes yes missingFR FR013 BNP PARIBAS yes yes yes yesFR FR014 CREDIT AGRICOLE yes yes yes yesFR FR015 BPCE yes yes missing missingFR FR016 SOCIETE GENERALE yes yes yes yesDE DE017 DEUTSCHE BANK AG yes yes yes yesDE DE018 COMMERZBANK AG yes yes yes yesDE DE019 Landesbank Baden-Württemberg yes yes missing yesDE DE020 DZ BANK AG Dt. Zentral-
Genossenschaftsbank yes yes missing missing
DE DE021 Bayerische Landesbank yes yes missing yesDE DE022 Norddeutsche Landesbank -GZ yes yes missing yesDE DE023 Hypo Real Estate Holding AG,
München yes yes missing missing
DE DE024 WestLB AG, Düsseldorf yes yes missing yesDE DE025 HSH Nordbank AG, Hamburg yes yes missing yesDE DE026 Landesbank Hessen-Thüringen GZ,
Frankfurt yes but
not disclosed
yes yes yes
DE DE027 Landesbank Berlin AG yes yes yes yesDE DE028 DekaBank Deutsche Girozentrale,
Frankfurt yes yes missing missing
DE DE029 WGZ BANK AG Westdt. Geno. Zentralbk, Ddf
yes yes yes missing
GR GR030 EFG EUROBANK ERGASIAS yes yes but not
disclosed
yes yes
GR GR031 NATIONAL BK.OF GREECE yes yes but not
disclosed
yes yes
GR GR032 ALPHA BANK yes yes but not
disclosed
yes yes
GR GR033 BANK OF PIRAEUS yes yes but not
yes missing
19

disclosed GR GR034 AGRI.BANK OF GREECE yes yes but
not disclosed
yes missing
GR GR035 TT HELLENIC POSTBANK yes yes but not
disclosed
yes yes
HU HU036 OTP BANK NYRT. yes yes yes yesIE IE037 ALLIED IRISH BANKS PLC yes yes yes yesIE IE038 BANK OF IRELAND yes yes yes yesIE IE039 IRISH LIFE AND PERMANENT yes yes yes yesIT IT040 INTESA SANPAOLO S.p.A yes yes yes yesIT IT041 UNICREDIT S.p.A yes yes yes yesIT IT042 BANCA MONTE DEI PASCHI DI
SIENA S.p.A yes yes yes yes
IT IT043 BANCO POPOLARE - S.C. yes yes yes yesIT IT044 UNIONE DI BANCHE ITALIANE SCPA
(UBI BANCA) yes yes yes yes
LU LU045 BANQUE ET CAISSE D'EPARGNE DE L'ETAT
yes yes missing missing
MT MT046 BANK OF VALLETTA (BOV) yes yes yes missingNL NL047 ING BANK NV yes yes yes yesNL NL048 RABOBANK NEDERLAND yes yes missing yesNL NL049 ABN AMRO BANK NV yes yes missing yesNL NL050 SNS BANK NV yes yes missing yesNO NO051 DnB NOR Bank ASA yes yes yes yesPL PL052 POWSZECHNA KASA
OSZCZĘDNOŚCI BANK POLSKI S.A. (PKO BANK POLSKI)
yes yes yes missing
PT PT053 CAIXA GERAL DE DEPÓSITOS, SA yes yes missing yesPT PT054 BANCO COMERCIAL PORTUGUÊS,
SA (BCP OR MILLENNIUM BCP) yes yes yes yes
PT PT055 ESPÍRITO SANTO FINANCIAL GROUP, SA (ESFG)
yes yes yes yes
PT PT056 Banco BPI, SA yes yes yes yesSl SI057 NOVA LJUBLJANSKA BANKA D.D.
(NLB d.d.) yes yes missing missing
Sl SI058 NOVA KREDITNA BANKA MARIBOR D.D. (NKBM d.d.)
yes yes yes missing
ES ES059 BANCO SANTANDER S.A. yes yes yes yesES ES060 BANCO BILBAO VIZCAYA
ARGENTARIA S.A. (BBVA) yes yes yes yes
ES ES061 BFA BANKIA yes yes yes missingES ES062 CAJA DE AHORROS Y PENSIONES
DE BARCELONA yes yes yes yes
ES ES063 EFFIBANK yes no no noES ES064 BANCO POPULAR ESPAÑOL, S.A. yes yes yes yesES ES065 BANCO DE SABADELL, S.A yes no no noES ES066 CAIXA D'ESTALVIS DE CATALUNYA,
TARRAGONA I MANRESA yes no no no
ES ES067 CAIXA DE AFORROS DE GALICIA, VIGO, OURENSE E PONTEVEDRA
yes no no no
20

ES ES068 GRUPO BMN yes no no noES ES069 BANKINTER, S.A yes no no noES ES070 CAJA ESPAÑA DE INVERSIONES,
SALAMANCA Y SORIA, CAJA DE AHORROS Y MONTE DE PIEDAD
yes no no no
ES ES071 GRUPO BANCA CIVICA yes no no noES ES072 CAJA DE AHORROS Y M.P. DE
ZARAGOZA, ARAGON Y RIOJA yes no no no
ES ES073 MONTE DE PIEDAD Y CAJA DE AHORROS DE RONDA, CADIZ, ALMERIA, MALAGA, ANTEQUERA Y JAEN
yes no no no
ES ES074 BANCO PASTOR, S.A. yes no no noES ES075 GRUPO BBK yes no no noES ES076 CAIXA D'ESTALVIS UNIO DE CAIXES
DE MANLLEU, SABADELL I TERRASSA
yes no no no
ES ES077 CAJA DE AHORROS Y M.P. DE GIPUZKOA Y SAN SEBASTIAN
yes no no no
ES ES078 GRUPO CAJA3 yes no no noES ES079 BANCA MARCH yes no no noES ES080 CAJA DE AHORROS DE VITORIA Y
ALAVA yes no no no
ES ES081 CAJA DE AHORROS Y M.P. DE ONTINYENT
yes no no no
ES ES082 COLONYA - CAIXA D'ESTALVIS DE POLLENSA
yes no no no
ES ES083 CAJA DE AHORROS DEL MEDITERRANEO
yes no no no
SE SE084 Nordea Bank AB (publ) yes yes yes yesSE SE085 Skandinaviska Enskilda Banken AB
(publ) (SEB) yes yes yes yes
SE SE086 Svenska Handelsbanken AB (publ) yes yes yes yesSE SE087 Swedbank AB (publ) yes yes yes yesGB GB088 ROYAL BANK OF SCOTLAND GROUP
plc yes yes yes yes
GB GB089 HSBC HOLDINGS plc yes yes yes yesGB GB090 BARCLAYS plc yes yes yes yesGB GB091 LLOYDS BANKING GROUP plc yes yes yes yes
Number of Banks with available data 90 65 55 50 Data Source 2011 EU
Stess Test, EBA
2011 EU Capital
Exercise, EBA
Datastream and Macrobond
21
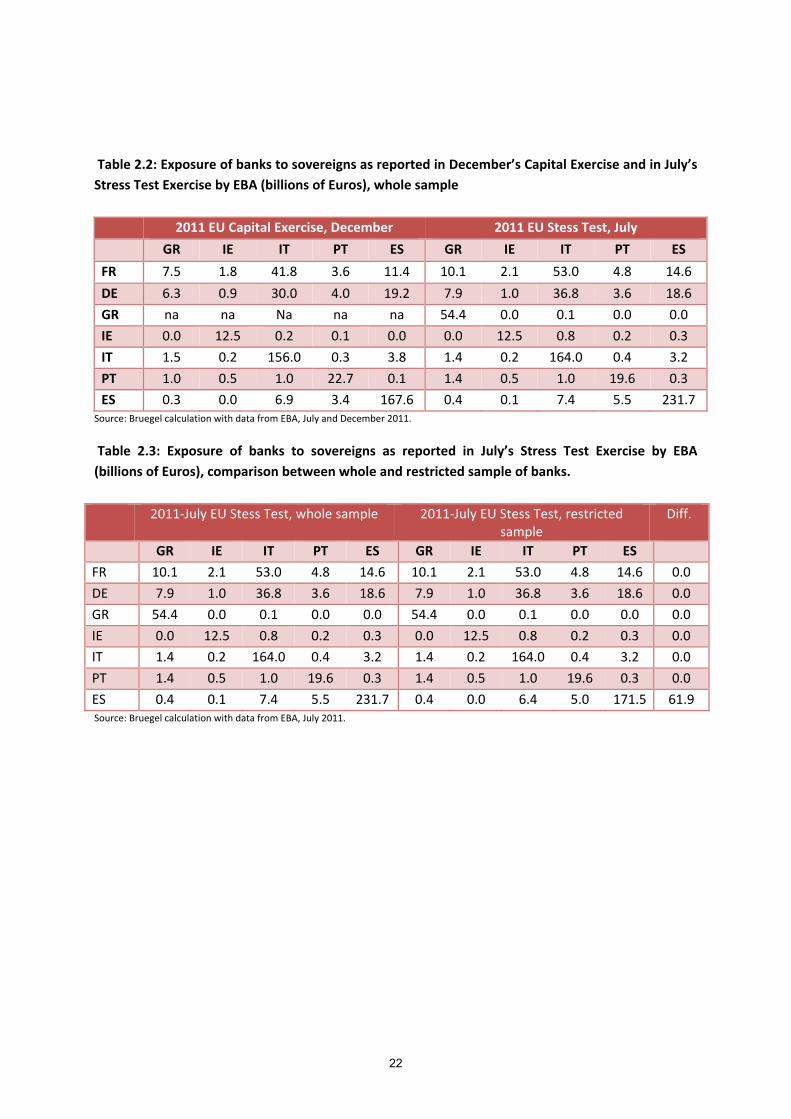
Table 2.2: Exposure of banks to sovereigns as reported in December’s Capital Exercise and in July’s Stress Test Exercise by EBA (billions of Euros), whole sample
2011 EU Capital Exercise, December 2011 EU Stess Test, July GR IE IT PT ES GR IE IT PT ES FR 7.5 1.8 41.8 3.6 11.4 10.1 2.1 53.0 4.8 14.6 DE 6.3 0.9 30.0 4.0 19.2 7.9 1.0 36.8 3.6 18.6 GR na na Na na na 54.4 0.0 0.1 0.0 0.0 IE 0.0 12.5 0.2 0.1 0.0 0.0 12.5 0.8 0.2 0.3 IT 1.5 0.2 156.0 0.3 3.8 1.4 0.2 164.0 0.4 3.2 PT 1.0 0.5 1.0 22.7 0.1 1.4 0.5 1.0 19.6 0.3 ES 0.3 0.0 6.9 3.4 167.6 0.4 0.1 7.4 5.5 231.7
Source: Bruegel calculation with data from EBA, July and December 2011.
Table 2.3: Exposure of banks to sovereigns as reported in July’s Stress Test Exercise by EBA (billions of Euros), comparison between whole and restricted sample of banks. 2011-July EU Stess Test, whole sample 2011-July EU Stess Test, restricted
sample Diff.
GR IE IT PT ES GR IE IT PT ES FR 10.1 2.1 53.0 4.8 14.6 10.1 2.1 53.0 4.8 14.6 0.0 DE 7.9 1.0 36.8 3.6 18.6 7.9 1.0 36.8 3.6 18.6 0.0 GR 54.4 0.0 0.1 0.0 0.0 54.4 0.0 0.1 0.0 0.0 0.0 IE 0.0 12.5 0.8 0.2 0.3 0.0 12.5 0.8 0.2 0.3 0.0 IT 1.4 0.2 164.0 0.4 3.2 1.4 0.2 164.0 0.4 3.2 0.0 PT 1.4 0.5 1.0 19.6 0.3 1.4 0.5 1.0 19.6 0.3 0.0 ES 0.4 0.1 7.4 5.5 231.7 0.4 0.0 6.4 5.0 171.5 61.9 Source: Bruegel calculation with data from EBA, July 2011.
22
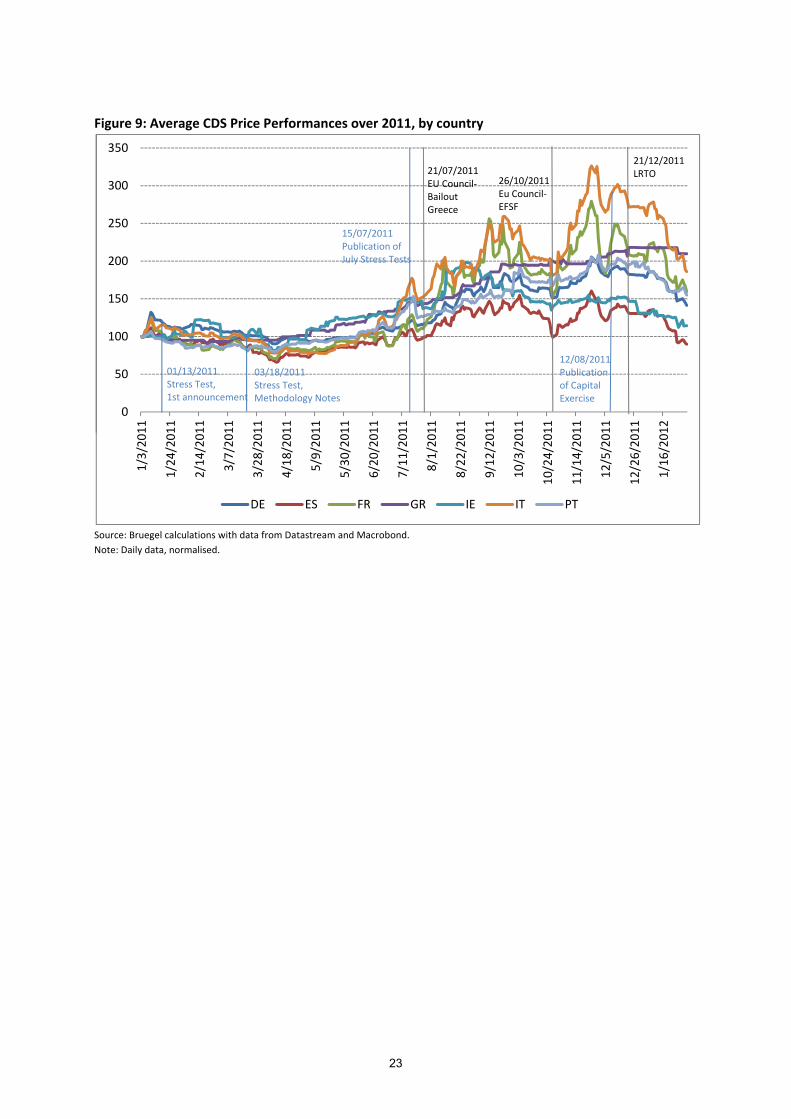
Figure 9: Average CDS Price Performances over 2011, by country
Source: Bruegel calculations with data from Datastream and Macrobond. Note: Daily data, normalised.
0
50
100
150
200
250
300
3501/
3/20
11
1/24
/201
1
2/14
/201
1
3/7/
2011
3/28
/201
1
4/18
/201
1
5/9/
2011
5/30
/201
1
6/20
/201
1
7/11
/201
1
8/1/
2011
8/22
/201
1
9/12
/201
1
10/3
/201
1
10/2
4/20
11
11/1
4/20
11
12/5
/201
1
12/2
6/20
11
1/16
/201
2
DE ES FR GR IE IT PT
21/12/2011LRTO
15/07/2011Publication of July Stress Tests
26/10/2011Eu Council-EFSF
21/07/2011EU Council-BailoutGreece
12/08/2011Publicationof Capital Exercise
03/18/2011Stress Test,Methodology Notes
01/13/2011Stress Test,1st announcement
23