Embed Size (px)
Citation preview

Are all methods of reducing PPG equally beneficial?
Jennie Brand-Miller School of Molecular Bioscience
& Boden Institute of Obesity, Nutrition and Exercise The University of Sydney

Outline � Dietary strategies that may reduce PPG
� Can we predict PPG from nutrient content? � single foods, mixed meals, day-long
� Which dietary strategies reduce risk of chronic disease? � Evidence from observational studies � Evidence from RCT
� Consequences of aiming for lowest PPG
� My interpretation of the state of the art
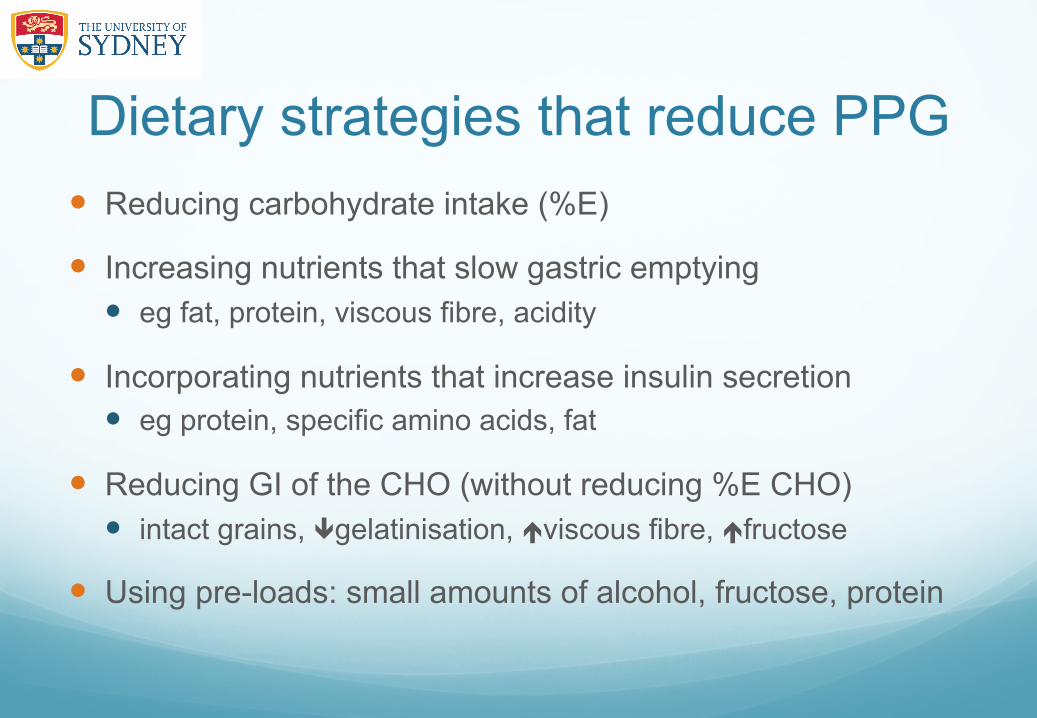
Dietary strategies that reduce PPG � Reducing carbohydrate intake (%E)
� Increasing nutrients that slow gastric emptying � eg fat, protein, viscous fibre, acidity
� Incorporating nutrients that increase insulin secretion � eg protein, specific amino acids, fat
� Reducing GI of the CHO (without reducing %E CHO) � intact grains, gelatinisation, viscous fibre, fructose
� Using pre-loads: small amounts of alcohol, fructose, protein

CHO content is only a rough guide to PPG 120 foods tested in 1000 kJ portions
0"
20"
40"
60"
80"
100"
0" 10" 20" 30" 40" 50" 60"
Brand-Miller et al, Am J Clin Nutr 2011
Carbohydrate Content (g/1000kJ)
Relative glycaemia
AUC (%)
r2 = 0.66, p < 0.001
0"
20"
40"
60"
80"
100"
0" 10" 20" 30" 40" 50" 60"
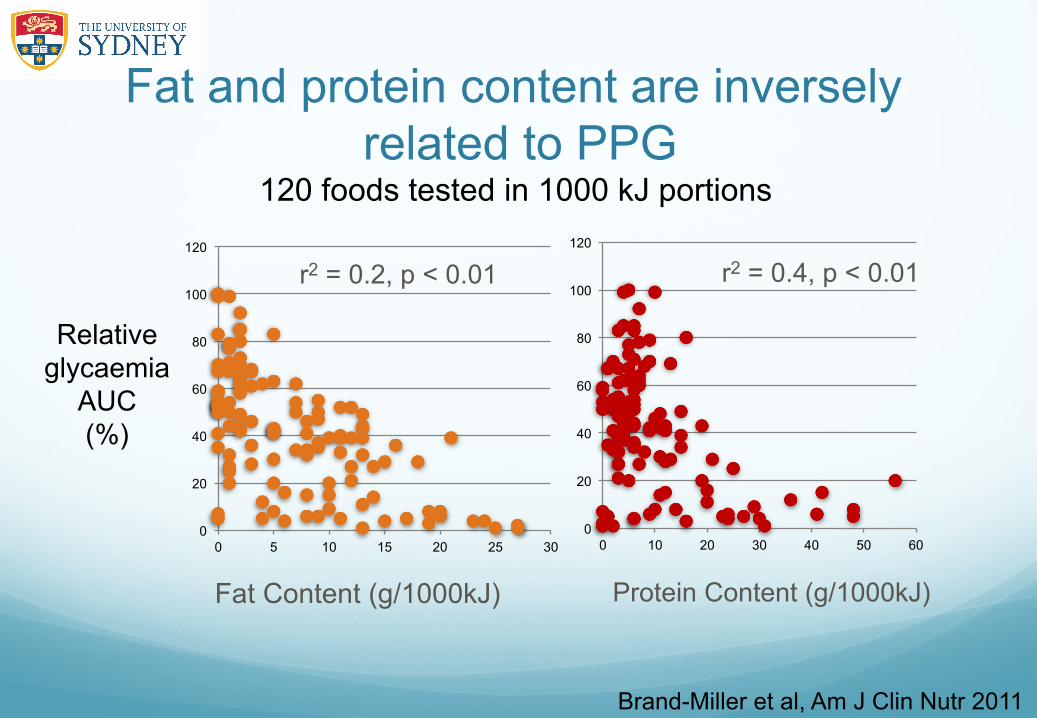
Fat and protein content are inversely related to PPG
120 foods tested in 1000 kJ portions
Brand-Miller et al, Am J Clin Nutr 2011
Fat Content (g/1000kJ)
Relative glycaemia
AUC (%)
r2 = 0.2, p < 0.01
0
20
40
60
80
100
120
0 5 10 15 20 25 30 0
20
40
60
80
100
120
0 10 20 30 40 50 60
Protein Content (g/1000kJ)
r2 = 0.4, p < 0.01

Fibre shows no relationship to PPG 1000 kJ portions of 120 single foods"
Brand-Miller et al, Am J Clin Nutr 2011"
0"
20"
40"
60"
80"
100"
120"
0" 5" 10" 15" 20" 25" 30"
Fibre content per 1000 kJ"
Relative glycaemia"
AUC"%"
!

GL is the best predictor of PPG 1000 kJ portions of 120 single foods
0"
20"
40"
60"
80"
100"
120"
0" 10" 20" 30" 40" 50"
Brand-Miller et al, Am J Clin Nutr 2011
Glycemic load (g/1000kJ)
Relative glycaemia
AUC (%)
r2 = 0.76, p < 0.001
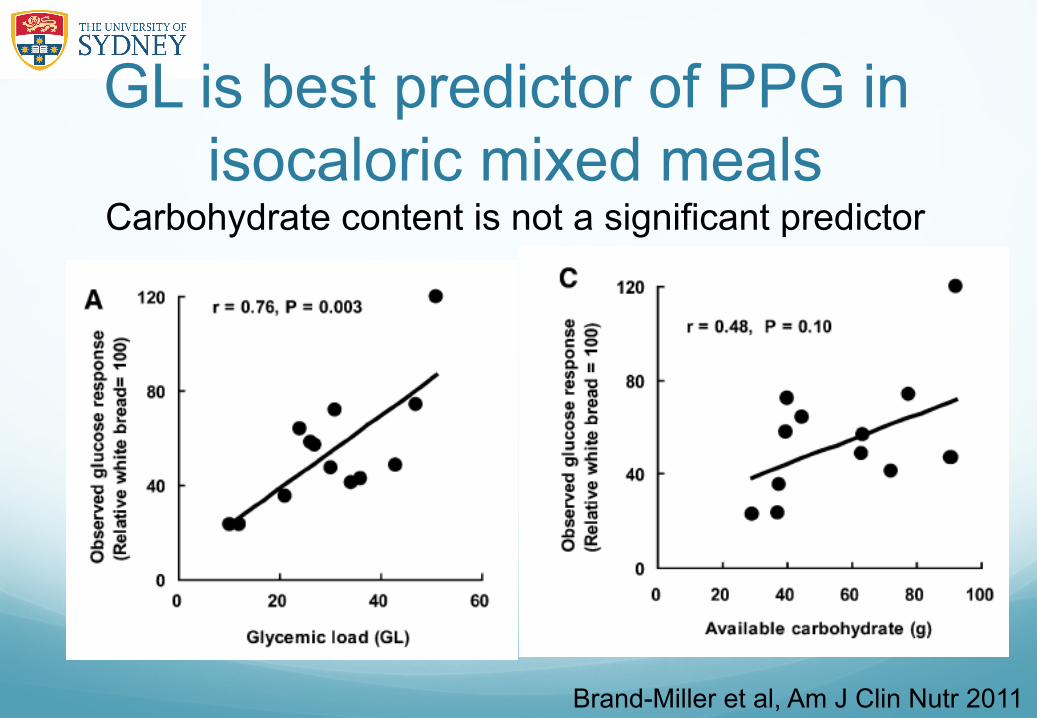
GL is best predictor of PPG in isocaloric mixed meals
Carbohydrate content is not a significant predictor
Brand-Miller et al, Am J Clin Nutr 2011

Low GI diets reduce day-long glucose levels CGMS* in overweight, pre-diabetic subjects
Solomon et al. Am J Clin Nutr 2010"
High fibre diet"
Low GI diet"
HbA1c"P < 0.001"
High GI diet"
Low GI diet"
matched for protein, fat, CHO, fibre"
*Continuous glucose monitoring system"
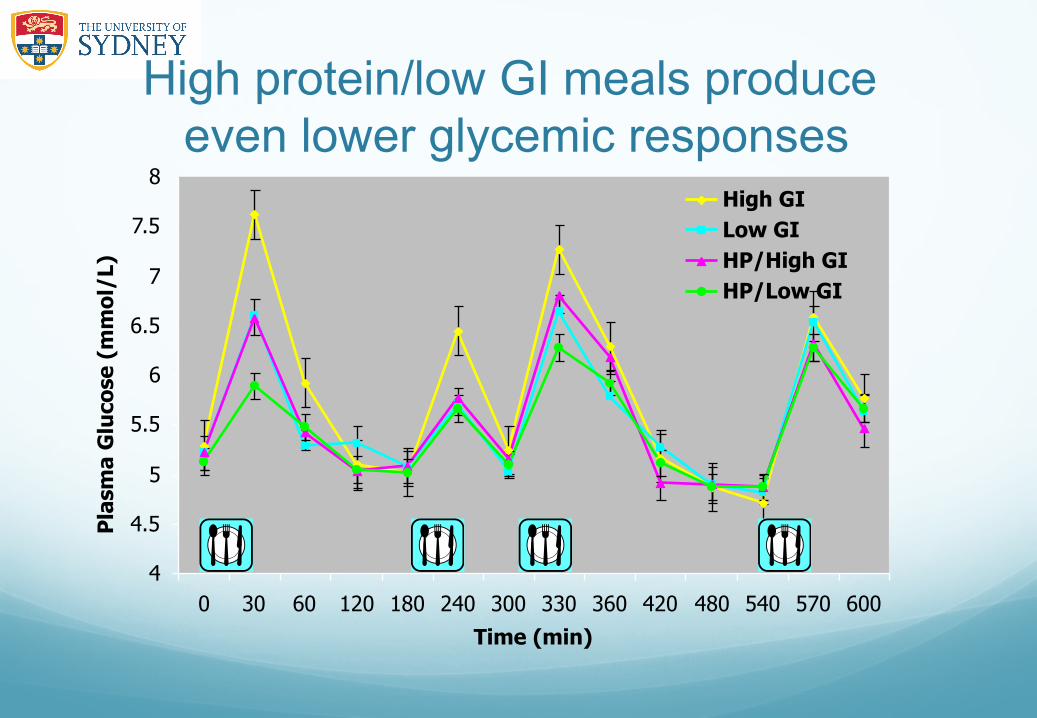
High protein/low GI meals produce even lower glycemic responses
4
4.5
5
5.5
6
6.5
7
7.5
8
0 30 60 120 180 240 300 330 360 420 480 540 570 600
Time (min)
Pla
sma
Glu
cose
(m
mo
l/L)
High GILow GIHP/High GIHP/Low GI

Which of these strategies reduce the risk of chronic disease?

Prospective observational studies and risk of T2D and CVD
In most studies, total carbohydrate is not independently
related to the development of diabetes or CVD
But GI and/or GL are!"

Lower GL diets reduce risk of T2D Meta-analysis is significant in women but not men
Livesey et al. Am J Clin Nutr 2013

Cereal fibre reduces risk of T2DM Meta-analysis of 9 studies, RR = 0.67
Schulze et al. Arch Intern Med 2007"
Favours low cereal fibre intake"
Favours high cereal fibre intake"

Low GL = risk of gestational diabetes Gestational diabetes (GDM) over 8 y of follow up in 13,110 women
Zhang et al. Diabetes Care 2006
p < 0.03 after multivariate adjustment P for trend = 0.03 in fully adjusted model "
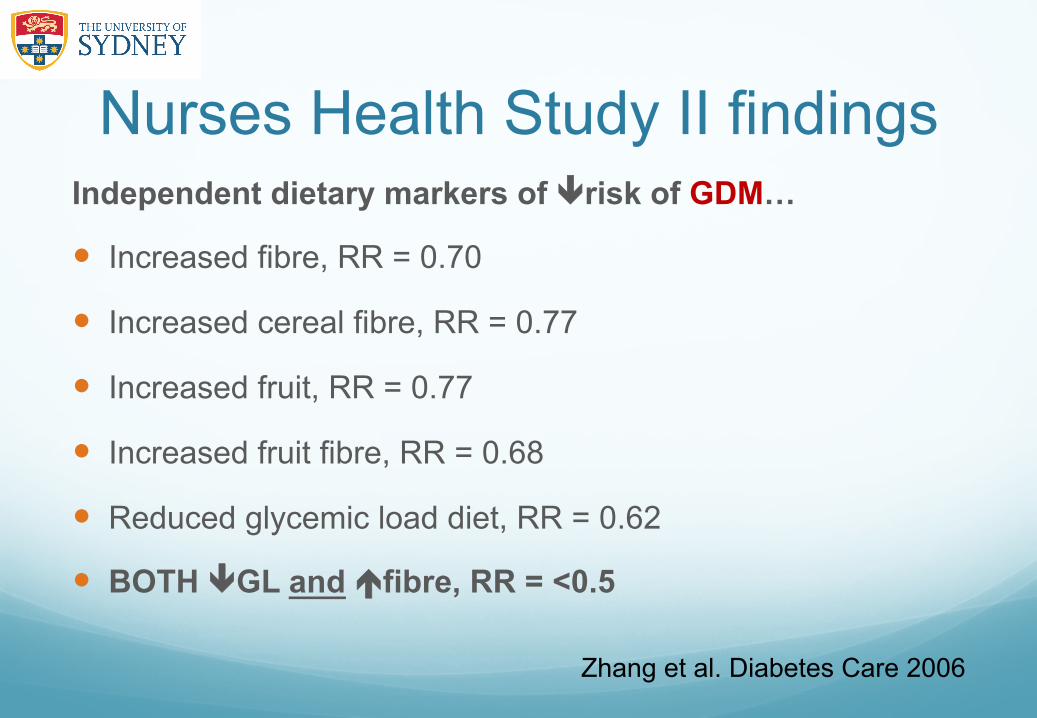
Nurses Health Study II findings Independent dietary markers of risk of GDM…
� Increased fibre, RR = 0.70
� Increased cereal fibre, RR = 0.77
� Increased fruit, RR = 0.77
� Increased fruit fibre, RR = 0.68
� Reduced glycemic load diet, RR = 0.62
� BOTH GL and fibre, RR = <0.5
Zhang et al. Diabetes Care 2006

Low glycemic load = risk of CVD Nurses’ Health Study 20 y follow-up, 82,000 women
Lowest Glycaemic load Highest
RR
p < 0.003 for trend after multivariate adjustment
Halton et al. New Engl J Med, 2006
P = 0.003 for trend in fully adjusted model" 1.9"
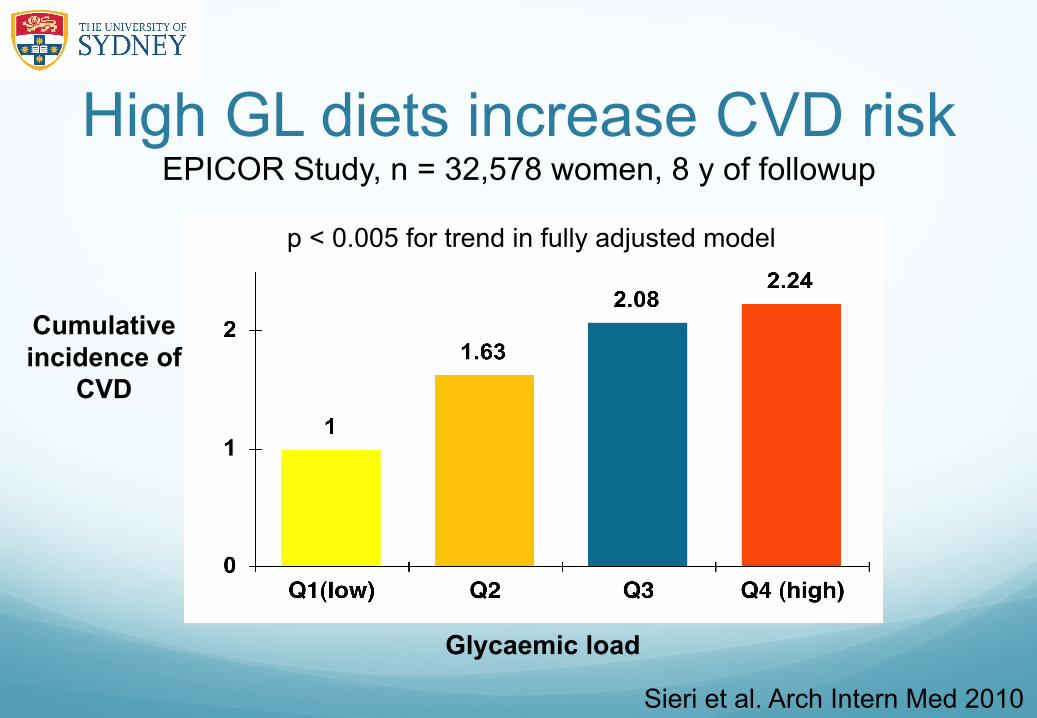
High GL diets increase CVD risk EPICOR Study, n = 32,578 women, 8 y of followup
Sieri et al. Arch Intern Med 2010
Glycaemic load
Cumulative incidence of
CVD
p < 0.005 for trend in fully adjusted model
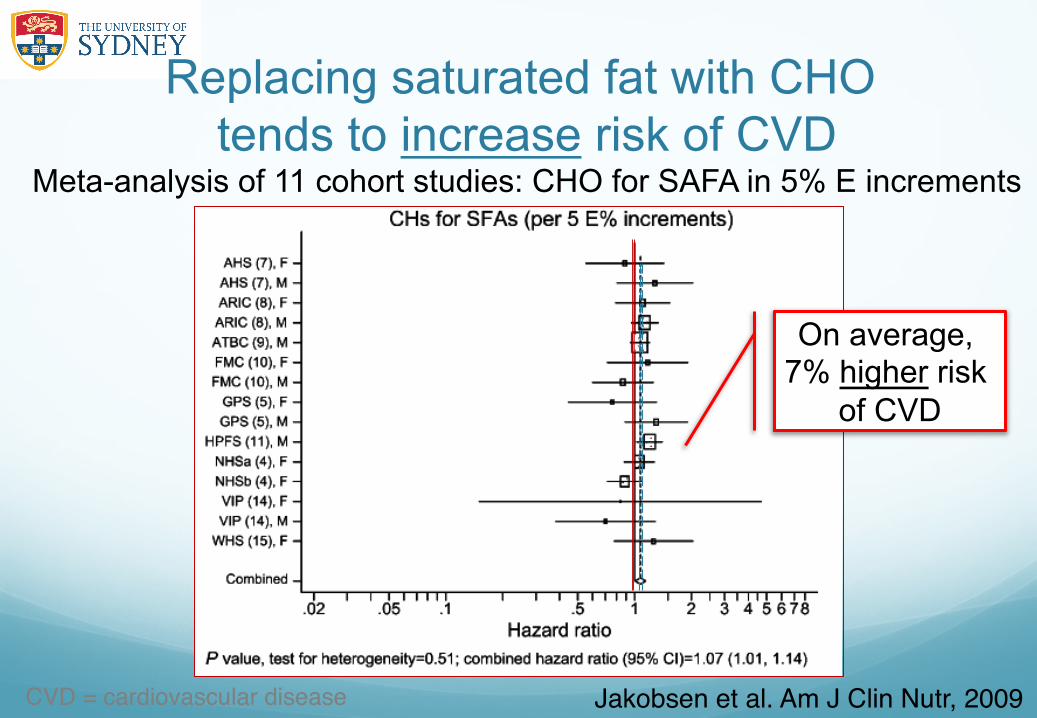
Replacing saturated fat with CHO tends to increase risk of CVD
Meta-analysis of 11 cohort studies: CHO for SAFA in 5% E increments
Jakobsen et al. Am J Clin Nutr, 2009"CVD = cardiovascular disease!
On average, 7% higher risk
of CVD

Only high GI carbs increase CVD risk
Hazards ratio myocardial infarction "(95% CI)"
0.6
0.8
1.0
1.2
1.4
1.6
1.8
Tertiles of glycemic index"
Jakobsen et al AJCN 2010"
Danish Cohort Study, n = 53,644, 12 years of follow up, 1943 cases"
1st" 2nd" 3rd"
Replacing SFA with CHO (5% E) "

Randomised controlled trials

Lifestyle interventions that result in weight loss are effective
But is a low fat, high CHO diet the optimal
diet for preventing T2D?
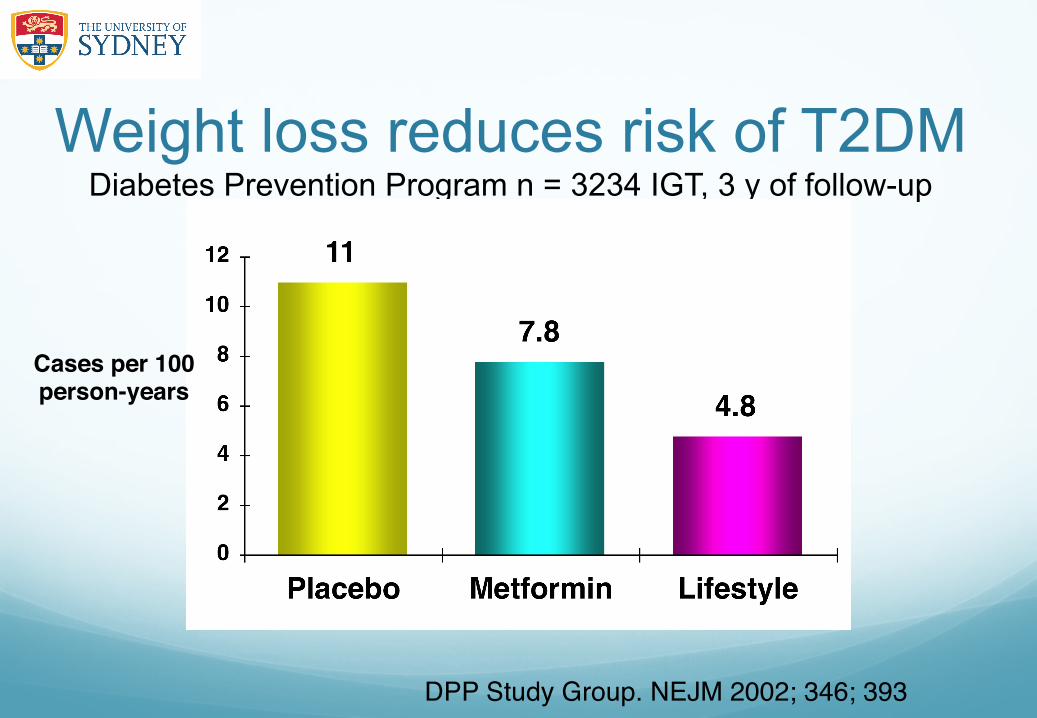
Weight loss reduces risk of T2DM Diabetes Prevention Program n = 3234 IGT, 3 y of follow-up
Cases per 100!person-years!
DPP Study Group. NEJM 2002; 346; 393"

Low fat diet did not reduce T2D Women’s Health Initiative, n = 45,887, 9 y of followup
Tinker et al. Arch Intern Med 2008"
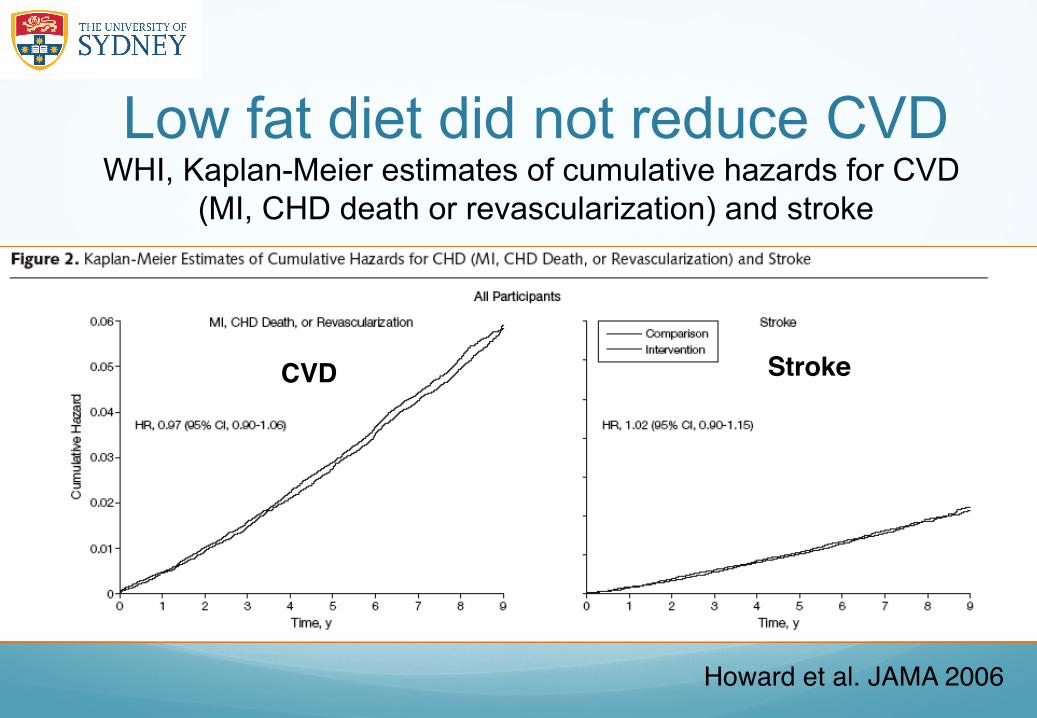
Low fat diet did not reduce CVD WHI, Kaplan-Meier estimates of cumulative hazards for CVD
(MI, CHD death or revascularization) and stroke
Howard et al. JAMA 2006"
CVD! Stroke!

Slowing CHO absorption does reduce CVD STOP-NIDDM, n =1400 with IGT, Acarbose vs placebo, 3 y
Placebo"
Acarbose"
-52%"
No change in the amount of carbohydrate
Day!
Probability of any cardiovascular event"

A Mediterranean diet reduces CVD The Lyon Heart Study for secondary prevention of CVD
AHA Step 2 low fat diet (n = 302)!
Mediterranean diet (n = 303)!
De Lorgeril et al. Circulation 1999"
(P< 0.0001)"

Mediterranean diet prevents weight re-gain
322 obese subjects, 3 diets for 2 y follow up
Shai et al. New Engl J Med 2008"

Low fat, high GI diets weight re-gain The DIOGENES study, n = 773, 26 wk follow up
Larsen et al. NEJM 2010"
Worst outcomes"
Best"

The PREVIEW Study 5year, FP7 EU-funded diabetes prevention study, n = 2500
AIM!To compare a high protein-low GI diet with a moderate protein-moderate GI diet for preventing weight re-gain and T2DM in individuals with impaired glucose metabolism"
Previewstudy.com"
Low-carbohydrate/high-protein diets are more effective at 6 months and are as effective, if not more, as low-fat diets in reducing weight and cardiovascular disease risk up to 1 year !
Hession et al. Obesity Reviews 2009"

A unifying mechanism High protein, Mediterranean,
high MUFA, low GI diets
Reduced PPG and insulinemia

Multiple strategies to lower GL Reduce the GI or reduce %energy
GL!(g)! !
Similar GL!
?!

0
0.2
0.4
0.6
0.8
1
1.2
1.4
Low-carb diets don’t reduce T2DM Nurses’ Health Study 20 years of follow-up in 85,059 women
LOW CHO DIET SCORE DECILE
Relative risk of T2DM
p = 0.26 for trend with multivariate adjustment, including BMI
Halton et al. Am J Clin Nutr 2008
Lowest CHO"
D1 D3 D5 D7 D10"

Low-carb diets don’t reduce CVD Nurses’ Health Study 20 years of follow-up in 82,000 women
LOW CHO DIET SCORE DECILES!
Relative risk of CVD
p < 0.19 for trend after multivariate adjustment
Halton et al. New Engl J Med, 2006
Lowest CHO intake"
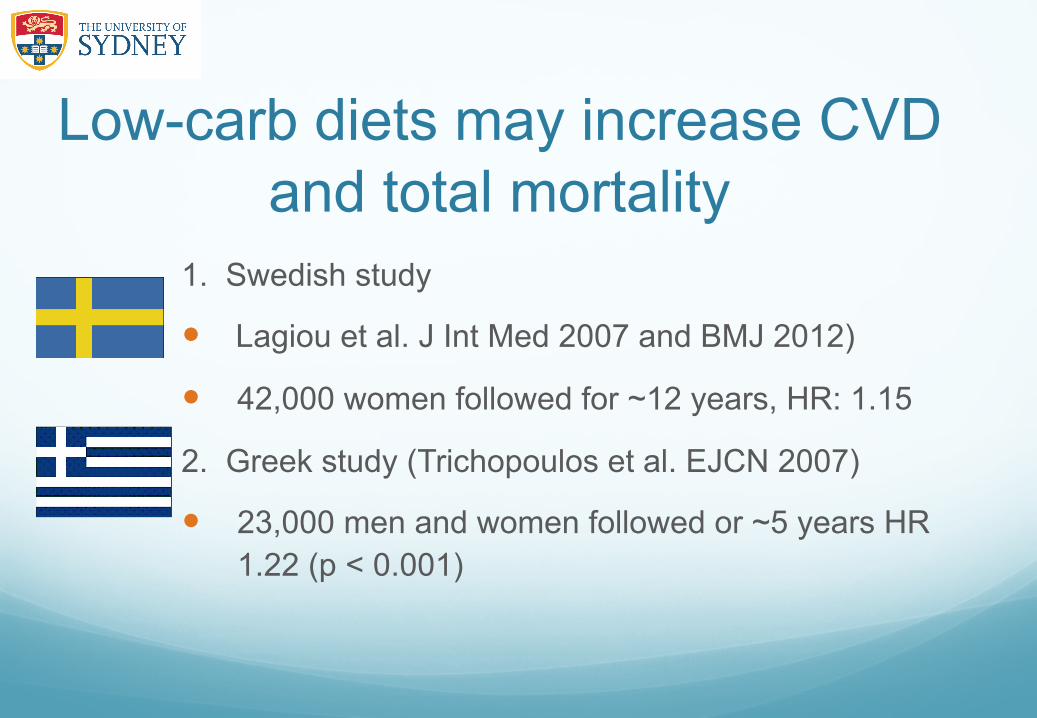
Low-carb diets may increase CVD and total mortality
1. Swedish study
� Lagiou et al. J Int Med 2007 and BMJ 2012)
� 42,000 women followed for ~12 years, HR: 1.15
2. Greek study (Trichopoulos et al. EJCN 2007)
� 23,000 men and women followed or ~5 years HR 1.22 (p < 0.001)

More red meat = more T2DM Meta-analysis of cohort studies, n = 12
Aune et al. Diabetologia 2009
Relative risk per 120 g/day
red meat "

More red meat = more GDM Prospective observational, NHS II, 10 y of follow up in 21,457 pregnancies
Bao et al. Diabetes Care 2013
P = 0.001 multivariate adjusted "
1
1.271.43
1.632.05
0
0.5
1
1.5
Q1 Q2 Q3 Q4 Q5
Quintiles of red meat intake"
Relative risk"
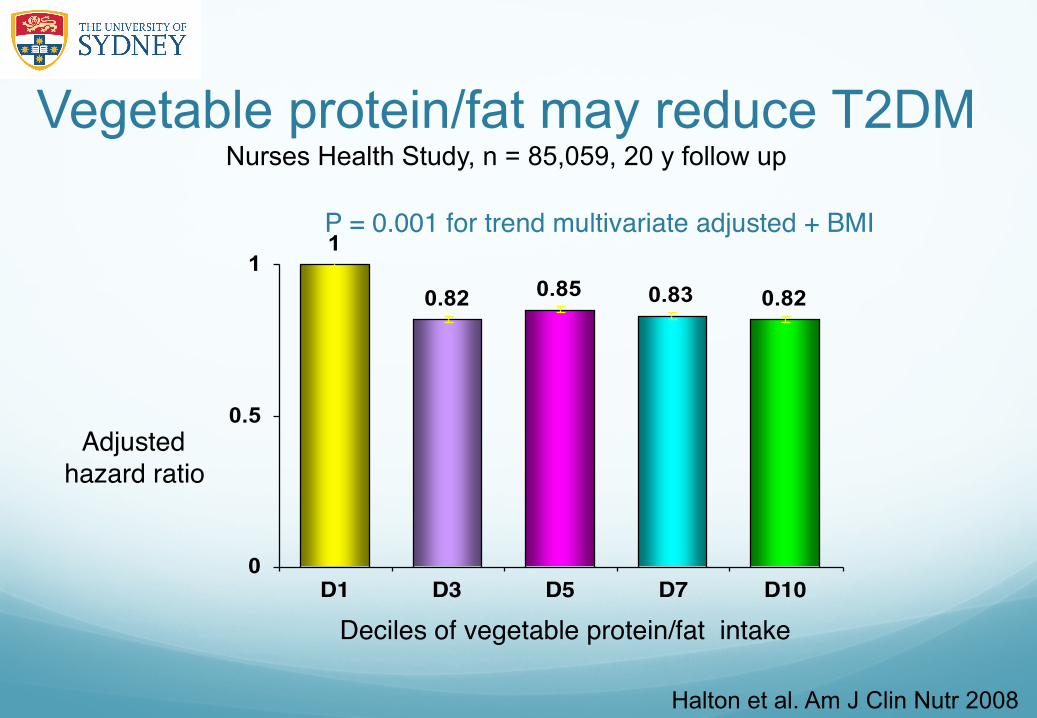
Vegetable protein/fat may reduce T2DM Nurses Health Study, n = 85,059, 20 y follow up
Halton et al. Am J Clin Nutr 2008
1
0.82 0.85 0.83 0.82
0
0.5
1
D1 D3 D5 D7 D10
Deciles of vegetable protein/fat intake"
Adjusted"hazard ratio"
P = 0.001 for trend multivariate adjusted + BMI "

Lowest HbA1c is not desirable The ARIC Study 11,092 healthy adults followed up for ~14 years
Selvin et al. NEJM 2010"
Glycated hemoglobin !
HR death from any cause!
Therefore Avoidance of CHO (= very low PPG)
is not to be recommended at the present time

Fructose reduces glycaemia we be concerned about fructose? 50% of the energy in fruit and refined sugar is fructose

High sugar diets have a lower GI Self selected diets, n = 342 with type 2 diabetes
Wolever et al. Am J Clin Nutr 1994"
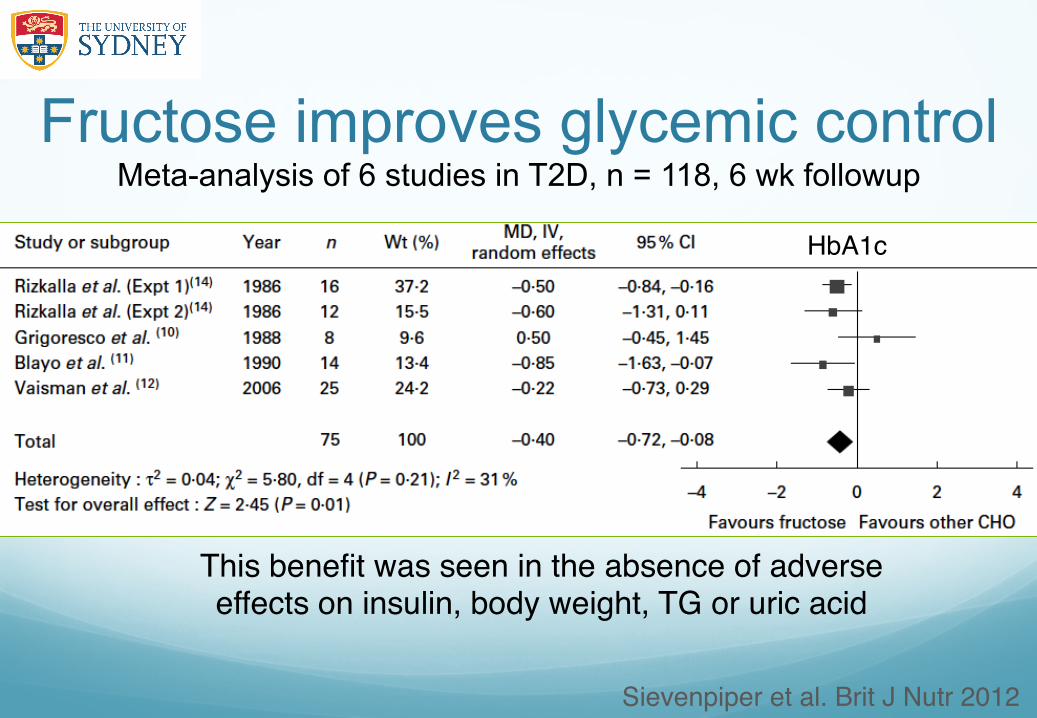
Fructose improves glycemic control Meta-analysis of 6 studies in T2D, n = 118, 6 wk followup
Sievenpiper et al. Brit J Nutr 2012"
This benefit was seen in the absence of adverse effects on insulin, body weight, TG or uric acid"
HbA1c"
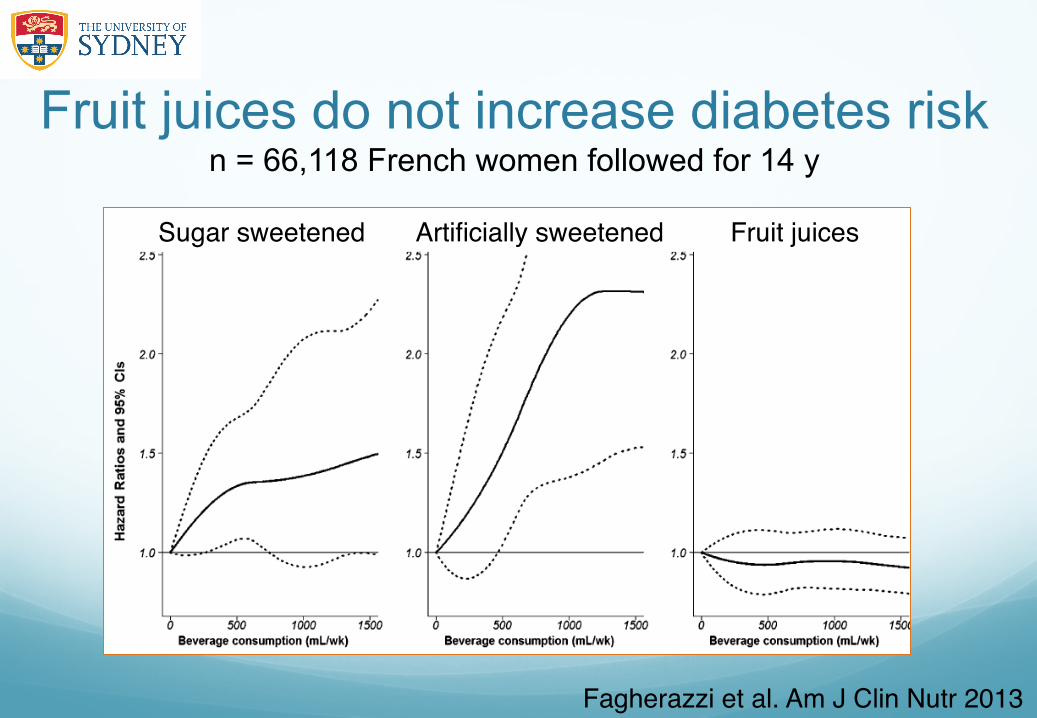
Fruit juices do not increase diabetes risk n = 66,118 French women followed for 14 y
Fagherazzi et al. Am J Clin Nutr 2013"
Sugar sweetened Artificially sweetened Fruit juices"
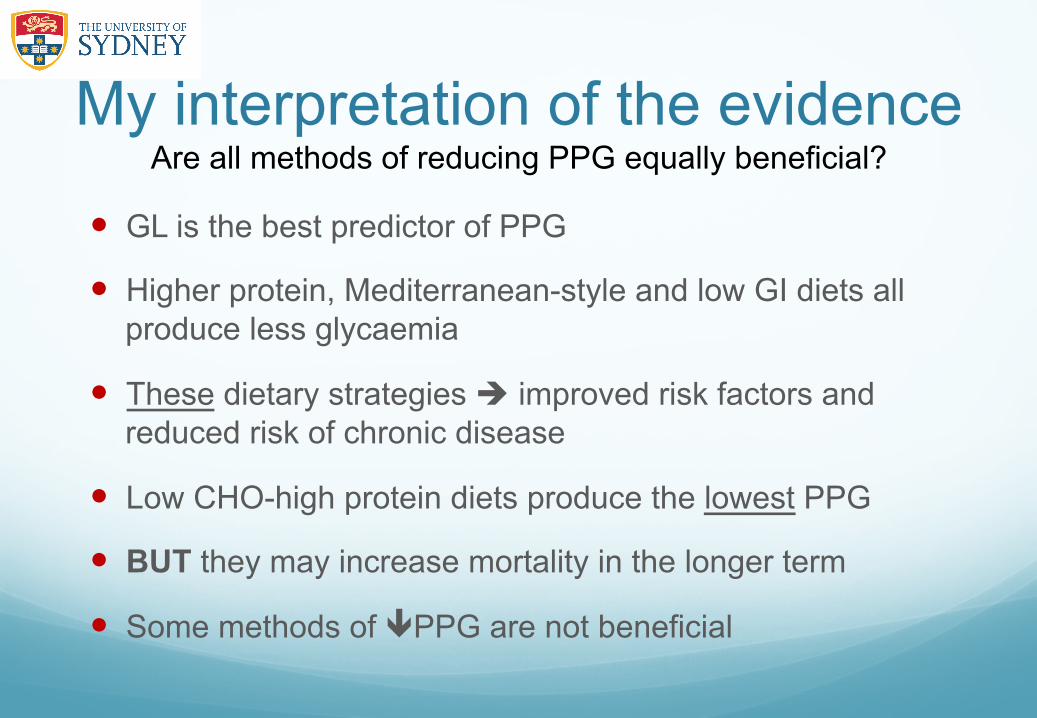
My interpretation of the evidence Are all methods of reducing PPG equally beneficial?
� GL is the best predictor of PPG
� Higher protein, Mediterranean-style and low GI diets all produce less glycaemia
� These dietary strategies improved risk factors and reduced risk of chronic disease
� Low CHO-high protein diets produce the lowest PPG
� BUT they may increase mortality in the longer term
� Some methods of PPG are not beneficial