Embed Size (px)
Citation preview
APPROVED: Miguel Acevedo, Major Professor Weihuan Zhao, Committee Member Yan Wan, Committee Member Shengli Fu, Chair of the Department of
Electrical Engineering Costas Tsatsoulis, Dean of the College of
Engineering Victor Prybutok, Dean of the Toulouse
Graduate School
ARDUINO BASED HYBRID MPPT CONTROLLER FOR WIND AND SOLAR
Michael Assaad
Thesis Prepared for the Degree of
MASTER OF SCIENCE
UNIVERSITY OF NORTH TEXAS
December 2017

Assaad, Michael. Arduino Based Hybrid MPPT Controller for Wind and Solar. Master of
Science (Electrical Engineering), December 2017, 62 pp., 12 tables, 33 figures, 39 numbered
references.
Renewable power systems are becoming more affordable and provide better options than
fossil-fuel generation, for not only the environment, but a benefit of a reduced cost of operation.
Methods to optimize charging batteries from renewable technologies is an important subject for
off-grid and micro-grids, and is becoming more relevant for larger installations. Overcharging or
undercharging the battery can result in failure and reduction of battery life. The Arduino hybrid
MPPT controller takes the advantage of solar and wind energy sources by controlling two
systems simultaneously. The ability to manage two systems with one controller is better for an
overall production of energy, cost, and manageability, at a minor expense of efficiency. The
hybrid MPPT uses two synchronous buck DC-DC converters to control both wind and solar. The
hybrid MPPT performed at a maximum of 93.6% efficiency, while the individual controller
operated at a maximum 97.1% efficiency when working on the bench test. When designing the
controller to manage power production from a larger generator, the inductor size was too large
due to the frequency provided by the Arduino. A larger inductor means less allowable current to
flow before the inductor becomes over saturated, reducing the efficiency of the controller.
Utilizing a different microcontroller like the PIC16C63A produces a much faster frequency,
which will reduce the inductor size needed and allow more current before over saturation.

ii
Copyright 2017
by
Michael Assaad

iii
ACKNOWLEDGEMENTS
I would like to begin with thanking Dr. Acevedo for allowing me to go on this journey
and guiding me when I came across many difficulties. His door was open anytime I had
questions, and he always took the time to help me find solutions. He helped thoroughly
understand the process and procedure needed to have a successful thesis. My appreciation
extends to Dr. Wan and Dr. Zhao for their willingness to serve as members on my thesis
committee.
I would like to thank faculty, staff and students, both former and present in the Electrical
Engineering Department of UNT, for everything you did, whether it was helping me with parts
and equipment or just offering an ear to talk to. To staff such as Peggy Foster, Jason Mieritz and
Nick Thompkins. As well as my colleagues Sanjaya Gurung and Samuel Iyiola. I would also like
to thank Breana Smithers who took the time to help setup the project site and helped me
understand important elements of my paper.
Most importantly to my family, my mother Elizabeth Assaad, my father Bassam Assaad
and my sister Sarah Assaad. They helped me through times when I was unsure of myself and
were always there for support. My girlfriend Catalina Celemin, who has been by my side
throughout the whole process. Lastly to my friends, Steven Davidson, Kareem Aridi, Logan
Davidson, Mark Botros, Jason Bramow, Alex Szymanowski, Omar Hariri, Michael Kandalaft,
Sebastian Ariza and Jake Lanning. Thank you for your support and encouragement.
iv
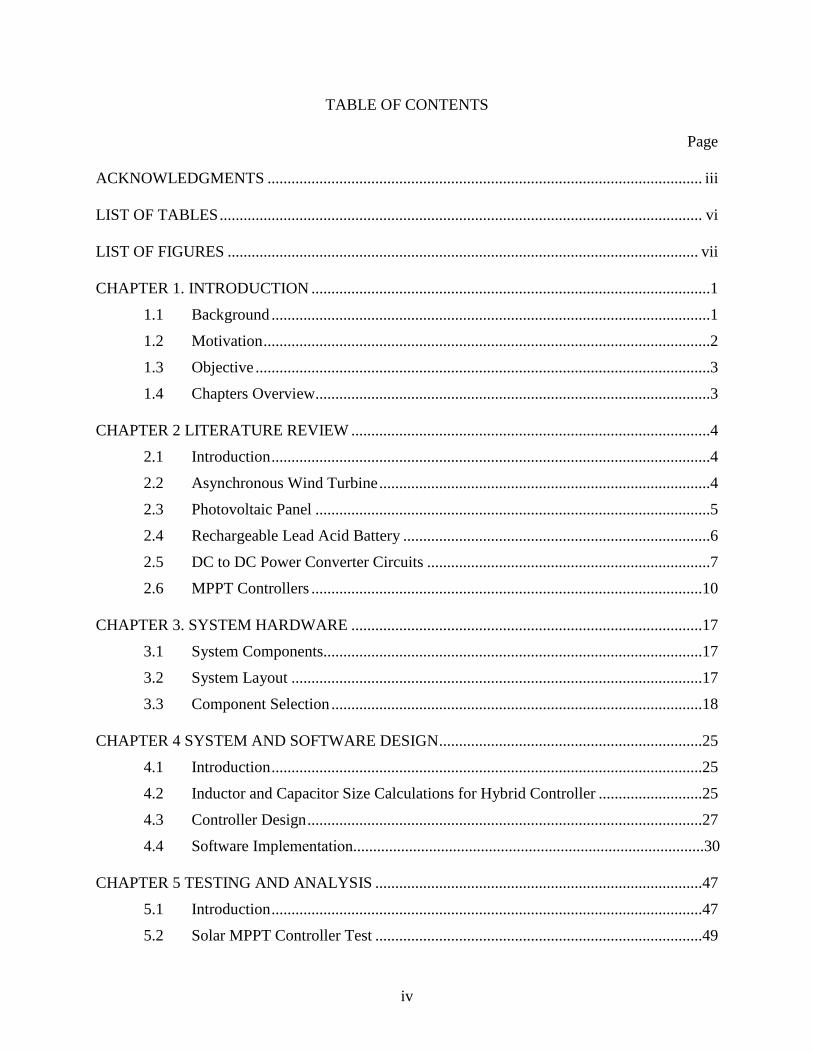
TABLE OF CONTENTS
Page
ACKNOWLEDGMENTS ............................................................................................................. iii
LIST OF TABLES ......................................................................................................................... vi
LIST OF FIGURES ...................................................................................................................... vii
CHAPTER 1. INTRODUCTION ....................................................................................................1
1.1 Background ..............................................................................................................1
1.2 Motivation ................................................................................................................2
1.3 Objective ..................................................................................................................3
1.4 Chapters Overview...................................................................................................3
CHAPTER 2 LITERATURE REVIEW ..........................................................................................4
2.1 Introduction ..............................................................................................................4
2.2 Asynchronous Wind Turbine ...................................................................................4
2.3 Photovoltaic Panel ...................................................................................................5
2.4 Rechargeable Lead Acid Battery .............................................................................6
2.5 DC to DC Power Converter Circuits .......................................................................7
2.6 MPPT Controllers ..................................................................................................10
CHAPTER 3. SYSTEM HARDWARE ........................................................................................17
3.1 System Components...............................................................................................17
3.2 System Layout .......................................................................................................17
3.3 Component Selection .............................................................................................18
CHAPTER 4 SYSTEM AND SOFTWARE DESIGN ..................................................................25
4.1 Introduction ............................................................................................................25
4.2 Inductor and Capacitor Size Calculations for Hybrid Controller ..........................25
4.3 Controller Design ...................................................................................................27
4.4 Software Implementation........................................................................................30
CHAPTER 5 TESTING AND ANALYSIS ..................................................................................47
5.1 Introduction ............................................................................................................47
5.2 Solar MPPT Controller Test ..................................................................................49
v
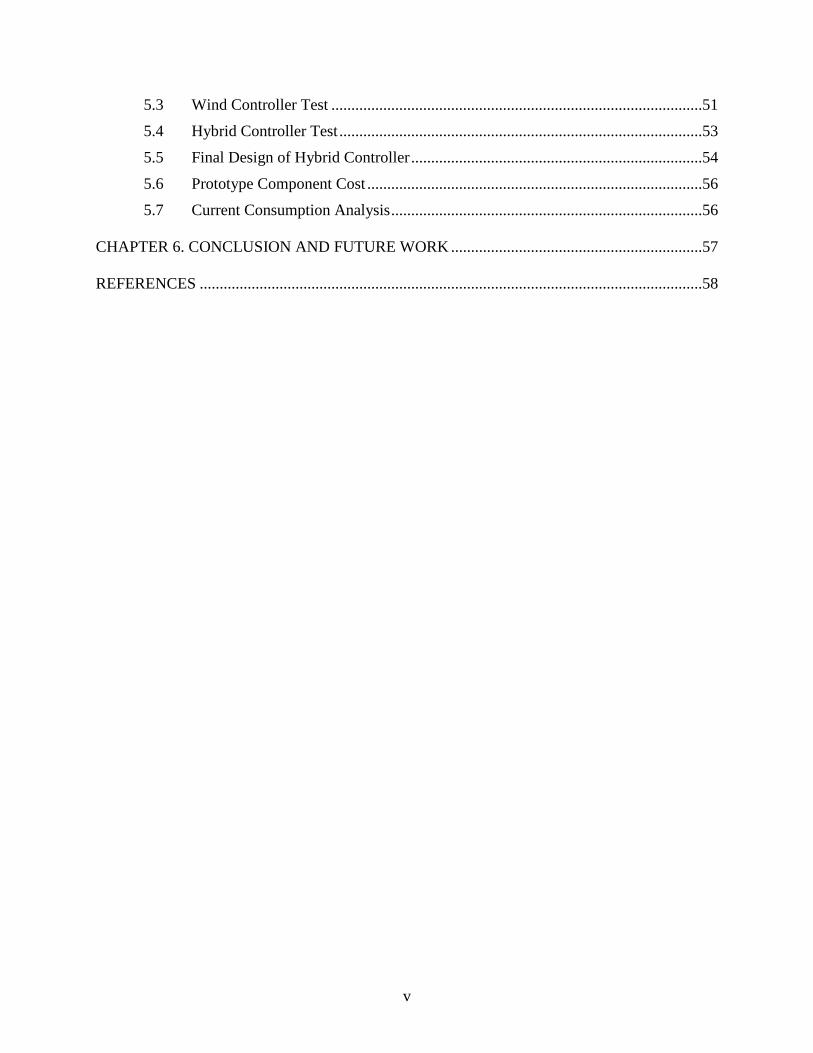
5.3 Wind Controller Test .............................................................................................51
5.4 Hybrid Controller Test ...........................................................................................53
5.5 Final Design of Hybrid Controller .........................................................................54
5.6 Prototype Component Cost ....................................................................................56
5.7 Current Consumption Analysis ..............................................................................56 CHAPTER 6. CONCLUSION AND FUTURE WORK ...............................................................57 REFERENCES ..............................................................................................................................58
vi
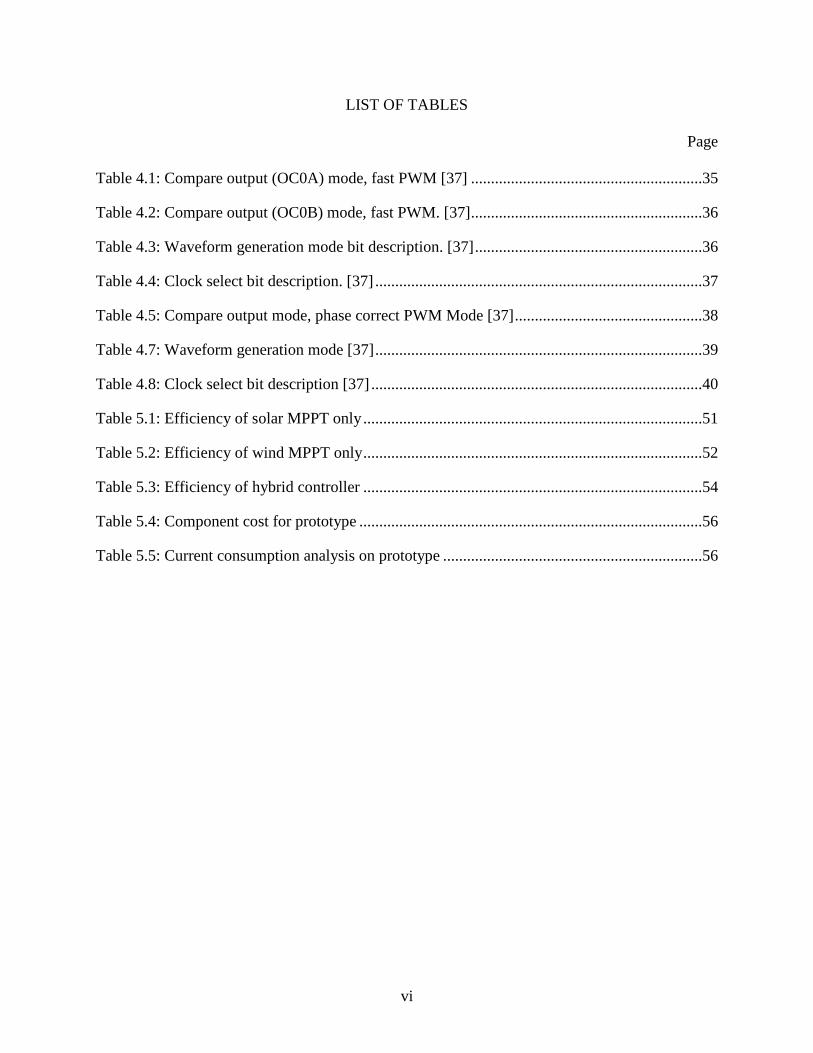
LIST OF TABLES
Page
Table 4.1: Compare output (OC0A) mode, fast PWM [37] ..........................................................35
Table 4.2: Compare output (OC0B) mode, fast PWM. [37] ..........................................................36
Table 4.3: Waveform generation mode bit description. [37] .........................................................36
Table 4.4: Clock select bit description. [37] ..................................................................................37
Table 4.5: Compare output mode, phase correct PWM Mode [37] ...............................................38
Table 4.7: Waveform generation mode [37] ..................................................................................39
Table 4.8: Clock select bit description [37] ...................................................................................40
Table 5.1: Efficiency of solar MPPT only .....................................................................................51
Table 5.2: Efficiency of wind MPPT only .....................................................................................52
Table 5.3: Efficiency of hybrid controller .....................................................................................54
Table 5.4: Component cost for prototype ......................................................................................56
Table 5.5: Current consumption analysis on prototype .................................................................56
vii
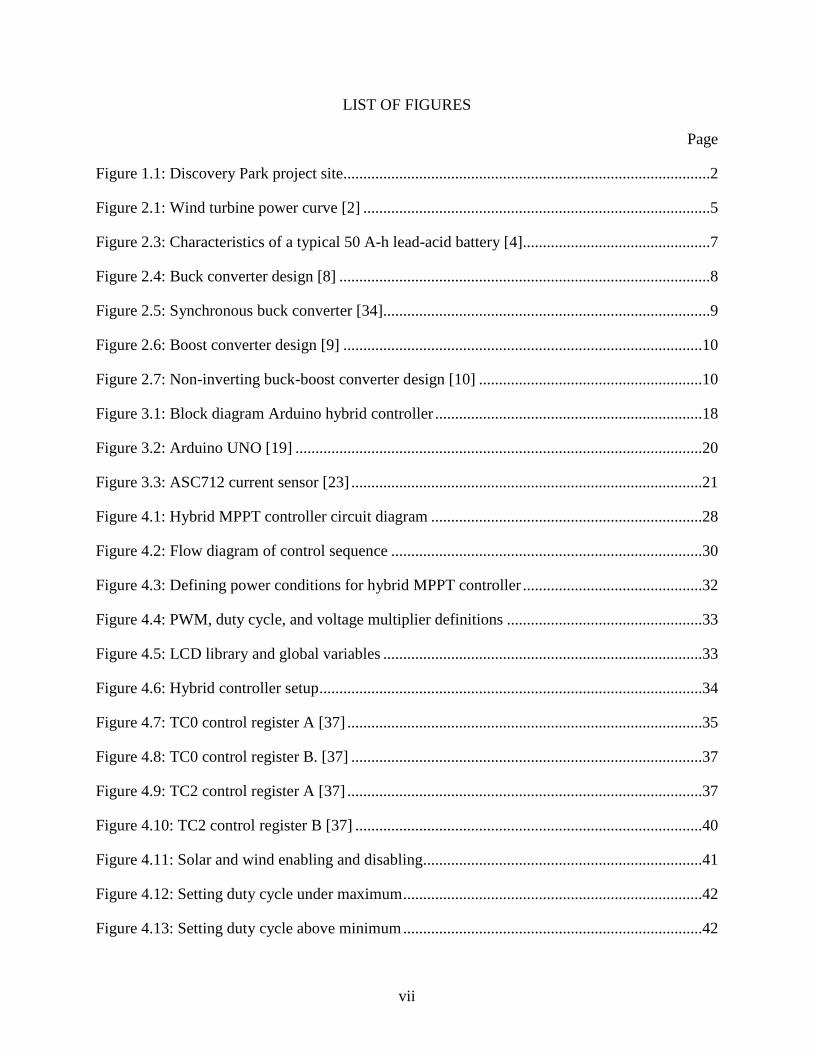
LIST OF FIGURES
Page
Figure 1.1: Discovery Park project site............................................................................................2
Figure 2.1: Wind turbine power curve [2] .......................................................................................5
Figure 2.3: Characteristics of a typical 50 A-h lead-acid battery [4] ...............................................7
Figure 2.4: Buck converter design [8] .............................................................................................8
Figure 2.5: Synchronous buck converter [34]..................................................................................9
Figure 2.6: Boost converter design [9] ..........................................................................................10
Figure 2.7: Non-inverting buck-boost converter design [10] ........................................................10
Figure 3.1: Block diagram Arduino hybrid controller ...................................................................18
Figure 3.2: Arduino UNO [19] ......................................................................................................20
Figure 3.3: ASC712 current sensor [23] ........................................................................................21
Figure 4.1: Hybrid MPPT controller circuit diagram ....................................................................28
Figure 4.2: Flow diagram of control sequence ..............................................................................30
Figure 4.3: Defining power conditions for hybrid MPPT controller .............................................32
Figure 4.4: PWM, duty cycle, and voltage multiplier definitions .................................................33
Figure 4.5: LCD library and global variables ................................................................................33
Figure 4.6: Hybrid controller setup ................................................................................................34
Figure 4.7: TC0 control register A [37] .........................................................................................35
Figure 4.8: TC0 control register B. [37] ........................................................................................37
Figure 4.9: TC2 control register A [37] .........................................................................................37
Figure 4.10: TC2 control register B [37] .......................................................................................40
Figure 4.11: Solar and wind enabling and disabling ......................................................................41
Figure 4.12: Setting duty cycle under maximum ...........................................................................42
Figure 4.13: Setting duty cycle above minimum ...........................................................................42
viii
Figure 4.14: Measuring and displaying measured values ..............................................................44
Figure 4.15: Solar DC-DC converter update .................................................................................46
Figure 4.16: Wind DC-DC converter update .................................................................................46
Figure 5.1: Changed limits for controller ......................................................................................48
Figure 5.2: Testing Setup ...............................................................................................................49
Figure 5.3: LCD display ................................................................................................................49
Figure 5.4: Solar MPPT only waveforms ......................................................................................50
Figure 5.5: Wind MPPT only waveforms ......................................................................................52
Figure 5.6: Hybrid MPPT controller waveforms ...........................................................................53
Figure 5.7: Final design concept ....................................................................................................55
1
CHAPTER 1
INTRODUCTION
1.1 Background
Renewable energy technology has seen a large demand because of an increasing
awareness of harmful pollutants and greenhouse gases that are associated with the production
and burning of fossil fuels for electricity generation. The increased demand had a complementary
effect to the cost of renewables, making them more accessible. Solar Photovoltaic (PV) systems
are projected to reduce in cost by 65% from the year 2015 to 2025 [1].
Electric power production by renewable technology is growing, while overall efficiency
is increasing for established systems such as wind turbines and solar panels. Other more
established forms of renewable power, such as geothermal, and hydroelectric, are becoming
more prevalent in the overall reduction of dependency on fossil fuels.
Controllers such as Pulse Width Modulation (PWM) and Max Power Point Tracking
(MPPT) help manage the energy produced from small-scale renewable systems, such as used off-
grid and microgrids, to usable power. These controller types help monitor and regulate the
amount of power being delivered to battery storage. The PWM is the less efficient of the two;
PWM works by stepping down the voltage to match the voltage of the battery, allowing the
current to flow until charged. The MPPT works by tracking the voltage and current; when the
voltage is stepped down, the current is increased by using a voltage converter of Direct-Current
(DC). This unit is typically called a DC-DC converter. Its role in this case is to match the power
production of the source to the load [4].
2
1.2 Motivation
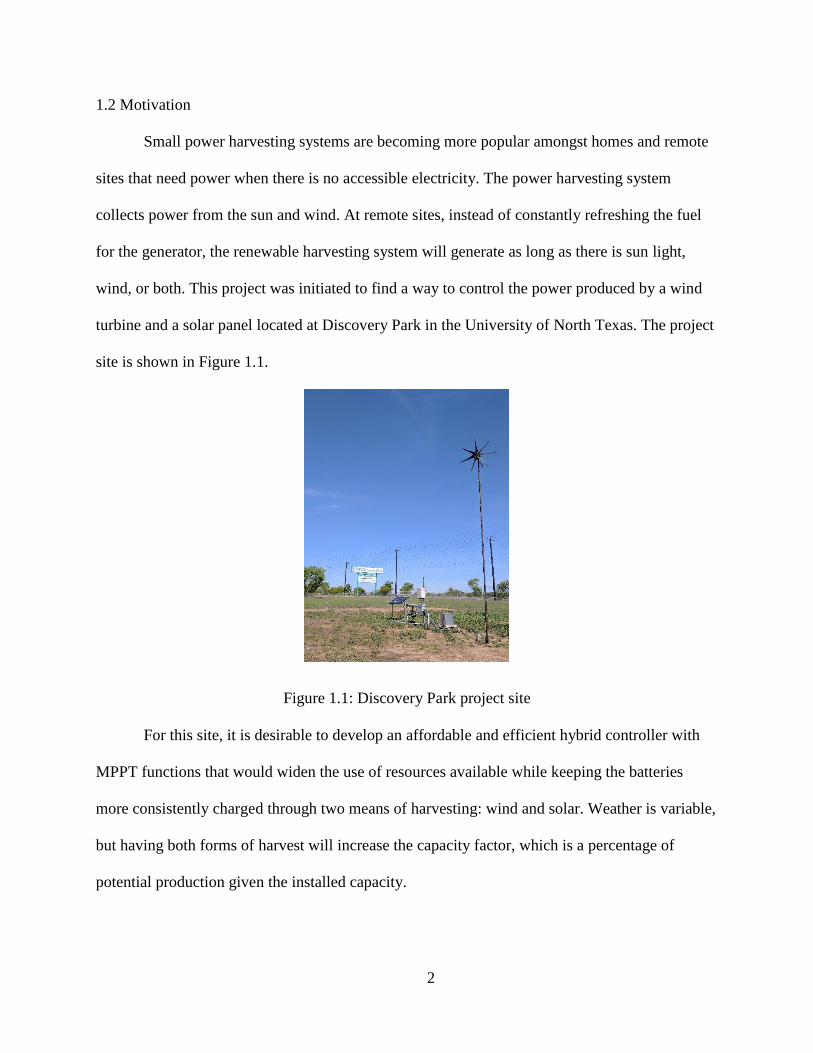
Small power harvesting systems are becoming more popular amongst homes and remote
sites that need power when there is no accessible electricity. The power harvesting system
collects power from the sun and wind. At remote sites, instead of constantly refreshing the fuel
for the generator, the renewable harvesting system will generate as long as there is sun light,
wind, or both. This project was initiated to find a way to control the power produced by a wind
turbine and a solar panel located at Discovery Park in the University of North Texas. The project
site is shown in Figure 1.1.
Figure 1.1: Discovery Park project site
For this site, it is desirable to develop an affordable and efficient hybrid controller with
MPPT functions that would widen the use of resources available while keeping the batteries
more consistently charged through two means of harvesting: wind and solar. Weather is variable,
but having both forms of harvest will increase the capacity factor, which is a percentage of
potential production given the installed capacity.

3
1.3 Objective
The goals of this thesis include:
Study current forms of different control methods for solar PV panels and wind turbines
individually.
Design a hybrid MPPT controller to keep a steady output while monitoring the output
current.
Test the design for functionality and efficiency.
1.4 Chapters Overview
Chapter 2 provides a survey of different control methods and current charge controllers
and their process of achieving maximum power point tracking.
Chapter 3 goes in depth in the important concept of MPPT controller for both wind and
solar by describing the various system components.
Chapter 4 is comprised of the system design and the Arduino programming software that
drives the hybrid MPPT controller.
Chapter 5 presents the implementation and the results from a bench-scale testing of the
MPPT system of wind and solar, both independently and jointly.
Chapter 6 discusses the conclusion, future possibilities and suggestions to improve the
design of a hybrid controller.
4
CHAPTER 2
LITERATURE REVIEW
2.1 Introduction
Methods to optimize charging batteries from renewable technologies is an important
subject for off-grid and micro-grids and is becoming more relevant for larger installations.
Batteries must be charged correctly. Overcharging or undercharging the battery can result in
failure and reduction of battery life. Having an adequate charge is vital to the life and use of the
battery. The same applies to allowable discharge; batteries cannot exceed allowable depth of
discharge over many cycles.
Charge controllers only work as well as the resources harvested. Adequate design of the
charge controller depends on the systems harvesting the resources. Locations with ample sun
exposure will suffice for a photovoltaic (PV) system. Wind, however, can be more particular in
how to harvest due to the change of wind speed at any given moment. The ability of harvesting
both solar and wind with only one controller will help simplify installation, cut cost and have
increased energy production.
Understanding the charging techniques for both solar and wind technologies individually
will help develop a controller that combines both.
2.2 Asynchronous Wind Turbine
Asynchronous generators driven by wind turbines use induction generators while
synchronous generators are fixed-speed generators that spin at a precise rotational speed.
Induction generators rely on a rotating magnetic field that is created in the armature windings.
The constant building and collapsing of magnetic fields creates alternating current (AC) output.
5
In order to send the output to the batteries, the current must be converted into direct current
(DC). This is done by passing the AC through a diode bridge rectifier that then converts into DC
[3].
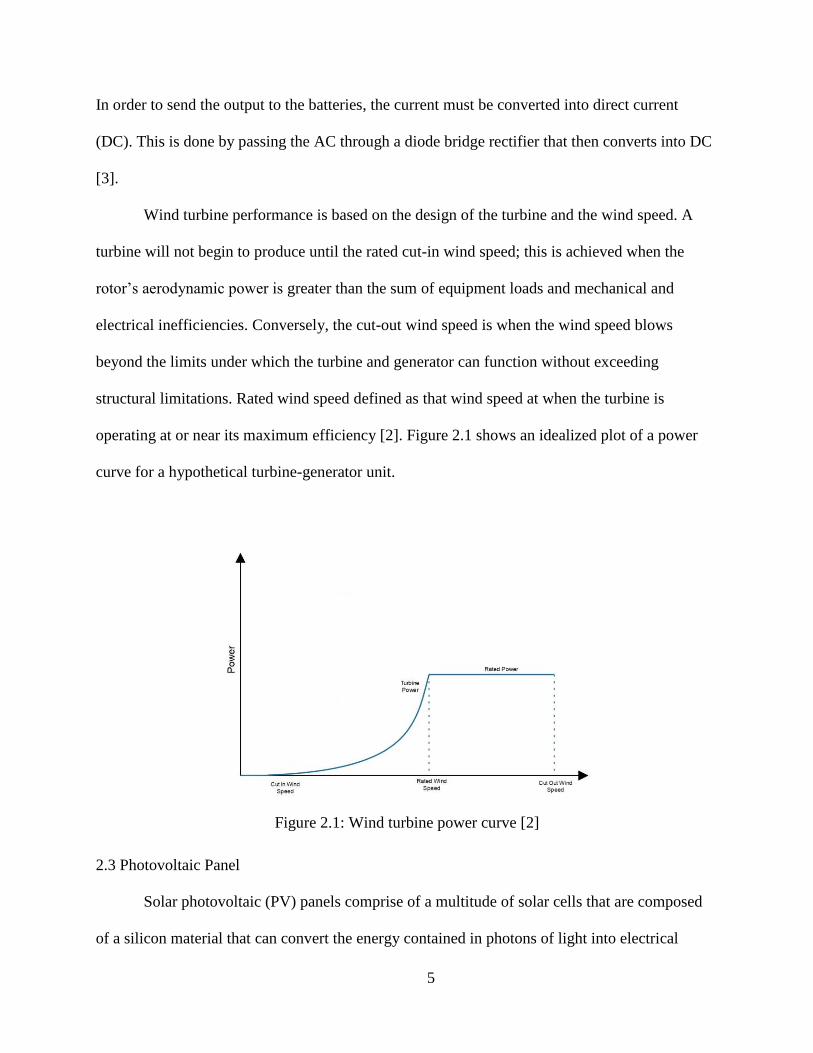
Wind turbine performance is based on the design of the turbine and the wind speed. A
turbine will not begin to produce until the rated cut-in wind speed; this is achieved when the
rotor’s aerodynamic power is greater than the sum of equipment loads and mechanical and
electrical inefficiencies. Conversely, the cut-out wind speed is when the wind speed blows
beyond the limits under which the turbine and generator can function without exceeding
structural limitations. Rated wind speed defined as that wind speed at when the turbine is
operating at or near its maximum efficiency [2]. Figure 2.1 shows an idealized plot of a power
curve for a hypothetical turbine-generator unit.
Figure 2.1: Wind turbine power curve [2]
2.3 Photovoltaic Panel
Solar photovoltaic (PV) panels comprise of a multitude of solar cells that are composed
of a silicon material that can convert the energy contained in photons of light into electrical
6
voltage and current. A photon with a short enough wavelength and high enough energy can cause
an electron in a photovoltaic material to break free from the atom. Having an electric field
nearby, the electrons will be swept toward the metallic contact where it transforms into electric
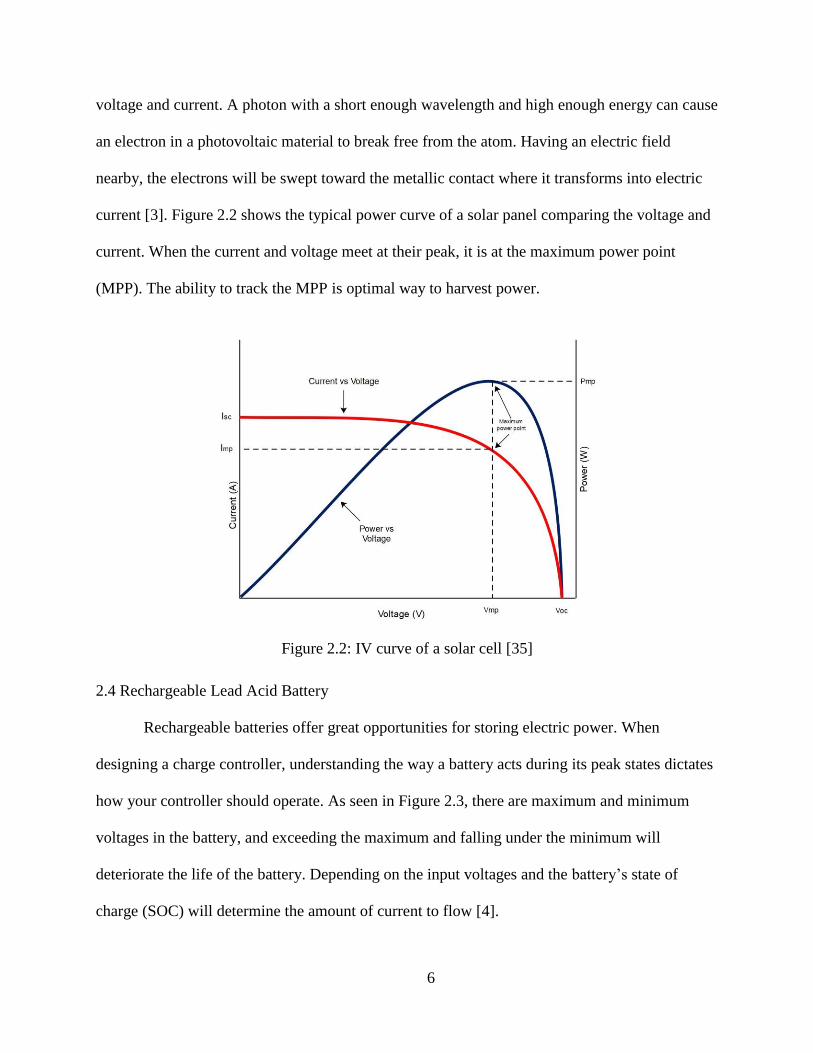
current [3]. Figure 2.2 shows the typical power curve of a solar panel comparing the voltage and
current. When the current and voltage meet at their peak, it is at the maximum power point
(MPP). The ability to track the MPP is optimal way to harvest power.
Figure 2.2: IV curve of a solar cell [35]
2.4 Rechargeable Lead Acid Battery
Rechargeable batteries offer great opportunities for storing electric power. When
designing a charge controller, understanding the way a battery acts during its peak states dictates
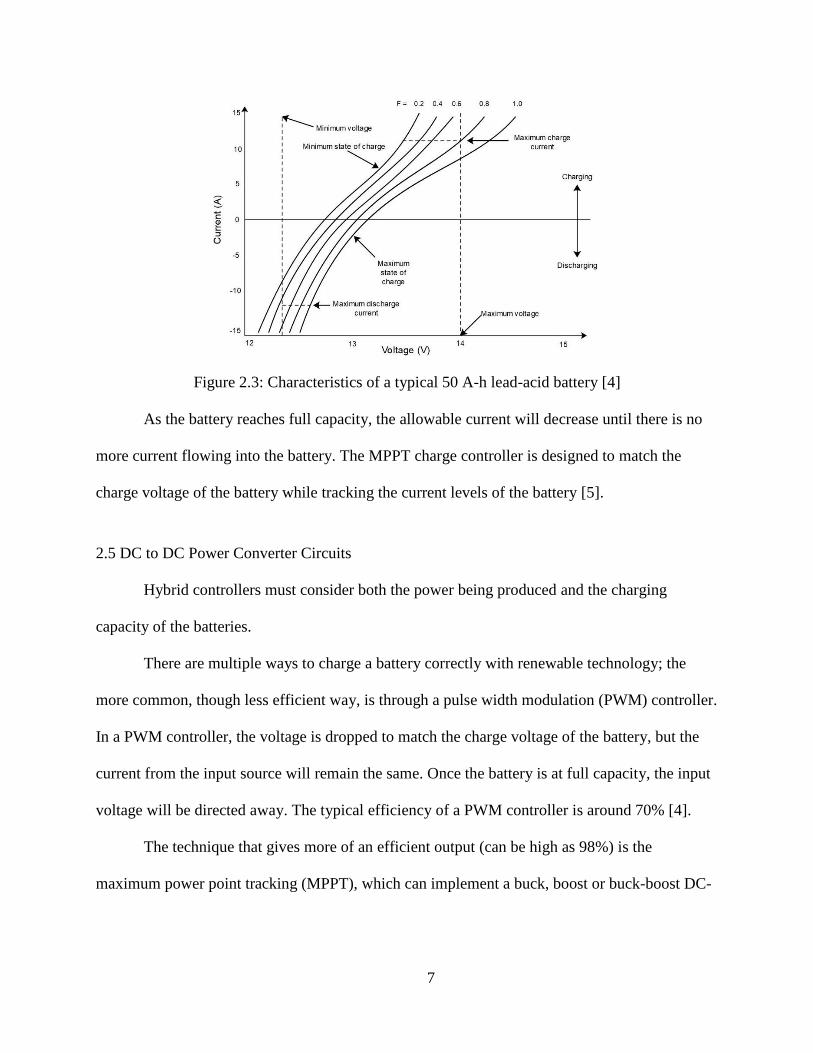
how your controller should operate. As seen in Figure 2.3, there are maximum and minimum
voltages in the battery, and exceeding the maximum and falling under the minimum will
deteriorate the life of the battery. Depending on the input voltages and the battery’s state of
charge (SOC) will determine the amount of current to flow [4].
7
Figure 2.3: Characteristics of a typical 50 A-h lead-acid battery [4]
As the battery reaches full capacity, the allowable current will decrease until there is no
more current flowing into the battery. The MPPT charge controller is designed to match the
charge voltage of the battery while tracking the current levels of the battery [5].
2.5 DC to DC Power Converter Circuits
Hybrid controllers must consider both the power being produced and the charging
capacity of the batteries.
There are multiple ways to charge a battery correctly with renewable technology; the
more common, though less efficient way, is through a pulse width modulation (PWM) controller.
In a PWM controller, the voltage is dropped to match the charge voltage of the battery, but the
current from the input source will remain the same. Once the battery is at full capacity, the input
voltage will be directed away. The typical efficiency of a PWM controller is around 70% [4].
The technique that gives more of an efficient output (can be high as 98%) is the
maximum power point tracking (MPPT), which can implement a buck, boost or buck-boost DC-
8
DC converter to effectively match the charge voltage and peak current. These topologies are
implemented depending on the supply voltage and needed output voltage.
2.5.1 Non-Synchronous Buck Topology
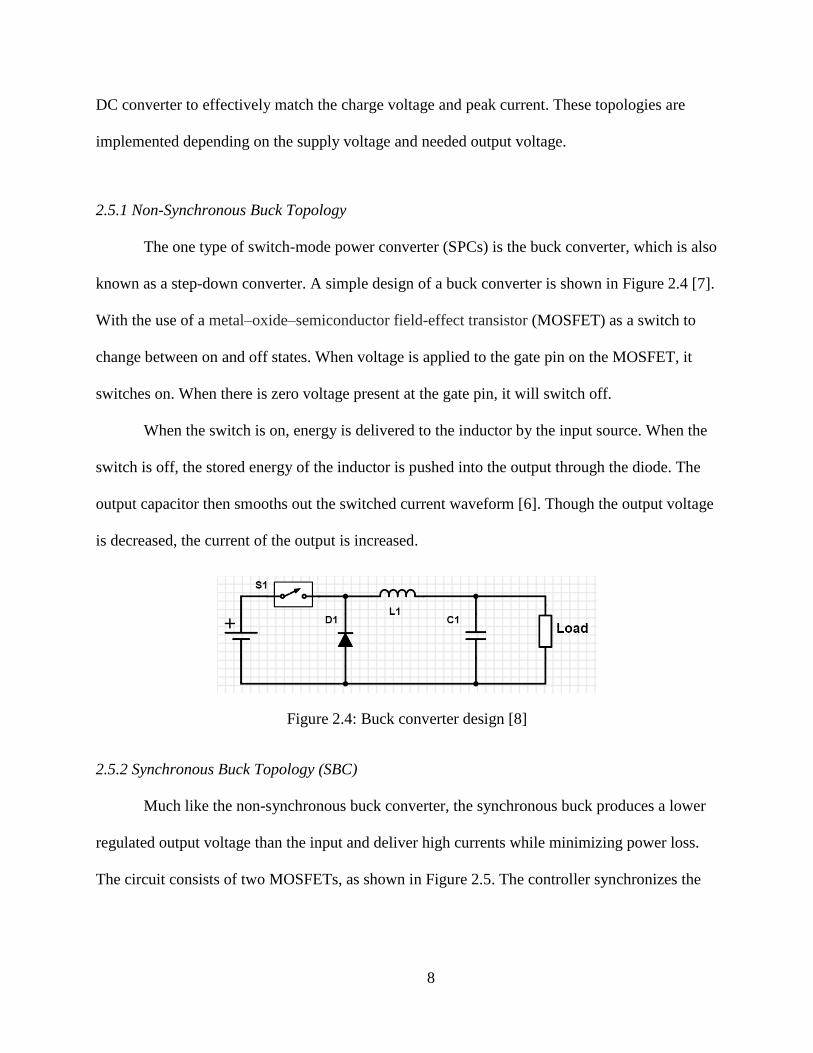
The one type of switch-mode power converter (SPCs) is the buck converter, which is also
known as a step-down converter. A simple design of a buck converter is shown in Figure 2.4 [7].
With the use of a metal–oxide–semiconductor field-effect transistor (MOSFET) as a switch to
change between on and off states. When voltage is applied to the gate pin on the MOSFET, it
switches on. When there is zero voltage present at the gate pin, it will switch off.
When the switch is on, energy is delivered to the inductor by the input source. When the
switch is off, the stored energy of the inductor is pushed into the output through the diode. The
output capacitor then smooths out the switched current waveform [6]. Though the output voltage
is decreased, the current of the output is increased.
Figure 2.4: Buck converter design [8]
2.5.2 Synchronous Buck Topology (SBC)
Much like the non-synchronous buck converter, the synchronous buck produces a lower
regulated output voltage than the input and deliver high currents while minimizing power loss.
The circuit consists of two MOSFETs, as shown in Figure 2.5. The controller synchronizes the
9
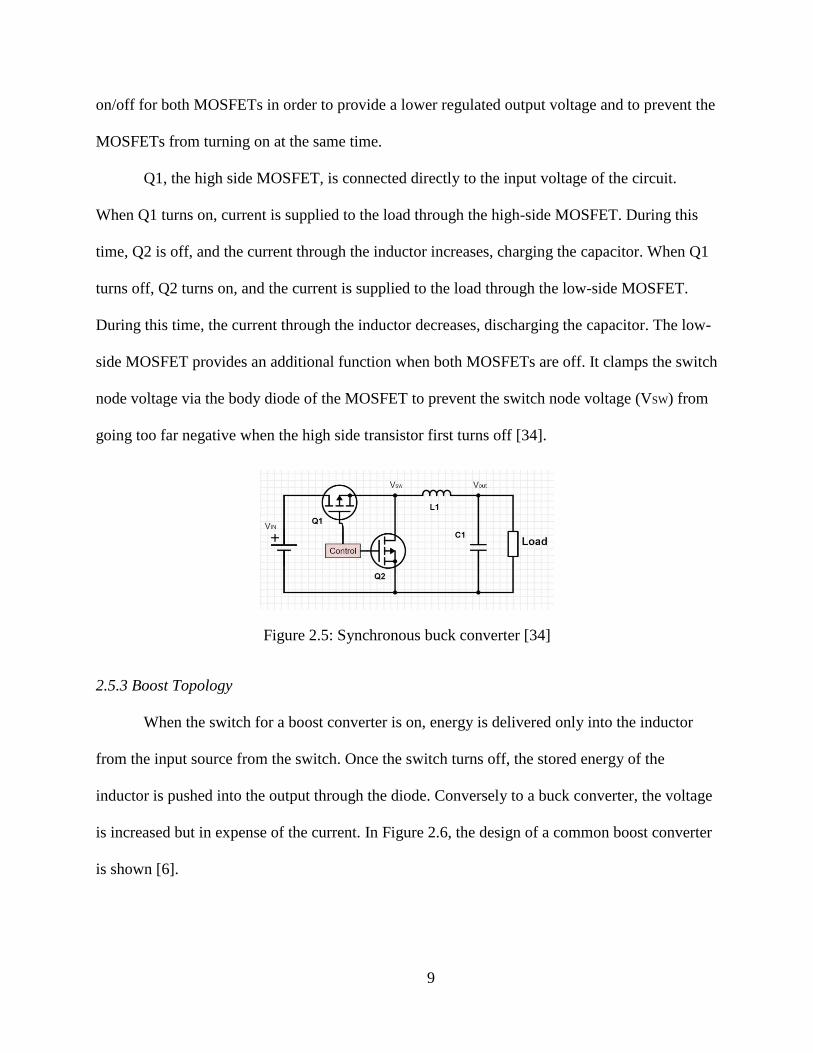
on/off for both MOSFETs in order to provide a lower regulated output voltage and to prevent the
MOSFETs from turning on at the same time.
Q1, the high side MOSFET, is connected directly to the input voltage of the circuit.
When Q1 turns on, current is supplied to the load through the high-side MOSFET. During this
time, Q2 is off, and the current through the inductor increases, charging the capacitor. When Q1
turns off, Q2 turns on, and the current is supplied to the load through the low-side MOSFET.
During this time, the current through the inductor decreases, discharging the capacitor. The low-
side MOSFET provides an additional function when both MOSFETs are off. It clamps the switch
node voltage via the body diode of the MOSFET to prevent the switch node voltage (VSW) from
going too far negative when the high side transistor first turns off [34].
Figure 2.5: Synchronous buck converter [34]
2.5.3 Boost Topology
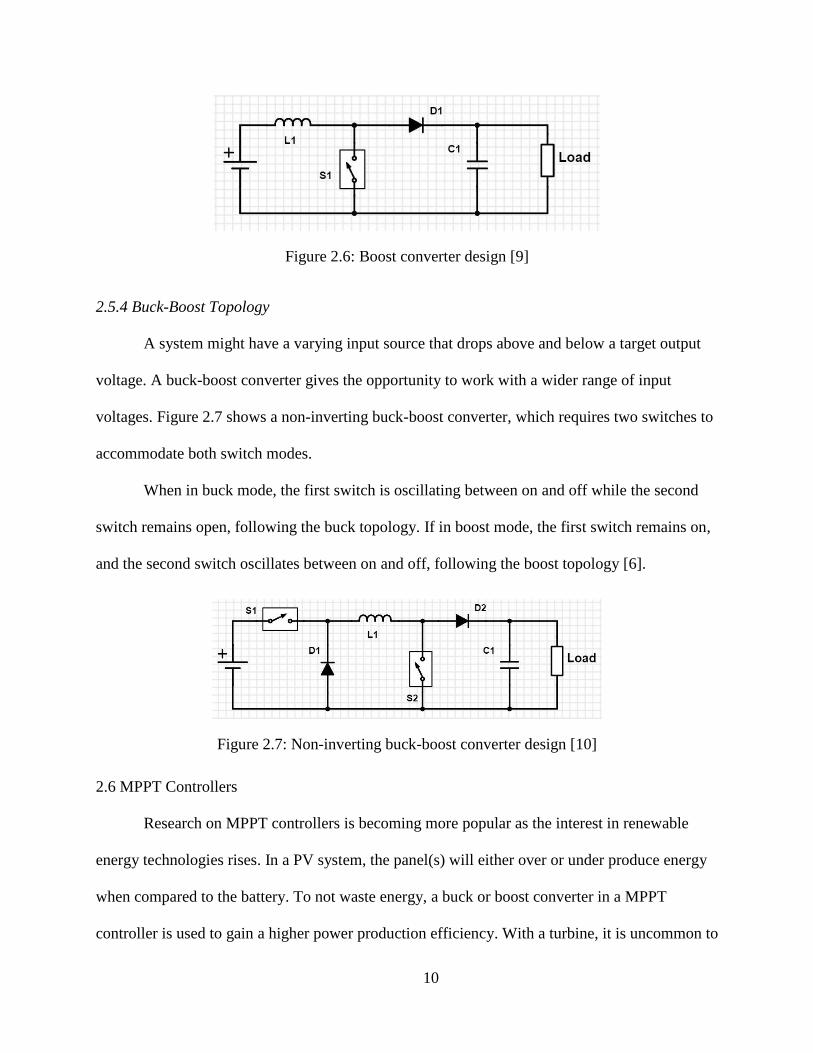
When the switch for a boost converter is on, energy is delivered only into the inductor
from the input source from the switch. Once the switch turns off, the stored energy of the
inductor is pushed into the output through the diode. Conversely to a buck converter, the voltage
is increased but in expense of the current. In Figure 2.6, the design of a common boost converter
is shown [6].
10
Figure 2.6: Boost converter design [9]
2.5.4 Buck-Boost Topology
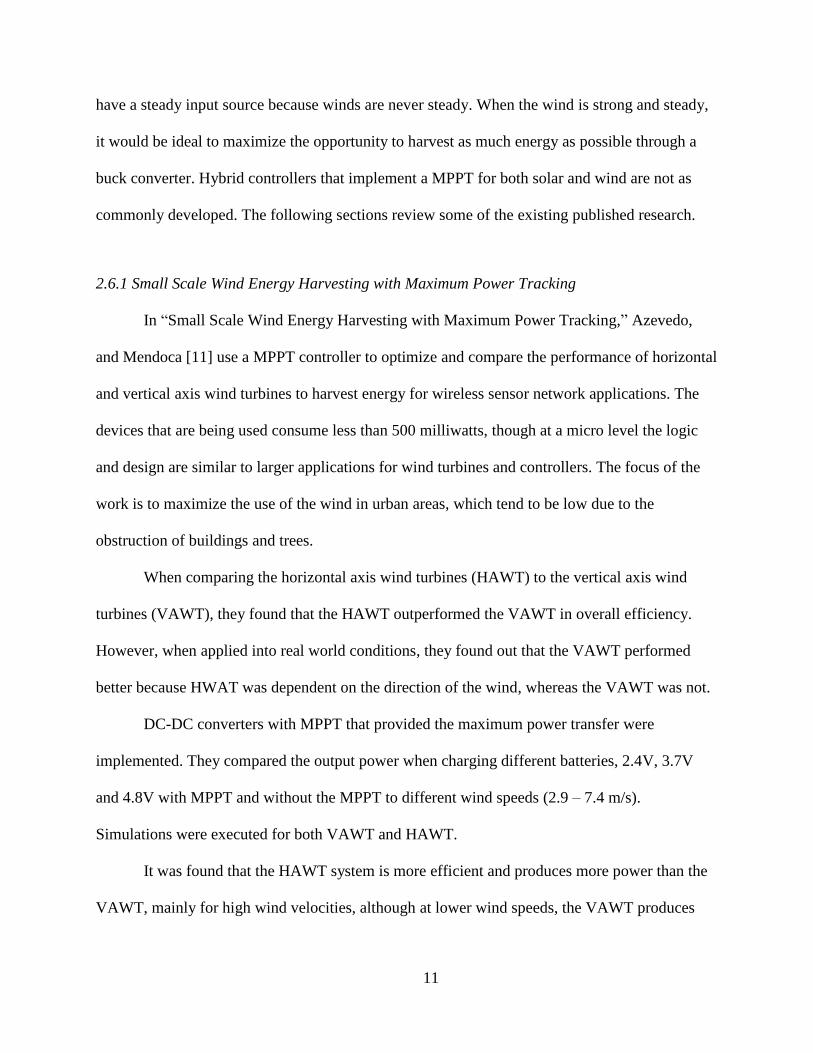
A system might have a varying input source that drops above and below a target output
voltage. A buck-boost converter gives the opportunity to work with a wider range of input
voltages. Figure 2.7 shows a non-inverting buck-boost converter, which requires two switches to
accommodate both switch modes.
When in buck mode, the first switch is oscillating between on and off while the second
switch remains open, following the buck topology. If in boost mode, the first switch remains on,
and the second switch oscillates between on and off, following the boost topology [6].
Figure 2.7: Non-inverting buck-boost converter design [10]
2.6 MPPT Controllers
Research on MPPT controllers is becoming more popular as the interest in renewable
energy technologies rises. In a PV system, the panel(s) will either over or under produce energy
when compared to the battery. To not waste energy, a buck or boost converter in a MPPT
controller is used to gain a higher power production efficiency. With a turbine, it is uncommon to
11
have a steady input source because winds are never steady. When the wind is strong and steady,
it would be ideal to maximize the opportunity to harvest as much energy as possible through a
buck converter. Hybrid controllers that implement a MPPT for both solar and wind are not as
commonly developed. The following sections review some of the existing published research.
2.6.1 Small Scale Wind Energy Harvesting with Maximum Power Tracking
In “Small Scale Wind Energy Harvesting with Maximum Power Tracking,” Azevedo,
and Mendoca [11] use a MPPT controller to optimize and compare the performance of horizontal
and vertical axis wind turbines to harvest energy for wireless sensor network applications. The
devices that are being used consume less than 500 milliwatts, though at a micro level the logic
and design are similar to larger applications for wind turbines and controllers. The focus of the
work is to maximize the use of the wind in urban areas, which tend to be low due to the
obstruction of buildings and trees.
When comparing the horizontal axis wind turbines (HAWT) to the vertical axis wind
turbines (VAWT), they found that the HAWT outperformed the VAWT in overall efficiency.
However, when applied into real world conditions, they found out that the VAWT performed
better because HWAT was dependent on the direction of the wind, whereas the VAWT was not.
DC-DC converters with MPPT that provided the maximum power transfer were
implemented. They compared the output power when charging different batteries, 2.4V, 3.7V
and 4.8V with MPPT and without the MPPT to different wind speeds (2.9 – 7.4 m/s).
Simulations were executed for both VAWT and HAWT.
It was found that the HAWT system is more efficient and produces more power than the
VAWT, mainly for high wind velocities, although at lower wind speeds, the VAWT produces
12
more power than the HAWT. In each test between MPPT and non-MPPT, the MPPT produces
steady power at every wind speed for both HAWT and VAWT.
2.6.2 DC-DC Buck Converter for MPPT of PV System
As more research goes to improve the efficiency of solar PV panels, the ability to make
use of the power produced becomes more important. The method proposed to control the output
of PV panel in the “DC-DC Buck Converter for MPPT of PV System” [12] article, uses a DC-
DC buck converter to step down the voltage produced by a PV system. The MPPT is used to
extract the maximum power from the PV panel and transfer the power to the load.
Choudhary, and Sexana [12] explore the different MPPT algorithms such as fractional
open circuit voltage, fractional short circuit current, perturb and observe (P&O), incremental
conductance and artificial-intelligence-based algorithms. For their research, they are exploring
the tracking capability of incremental conductance with buck converter conductance at different
insolation levels. This tracking algorithm compares the instantaneous conductance of the PV
generator with its incremental conductance and decides to increase or decrease the control
parameter.
The results from their research found that the basic function of the DC-DC converter
working with a PV system is an intermediate power processor. It can change the current and
voltage levels such that the maximum power can be extracted from the PV array. Altering the
voltage and current level is just converting a given fixed load to a variable load. They found that
the incremental conductance MPPT algorithm responds quickly and accurately.
13
2.6.3 Control of Wind Energy by Using Buck-Boost Converter
The “Control of Wind Energy by Using Buck-Boost Converter” [13] article explores the
theoretical side implementing a non-inverting buck-boost converter to control the output from a
wind turbine. The design proposed by Mittal and Arora [13] is a permanent magnet synchronous
generator (PMSG) that generates alternating current. A model of PMSG based wind turbine is
followed by power electronic circuits, such as rectifier, chopper, and inverters and then feeds to
3-phase load. The input source power is controlled with the buck-boost converter connected
across the DC link to keep constant voltage supply at output side.
The PSMG was used to provide the variable voltage and frequency; the output of the
PMSG is fed to the buck-boost converter for improvement in its performance, in terms of
smoothing or constant output. The buck-boost converter was modeled in MATLAB/ Simulink.
MATLAB/Simulink is software that is used to simulate circuit design and test environments. The
buck-boost converter simulated in Simulink uses PWM to control 3 phase balanced output
voltage and frequency with a fixed DC output.
In their research they found that DC voltage was improved using the PWM controlling
techniques with the buck-boost converter.
2.6.4 Solar - Wind Hybrid Energy Systems in Rural Areas
“Solar – Wind Hybrid Energy Systems” is a study is conducted by Ambia et al. [14] on
the basic power equations in relation to solar PV panels and wind turbines. The article goes
further into the equations and theory involved with the two different energy sources. The authors
measure the average solar radiation and wind speeds in different parts of Bangladesh in search of
the optimal location for both technologies. They find that the wind speeds are higher near the
14
coast where there is less obstruction. In addition to high winds, this area has acceptable amounts
of solar exposure throughout the year.
The two systems proposed are an off-grid hybrid system and an on-grid hybrid system.
The systems are identical in the control method. The grid-tie system will be much more complex
due to the integration into the grid. The off-grid would primarily be implemented in rural areas
that would not typically have power. Both systems initially go through a battery bank; if it is at
capacity, the power will be transformed into AC and sent into the power grid.
Even though it is hybrid, the system is constructed to use only one source at a time. The
controller begins looking at the wind speed, and if that is insufficient then it will go check the
solar radiation. If neither renewable power sources are available, the system will draw from the
power grid. If the power grid is not available and the solar and wind are not producing, then the
system will pull from the battery bank.
2.6.5 Control and Energy Management of a Hybrid System
The Control and Energy Management of a Hybrid System project, conducted by Dali et
al. [15], is aimed to develop a micro-generation energy system that was achieved by
interconnecting a solar PV panel and wind turbine. The system is characterized by a “Very Low
Voltage” (VLV) node that is coupled to a battery bank and DC loads. The method used to control
the outputs from the energy sources is through a MPPT controller.
The wind turbine generator rated at 600W, PSMG, and the solar PV panel is rated at
400W. The control method used for both technologies is a buck converter, and the output of each
source is connected to a DC bus in parallel that feeds into a battery bank. The controller has
internal management methods to change the operation modes depending on the weather
conditions, load demand and battery charge condition.
15
2.6.6 Micro Generation – Solar and Wind Hybrid System
The hybrid energy system developed in “Micro Generation – Solar and Wind Hybrid
System” was designed for a house in an urban Portuguese city. To reduce dependency on the
grid, Fontes et al. [16] are developing an on/off grid system. They begin by measuring the
average solar radiation, temperature, wind speed and dominant wind direction for a year. The
design is focused on an actual proposal to apply this in a city in Portugal, so they are following
the legislation set in place.
Much like the other articles reviewed, the system is set to charge a battery bank and is
then sent to the home. If no generation is taking place and the battery bank is discharged, then
power will be supplied from the grid. Along with the design, they produced a cost analysis for
the entire project. 12 PV panels, one wind turbine, inverter, eight batteries, miscellaneous work
and materials, the cost of the project is estimated at over 16,000 Euros, and the payback period is
16 years.
2.6.7 Optimal Sizing Method for Hybrid System
The basis of the “Optimal Sizing Method for Hybrid System” article is to find the method
to optimize the configurations of a hybrid solar and wind system when it is accompanied by a
battery bank. The optimal sizing method Yang et al. [17] focuses on calculating the system
configuration that can achieve the required loss of power supply probability (LPSP) with a
minimum annualized cost of system (ACS). They call this algorithm the genetic algorithm (GA).
The variables that dictate the actions of the optimization process are the PV module voltage,
wind turbine voltage, battery voltage, PV module slope angle, and wind turbine installation
height.
16
The hybrid system proposed was implemented to supply power to a telecommunication
relay station on an isolated island off the southeast coast of China. The solar or wind turbine
solution can also achieve the same desired LPSP but at a higher cost. The relationship between
power reliability and system configurations show that the hybrid system with three to five days
of battery storage is suitable for the desired LPSP of 1% and 2%.

17
CHAPTER 3
SYSTEM HARDWARE
3.1 System Components
This chapter gives a detailed description of the system architecture of the Arduino-based
hybrid MPPT controller. It will describe the integration of various components and sensors in the
design of the controller.
Both wind and solar circuits are controlled by the Arduino UNO that uses ATmega328P.
The controller measures the input and output voltages with a voltage divider and the current with
an ASC712 Hall Current Sensor. The Arduino UNO provides a PWM signal of 62.5 kHz and
31.25 kHz to drive the MOSFETs; the controller uses the data provided by the inputs and outputs
to adjust the duty cycle for each circuit. When the battery is at maximum capacity, the controller
will activate a relay that will send the excess power to a dump load resistor.
3.2 System Layout
The ATmega328P microcontroller on the Arduino UNO board compares the data from
the voltage dividers and current sensors at the input and output for both wind and solar circuits.
The microcontroller gives a PWM frequency of 62.5 kHz to the wind circuit and 31.25 kHz to
the solar circuit to control the switching states for the MOSFETs. The duty cycle is adjusted
depending on the state of charge of the battery and the input sources. The inputs and outputs are
read at the analog pins.
18
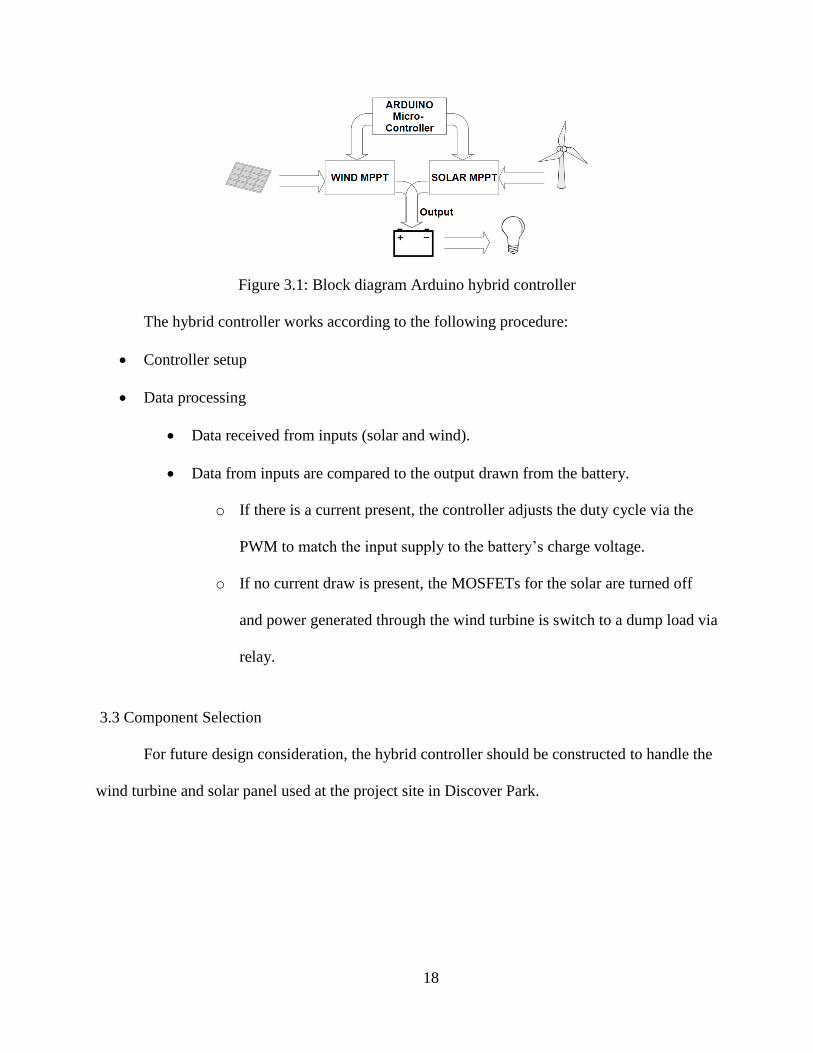
Figure 3.1: Block diagram Arduino hybrid controller
The hybrid controller works according to the following procedure:
Controller setup
Data processing
Data received from inputs (solar and wind).
Data from inputs are compared to the output drawn from the battery.
o If there is a current present, the controller adjusts the duty cycle via the
PWM to match the input supply to the battery’s charge voltage.
o If no current draw is present, the MOSFETs for the solar are turned off
and power generated through the wind turbine is switch to a dump load via
relay.
3.3 Component Selection
For future design consideration, the hybrid controller should be constructed to handle the
wind turbine and solar panel used at the project site in Discover Park.
19
3.3.1 Arduino UNO
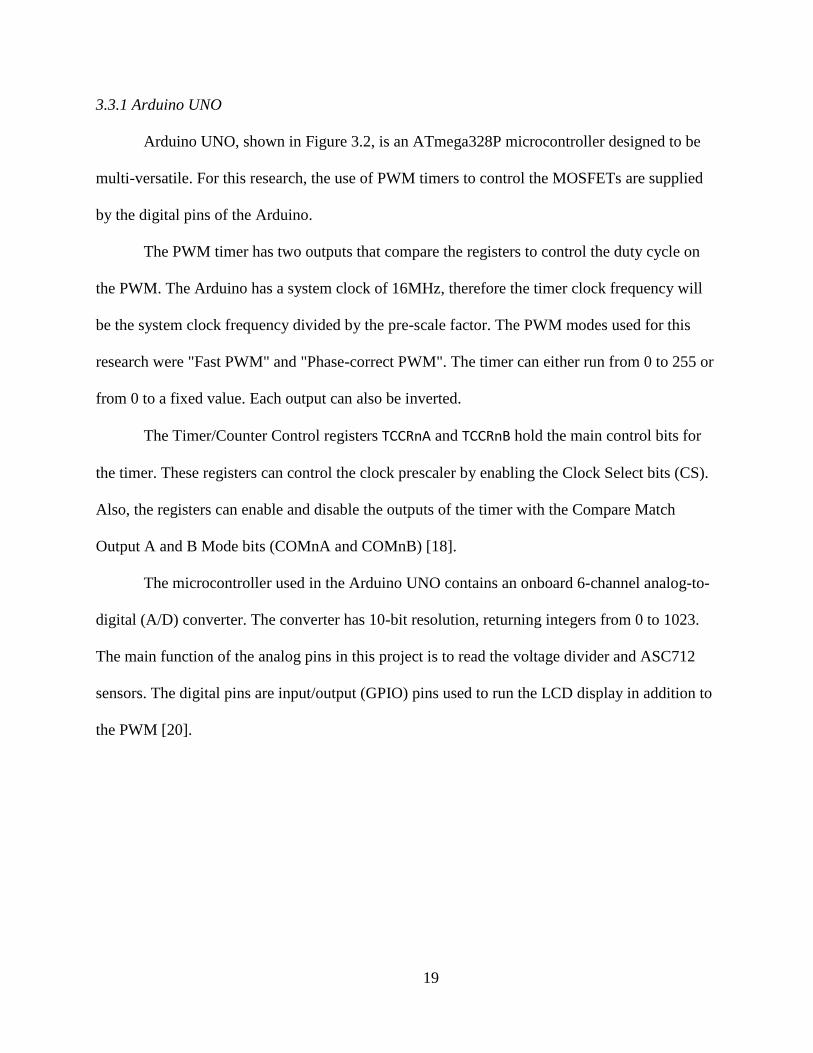
Arduino UNO, shown in Figure 3.2, is an ATmega328P microcontroller designed to be
multi-versatile. For this research, the use of PWM timers to control the MOSFETs are supplied
by the digital pins of the Arduino.
The PWM timer has two outputs that compare the registers to control the duty cycle on
the PWM. The Arduino has a system clock of 16MHz, therefore the timer clock frequency will
be the system clock frequency divided by the pre-scale factor. The PWM modes used for this
research were "Fast PWM" and "Phase-correct PWM". The timer can either run from 0 to 255 or
from 0 to a fixed value. Each output can also be inverted.
The Timer/Counter Control registers TCCRnA and TCCRnB hold the main control bits for
the timer. These registers can control the clock prescaler by enabling the Clock Select bits (CS).
Also, the registers can enable and disable the outputs of the timer with the Compare Match
Output A and B Mode bits (COMnA and COMnB) [18].
The microcontroller used in the Arduino UNO contains an onboard 6-channel analog-to-
digital (A/D) converter. The converter has 10-bit resolution, returning integers from 0 to 1023.
The main function of the analog pins in this project is to read the voltage divider and ASC712
sensors. The digital pins are input/output (GPIO) pins used to run the LCD display in addition to
the PWM [20].
20
Figure 3.2: Arduino UNO [19]
3.3.2 Voltage Divider
Arduino UNO analog inputs can be used to measure DC voltage between 0 and 5V. The
range of which the Arduino can measure voltage is increased by using two resistors to create a
voltage divider. Denote Vin as the voltage to be measured, and Vout as the voltage output of the
divider, which will be connected at the input pin. The voltage divider decreases the voltage being
measured to within the range of the Arduino analog inputs. Following the formula for a voltage
divider, shown in Equation 3.1, dividing the Vout by 1023 and multiplying by 5V will reflect the
actual voltage to be measured by the Arduino.
𝑉𝑜𝑢𝑡 = 𝑉𝑖𝑛 × 𝑅2
𝑅1 + 𝑅2
Equation 3.1: Voltage divider formula [21]
3.3.3 ASC712 Hall Current Sensor
The ACS712 provides economical and precise solutions for AC or DC current sensing.
The ACS712 has 3 current sensor ratings, 5A, 20A, and 30A. The device consists of a precise,
21
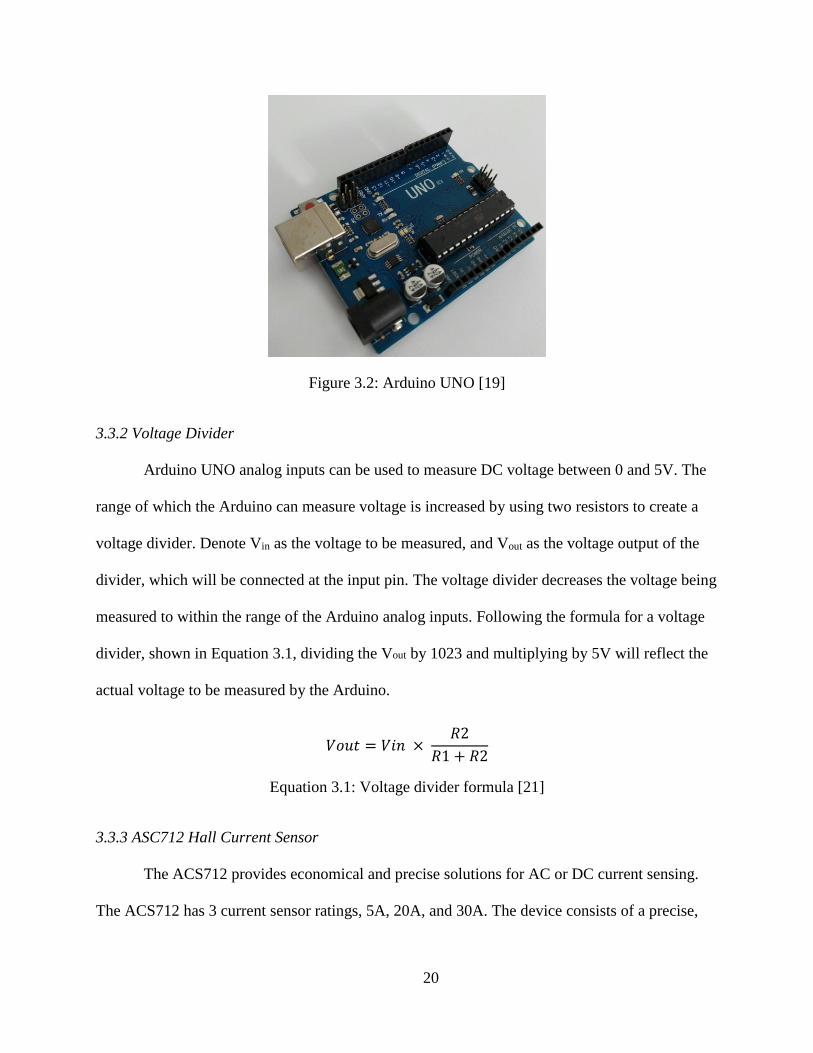
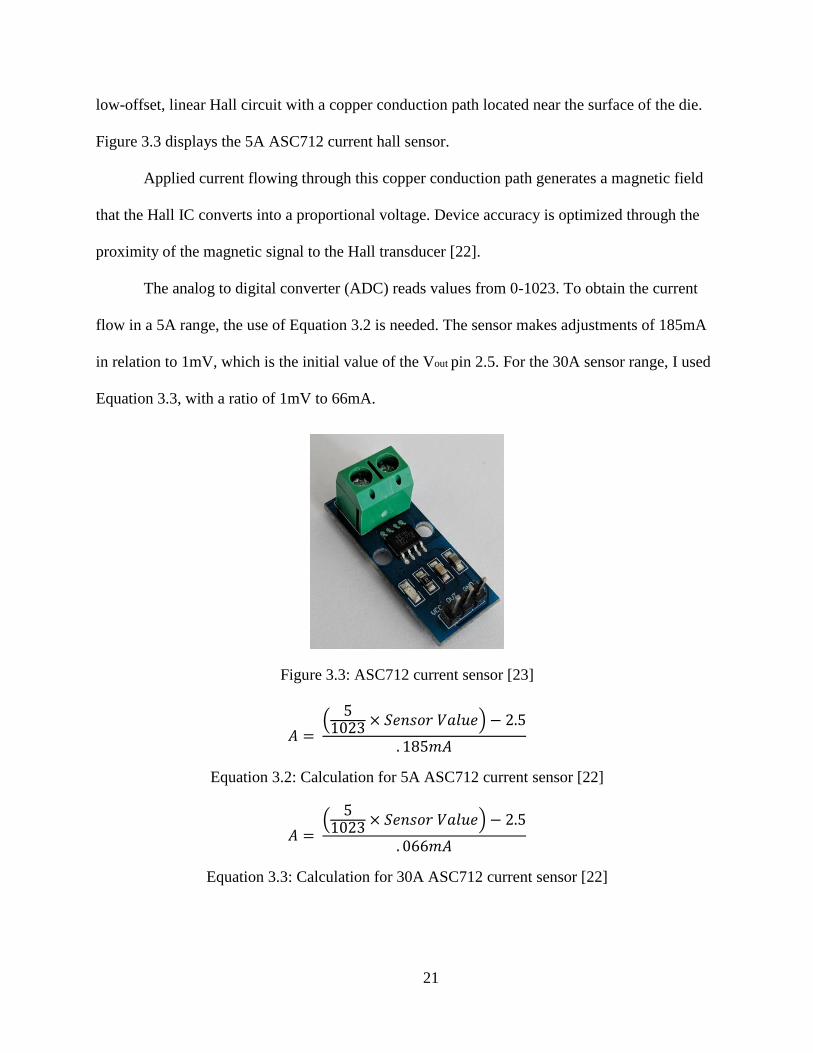
low-offset, linear Hall circuit with a copper conduction path located near the surface of the die.
Figure 3.3 displays the 5A ASC712 current hall sensor.
Applied current flowing through this copper conduction path generates a magnetic field
that the Hall IC converts into a proportional voltage. Device accuracy is optimized through the
proximity of the magnetic signal to the Hall transducer [22].
The analog to digital converter (ADC) reads values from 0-1023. To obtain the current
flow in a 5A range, the use of Equation 3.2 is needed. The sensor makes adjustments of 185mA
in relation to 1mV, which is the initial value of the Vout pin 2.5. For the 30A sensor range, I used
Equation 3.3, with a ratio of 1mV to 66mA.
Figure 3.3: ASC712 current sensor [23]
𝐴 = (
51023 × 𝑆𝑒𝑛𝑠𝑜𝑟 𝑉𝑎𝑙𝑢𝑒) − 2.5
. 185𝑚𝐴
Equation 3.2: Calculation for 5A ASC712 current sensor [22]
𝐴 = (
51023 × 𝑆𝑒𝑛𝑠𝑜𝑟 𝑉𝑎𝑙𝑢𝑒) − 2.5
. 066𝑚𝐴
Equation 3.3: Calculation for 30A ASC712 current sensor [22]

22
3.3.4 IRFZ44NPbF N- Channel MOSFET
The MOSFET used to design the DC-DC converter is the IRFZ44NPbF HEXFET Power
MOSFET. It has advanced processing techniques to achieve extremely low on-resistance per
silicon area. This MOSFET is rated VDSS 55V and 25A ID, which allows 55V from the drain to
source and 49A flow at the drain. Along with fast switching speeds, dynamic dv/dt rating and the
gate to source voltage is +/- 20V, which needs a bridge driver to run more efficiently [24].
3.3.5 IR2104 Half Bridge Driver
The IR2104 is high-voltage, high-speed power MOSFET driver with dependent high- and
low-side referenced output channels. The range of gate drive supply is from 10 to 20V, which is
enough to drive the IRFZ44NPdF MOSFET for the bench scale experiment of this project. This
half-bridge driver was used to drive the MOSFETs for the buck DC-DC converters [25].
3.3.6 Low ESR Capacitor
My design uses two capacitors, one in the front to minimize any ripple present in the
input voltage and the other to construct the DC-DC converter. The low-equivalent series
resistance (ESR) is a ceramic capacitor that is more capable to hold its capacitance through DC
bias or temperature [26].
3.3.7 Shielded Power Inductors – RFS1317
The inductors used for the buck and buck/boost circuits are the RFS1317 shielded power
inductors. They are low-cost, high-current saturation power inductors, capable to operate under
high ambient temperature of up to 125 °C with 85% relative humidity. Since the current
23
saturation is lower than what is needed, connecting the inductors in parallel will meet the current
levels needed [27].
3.3.8 Schottky Diode
VSB2045 PV solar cell protection Schottky diode was implemented in my research for
the power conversion circuits. This component is used in solar cell junction boxes as a bypass
diode for protection and uses a low DC forward current without reverse bias [28].
3.3.9 896H-1CH-D1 Automotive Relay
The 896H Relay would eventually be used to control the load from the wind turbine. It is
a cost-effective, high-power 24V relay, allowing up to 50A. Having a constant load on a wind
turbine is necessary to avoid damage. When the battery is at capacity, the relay will switch from
the battery as a load to dump load resistors [29].
3.2.10 125W ALEKO Monocrystalline Solar PV Module
The solar panel that would eventually be used in the field test is the 24V, 125W ALEKO
monocrystalline solar PV module. Its operational output voltage is 36.6V and produces 3.47A
[30].
3.2.11 500W 24V Wind Turbine
The wind turbine used at the site, intended for this research, is the Missouri Basic 24V,
500W, 5-blade wind turbine. It produces a 3-phase alternating current (AC) that is converted to
direct current (DC) using a bridge rectifier. Having 5 blades is optimal for lower wind speeds
and uses a tail fin to help change position to capture winds in all directions [31].

24
3.2.12 Lead Acid Battery
The battery bank targeted for this research at the project site consists of two 12V Duracell
Ultra lead acid batteries connected in series to increase the voltage of the bank to 24V. The
batteries are designed to allow drainage from a load and to be charged from solar panels or wind
turbines.
3.2.13 Constant Current Electrical Load
This device is used to simulate a battery but is able to control the amount of current that
is drawn. The power rating is 60W, which the device can be set to a maximum 10A of drawl and
allows an output voltage of 30V. It is built with a large heat sink and fan to extract the heat from
it. The dial allows changes to the amount of current needed to simulate. For my hybrid
controller, if there is no current draw, then the system will not operate. This is because if there is
no draw at the battery, then it is at full capacity [32].

25
CHAPTER 4
SYSTEM AND SOFTWARE DESIGN
4.1 Introduction
The design of the hybrid controller uses two synchronous buck converters in parallel. The
controller is designed to control the inputs from both the solar panel and wind turbine to match
the charge voltage of the output.
4.2 Inductor and Capacitor Size Calculations for Hybrid Controller
The MPPT is designed with a synchronous buck converter to control the output from the
solar panel and wind turbine. The solar panel produces 36.6V and 3.76A in optimal conditions;
in cloudy conditions, the rated voltage of 36.6 V is reached though the current is increased with
sun exposure. The wind turbine has a rated power production of 500W, which is met at peak
wind speeds. The voltage produced from the turbine ranges from 0 to 60V. To keep components
from overloading, a maximum voltage of 50V is set. This means the current will be in the range
of 15A. Setting a parameter in the code to send the wind generated power to a dump load when
the wind generator produces more than 50V.
The size of the battery bank used is 24V, meaning the optimal charge voltage for the
battery bank is approximately 27.6V [5]. Since the voltage needs to be dropped to meet the
charging voltage and the current boosted, a buck converter is the logical choice.
When designing a buck converter, several parameters are needed to calculate the power
stage: the input voltage from the solar panel and wind turbine range (Vin(min) and Vin(max)) the
output voltage (Vout) needed to charge the batteries, the maximum output current (Iout(max)) and
the frequency driving the MOSFETs (fS). These parameters will dictate the size of the inductor
26
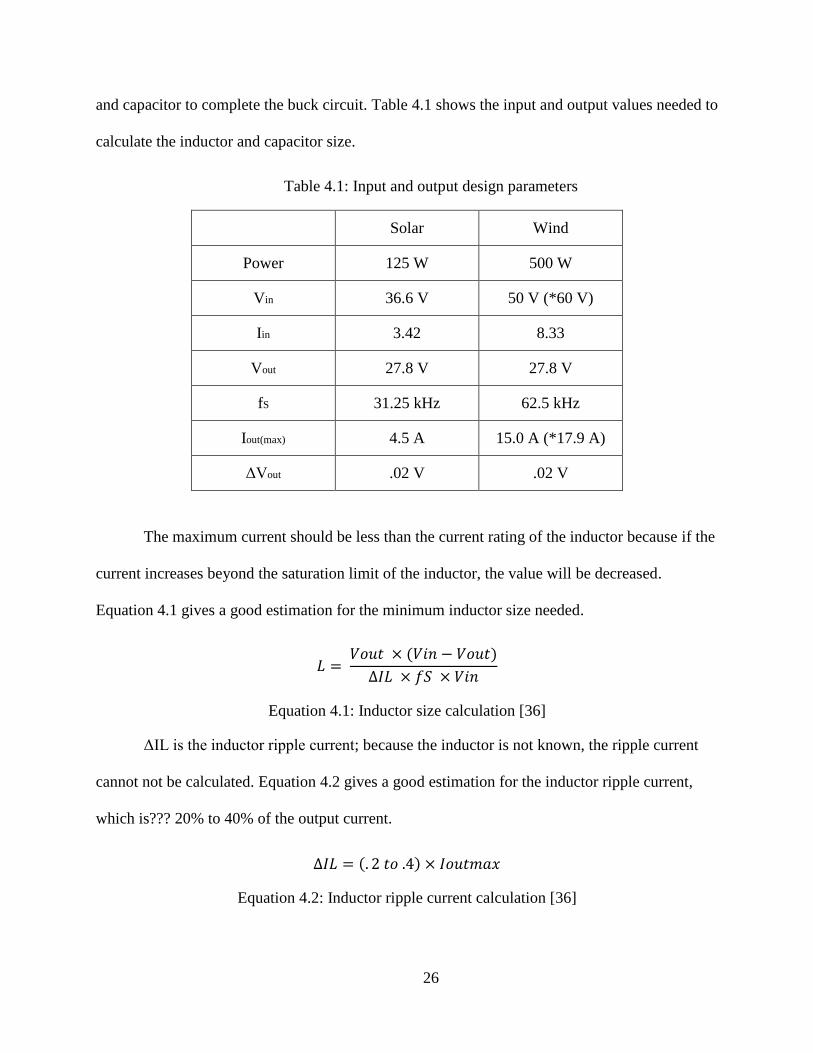
and capacitor to complete the buck circuit. Table 4.1 shows the input and output values needed to
calculate the inductor and capacitor size.
Table 4.1: Input and output design parameters
Solar Wind
Power 125 W 500 W
Vin 36.6 V 50 V (*60 V)
Iin 3.42 8.33
Vout 27.8 V 27.8 V
fS 31.25 kHz 62.5 kHz
Iout(max) 4.5 A 15.0 A (*17.9 A)
ΔVout .02 V .02 V
The maximum current should be less than the current rating of the inductor because if the
current increases beyond the saturation limit of the inductor, the value will be decreased.
Equation 4.1 gives a good estimation for the minimum inductor size needed.
𝐿 = 𝑉𝑜𝑢𝑡 × (𝑉𝑖𝑛 − 𝑉𝑜𝑢𝑡)
∆𝐼𝐿 × 𝑓𝑆 × 𝑉𝑖𝑛
Equation 4.1: Inductor size calculation [36]
ΔIL is the inductor ripple current; because the inductor is not known, the ripple current
cannot not be calculated. Equation 4.2 gives a good estimation for the inductor ripple current,
which is??? 20% to 40% of the output current.
∆𝐼𝐿 = (. 2 𝑡𝑜 .4) × 𝐼𝑜𝑢𝑡𝑚𝑎𝑥
Equation 4.2: Inductor ripple current calculation [36]

27
An input capacitor can be added to help stabilize the input voltage due to the peak current
requirement of a switching power supply. The output capacitor is more impactful to the
operation of the buck converter because it helps stabilize the ripple from the switch process. The
output capacitor can be determined by Equation 4.3, therefore ΔVout can be estimated around
.02V.
𝐶𝑜𝑢𝑡 = ∆𝐼𝐿
8 × 𝑓𝑆 × ∆𝑉𝑜𝑢𝑡
Equation 4.3: Output capacitor size calculation [36]
𝐿𝑠𝑜𝑙𝑎𝑟 = 27.6 × (36.6 − 27.6)
(. 3 × 4.5) × 31250 × 36.6= 161𝜇𝐻
𝐿𝑤𝑖𝑛𝑑 = 27.6 × (50 − 27.6)
(. 3 × 15) × 62500 × 50= 44𝜇𝐻
𝐶𝑠𝑜𝑙𝑎𝑟 = (.3 × 4.5)
8 × 31250 × .02= 270𝜇𝐹
𝐶𝑤𝑖𝑛𝑑 = (.3 × 15)
8 × 62500 × .02= 450𝜇𝐹
Equation 4.4: Capacitor and inductor calculations for field test controller
4.3 Controller Design
Figure 4.1 shows the circuit schematic for the hybrid controller. The diode and the
capacitor on the input side filter noise that may be present. The input is read by the voltage
divider and then passes through the ACS712 current sensor on both solar and wind. For this
controller, the input is fed through a MOSFET if the voltage is high enough to meet the enable
28
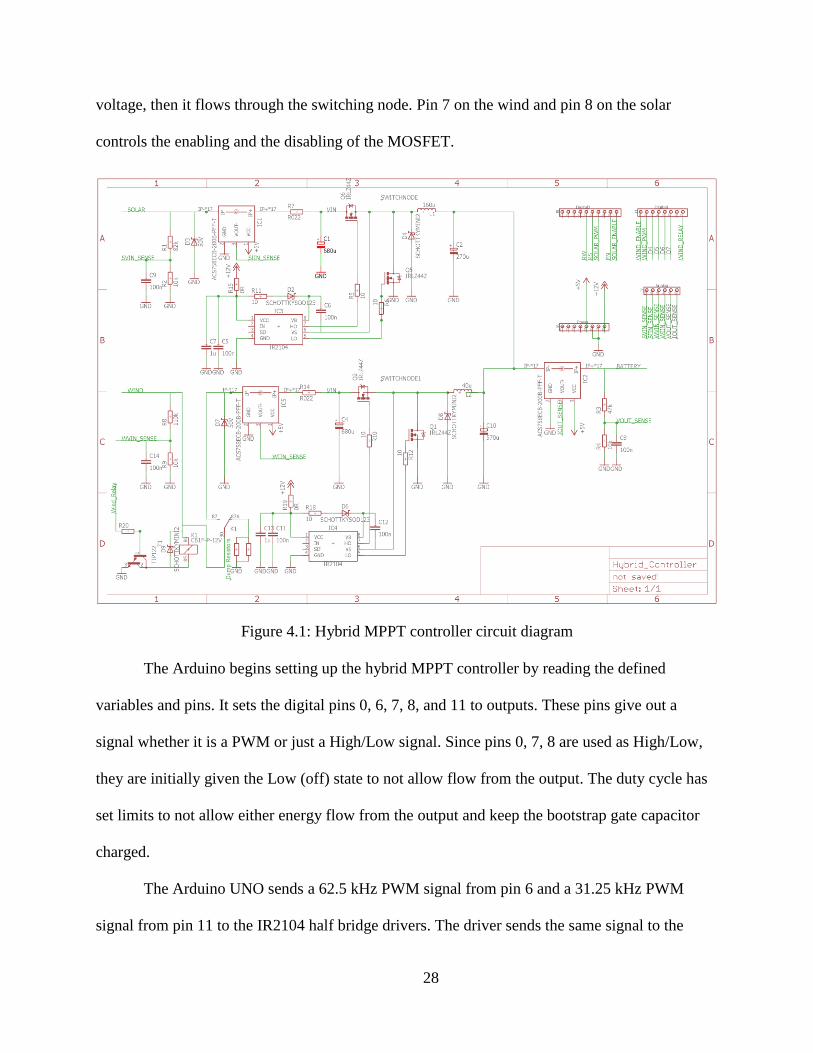
voltage, then it flows through the switching node. Pin 7 on the wind and pin 8 on the solar
controls the enabling and the disabling of the MOSFET.
Figure 4.1: Hybrid MPPT controller circuit diagram
The Arduino begins setting up the hybrid MPPT controller by reading the defined
variables and pins. It sets the digital pins 0, 6, 7, 8, and 11 to outputs. These pins give out a
signal whether it is a PWM or just a High/Low signal. Since pins 0, 7, 8 are used as High/Low,
they are initially given the Low (off) state to not allow flow from the output. The duty cycle has
set limits to not allow either energy flow from the output and keep the bootstrap gate capacitor
charged.
The Arduino UNO sends a 62.5 kHz PWM signal from pin 6 and a 31.25 kHz PWM
signal from pin 11 to the IR2104 half bridge drivers. The driver sends the same signal to the

29
MOSFETs but amplifies the driving voltage to the MOSFET gate. The output voltage and
current are measured and compared to the set values assigned within the program. The duty cycle
within the PWM equates to on/off time for the MOSFET. If the voltage from the output of DC-
DC converter is above the maximum, the duty cycle will decrease until the output voltage
matches the set limit. Conversely, if the DC-DC converter output voltage is less than the
minimum limit set, the duty cycle will increase.
If the input voltage from the solar panel and/or the wind turbine is less than the disable
voltage or the current is less than the minimum, then the DC-DC converter will be disabled. If
the system is disabled, the Arduino will constantly check if it can be enabled. If the input
voltages are greater than the enable voltage, it turns on the DC-DC converters. A flow chart of
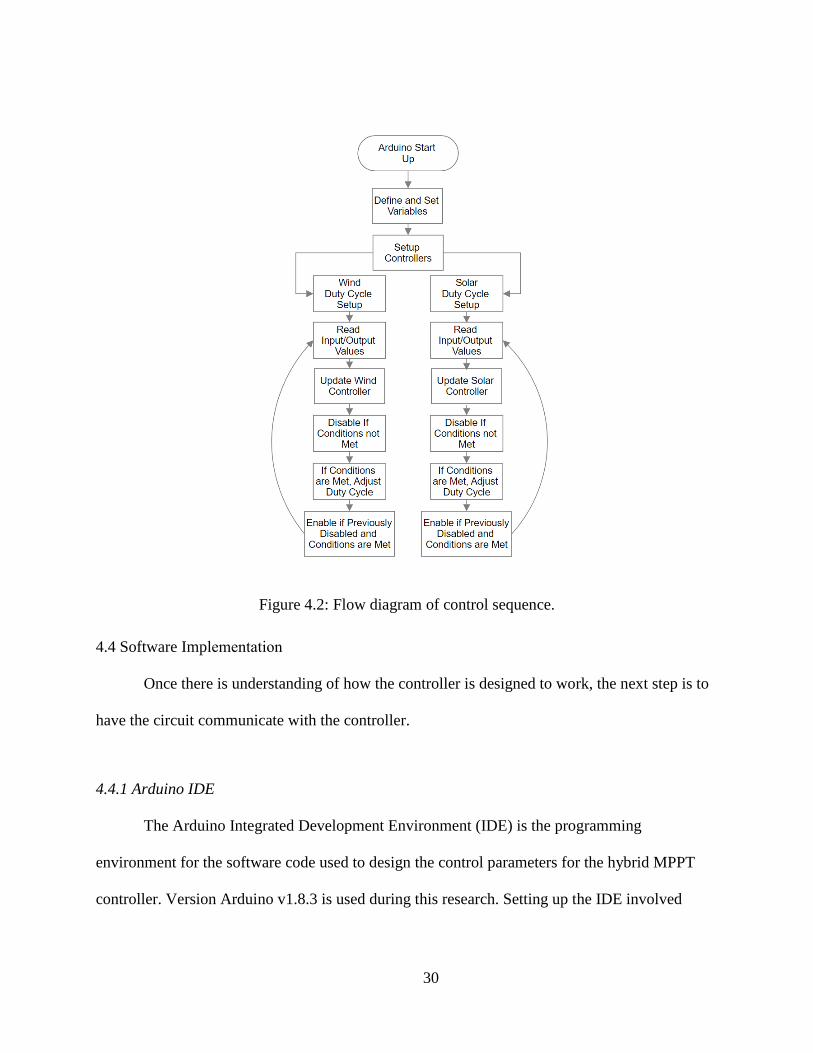
the Arduino logic hierarchy can be seen in Figure 4.2.
30
Figure 4.2: Flow diagram of control sequence.
4.4 Software Implementation
Once there is understanding of how the controller is designed to work, the next step is to
have the circuit communicate with the controller.
4.4.1 Arduino IDE
The Arduino Integrated Development Environment (IDE) is the programming
environment for the software code used to design the control parameters for the hybrid MPPT
controller. Version Arduino v1.8.3 is used during this research. Setting up the IDE involved

31
selecting the “Arduino/Genuino UNO” board under the Tools Menu and selecting the COM to
which the UNO is present.
When the controller receives power from the UNO, it reads the defined conditions of the
input and output sources. It begins to step up the controller by identifying which pins will
provide an output and setting the PWM modes. It displays a welcome screen and then begins the
infinite loop after setting up the controller.
The loop contains 3 different parts, the first being to read the values at the input and
output. Then, it begins the solar and wind updates; the Arduino controls the amount of duty
being supplied through each PWM pin to correct the output voltage and input current.
4.4.2 Controller Configurations
Every pin that is used must be defined to a pin in the program: Solar Enable, Solar PWM,
Wind Enable, Wind PWM, Wind Relay, Solar Input Voltage, Solar Input Current, Wind Input
Voltage, Wind Input Current, the Output Voltage, and Output Current. Then set the limits for the
controller: Enable Voltage, Disable Voltage, Target Voltage, Maximum Current, and Minimum
Current for both solar and wind. Lastly, the Maximum and Minimum Output Voltage and
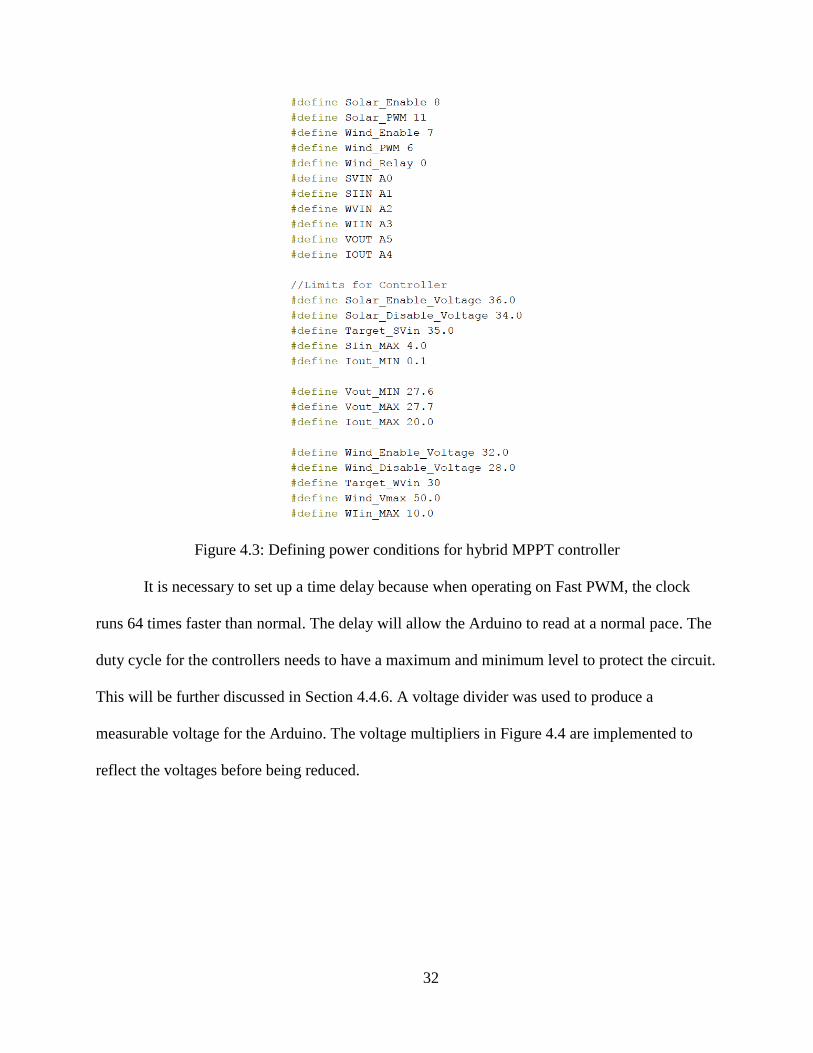
Current are set. This is shown in Figure 4.3.
32
Figure 4.3: Defining power conditions for hybrid MPPT controller
It is necessary to set up a time delay because when operating on Fast PWM, the clock
runs 64 times faster than normal. The delay will allow the Arduino to read at a normal pace. The
duty cycle for the controllers needs to have a maximum and minimum level to protect the circuit.
This will be further discussed in Section 4.4.6. A voltage divider was used to produce a
measurable voltage for the Arduino. The voltage multipliers in Figure 4.4 are implemented to
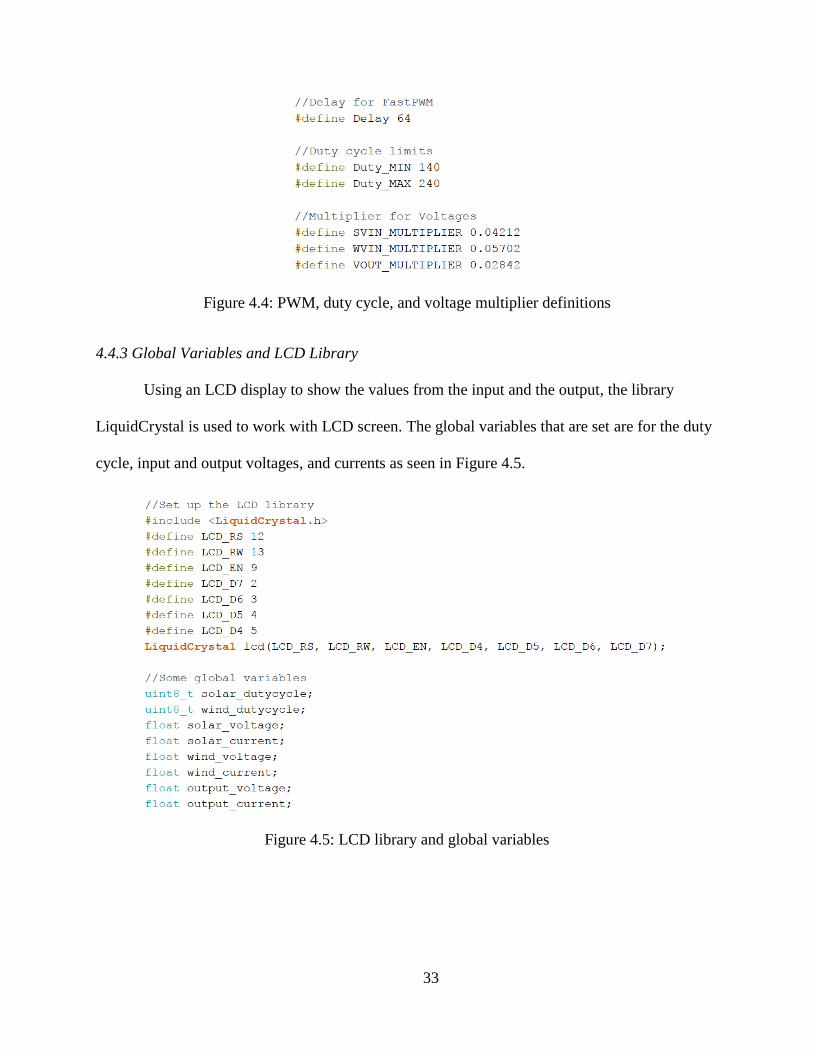
reflect the voltages before being reduced.
33
Figure 4.4: PWM, duty cycle, and voltage multiplier definitions
4.4.3 Global Variables and LCD Library
Using an LCD display to show the values from the input and the output, the library
LiquidCrystal is used to work with LCD screen. The global variables that are set are for the duty
cycle, input and output voltages, and currents as seen in Figure 4.5.
Figure 4.5: LCD library and global variables

34
4.4.4 Controller Setup
Figure 4.6 shows the initial setup processes the hybrid MPPT controller goes through
upon cycling on. The function pinMode sets the Arduino’s pins to produce output. The “enable”
pins, such Solar_Enable and Wind_Enable, are not defined to a PWM frequency but to a LOW
or HIGH (on or off) through the function digitalWrite. The PWM pins need to be called upon to
produce the fast PWM for pin 6 and the phase shift PWM for pin 11. This is done by setting the
TCCR0A and TCCR2A registers then using the Output Compare (OCR0A and OCR2A) pin for
the duty cycle, which is initially set to 0.
Figure 4.6: Hybrid controller setup
4.4.4.1 TCCR0A and TCCR0B Registers for Fast PWM
As discussed previously, there are Timer/Counter Control registers that hold the main bits
for the timer. Fast PWM outputs a frequency of 62.5 kHz, which is the largest frequency the

35
Arduino can produce. The TCCR0A is shown in Figure 4.7. Assigning a 1 or 0 to the bit changes
the behavior of the register.
Figure 4.7: TC0 control register A [37]
These bits control the Output Compare pin (OC0A) behavior. If one or both of the
COM0A[1:0] bits are set, the OC0A output overrides the normal port functionality of the I/O pin
it is connected to. The Data Direction Register (DDR) bit corresponding to the OC0A pin must
be set in order to enable the output driver. When OC0A is connected to the pin, the function of
the COM0A[1:0] bits depends on the WGM0[2:0] bit setting. Table 4.1 shows the COM0A[1:0]
bit functionality when the WGM0[2:0] bits are set to fast PWM mode, which was used for my
wind controller design [37].
Table 4.1: Compare output (OC0A) mode, fast PWM [37]
Much like the OC0A, bits are used to control the Output Compare pin (OC0B) behavior.
If one or both of the COM0B[1:0] bits are set, the OC0B output overrides the normal port
functionality of the I/O pin to which it is connected. The Data Direction Register (DDR) bit
corresponding to the OC0B pin must be activated to enable the output driver. When OC0B is
Name: TCCR0A
Offset: 0x44
Reset: 0x00
Property: When addressing as I/0 Register: address offset is 0x24
Bit 7 6 5 4 3 2 1 0
COM0A1 COM0A0 COM0B1 COM0B0 WGM01 WGM00
Access R/W R/W R/W R/W R/W R/W
Reset 0 0 0 0 0 0
COM0A1 COM0A0 Description
0 0 Normal port operation, OC0A disconnected.
0 1WGM02 = 0; Normal Port Operation, OC0A Disconnected
WGM02 = 1: Toggle OC0A on Compare Match
1 0 Clear OC0A on Compare Match, set OC0A at BOTTOM(non-inverting mode)
1 1 Set OC0A on Compare Match, clear OC0A at BOTTOM(inverting mode
36
connected to the pin, the function of the COM0B[1:0] bits depends on the WGM0[2:0] bit
setting. Table 4.2 shows the COM0B[1:0] bit functionality when the WGM[2:0} bits are set to
fast PWM mode [37].
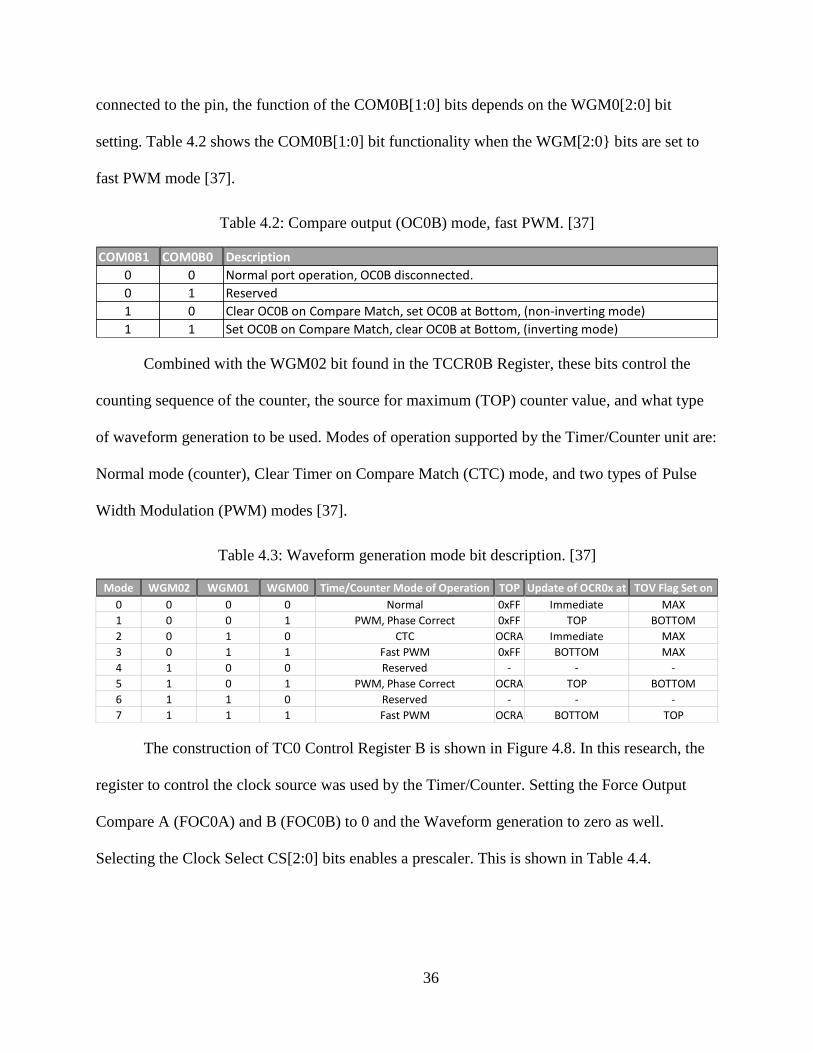
Table 4.2: Compare output (OC0B) mode, fast PWM. [37]
Combined with the WGM02 bit found in the TCCR0B Register, these bits control the
counting sequence of the counter, the source for maximum (TOP) counter value, and what type
of waveform generation to be used. Modes of operation supported by the Timer/Counter unit are:
Normal mode (counter), Clear Timer on Compare Match (CTC) mode, and two types of Pulse
Width Modulation (PWM) modes [37].
Table 4.3: Waveform generation mode bit description. [37]
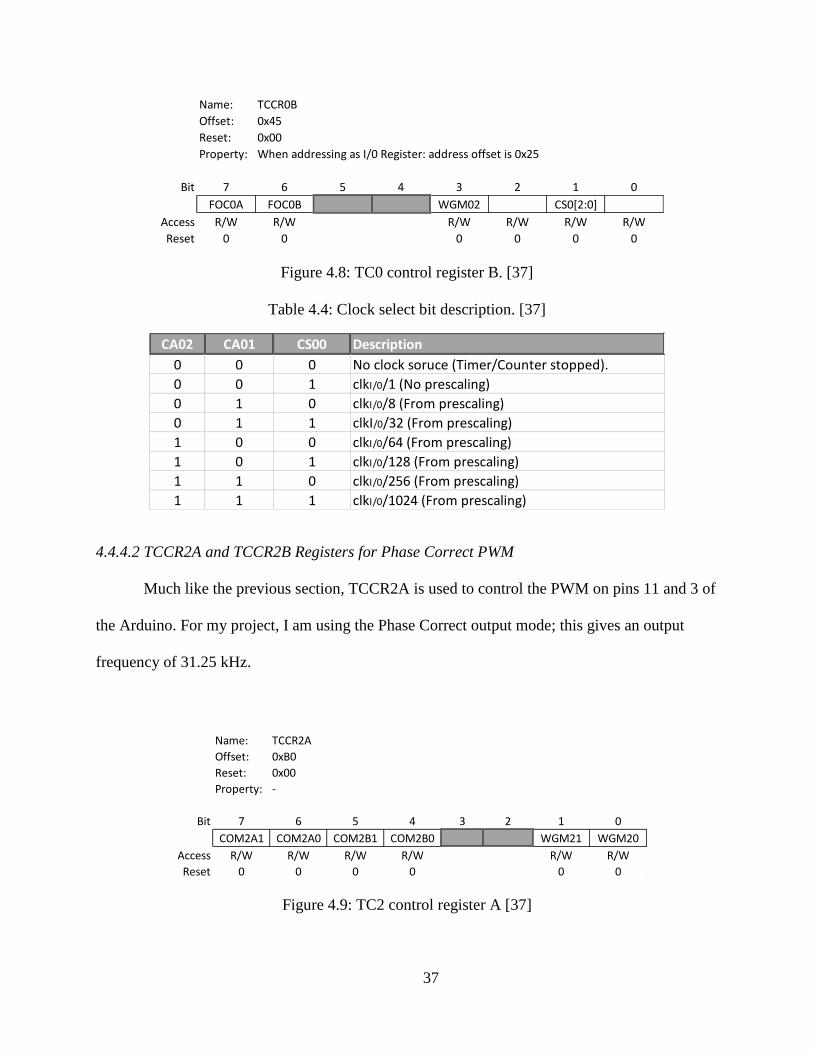
The construction of TC0 Control Register B is shown in Figure 4.8. In this research, the
register to control the clock source was used by the Timer/Counter. Setting the Force Output
Compare A (FOC0A) and B (FOC0B) to 0 and the Waveform generation to zero as well.
Selecting the Clock Select CS[2:0] bits enables a prescaler. This is shown in Table 4.4.
COM0B1 COM0B0 Description
0 0 Normal port operation, OC0B disconnected.
0 1 Reserved
1 0 Clear OC0B on Compare Match, set OC0B at Bottom, (non-inverting mode)
1 1 Set OC0B on Compare Match, clear OC0B at Bottom, (inverting mode)
Mode WGM02 WGM01 WGM00 Time/Counter Mode of Operation TOP Update of OCR0x at TOV Flag Set on
0 0 0 0 Normal 0xFF Immediate MAX
1 0 0 1 PWM, Phase Correct 0xFF TOP BOTTOM
2 0 1 0 CTC OCRA Immediate MAX
3 0 1 1 Fast PWM 0xFF BOTTOM MAX
4 1 0 0 Reserved - - -
5 1 0 1 PWM, Phase Correct OCRA TOP BOTTOM
6 1 1 0 Reserved - - -
7 1 1 1 Fast PWM OCRA BOTTOM TOP
37
Figure 4.8: TC0 control register B. [37]
Table 4.4: Clock select bit description. [37]
4.4.4.2 TCCR2A and TCCR2B Registers for Phase Correct PWM
Much like the previous section, TCCR2A is used to control the PWM on pins 11 and 3 of
the Arduino. For my project, I am using the Phase Correct output mode; this gives an output
frequency of 31.25 kHz.
Figure 4.9: TC2 control register A [37]
Name: TCCR0B
Offset: 0x45
Reset: 0x00
Property: When addressing as I/0 Register: address offset is 0x25
Bit 7 6 5 4 3 2 1 0
FOC0A FOC0B WGM02 CS0[2:0]
Access R/W R/W R/W R/W R/W R/W
Reset 0 0 0 0 0 0
CA02 CA01 CS00 Description
0 0 0 No clock soruce (Timer/Counter stopped).
0 0 1 clkI/0/1 (No prescaling)
0 1 0 clkI/0/8 (From prescaling)
0 1 1 clkI/0/32 (From prescaling)
1 0 0 clkI/0/64 (From prescaling)
1 0 1 clkI/0/128 (From prescaling)
1 1 0 clkI/0/256 (From prescaling)
1 1 1 clkI/0/1024 (From prescaling)
Name: TCCR2A
Offset: 0xB0
Reset: 0x00
Property: -
Bit 7 6 5 4 3 2 1 0
COM2A1 COM2A0 COM2B1 COM2B0 WGM21 WGM20
Access R/W R/W R/W R/W R/W R/W
Reset 0 0 0 0 0 0

38
Assigning different bits controls the Output Compare pin (OC2A) behavior. If one or
both of the COM2A[1:0] bits are selected, the OC2A output overrides the normal port
functionality of the I/O pin to which it is connected. The Data Direction Register (DDR) bit
corresponding to the OC2A pin must be set to enable the output driver. When OC2A is
connected to the pin, the function of the COM2A[1:0] bits depend on the WGM2[2:0] bit setting.
Table 4.5 shows the COM2A[1:0] bit functionality when the WGM2[2:0] bits are set to phase
correct PWM mode.
Table 4.5: Compare output mode, phase correct PWM Mode [37]
Much the same for Channel A, bits can be assigned to control the Output Compare pin
(OC2B) for Channel B to change the behavior. If one or both of the COM2B[1:0] bits are set, the
OC2B output overrides the normal port functionality of the I/O pin to which it is connected.
However, note that the Data Direction Register (DDR) bit corresponding to the OC2B pin must
be set in order to enable the output driver.
When OC2B is connected to the pin, the function of the COM2B[1:0] bits depend on the
WGM2[2:0] bit setting. Table 4.6 shows the COM2B[1:0] bit functionality when the
WGM2[2:0] bits are set to phase correct PWM mode.Table 4.6: Compare output mode, phase
correct PWM mode [37]
COM2A1 COM2A0 Description
0 0 Normal port operation, OC2A disconnected.
0 1WGM22 = 0; Normal Port Operation, OC2A Disconnected
WGM22 = 1: Toggle OC2A on Compare Match
1 0Clear OC2A on Compare Match, when up-counting. Set OC2A on Compare Match
when down-counting.
1 1Set OC2A on Compare Match, when up-counting. Clear OC2A on Compare Match
when down-counting.
39
Combined with the WGM22 bit found in the TCCR2B Register, these bits control the
counting sequence of the counter, the source for maximum (TOP) counter value, and what type
of waveform generation to be used. Modes of operation supported by the Timer/Counter unit are:
Normal mode (counter), Clear Timer on Compare Match (CTC) mode, and two types of Pulse
Width Modulation (PWM) modes [37].
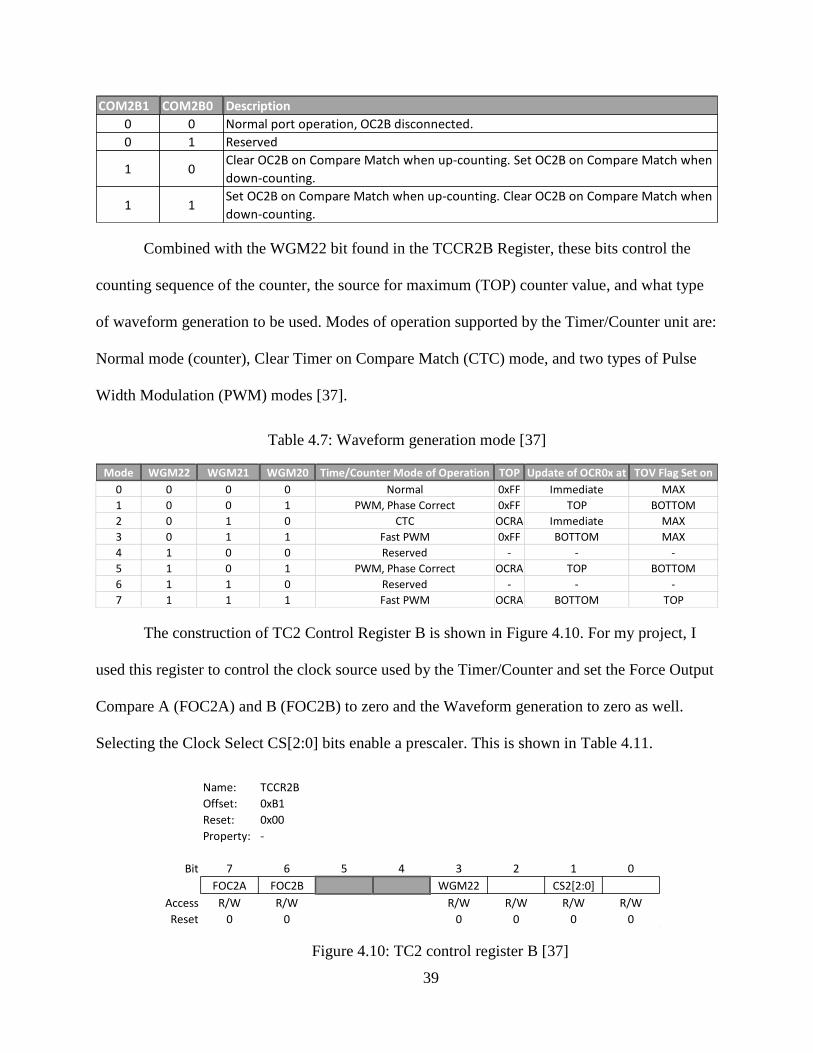
Table 4.7: Waveform generation mode [37]
The construction of TC2 Control Register B is shown in Figure 4.10. For my project, I
used this register to control the clock source used by the Timer/Counter and set the Force Output
Compare A (FOC2A) and B (FOC2B) to zero and the Waveform generation to zero as well.
Selecting the Clock Select CS[2:0] bits enable a prescaler. This is shown in Table 4.11.
COM2B1 COM2B0 Description
0 0 Normal port operation, OC2B disconnected.
0 1 Reserved
1 0Clear OC2B on Compare Match when up-counting. Set OC2B on Compare Match when
down-counting.
1 1Set OC2B on Compare Match when up-counting. Clear OC2B on Compare Match when
down-counting.
Mode WGM22 WGM21 WGM20 Time/Counter Mode of Operation TOP Update of OCR0x at TOV Flag Set on
0 0 0 0 Normal 0xFF Immediate MAX
1 0 0 1 PWM, Phase Correct 0xFF TOP BOTTOM
2 0 1 0 CTC OCRA Immediate MAX
3 0 1 1 Fast PWM 0xFF BOTTOM MAX
4 1 0 0 Reserved - - -
5 1 0 1 PWM, Phase Correct OCRA TOP BOTTOM
6 1 1 0 Reserved - - -
7 1 1 1 Fast PWM OCRA BOTTOM TOP
Name: TCCR2B
Offset: 0xB1
Reset: 0x00
Property: -
Bit 7 6 5 4 3 2 1 0
FOC2A FOC2B WGM22 CS2[2:0]
Access R/W R/W R/W R/W R/W R/W
Reset 0 0 0 0 0 0
Figure 4.10: TC2 control register B [37]

40
Table 4.8: Clock select bit description [37]
4.4.5 Enabling and Disabling
To ensure that the power is being delivered when needed and diverted away when not,
disabling and enabling parameters are set in place. The wind and solar are nearly identical, apart
from the use of a relay in the wind MPPT that is used to protect the wind turbine so that it keeps
a constant load. The A Channel registers are used to enable and disable the prescaler in the clock
source shown in Figure 4.11.
CA22 CA21 CS20 Description
0 0 0 No clock soruce (Timer/Counter stopped).
0 0 1 clkI/0/1 (No prescaling)
0 1 0 clkI/0/8 (From prescaling)
0 1 1 clkI/0/32 (From prescaling)
1 0 0 clkI/0/64 (From prescaling)
1 0 1 clkI/0/128 (From prescaling)
1 1 0 clkI/0/256 (From prescaling)
1 1 1 clkI/0/1024 (From prescaling)

41
Figure 4.11: Solar and wind enabling and disabling
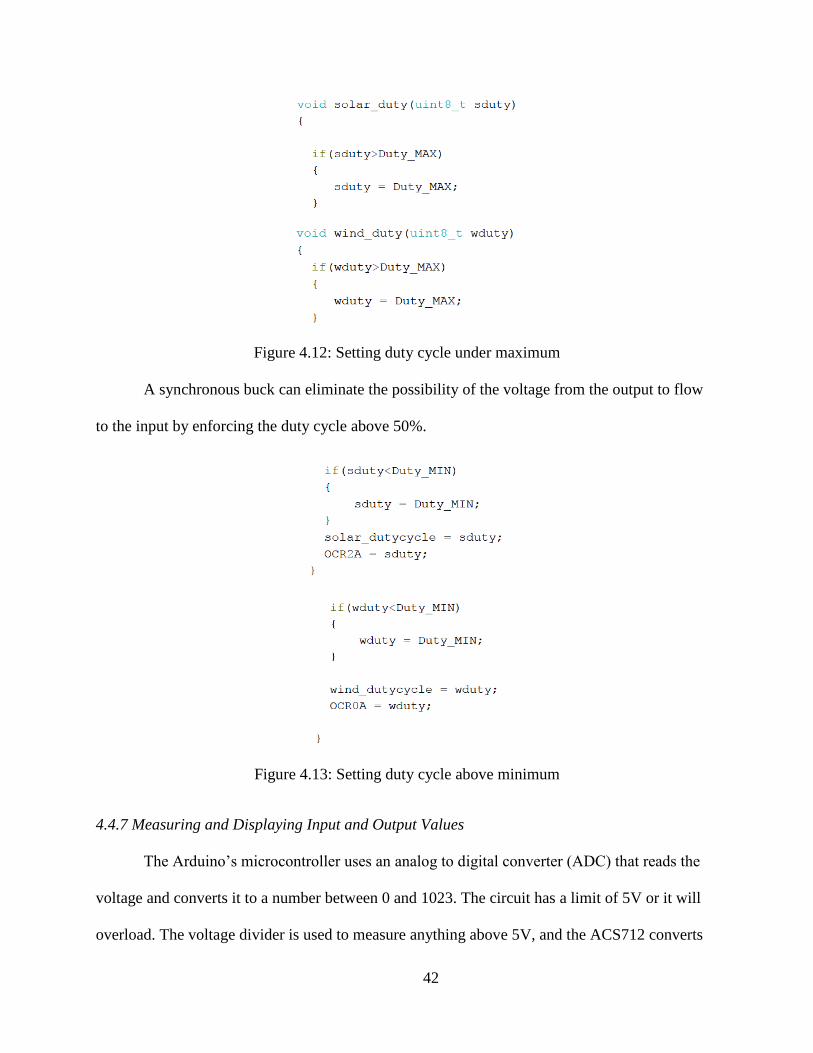
4.4.6 Configuring Duty Cycle for DC-DC Converters
Both buck converters need off time to keep the bootstrap capacitor for the upper
MOSFET charged, so the duty cycle is set below 100% to ensure the capacitor is charged. If the
bootstrap capacitor is not charged, the gate will turn off, creating a partially conducting state.
42
Figure 4.12: Setting duty cycle under maximum
A synchronous buck can eliminate the possibility of the voltage from the output to flow
to the input by enforcing the duty cycle above 50%.
Figure 4.13: Setting duty cycle above minimum
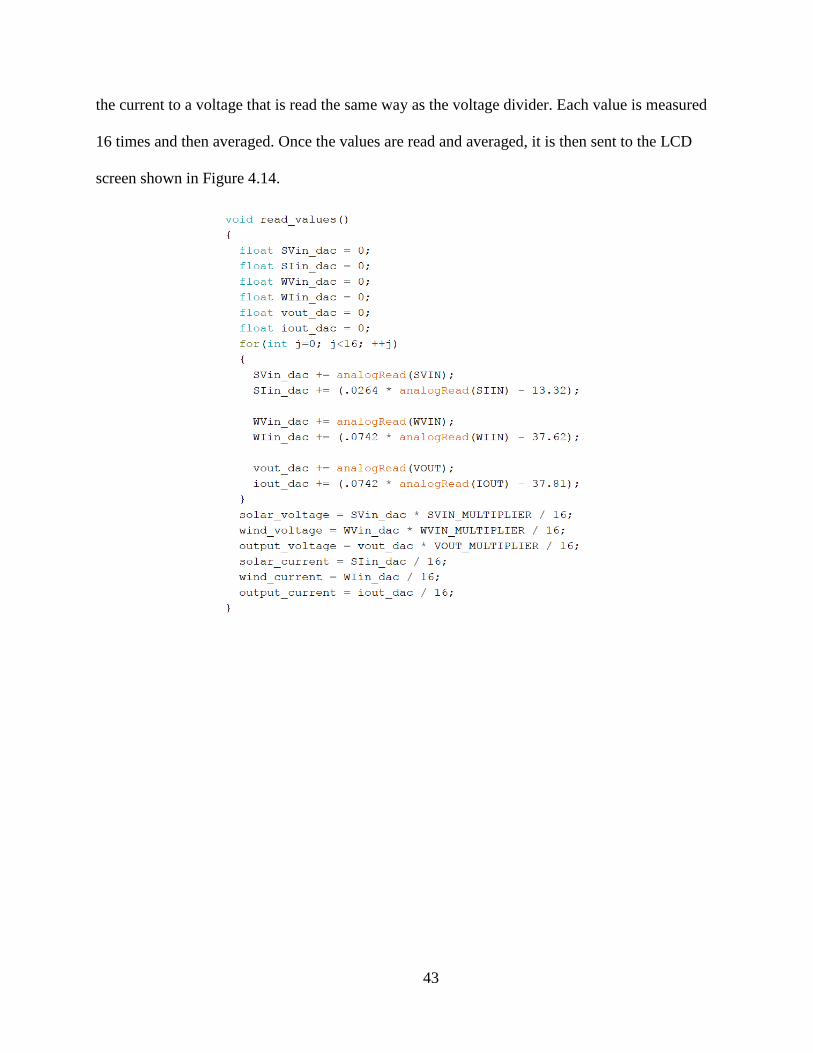
4.4.7 Measuring and Displaying Input and Output Values
The Arduino’s microcontroller uses an analog to digital converter (ADC) that reads the
voltage and converts it to a number between 0 and 1023. The circuit has a limit of 5V or it will
overload. The voltage divider is used to measure anything above 5V, and the ACS712 converts
43
the current to a voltage that is read the same way as the voltage divider. Each value is measured
16 times and then averaged. Once the values are read and averaged, it is then sent to the LCD
screen shown in Figure 4.14.

44
Figure 4.14: Measuring and displaying measured values
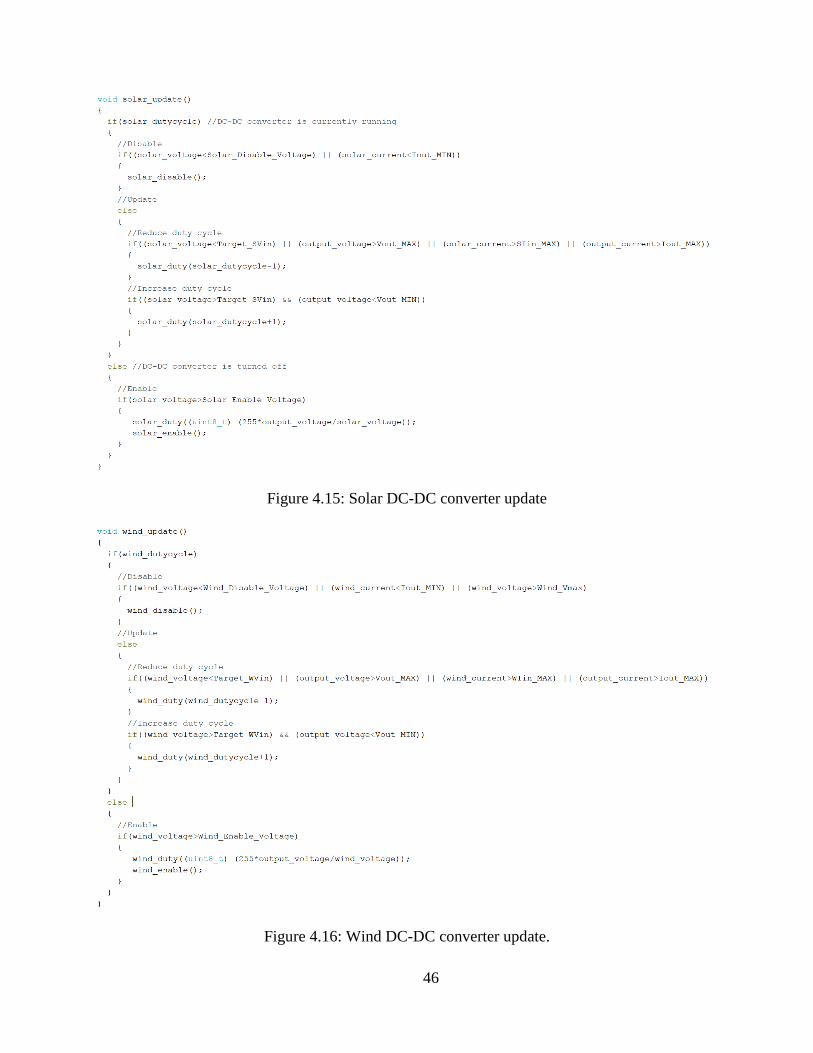
4.4.8 Updating Solar and Wind DC-DC Converter
The Arduino begins the loop by reading the input and output values and then updating the
controller for the wind and solar DC-DC converters based on the values. The Arduino decides to
enable, disable, or update the duty cycle based on the state that the controller is in and the
input/output values read.
Wind and solar are nearly identical in the program design for disabling, enabling, and
updating the duty cycle. The wind DC-DC converter has an additional condition if the turbine is

45
producing more than 50V. The controller will disable the circuit and send it to the dump load
resistors; this is to protect the components that are sensitive to voltages above 50V.
The Arduino begins by determining that the DC-DC converters are operating. If they are
operating, then it will disable the DC-DC converters if the solar and wind voltages are less than
their respective disable voltages, or the current is below the output’s minimum. If the operating
conditions are met, then the controller checks: 1) if the input voltages are less than the target
voltages, 2) if the output is greater than the output limit, 3) if the input current is greater than the
input maximum or 4) if the output current is greater than the output maximum. If one or more of
these conditions are met, it will reduce the duty cycle by one until the desired output is met. If
the voltages are greater than the target voltages and the output voltage is less than the minimum
limit, then it will increase the duty cycle by one until the desired output is met.
The Arduino will enable the DC-DC converters if previously disabled and the input is
greater than the enable voltage. When in the enable state, it will measure and update the duty
cycle by multiplying 255 by the output voltages over the input voltages. This is shown in Figures
4.15 and 4.16.
46
Figure 4.15: Solar DC-DC converter update
Figure 4.16: Wind DC-DC converter update.
47
CHAPTER 5
TESTING AND ANALYSIS
5.1 Introduction
The testing methods and results will be discussed in this chapter. A bench test was
preformed to ensure the hybrid MPPT design and logic performs correctly. To simulate the solar
panel and wind turbine, two bench power supplies were used to feed each part of the circuit. The
battery is simulated by a constant current electronic load referenced in Section 3.2.13. This
allows the current to draw from the power supplies, simulating a battery accepting charge.
Efficiency is calculated to judge how well the hybrid MPPT controller is performing. To
calculate for efficiency (η), the output power (W) is compared to the input power (W) as is
shown in Equation 5.1.
𝜂 = 100% × 𝑃𝑜𝑢𝑡
𝑃𝑖𝑛
Equation 5.1: Power efficiency equation [39]
The test equipment used has a limit of 60W, therefore, a down sized circuit was used to
test the design and logic of the controller. The components and design are the same except for
the inductors and capacitors for the DC-DC converters. Using the equations from Section 4.2 to
calculate the minimum capacitance and inductance needed to construct the down sized hybrid
controller, a 100 µH inductor and capacitor 680 µF was used for both the solar and wind circuits.
The output and input voltage conditions changed to fit the limits of the test equipment.
The 13.8 output voltage reflects a 12V battery’s charge voltage. The 5A maximum limit
is the maximum amount of current the power supplies can produce. A 12V rated solar panel
produces 18V when exposed to light. The same conditions were used for the wind turbine.
48
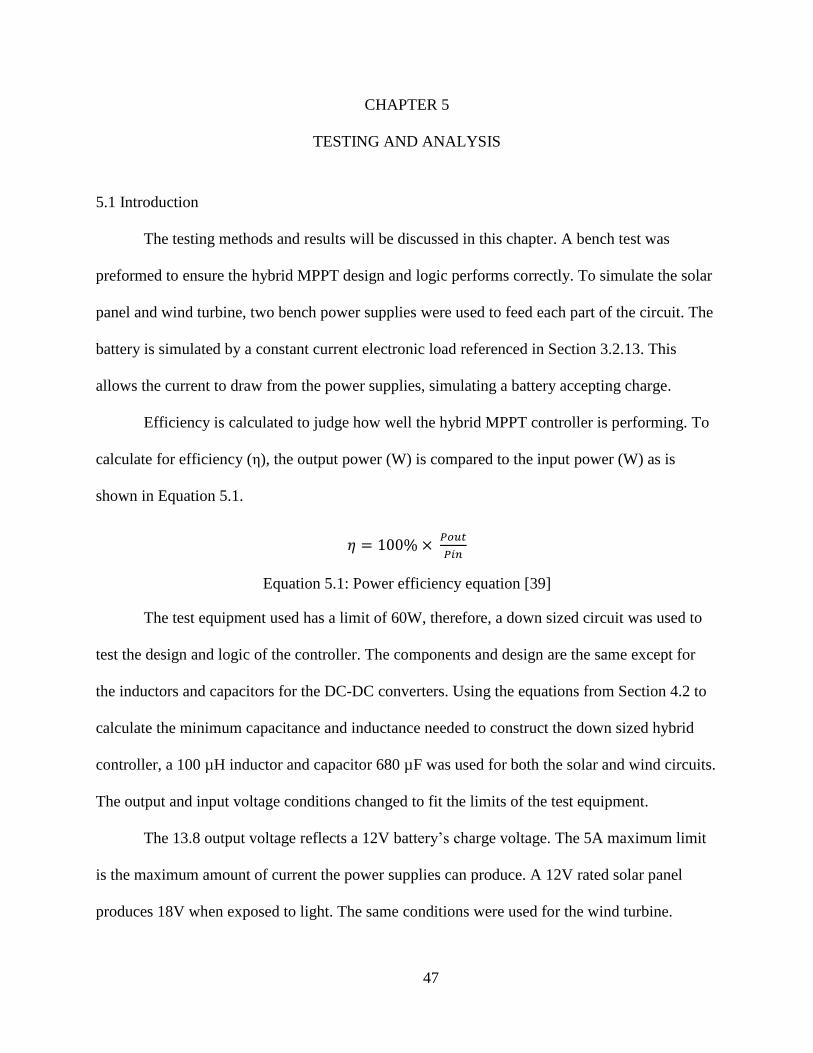
Figure 5.1: Changed limits for controller
To capture the signal generated from the controller, the RIGOL DS1054 oscilloscope was
used. In addition to the oscilloscope, the FLIR DM93 digital multi-meter (DMM) was
implemented to calibrate the exact voltage and current readings reflected on the LCD display
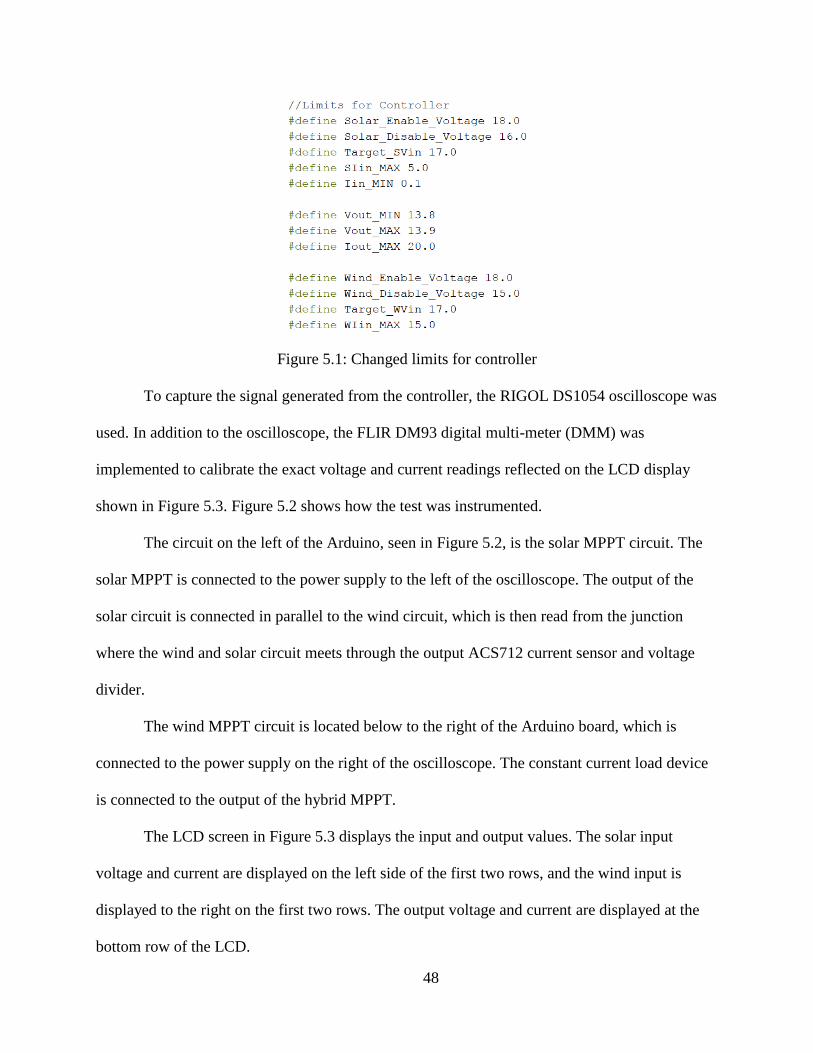
shown in Figure 5.3. Figure 5.2 shows how the test was instrumented.
The circuit on the left of the Arduino, seen in Figure 5.2, is the solar MPPT circuit. The
solar MPPT is connected to the power supply to the left of the oscilloscope. The output of the
solar circuit is connected in parallel to the wind circuit, which is then read from the junction
where the wind and solar circuit meets through the output ACS712 current sensor and voltage
divider.
The wind MPPT circuit is located below to the right of the Arduino board, which is
connected to the power supply on the right of the oscilloscope. The constant current load device
is connected to the output of the hybrid MPPT.
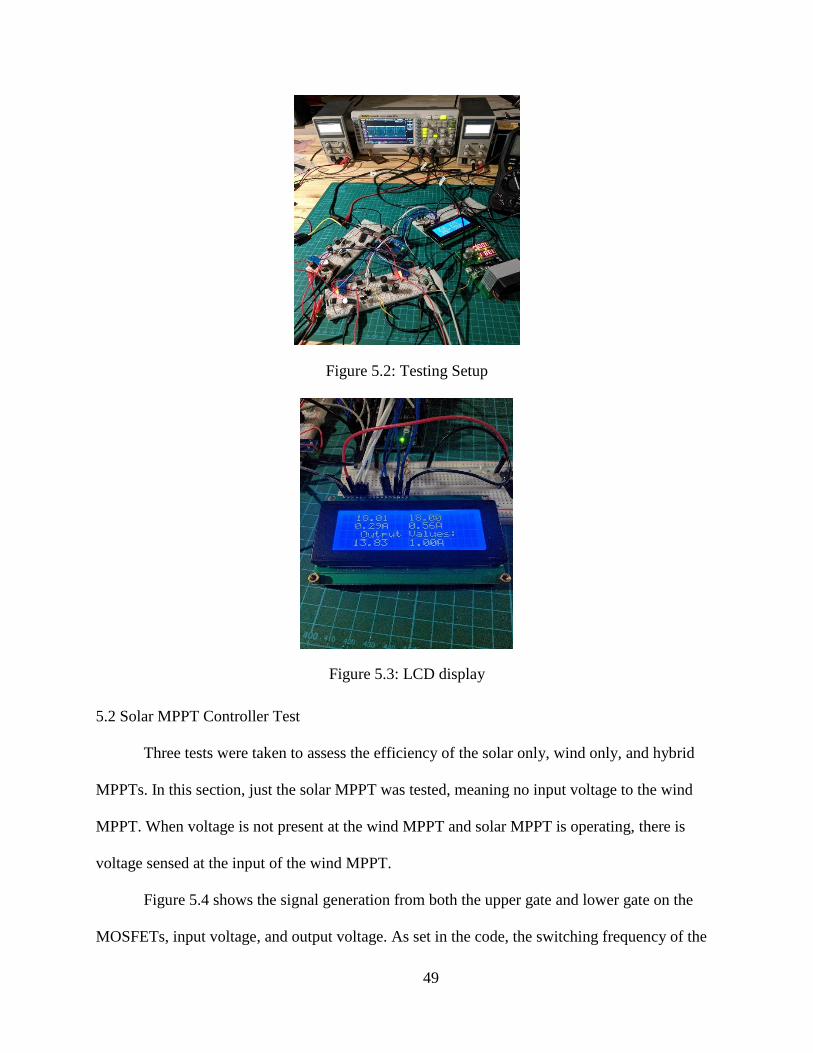
The LCD screen in Figure 5.3 displays the input and output values. The solar input
voltage and current are displayed on the left side of the first two rows, and the wind input is
displayed to the right on the first two rows. The output voltage and current are displayed at the
bottom row of the LCD.
49
Figure 5.2: Testing Setup
Figure 5.3: LCD display
5.2 Solar MPPT Controller Test
Three tests were taken to assess the efficiency of the solar only, wind only, and hybrid
MPPTs. In this section, just the solar MPPT was tested, meaning no input voltage to the wind
MPPT. When voltage is not present at the wind MPPT and solar MPPT is operating, there is
voltage sensed at the input of the wind MPPT.
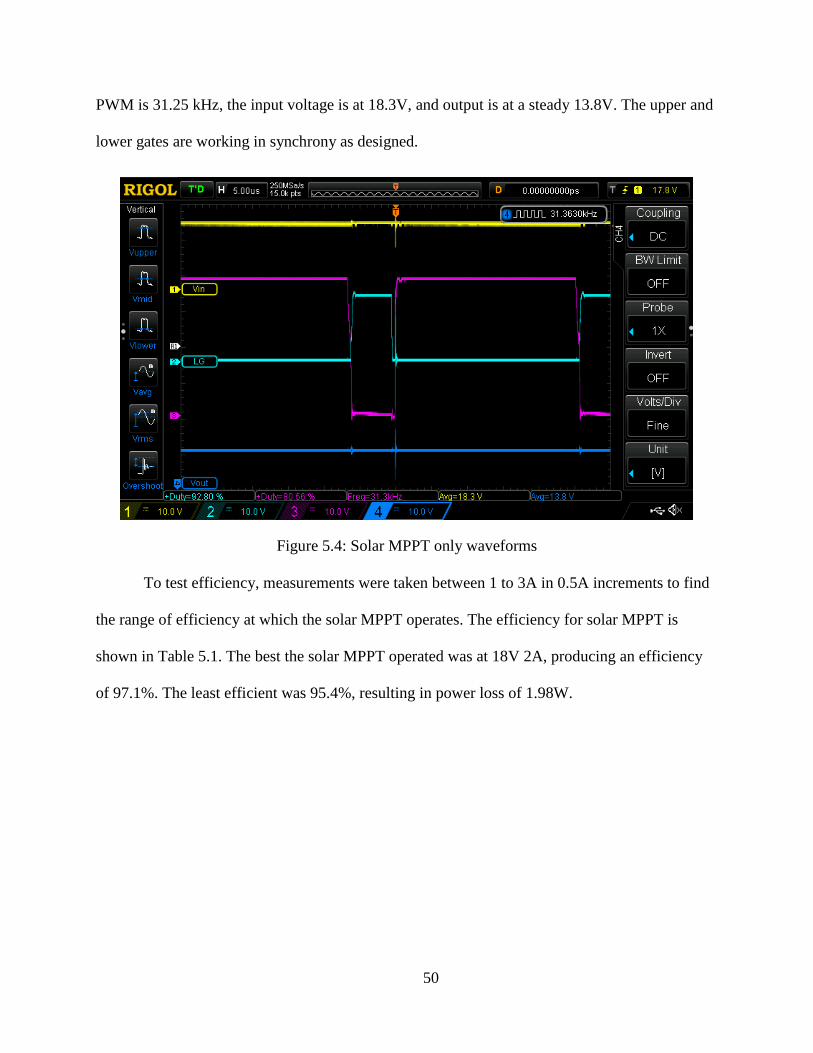
Figure 5.4 shows the signal generation from both the upper gate and lower gate on the
MOSFETs, input voltage, and output voltage. As set in the code, the switching frequency of the
50
PWM is 31.25 kHz, the input voltage is at 18.3V, and output is at a steady 13.8V. The upper and
lower gates are working in synchrony as designed.
Figure 5.4: Solar MPPT only waveforms
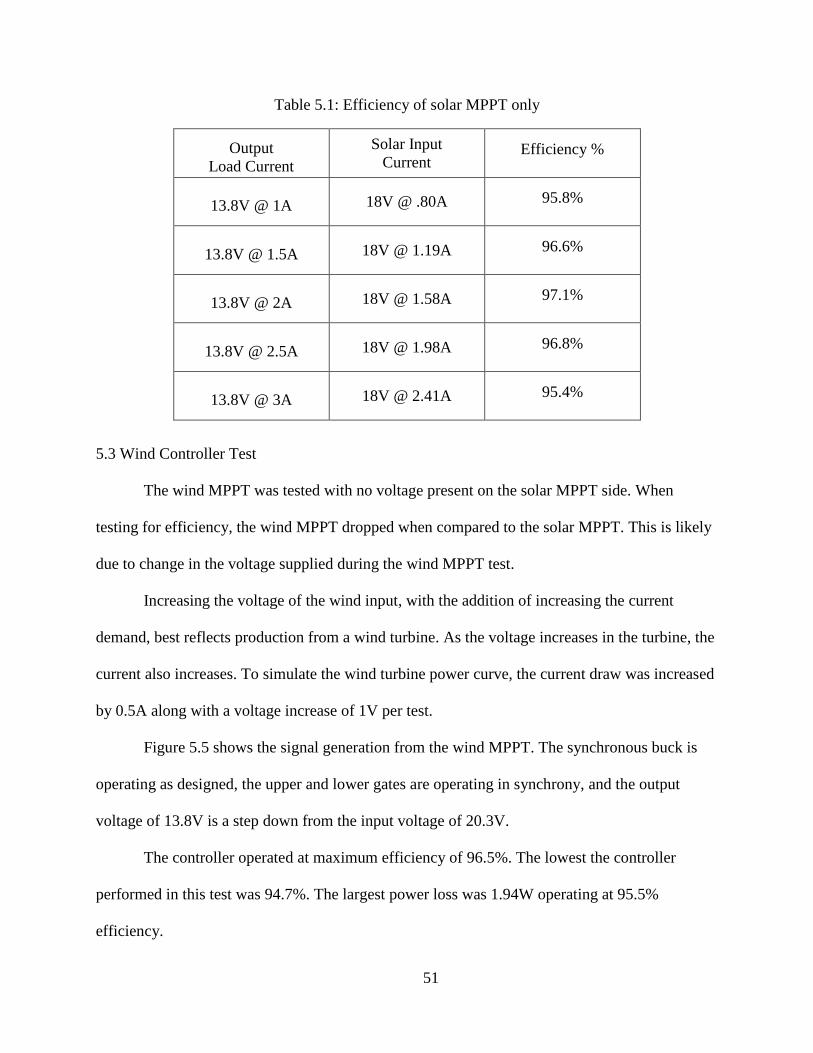
To test efficiency, measurements were taken between 1 to 3A in 0.5A increments to find
the range of efficiency at which the solar MPPT operates. The efficiency for solar MPPT is
shown in Table 5.1. The best the solar MPPT operated was at 18V 2A, producing an efficiency
of 97.1%. The least efficient was 95.4%, resulting in power loss of 1.98W.
51
Table 5.1: Efficiency of solar MPPT only
Output
Load Current
Solar Input
Current Efficiency %
13.8V @ 1A 18V @ .80A 95.8%
13.8V @ 1.5A 18V @ 1.19A 96.6%
13.8V @ 2A 18V @ 1.58A 97.1%
13.8V @ 2.5A 18V @ 1.98A 96.8%
13.8V @ 3A 18V @ 2.41A 95.4%
5.3 Wind Controller Test
The wind MPPT was tested with no voltage present on the solar MPPT side. When
testing for efficiency, the wind MPPT dropped when compared to the solar MPPT. This is likely
due to change in the voltage supplied during the wind MPPT test.
Increasing the voltage of the wind input, with the addition of increasing the current
demand, best reflects production from a wind turbine. As the voltage increases in the turbine, the
current also increases. To simulate the wind turbine power curve, the current draw was increased
by 0.5A along with a voltage increase of 1V per test.
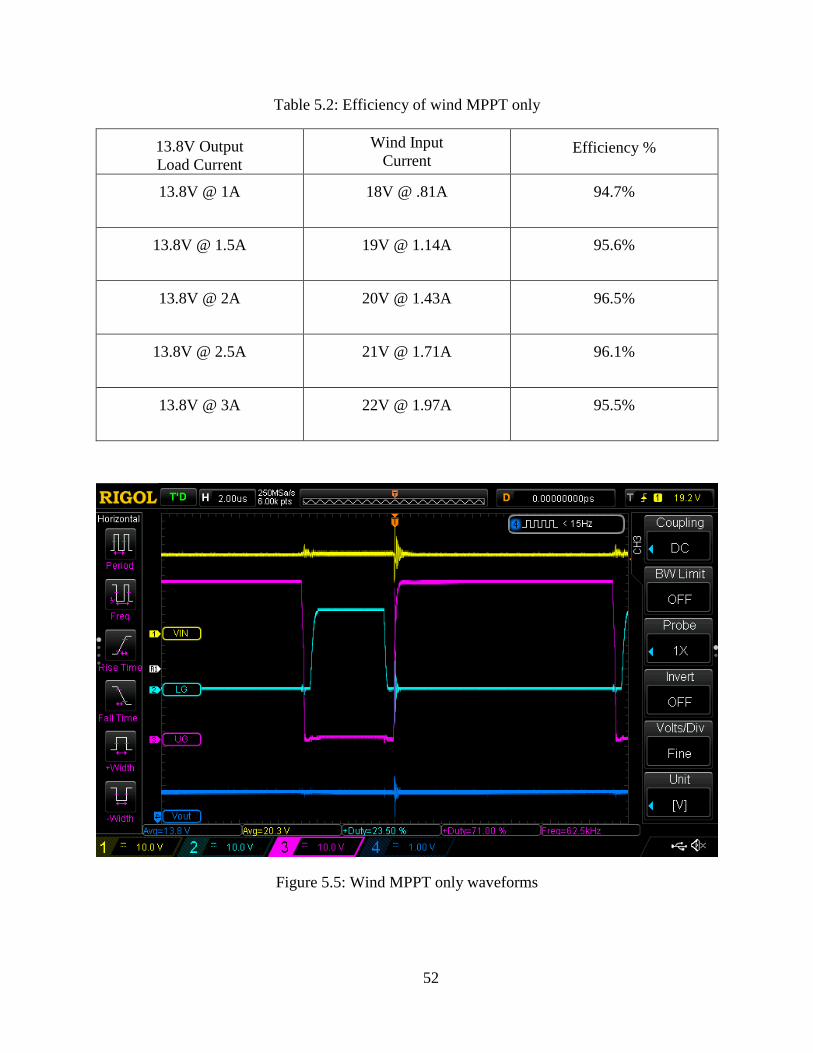
Figure 5.5 shows the signal generation from the wind MPPT. The synchronous buck is
operating as designed, the upper and lower gates are operating in synchrony, and the output
voltage of 13.8V is a step down from the input voltage of 20.3V.
The controller operated at maximum efficiency of 96.5%. The lowest the controller
performed in this test was 94.7%. The largest power loss was 1.94W operating at 95.5%
efficiency.
52
Table 5.2: Efficiency of wind MPPT only
13.8V Output
Load Current
Wind Input
Current Efficiency %
13.8V @ 1A 18V @ .81A 94.7%
13.8V @ 1.5A 19V @ 1.14A 95.6%
13.8V @ 2A 20V @ 1.43A 96.5%
13.8V @ 2.5A 21V @ 1.71A 96.1%
13.8V @ 3A 22V @ 1.97A 95.5%
Figure 5.5: Wind MPPT only waveforms
53
5.4 Hybrid Controller Test
When running the test on the hybrid MPPT controller, more current was drawn from the
wind power supply input than the solar power supply. This is sufficient for simulation purposes,
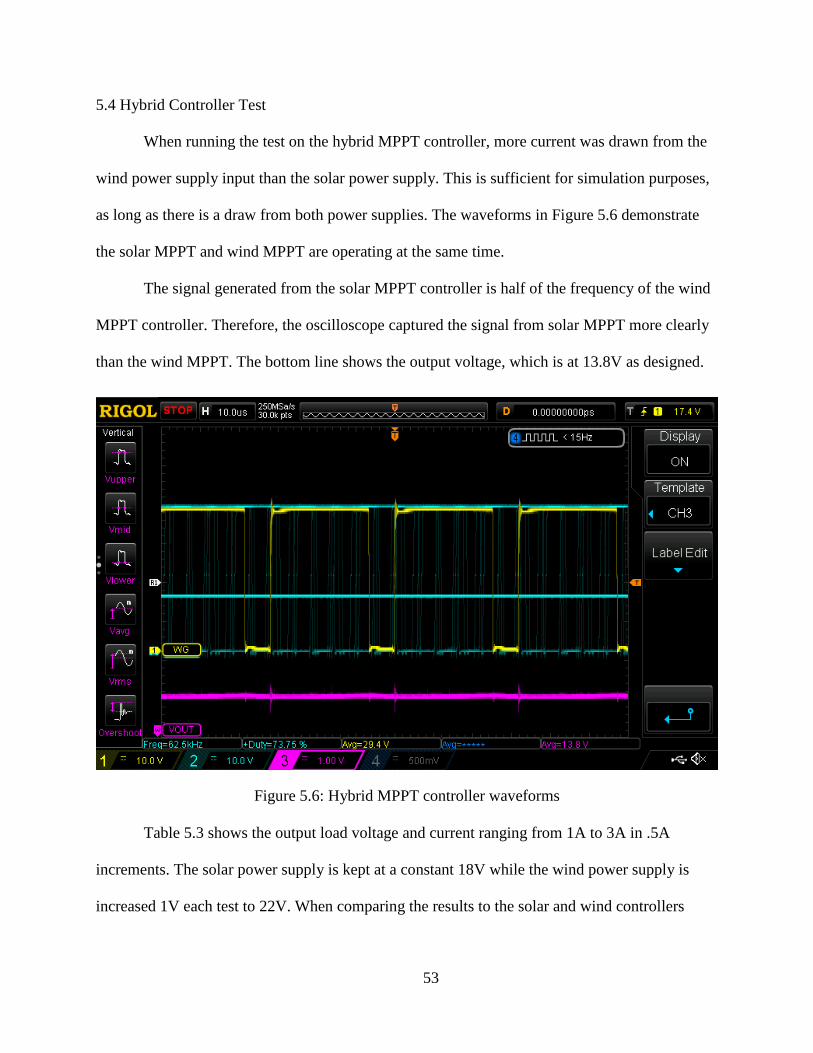
as long as there is a draw from both power supplies. The waveforms in Figure 5.6 demonstrate
the solar MPPT and wind MPPT are operating at the same time.
The signal generated from the solar MPPT controller is half of the frequency of the wind
MPPT controller. Therefore, the oscilloscope captured the signal from solar MPPT more clearly
than the wind MPPT. The bottom line shows the output voltage, which is at 13.8V as designed.
Figure 5.6: Hybrid MPPT controller waveforms
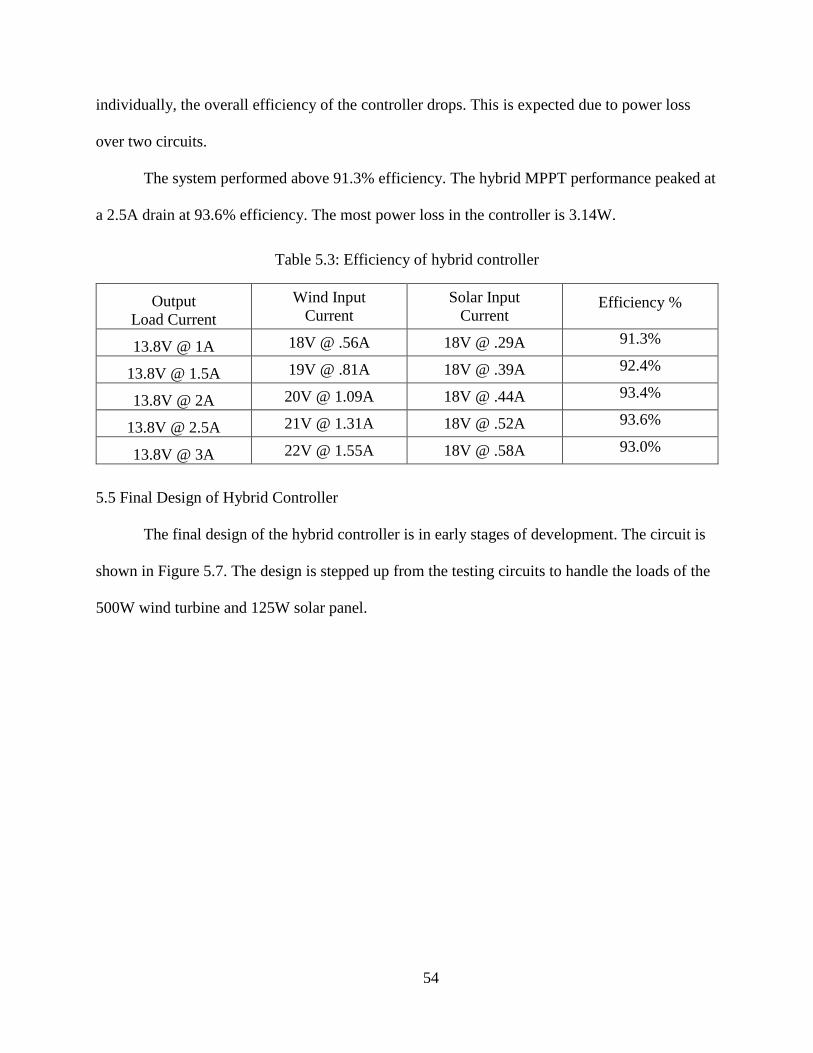
Table 5.3 shows the output load voltage and current ranging from 1A to 3A in .5A
increments. The solar power supply is kept at a constant 18V while the wind power supply is
increased 1V each test to 22V. When comparing the results to the solar and wind controllers
54
individually, the overall efficiency of the controller drops. This is expected due to power loss
over two circuits.
The system performed above 91.3% efficiency. The hybrid MPPT performance peaked at
a 2.5A drain at 93.6% efficiency. The most power loss in the controller is 3.14W.
Table 5.3: Efficiency of hybrid controller
Output
Load Current
Wind Input
Current
Solar Input
Current Efficiency %
13.8V @ 1A 18V @ .56A 18V @ .29A 91.3%
13.8V @ 1.5A 19V @ .81A 18V @ .39A 92.4%
13.8V @ 2A 20V @ 1.09A 18V @ .44A 93.4%
13.8V @ 2.5A 21V @ 1.31A 18V @ .52A 93.6%
13.8V @ 3A 22V @ 1.55A 18V @ .58A 93.0%
5.5 Final Design of Hybrid Controller
The final design of the hybrid controller is in early stages of development. The circuit is
shown in Figure 5.7. The design is stepped up from the testing circuits to handle the loads of the
500W wind turbine and 125W solar panel.
55
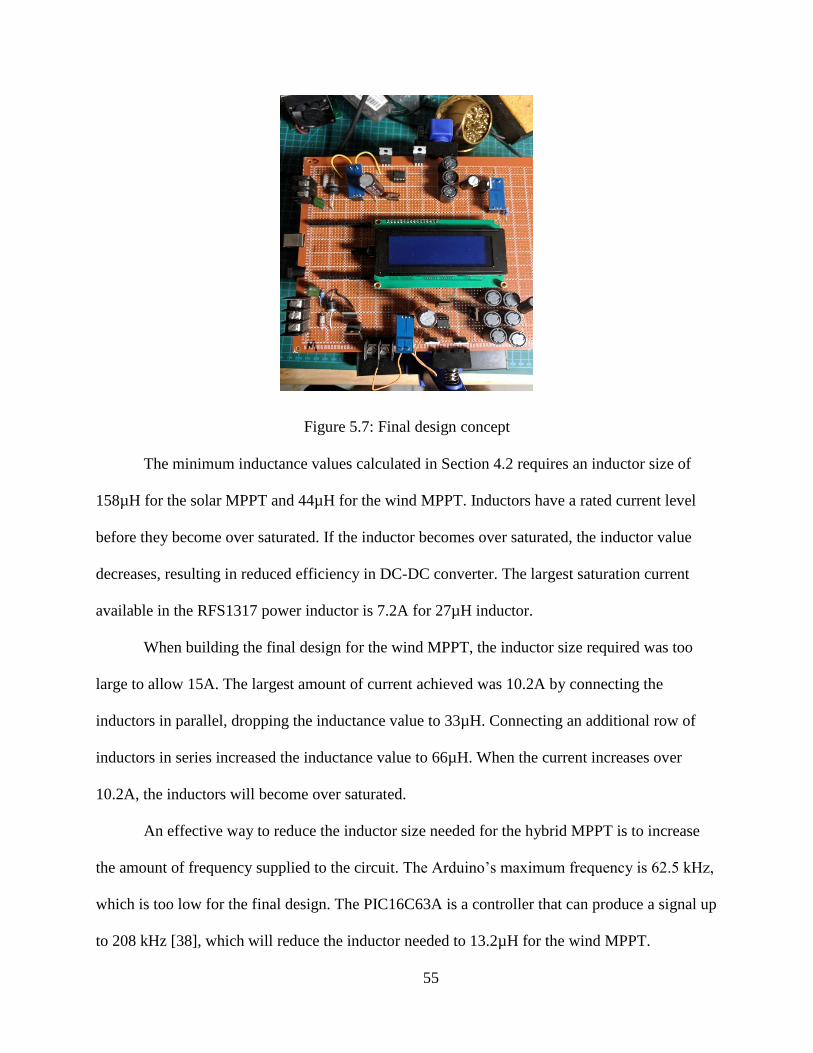
Figure 5.7: Final design concept
The minimum inductance values calculated in Section 4.2 requires an inductor size of
158µH for the solar MPPT and 44µH for the wind MPPT. Inductors have a rated current level
before they become over saturated. If the inductor becomes over saturated, the inductor value
decreases, resulting in reduced efficiency in DC-DC converter. The largest saturation current
available in the RFS1317 power inductor is 7.2A for 27µH inductor.
When building the final design for the wind MPPT, the inductor size required was too
large to allow 15A. The largest amount of current achieved was 10.2A by connecting the
inductors in parallel, dropping the inductance value to 33µH. Connecting an additional row of
inductors in series increased the inductance value to 66µH. When the current increases over
10.2A, the inductors will become over saturated.
An effective way to reduce the inductor size needed for the hybrid MPPT is to increase
the amount of frequency supplied to the circuit. The Arduino’s maximum frequency is 62.5 kHz,
which is too low for the final design. The PIC16C63A is a controller that can produce a signal up
to 208 kHz [38], which will reduce the inductor needed to 13.2µH for the wind MPPT.
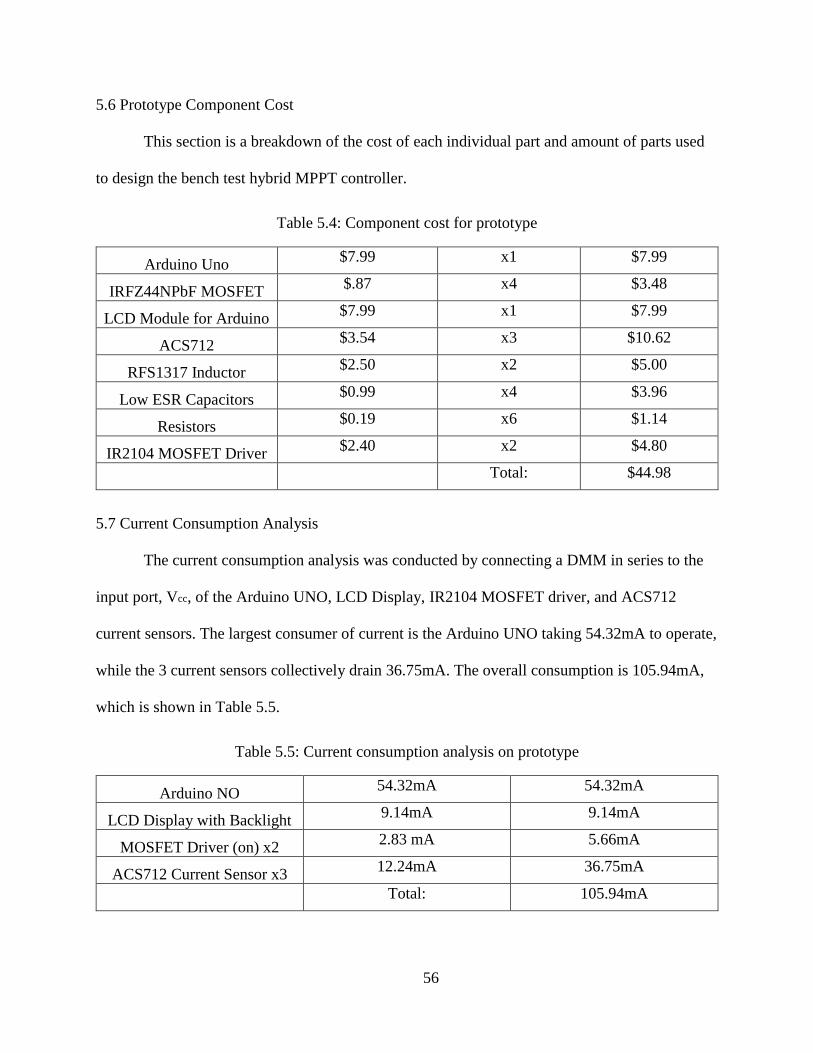
56
5.6 Prototype Component Cost
This section is a breakdown of the cost of each individual part and amount of parts used
to design the bench test hybrid MPPT controller.
Table 5.4: Component cost for prototype
Arduino Uno $7.99 x1 $7.99
IRFZ44NPbF MOSFET $.87 x4 $3.48
LCD Module for Arduino $7.99 x1 $7.99
ACS712 $3.54 x3 $10.62
RFS1317 Inductor $2.50 x2 $5.00
Low ESR Capacitors $0.99 x4 $3.96
Resistors $0.19 x6 $1.14
IR2104 MOSFET Driver $2.40 x2 $4.80
Total: $44.98
5.7 Current Consumption Analysis
The current consumption analysis was conducted by connecting a DMM in series to the
input port, Vcc, of the Arduino UNO, LCD Display, IR2104 MOSFET driver, and ACS712
current sensors. The largest consumer of current is the Arduino UNO taking 54.32mA to operate,
while the 3 current sensors collectively drain 36.75mA. The overall consumption is 105.94mA,
which is shown in Table 5.5.
Table 5.5: Current consumption analysis on prototype
Arduino NO 54.32mA 54.32mA
LCD Display with Backlight 9.14mA 9.14mA
MOSFET Driver (on) x2 2.83 mA 5.66mA
ACS712 Current Sensor x3 12.24mA 36.75mA
Total: 105.94mA
57
CHAPTER 6
CONCLUSION AND FUTURE WORK
Renewable systems are becoming more affordable with better options than fuel
generation in micro-systems, not only for the environment, but also the cost of operation. Fuel
generators need to be replenished with fuel and oil, while renewable systems take advantage of
the energy provided by the wind and sun.
Developing a hybrid MPPT controller takes the advantage of solar and wind energy
sources. The ability to control two systems with one controller is better for an overall production
of energy, cost, and manageability at a slight expense to the efficiency. The hybrid MPPT
performed at a maximum of 93.6%, while the individual controller operated at a maximum
97.1% efficiency. The overall cost of the bench test controller was $44.98, consuming only
105.94mA.
When implementing the controller to manage the 500W wind turbine and 125W solar
panel, the inductor size is too large due to the frequency provided by the Arduino. Using a
different microcontroller like the PIC16C63A produces a much faster frequency, which will
reduce the inductor size needed and allow more current before saturation.
Wind turbines do not operate at optimal power production consistently, i.e., the wind
speed can change at any given moment. Developing a buck-boost converter for the wind MPPT
controller would take advantage of both the lower and higher wind speeds. Though the overall
efficiency is less than that of a concentrated buck or boost controller, it would have more
potential to produce power.
58
REFERENCES
[1] IRENA, “The Power to Change: Solar and Wind Cost Reduction Potential to 2025”, June
2016.
[2] F. Kreith, Principles of sustainable energy systems, 2nd Edition. Boca Raton, FL: CRC Press,
2014.
[3] G. Masters, “Photovoltaic Materials and Electrical Characteristics” Renewable and Efficient
Electric Power Systems, 2nd Edition. IEEE Press, 2013, cp. 5, pp 253-308.
[4] J. Duffie, W. Beckman, Solar Engineering of Thermal Processes, 4th Edition. Hoboken, NJ:
John Wiley & Sons, Inc., 2013.
[5] “How to Design Battery Charger Applications that Require External Microcontrollers and
Related System-Level Issues”, Maxim Integrated. Available:
https://www.maximintegrated.com/en/app-notes/index.mvp/id/680 [Accessed 15 July 2017].
[6] S. Maniktala, Switching Power Supplies A-Z, 2nd Edition. Waltham, MA: Elsvier, Ltd. 2012,
ch.2, pp. 61-120.
[7] R. Severns, G. Bloom, Modern DC-to-DC Switch Mode Power Converter Circuits. Van
Nostrand Reinhold Company Inc., 1985, cp. 5 & 6 , pp.112-150.
[8] “Step Down Buck Regulator / Converter”, Radio-Electronics [Online]. Available:
http://www.radio-electronics.com/info/power-management/switching-mode-power-supply/step-
down-buck-regulator-converter-basics.php [Accessed 17 July 2017].
[9] “Step Up Boost Regulator / Converter”, Radio-Electronics [Online]. Available:
http://www.radio-electronics.com/info/power-management/switching-mode-power-supply/step-
up-boost-regulator-converter-basics.php [Accessed 17 July 2017].
59
[10] “Buck-Boost Regulator or DC-DC Converter”, Radio-Electronics [Online]. Available:
http://www.radio-electronics.com/info/power-management/switching-mode-power-supply/dc-dc-
buck-boost-regulator-converter-basics.php [Accessed 17 July 2017].
[11] Azevedo, J., Mendoca. F., "Small scale wind energy harvesting with maximum power
tracking," AIMS Energy, Vol.3 no.3 pp.297-315. DOI: 10.3934/energy.2015.3.297, July 2015.
[12] Choudhary, D., Sexana, A.R.”DC-DC Buck-Converter for MPPT of PV System,”
International Journal of Emerging Technology and Advanced Engineering, 2014.
[13] Mittal, A, Arora, K.,”Control of Wind Energy by Using Buck-Boost Converter,”
International Journal of Emerging Technology and Advanced Engineering, 2015.
[14] Ambia, M.N., Islam, M.K., Shoeb, M.A., Maruf, M.N.I., Mohsin, A.S.M. "An analysis & design
on micro generation of a domestic solar-wind hybrid energy system for rural & remote areas -
perspective Bangladesh," 2nd International Conference on Mechanical and Electronics Engineering
(ICMEE), 2010, vol.2, pp.V2-107-V2-110, 1-3 Aug. 2010.
[15] Dali, M., Belhadj, J., Roboam, X., Blaquiere, J.M. "Control and energy management of a wind-
photovoltaic hybrid system," 2007 European Conference on Power Electronics and Applications,
pp.1-10, 2-5 Sept. 2007.
[16] Fontes, N., Roque, A., Maia, J. "Micro generation — Solar and wind hybrid system," 5th
International Conference on European Electricity Market, 2008, pp.1-5, 28-30 May 2008.
[17] Yang, H., Zhou, W., Lu, L., Fang. Z. “Optimal sizing method for stand-alone hybrid solar-wind
with LPSP technology by using genetic algorithm,” Solar Energy 2007, pp. 354-367, 2008.
[18] “Secrets of PWM”, Arduino [Online]. Available:
https://www.arduino.cc/en/Tutorial/SecretsOfArduinoPWM [Accessed 15 August 2017].
[19] “Arduino Uno R3”, Robomart [Online]. Available: https://www.robomart.com/arduino-uno-
online-india [Accessed 16 August 2017].
60
[20] “Analog Input Pins”, Arduino [Online]. Available:
https://www.arduino.cc/en/Tutorial/AnalogInputPins [Accessed 16 August 2017].
[21] “Voltage Dividers”, Sparkfun [Online]. Available
https://learn.sparkfun.com/tutorials/voltage-dividers [Accessed 12 October 2017].
[22] Allegro MicroSystems, “Fully Integrated, Hall Effect-Based Linear Current Sensor IC with
2.1 kVRMS Isolation and a Low-Resistance Current Conductor,” ACS712 datasheet, Nov. 2015
[Revised June 2017].
[23] “ACS712 Current Detection Sensor”, Lynx.2105.wordpress [Online]. Available:
https://lynx2015.wordpress.com/2016/08/15/sensing-current-with-asc712-connected-to-
arduino/asc712-current-detection-sensor/ [Accessed 16 August 2017].
[24] International Rectifier, “IRFZ44NPdf HEXFET Power MOSFET,” IRFZ44NPbF datasheet,
Aug. 2010.
[25] International Rectifier, “IR2104(S)&(PbF) Half Bridge Drive,” IR2104 datasheet, Apr.
2004.
[26] “Understanding ESR in Electrolytic Capacitor”, AVNET [Online]. Available:
https://www.avnet.com/wps/portal/abacus/resources/engineers-insight/article/understanding-esr-
in-electrolytic-capacitors [Accessed 17 August 2017]
[27] Coilcraft, “Shield Power Inductors – RFS1317 Series,” RFS1317 datasheet, Aug. 2017.
[28] Vishay General Semiconductor, “Photovoltaic Solar Cell Protection Schottky Rectifier”
VSB2045 datasheet, Nov. 2013.
[29] “896”, Mouser [Online]. Available: http://www.mouser.com/ds/2/378/896-1886.pdf
[Accessed 13 October 2017]
61
[30] “Solar Panel - Monocrystalline - 24 - 125W”, Alekoproducts.com. Available:
http://www.alekoproducts.com/ALEKO-Solar-Panel-125-Watt-24-Volt-Monocrystallin-
p/sp125w24v-ap.htm%20,- [Accessed 13 October 2017].
[31] “Missouri Basic 500 Watt 5 Blade Wind Turbine,” Mwands [Online] Available:
http://mwands.com/store/wind-turbine-products/wind-turbine-generators/500-watt-5-blade-basic
[Accessed 14 October 2017].
[32] “60W Constant Current Electronic Load Batter Capacity Tester,” Land-Boards [Online]
Available: http://land-
boards.com/blwiki/index.php?title=60W_Constant_Current_Electronic_Load_Battery_Capacity_
Tester [Accessed 14 October 2017].
[33] “Wind Turbine Dump and Diversion Loads: What They Do and How to Choose the Right
System”, Windynation.com. Available: https://www.windynation.com/jzv/inf/wind-turbine-
dump-and-diversion-loads-what-they-do-and-how-choose-right-s [Accessed 13 October 2017]
[34] ON Semiconductor, “LC selection Guide for the DC-DC synchronous Buck Converter,”
Apr. 2013.
[35] “Calculation Current Ratings of Photovolatic Modules”, ECMWeb.com. Available:
http://www.ecmweb.com/green-building/calculating-current-ratings-photovoltaic-modules
[Accessed 18 October 2017].
[36] Hauke, B. “Basic Calculations of a Buck Converter’s Power Stage,” Texas Instruments,
Dec. 2011 [Revised Aug. 2015]
[37] Atmel, “ATMega328/P” ATMega328/P datasheet, Nov. 2016.
[38] MICROCHIP, “8-Bit CMOS Microcontrollers with A/D Converter”
PIC16C63A/65B/73B/74B datasheet, Nov. 2012.

62
[39] “Electric Power Efficiency”, RapidTables [Online]. Available:
http://www.rapidtables.com/electric/efficiency.htm [Accessed 11/1/2017].