Embed Size (px)
Citation preview

Arctic TemperatizationArctic Temperatization: A Preliminary Study of Future Climate Impacts on Agricultural
Opportunities in the Pan-Arctic Drainage Basin
Katelyn Dolan
Dr. Richard B. Lammers -AdvisorDr. Charles J. Vörösmarty -Advisor
UNH Complex Systems Research Center – Water Systems Analysis GroupResearch and Discover - 2006

• Background- Climate change and current northern agriculture
• Methods • Results
– Possible cropland expansion due to climate change– Limitations to cropland expansion and productivity
• Conclusions and Future Studies
Overview

Climate Change and the Pan-ArcticClimate Change and the Pan-Arctic
Stanley Glidden UNH WSAG
• Earths Climate is Changing
• Global Temperatures Predicted to Rise Between 2-4 C in Next 100 years (IPCC)
• Studies suggest that Global Warming could have negative impacts on global crop production especially in tropical regions.
• Look at opportunities for Northern Agriculture Expansion and future constraints

Current State of AgricultureCurrent State of Agriculture
Wheat Production in the Pan-ArcticWheat Production in the Pan-Arctic
0.01- 0.05
0.05 - 0.2
0.20 - 0.40
0.40- 0.66
Cropland Fraction
*Wheat was used as the representative crop for northern latitudes in this study because of its global importance, adaptability to extreme conditions and tolerance to cool weather.

HadleyCM3 -A2HadleyCM3 -A2: The Chosen : The Chosen Scenario and ModelScenario and Model
IPCC(2001)

Methodologies for Climatic DataMethodologies for Climatic Data
AnalysisAnalysisArcticRIMSArcticRIMS
25*25km EASE
HadleyCM3 –A2HadleyCM3 –A2
Contemporary Climatology
(1960-2002)
ArcticRIMS
Future A2 Climatology
(2020, 2050, 2080)
25*25km EASE
Statistical Downscaling
Inverse distance weighted
interpolation
+ Gridded fields from observed station
data
Resampled MODEL Climate Change Data
ArcticRIMSArcticRIMS
(Pan-Arctic Drainage System)(Pan-Arctic Drainage System)
25*25km EASE
Contemporary Climatology (1960-2002)
Gridded fields from observed station
data
2.5*3.75 degree (Coarse) Geographic
IPCC data distribution center
MODEL Global Climate Change Data
25*25km EASE
Pan-Arctic Drainage Basin
Current Gridded Temperature and Current Gridded Temperature and Precipitation Data derived from Precipitation Data derived from ArcticRIMS (1960-2002) + Climate ArcticRIMS (1960-2002) + Climate Change Data From HadleyCM3 (A2) Change Data From HadleyCM3 (A2) Future Pan-Arctic Climate ScenariosFuture Pan-Arctic Climate Scenarios
*climate was looked at using monthly climatology's
=

Growing Degree DaysGrowing Degree Days (GDD)
GDD (C)
0
500
1000
1200
1400
1600
1800
2000
2500
3000
4000
Temperature Source: RIMS (Topographically Adjusted
(1960-2002)
GDD = Sum of temperature for all days above a given base temperature (0c).
*According to the FAO (Food and Agriculture Organization) and MSU (Montana State University) it takes 1600 GDD for Spring Wheat to reach maturity using a 0C base.
*Wheat was used the representative crop for
northern latitudes in this study because of its
adaptability to extreme conditions and tolerance
to cool weather

GDD (C)
0
500
1000
1200
1400
1600
1800
2000
2500
3000
4000
1960-2002

2020 A2
GDD (C)
0
500
1000
1200
1400
1600
1800
2000
2500
3000
4000

2050 A2
GDD (C)
0
500
1000
1200
1400
1600
1800
2000
2500
3000
4000

2080 A2
GDD (C)
0
500
1000
1200
1400
1600
1800
2000
2500
3000
4000

GDD (C)
0
500
1000
1200
1400
1600
1800
2000
2500
3000
4000
1960-2002

2020 A2
GDD (C)
0
500
1000
1200
1400
1600
1800
2000
2500
3000
4000

2050 A2
GDD (C)
0
500
1000
1200
1400
1600
1800
2000
2500
3000
4000

2080 A2
GDD (C)
0
500
1000
1200
1400
1600
1800
2000
2500
3000
4000

Potential Wheat Growing Area Potential Wheat Growing Area Based Only on Minimum Based Only on Minimum
Temperature Requirements Temperature Requirements
2080 Area
1980 Area
Potential New Area
Future Increase of Potential Pan-Arctic cropland (new 2080/1980)
New Area as Percent of Current Global Cropland*
Potentialy Suitable Cropland
Unsuitable
20801980
* Global cropland= 22.1mill/sq/km (Ramankuttey and Foley 1999)
15,900,000
7,400,000
8,500,000
114%
38%
Areas (km2)
Potential Cropland Area

Addition of Soil ConstraintsAddition of Soil ConstraintsUsing FAO guidelines most areas with sever soil drainage and or depth constraints were taken out of potential crop land calculations. In Addition wetlands and open bodies of water were further considered as areas unsuitable for agriculture.
Potentialy Suitable Cropland
Unsuitable
20801980
Potential Cropland Area
2080 Constraints
4,100,000
6,700,000
2,600,000
63%
Total Area 2080
New Area
Future increase of Pan Arctic Cropland
New Potential Area as Percent of Current Global Cropland
(km2)
Temp
Soil
None
Total Area 1980
Potential Cropland Area
11%
7,400,000
15,900,000
8,500,000
114%
38%
Without soil constraints
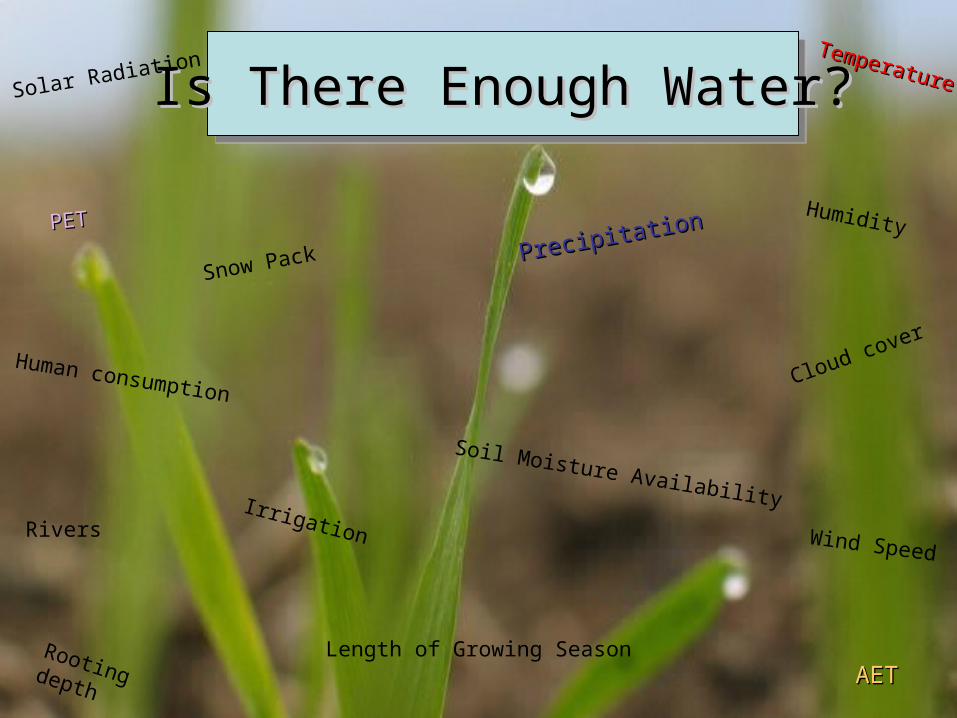
Is There Enough Water?Is There Enough Water?Solar Radiation
Wind Speed
Soil Moisture Availability
TemperatureTemperature
Humidity
Cloud cover
Length of Growing Season
PrecipitationPrecipitation
Human consumption
IrrigationRivers
Rooting depth
Snow Pack
AETAET
PETPET

Change in Precipitation (mm) June, July, August (2080-1980)
-40 -
-20 -
-5 -
5 -
20 -
40 -
75 -
125 -
Water AvailabilityWater Availability
(1980- 2006)
2080
Total Precipitation (mm) June, July, August
(mm)
50 -
100 -
150 -
200 -
250 -
300 -
350 -
Annual increase in Precipitation over Pan-Arctic Drainage Basin (1980-2080)
is 100mm


Vegetation Class (2000)
Change in (AET/PET) 1980-2080
Polar Desert -0.05
Tundra -0.09
Forest/Tundra -0.11
Taiga/Boreal -0.12
Grassland, Steppe and Shrubland -0.24
Deciduous and Mixed Forest -0.17
Change in Water Stress (AET/PET) Change in Water Stress (AET/PET) between 1980 and 2080between 1980 and 2080
Drier
Potential Vegetation Map
Wetter

Water AvailabilityWater AvailabilityExtreme Water StressExtreme Water Stress (AET/PET) <.45 (AET/PET) <.45
Not suitable
Potential growth
1980 Water Stress <.45
2080 Water Stress <.45
Preliminary Results for loss due to extreme water stress
Areas under extreme water stress increase nearly threefold from contemporary time to 2080
Majority of new areas under extreme water stress will be in areas considered suitable for growth in 1980. (Central Asia)
Areas under extreme water stress increase nearly threefold from contemporary time to 2080
Majority of new areas under extreme water stress will be in areas considered suitable for growth in 1980. (Central Asia)
1980
2080
2080 new areas of Under “extreme” water stress
Potential of global current cropland lost due to future water constraints
500,000
1,420,000
920,000
-4%
(km2)
Potentially loss of 25% current cropland

Not suitable
Potential growth
1980 Water Stress <.45
2080 Water Stress <.45
4,100,000
6,700,000
2,600,000
N/A
69%
Total Area 1980
Summary of Potential Cropland Area Change
11%
7,400,000
15,900,000
8,500,000
N/A
114%
38%
Without soil constraints
Total Area 2080
New Area
Potential Area loss
Future increase of Pan-Arctic Cropland
Potential Area increase as Percent of current Global Cropland
3,600,000
5,780,000
2,180,000
-920,000
40%
6%
With soil constraints
Water and soil constraints (AET/PET <0.45)

Conclusion & Future StudiesConclusion & Future Studies
Conclusions-Conclusions-• Based on only temperature requirements areas with enough accumulated
temperature to support crop growth in the Pan-Arctic are going to increase dramatically according to the HadleyCM3-A2 Model.
• Adding soil constraints greatly reduces the potential crop growing area estimates. In Western Canada, northern expansion appears to be limited due to soil constraints not temperature.
• Areas that show greatest drying occur in areas of current crop growth.• Water limits further constrain potential crop growth areas and could greatly
reduce areas under current cultivation.
Future Studies-Future Studies-• Bring more models and future climate scenarios into analysis.• Perform regional studies that combine crop models in areas where potential
change in yield is high (central Asia, Russia). • Further explore full hydrological cycle with potential future irrigation and
human water use in the Pan-Arctic drainage system to see how much agriculture a changing arctic could support.

• Dr. Richard B. Lammers• Stanley Glidden• Mike Routhier• Dr. Charles J. Vörösmarty • Dr. George Hurtt• Mike Rawlins• Dominik Wisser• Dr. Steve Frolking• The Rest of the R&D Crew
A Special Thanks to:A Special Thanks to: