Embed Size (px)
Citation preview

PLANNING AND EVALUATION SERVICE
SCHOOL CRIME PATTERNS:
A NATIONAL PROFILE OF U.S. PUBLIC HIGH SCHOOLS USING RATES OF CRIME
REPORTED TO POLICE
REPORT ON THE STUDY ON SCHOOL VIOLENCE AND PREVENTION
U.S. DEPARTMENT OF EDUCATION DOC #2001-37


SCHOOL CRIME PATTERNS:
A NATIONAL PROFILE OF U.S. PUBLIC HIGH SCHOOLS
USING RATES OF CRIME REPORTED TO POLICE
REPORT ON THE STUDY ON
SCHOOL VIOLENCE AND PREVENTION
Prepared for:
U.S. Department of Education Contract No. EA96055001
Prepared by:
David Cantor Mareena McKinley Wright
Westat
1650 Research Boulevard Rockville, MD 20850
In affiliation with:
Gottfredson Associates, Inc. 3239 B Corporate Court Ellicott City, MD 21042

This report was prepared for the U.S. Department of Education under Contract No. EA96055001. The project monitor was Joanne Wiggins in the Planning and Evaluation Service. The views expressed herein are those of the contractor. No official endorsement by the U.S. Department of Education is intended or should be inferred. U.S. Department of Education Rod Paige Secretary Planning and Evaluation Service Alan L. Ginsburg Director Elementary and Secondary Education Division Ricky Takai Director August 2002 This report is in the public domain. Authorization to produce it in whole or in part is granted. While permission to reprint this publication is not necessary, the citation should be the following: Cantor, D. and Wright, M. M. (2001). School Crime Patterns: A National Profile of U.S. Public High Schools Using Rates of Crime Reported to Police. Report on the Study of School Violence and Prevention. Washington, DC: U.S. Department of Education, Planning and Evaluation Service. To order copies of this report, write ED Pubs Editorial Publications Center U.S. Department of Education P.O. Box 1398 Jessup, MD 20794-1398; via fax, dial (301) 470-1244; or via electronic mail, send your request to [email protected]. You may also call toll-free 1-877-433-7827 (1-877-4-ED-PUBS). If 877 service is not yet available in your area, call 1-800-872-5327 (1-800-USA-LEARN); Those who use a telecommunications device for the deaf (TDD) or a teletypewriter (TTY), should call 8-800-437-0833. To order online, point your Internet browser to www.ed.gov/pubs/edpubs.html. This report is also available on the Department’s web site at www.ed.gov/offices/OESE/SDFS/publications.html. On request, this publication is available in alternate formats, such as Braille, large print, audiotape, or computer diskette. For more information, please contact the Department’s Alternate Format Center at (202) 260-9895 or (202) 205-8113.

School Crime Patterns: A National Profile of U.S. Public High Schools Using Rates of Crime Reported to
Police Report on the Study on School Violence and Prevention
Summary
This report profiles violence in U.S. public high schools. It is based on analysis of data from a U.S. Department of Education survey of school principals that asked about the number and types of crimes they reported to police for the 1996-97 school year. The analysis shows that violence is clustered within a relatively small percentage of locations, with about 60 percent of the violence occurring in 4 percent of the schools. This is about four times higher than would be expected based on national rates of crime.
High schools are grouped by the nature and level of crimes occurring in the school.
Four patterns emerge from this grouping: 1) No Crime, 2) Isolated Crime, 3) Moderate Crime and 4) Violent Crime. High schools in each group are described in terms of their student population characteristics, community characteristics, and school violence prevention efforts.
The results indicate that the characteristics (size, location, socio-economic make-up)
of high-violence schools differ markedly from the other schools. High schools with the highest levels of violence tended to be located in urban areas and have a high percentage of minority students, compared to high schools that reported no crime to the police. They also tended to be located in areas with high social disadvantage and residential mobility. It should be noted, however, that a relatively large minority of the schools in the Violent Crime group were located in rural areas (36%), so that the image of school violence being solely restricted to central cities is not accurate.
The types of violence prevention programs differed between crime groups. The
schools that experience a high level of serious violence also reported high use of prevention measures and programs that were specifically aimed at controlling violence. Schools in the Violent Crime group appeared to put more emphasis on programs geared toward changing individual behavior, such as behavioral modification or other types of individual attention. This contrasted with high schools in the other three crime groups, which tended to place a higher priority on prevention instruction or counselors within the school.
i

Similarly, the Violent Crime group was more likely than the other groups to adopt a variety of security measures to reduce risk of crimes, particularly random metal detectors, used by about one-third of the Violent Crime group (compared to 10% or less in the other groups). The crime groups also differed in their use of law enforcement and security personnel. The schools in the Violent Crime group were more likely to use this as a measure to control disorder than were schools with lower levels of crime.
These observations indicate that schools with the greatest need (i.e., highest rate of
violent crime) took action at a fairly high rate (e.g., around two-thirds of the schools reported using many of the programs/activities). A follow-up question is whether these programs are effective at reducing violence. The current analysis did not allow for assessment of whether programs were implemented in an effective way and/or significantly reduced the amount of violence in the school.
The report suggests that methods to prevent school violence be tailored to the level
and type of crime problems that schools are experiencing. Also, future evaluation of prevention methods should put some emphasis on schools experiencing the most severe problems. Comparing these schools to those with a similar profile but lower levels of disorder would be especially useful. This would provide an efficient and cost-effective way to better understand how to significantly reduce crime in the nation’s high schools.
ii

Contents
Chapter Page SUMMARY..................................................................................................................................................... i 1. INTRODUCTION ....................................................................................................................................1 2. WHAT PROPORTION OF HIGH SCHOOLS HAVE HIGH RATES OF VIOLENCE? ..........................2 3. CHARACTERISTICS OF HIGH SCHOOLS WITH HIGH RATES OF VIOLENT CRIME. ....................6
3.1 SCHOOL CHARACTERISTICS DISTINGUISHING SCHOOLS WITHIN CRIME GROUPS .....................................8 3.2 SCHOOL DISCIPLINE AND OTHER PROBLEMS.............................................................................................10 3.3 COMMUNITY CHARACTERISTICS ASSOCIATED WITH CRIME PATTERNS ....................................................12
4. ARE THE METHODS TO CONTROL SCHOOL DISORDER RELATED TO THE LEVEL OF VIOLENCE? ...................................................................................................................................13
4.1 PREVENTION PROGRAMS AND ACTIVITIES ..................................................................................................14 4.2 SECURITY STRATEGIES ................................................................................................................................18
5. SUMMARY AND CONCLUSIONS.......................................................................................................20
List of Appendixes
Appendix A IDENTIFYING SCHOOLS BY CRIMES RATES..................................................................................24
iii

Contents (continued)
List of Tables
Table Page Table 1. Observed and Expected Distribution of U.S. Public High Schools According to the Number of Crimes Reported to Police, by Type of Crime+........................................... 4 Table 2. Observed and Expected Distribution of Crime Incidents in U.S. Public High Schools
According to the Number of Crimes Reported to Police, by Type of Crime+ ......................... 5 Table 3. Population and Rate of Crimes Reported to the Police in U.S. Public High Schools by
School Crime Pattern (standard error in parentheses) ............................................................. 7 Table 4. School, Student and Community Characteristics in U.S. Public High Schools, by Crime
Group (standard error in parentheses) ..................................................................................... 9 Table 5. School Disorder Composite Scores and Crime Patterns in U.S. Public High Schools
(standard error in parentheses)............................................................................................... 11 Table 6. Community Characteristics and School Crime Patterns in U.S. Public High Schools
(standard error in parentheses)............................................................................................... 13 Table 7. Percent of U.S. Public High Schools Reporting Use of Programs to Prevent Violence, by Type of Program and Crime Group (standard error in parenthesis) ................................. 16 Table 8. Rank of Use of Different Programs to Prevent Violence within each Crime Group for U.S Public High Schools.................................................................................................. 17 Table 9. Descriptions of Security Devices and Strategies Implemented in U.S. Public High Schools, by Crime Group (standard error in parenthesis)...................................................... 20 Table A-1. Co-Occurrence of Rates of Crimes Reported to the Police for Serious Violence, Attach Without a Weapon, and Property Crime Among U.S. Public High Schools......................... 25 Table A-2. Co-Occurrence of Rates of Crimes Reported to the Police for Attach Without a Weapon and Property Crime Among U.S. Public High Schools........................................... 26
iv

1. Introduction
The Departments of Education and Justice report that schools are safe and secure learning environments (Kaufman, et al, 2000). Students are about 3 times less likely to be a victim of a violent crime at school than while away from school. Homicide also occurs rarely in schools. Of child homicides in 1997, less than one percent occurred in a school. Most school crime is, in fact, theft or fighting without weapons.
This overall low rate of crime and victimization in schools is somewhat deceiving.
Crime is not randomly distributed across schools. For example, schools located in communities with high crime rates are more likely to experience crime than are schools in safer communities (Gottfredson and Gottfredson, 1985). Beyond this basic observation, however, very little is known about the number and nature of schools that experience high levels of violence. Few studies have attempted to characterize schools on the basis of the amount of violence that occurs.
The purpose of this report, which focuses on high schools, is to address this issue by
asking three basic questions: ! What proportion of high schools have high rates of violence?
! What are the characteristics of high schools with high rates of violent crime?
! Are the methods to control disorder related to the level of violence?
Identifying high schools with particular types of violence problems should provide more specific guidance on how to effectively target resources to school prevention efforts. 1
To address these questions, this report describes analysis of the Principal-School Disciplinarian Survey on School Violence (P-SDSSV). This survey, sponsored by the U.S.
1 Data are available on elementary and middle schools as well as high schools, but this report focuses only on high
schools. Elementary schools overall have reported crime rates that are too low to make an analysis of their data worthwhile. Although an initial analysis of the middle school data revealed different crime patterns from high schools, further study indicated that it would not be feasible to analyze the middle school data separately. Combining data across educational levels (e.g., by combining middle and high schools) was not pursued, since such an analysis would have mixed too heterogeneous a set of populations and school policies (e.g., 12 year olds and 18 year olds) to allow for useful conclusions. For these reasons, this report concentrates on high schools, where violence reported to police is higher than for the other educational levels (US Department of Education, 1998).
1
Department of Education, asked principals to indicate the number and types of crimes reported to the police for the 1996-1997 school year.2 Crime types included:
! Serious violence, including murder, suicide, robbery, rape, and assaults or fights with weapons;3
! Fighting or physical attack without weapons; and
! Property crimes, including vandalism and petty theft.
These three types of crimes were analyzed to identify and describe high schools with high levels of violence.4 The next section provides estimates of the extent to which violence is disproportionately concentrated in a small subset of schools. The third section describes the characteristics of this subset of schools with high levels of violence. The fourth section discusses the relationship between community characteristics and levels of school violence. The fifth section discusses the prevention programs used by different types of schools. The final section of the report summarizes the results and discusses the limitations of the study. 2. What Proportion of High Schools Have High Rates of Violence?
Previous analysis of the P-SDSSV revealed that about one in five high schools reported any serious violent crime (e.g., fights with weapons, robbery) during the 1996-1997 school year. While this statistic gives a global indication of the prevalence of these crimes, it is difficult to judge from these data whether certain schools are disproportionately more likely to have high levels of violence. As long as the rate of violence in schools is greater than zero, one would expect at least some schools to have some violence. Is one in five schools more than would be expected, given the overall level of violence in the country? In this section we present analysis that assesses whether one in five schools represents any clustering of incidents within particularly violent schools or whether violence is distributed evenly across schools in the U.S.
There are important implications if violence is clustered within a small number of
schools. There may be specific problems in these schools that lead to high levels of serious problem behavior. Issues that arise in these environments may not resemble those in schools with lower rates of crimes. Similarly, there may be unique remedies needed to solve these 2 These crimes did not necessarily involve students or school personnel as either victims or perpetrators. 3 Schools participating in the survey did not report any murders or suicides. 4 The P-SDSSV had a sample size of 441 high schools.
2

problems. The types of prevention programs and/or activities that are needed to reduce the violent behavior might have to be tailored to these particular environments.
Data provided in Table 1 provides estimates that measure the extent that violence is
clustered within certain schools. These data compare the observed and expected number of high schools that reported a specified number of crimes to the police.5 As this comparison reveals, if serious violent crime had been evenly distributed across all schools, one would expect that about 45 percent of schools (100% - 55% = 45%) would have reported having this type of crime. Instead, only about 20 percent (100% - 80% = 20%) of high schools included in the P-SDSSV reported this type of crime. In other words, less than half as many schools experienced serious violent crime as expected. About four times as many schools experienced five or more serious violent incidents as would be expected if crime were evenly distributed across all schools.
Similar disparities appear for the other two types of crimes. For attacks without a
weapon, approximately 55 percent of the schools reported at least one incident. This was considerably lower than the 88 percent that would have been expected if these incidents were evenly distributed across all schools. For property crime, 67 percent of the schools reported at least one crime, while around 90 percent would have been expected to report this type of crime if it were evenly distributed across schools.
Table 2 displays an alternative way of looking at the distribution of crime incidents
reported to police. This comparison is limited to schools that reported at least one crime. As can be seen, about 60 percent of the violence reported on the P-SDSSV occurred within the small number of schools that reported at least five violent crimes, more than seven times higher than expected if crime were evenly distributed across schools (7.8% expected). Similarly, about 14 times more schools than expected reported 26 or more attacks without a weapon (43.4% observed versus 2.7% expected). And nearly 42 percent of schools reported 26 or more property crimes, almost 7 times as many as expected based on school size alone.
This analysis provides evidence that for many schools serious violence is not a
problem. Only a small percentage of schools seemed to have reported this type of crime. It also indicates, however, that for a small percentage of schools violence is extremely high.
5 The expected distribution was computed by assuming that the number of serious violent crimes was distributed as
a Poisson distribution, with a rate equal to the average for the U.S. population of high school students.
3

Table 1. Observed and Expected Distribution of U.S. Public High Schools According to the Number of Crimes Reported to Police, by Type of Crime+
Percent of Schools Observed Expected
Schools Reporting: Serious Violence* No crime 80.0 55.0 1 crime 10.0 26.0 2 crimes 2.4 11.4 3 crimes 2.0 4.7 4 crimes 1.3 1.9 5 or more crimes 4.3 1.1
Attack Without a Weapon No crime 45.3 11.7 1 crime 8.1 12.2 2 crimes 8.6 10.5 3 – 5 crimes 12.2 24.4 6 – 10 crimes 10.4 23.5 11 – 15 crimes 7.3 11.1 16 – 20 crimes 2.1 4.4 21 – 25 crimes 1.5 1.6 26 or more crimes 4.5 .7
Property Crime* No crime 33.7 10.4 1 crime 10.6 11.2 2 crimes 7.2 9.8 3 – 5 crimes 18.2 23.1 6 – 10 crimes 12.9 23.7 11 – 15 crimes 6.9 12.3 16 – 20 crimes 2.4 5.6 21 – 25 crimes 2.4 2.2 26 or more crimes 5.4 1.4
So+ Expected distributions assume that crime is evenly distributed across schools. This distribution was computed
assuming crime was distributed as a Poisson distribution with a rate equal to the average for the U.S. population of high school students.
urce: Principal-School Disciplinarian Survey on School Violence
* Serious violence includes: murder, sexual battery, suicide, physical attack or fight with a weapon and robbery. Schools participating in the survey did not report any murders or suicides. Property crime includes theft/larceny (stealing without confrontation) and destruction of school property.
Crimes reported to the police did not necessarily involve students or school personnel as either victims or perpetrators.
4

Table 2. Observed and Expected Distribution of Crime Incidents in U.S. Public High Schools According to the Number of Crimes Reported to Police, by Type of Crime+
Percent of Total Incidents Observed Expected
Schools Reporting: Serious Violence* No crime n/a n/a 1 crime 15.2 34.1 2 crimes 7.2 29.7 3 crimes 9.3 18.5 4 crimes 8.1 9.8 5 or more crimes 60.2 7.8
Attack Without a Weapon No crime n/a n/a 1 crime 1.3 2.1 2 crimes 4.3 3.6 3 – 5 crimes 8.4 16.4 6 – 10 crimes 14.6 31.3 11 – 15 crimes 16.6 24.1 16 – 20 crimes 6.8 13.4 21 – 25 crimes 6.0 6.3 26 or more crimes 43.4 2.7
Property Crime* No crime n/a n/a 1 crime 1.6 1.7 2 crimes 2.2 3.0 3 – 5 crimes 10.7 13.9 6 – 10 crimes 14.8 28.1 11 – 15 crimes 13.3 24.0 16 – 20 crimes 6.9 15.1 21 – 25 crimes 8.6 7.9 26 or more crimes 41.8 6.3
So+ Expected distributions assume that crime is evenly distributed across schools. This distribution was computed assuming crime was distributed as a Poisson distribution with a rate equal to the average for the U.S. population of high school students.
urce: Principal-School Disciplinarian Survey on School Violence
* Serious violence includes: murder, sexual battery, suicide, physical attack or fight with a weapon and robbery. Schools participating in the survey did not report any murders or suicides. Property crime includes theft/larceny (stealing without confrontation) and destruction of school property.
Crimes reported to the police did not necessarily involve students or school personnel as either victims or perpetrators.
5

3. Characteristics of High Schools with High Rates of Violent Crime
In this section, the characteristics of schools with high levels of violent crime are described. The characteristics that are examined include:
! School characteristics—Location (urban/rural), size, percent minority, and percent receiving free or reduced-price school lunch;
! School discipline and other problems—Composite indices of drug problems, disorderly behavior, and tardiness.
! Community characteristics—Composite indices of urban affluence, social disorganization, and residential mobility, based on Census data.
In order to describe schools by these characteristics, high schools were classified into four groups according to the types of crimes reported to the police. The methods used to identify these groups are discussed in Appendix A. The four groups of schools were defined as:
! Violent Crime—Schools with a high level of serious violent crime or schools with a moderate level of serious violent crime and a high level of attacks without a weapon.
! Moderate Crime—Schools not in group 1 above, but with a high level of either attacks without a weapon or property crime.
! Isolated Crime—Schools not in groups 1 or 2, but with a moderate level of some type of crime.
! No Crime—Schools with no incidents reported to police of any type of crime.
Table 3 displays the number and percent of schools in each group. The Violent Crime group included 5.6 percent of high schools in the U.S.6 or about one in 18 schools. The Moderate Crime group included 18.1 percent of the schools. The most common pattern, the Isolated Crime group, characterized nearly 53 percent of high schools. About 25 percent of high schools were in the No Crime group.
6 The size of each group is, in part, a function of the cut-points used to define each of the three crime types (see
Appendix A). Setting the thresholds for each “high” group with a lower crime rate would naturally expand the serious violent and reduce the size of the low crime group.
6

Table 3. Population and Rate of Crimes Reported to the Police in U.S. Public High Schools by School Crime Pattern (standard error in parentheses)
Crime Pattern Group++
No Crime
Isolated Crime
Moderate
Crime
Violent Crime
Number of Schools 3,625 8,157 2,790 868 Percent of Schools 23.5 52.8 18.1 5.6
Incidents per 1000 Students Serious violence ++ 0.0
(0.0) .35
(.04) .20
(.05) 5.9 (.85)
Attacks without a weapon 0.0 (0.0)
4.1 (.38)
22.1 (2.93)
35.0 (7.98)
Property crimes 0.0 (0.0)
6.0 (.40)
31.2 (4.77)
18.1 (2.98)
Source: Principal-School Disciplinarian Survey on School Violence + Serious violence includes: murder, sexual battery, suicide, physical attack or fight with a weapon and robbery.
Schools participating in the survey did not report any murders or suicides. Property crime includes theft/larceny (stealing without confrontation) and destruction of school property.
++Violent Crime – High level of serious violent crime reported to the police or schools with moderate levels of serious violent crime reported to the police and a high level of less serious violent crime reported to the police. Moderate Crime – Not in violent crime group, but with a high level of either less serious violent crime reported to the police or property crime reported to the police. Isolated Crime – Schools not in either violent or moderate crime, but with a moderate level of some type of crime reported to the police. No Crime – No incident reported to the police of any type of crime. Crimes reported to the police did not necessarily involve students or school personnel as either victims or perpetrators.
As can be seen from the crime rates for each group, the Violent Crime group has relatively high rates of all types of crimes. It has the most violence, with the highest rates of serious violence and attacks without a weapon. It also has high rates of property crime. The Moderate Crime group is distinguished by relatively high rates of attacks without a weapon and property crime rates. The Isolated Crime group has relatively low rates of all three types of crimes. It does have a slightly higher rate of serious violence than the Moderate Crime group. However, the rate for both of these groups is extremely low relative to the Violent Crime Group.
In the remaining sections, the characteristics of the crime groups are described in more detail. Small sample sizes limited the detail with which the data could be analyzed and discussed. The smallest group is the Violent Crime Group, which is based on 33 high schools. The analysis largely accounts for this by computing the standard errors for each estimate and conducting statistical significance tests. Nonetheless, since some of the analysis focuses on a
7

relatively small group of schools, the most detailed tabulations for this group should be viewed with some caution.
3.1 School Characteristics Distinguishing Schools Within Crime Groups
The P-SDSSV collected a number of characteristics about the schools in the survey. These data are displayed in Table 4, including comparisons on enrollment, percentage of minority students, the type of location (central city vs. fringe/town vs. rural), region of the country and percentage of students that are eligible for free and reduced-price school lunch.
Schools in the Violent Crime group are very different from schools in the No Crime
group. The schools in the Violent Crime group are larger (averaging 1,060 students), located in urban areas (28%) and have a high percentage of minority students (mean of 40% per school). While the Violent Crime group does have the largest component of urban schools (28.5%), about one-third of this group is located in rural (36%) and another third in fringe/town areas (35.5%). Therefore, problems related to serious violence in schools do not seem to be isolated to the central city.
This profile is in contrast to the schools in the No Crime group, which are, on
average, much smaller (370 students per school), more likely to be located in rural areas (62%) and have a low percentage of minority students (mean of 12% per school). Surprisingly, these two groups of schools do not differ by the percentage of students that are eligible for free and reduced-price school lunch.
The differences between the Violent Crime group and the other two groups (i.e.,
Isolated and Moderate groups) are more complex. The schools in the Violent Crime group tend to be more urban and have a higher percentage of minority populations than schools in the other two groups. Contrary to expectations, these data do not show a strong relationship of crime group with school size and, to some extent, urbanicity. It is the case that the schools in the Violent Crime group are the largest. They are much larger, on average, than those schools in the Moderate Crime group (1,060 vs. 562). However, they are only slightly larger than the schools in the Isolated Crime group (1,060 vs. 930).
8

Table 4. School, Student and Community Characteristics in U.S. Public High Schools, by Crime Group (standard error in parentheses)
Crime Pattern Group No
Crime Isolated Crime
Moderate Crime
Violent Crime
Average Number of Students Enrolled per school
370 (42)
930 (39)
562 (55)
1,060 (146)
Average Percent Minority students per school
12.3 (2.3)
26.7 (2.1)
29.6 (5.2)
40.3 (5.4)
Average Percent Eligible for Free and Reduced-Price Lunch per school
21.2 (2.2)
22.0 (1.6)
25.9 (4.3)
20.0 (4.2)
School Location (% of schools in crime group)
Rural 62.1 (4.7)
30.1 (2.6)
41.6 (6.0)
36.0 (10.4)
Urban Fringe/Town 30.4 (5.0)
52.5 (2.4)
43.2 (5.6)
35.5 (9.1)
Urban 7.5 (1.9)
17.4 (1.3)
15.2 (3.4)
28.5 (6.9)
Region (% of schools in crime group)
Northeast 12.8 (4.8)
19.2 (2.8)
11.7 (3.9)
23.7 (9.0)
West 24.2 (6.0)
24.2 (2.6)
41.4 (7.2)
33.5 (9.7)
Central 41.2 (7.2)
30.8 (3.0)
27.3 (6.7)
19.1 (8.2)
Southeast 21.8 (5.0)
25.8 (2.6)
19.6 (5.5)
23.6 (8.0)
Source: Principal-School Disciplinarian Survey on School Violence Violent Crime – High level of serious violent crime reported to the police or schools with moderate levels of serious violent crime reported to the police and a high level of less serious violent crime reported to the police. Moderate Crime – Not in violent crime group, but with a high level of either less serious violent crime reported to the police or property crime reported to the police. Isolated Crime – Schools not in either violent or moderate crime, but with a moderate level of some type of crime reported to the police. No Crime – No incident reported to the police of any type of crime. Crimes reported to the police did not necessarily involve students or school personnel as either victims or perpetrators.
More striking is the fact that the schools in the Isolated Crime group are both less
likely to be in a rural area (30.1% vs. 41.6%) and are larger, on average, than the schools in the Moderate Crime group (930 vs. 562). One would have expected the opposite, since the Moderate Crime group has, on average, higher crime rates than the Isolated Crime group. This is inconsistent with the idea that larger, non-rural schools have higher levels of disorder.
9

3.2 School Discipline and Other Problems
School crime reported to the police is not only a function of the amount of disorder in the school, but also of the school’s policies and informal practices for reporting crimes to the police. Thus, police reports may not provide the best measure of violence or disorder in schools. In addition, many crimes may never come to the attention of the principal. By profiling schools with police-reported crime, therefore, the analysis may be distorting the types of problems that are occurring within the school.
To address this issue, the analysis examined an alternative measure of problem behavior within the school. This utilized a set of items from the P-SDSSV on school discipline and other problems. Principals were asked to rate a set of 16 issues on whether each was a problem for their school. These included items about student behavior, drugs, fighting, gangs, racial tensions and problems with teachers.
A factor analysis was conducted using these 16 items. Based on the factor loadings of the items, three composite indices of problem behavior were created, including:
! Disorderly behavior;
! tardiness; and
! Drug-related issues.
The composite scores were scaled to have a mean of 0 and a standard deviation of 1. A positive value on a composite score indicates that the school reported higher-than-average problems, while a negative value indicates lower than average reported problems. Table 5 displays the average composite disorder scores for each crime group.
The differences across these groups mirror the prevalence of crime within the four
groups of schools. The biggest contrasts involve the Violent and No Crime groups. There are very large differences on all three of the problem composite scores (Drugs, disorder, and Tardiness) for these two groups. The No Crime group is also much different from the Isolated and Moderate groups on all three indicators. There are smaller, but still significant, differences among the Violent and Isolated/Moderate groups that mirror their crime patterns. In particular, the Violent Crime group is significantly different from the other two on the three types of problems. The only exception is that the difference between the Violent and Moderate Crime group for drugs is not statistically significant, although it is in the direction one would expect.
10

There are no differences between the Isolated and Moderate groups. These two groups are similar with respect to what principals report about the types of problems in their schools.
The consistency of principal reports of problems and the school's classification into
one of the four crime groups is evidence that both are measuring, to some degree, the same phenomena.
Table 5. School Disorder Composite Scores and Crime Patterns in U.S. Public High Schools
(standard error in parentheses)
Crime Pattern Group++ (Mean Composite Score for Schools in that Group)
Disorder Composite+ No Crime Isolated Crime Moderate Crime Violent Crime Drugs −.56
(.11) .04
(.07) .12
(.15) .37
(.24) Fighting −.60
(.07) −.13 (.07)
−.18 (.10)
.74 (.13)
Tardiness −.78 (.15)
.08 (.06)
−.08 (.14)
.35 (.18)
Source: Principal-School Disciplinarian Survey on School Violence +There is a composite score for each type of disorder. Composite scores indicate the level of that particular type of disorder was reported by the principal in the school. All composites have a mean of 0 and standard deviation of 1. Positive values indicate higher than average for that type of disorder. Negative values indicate lower than average for that particular type of disorder. ++ Violent Crime – High level of serious violent crime reported to the police or schools with moderate levels of
serious violent crime reported to the police and a high level of less serious violent crime reported to the police. Moderate Crime – Not in violent crime group, but with a high level of either less serious violent crime reported to the police or property crime reported to the police. Isolated Crime – Schools not in either violent or moderate crime, but with a moderate level of some type of crime reported to the police. No Crime – No incident reported to the police of any type of crime. Crimes reported to the police did not necessarily involve students or school personnel as either victims or perpetrators.
The principal's report, while subjectively based, does seem to be grounded in behaviors observed in the school, as evidenced by the correlation of these reports with the crime groupings. Conversely, this correlation is also evidence that the crime groupings, which are based on incidents reported to the police, are indicative of behaviors the principal is observing. The major exception to this is the comparisons between the Isolated and Moderate Crime groups. In this case, the perceptions of the principal do not entirely correspond with what has been reported to the police.
11
3.3 Community Characteristics Associated with Crime Patterns
To explore whether community characteristics such as poverty, racial composition, mobility, or average educational level were associated with school crime patterns, Census data for the school’s zip code were added to the data set. As possible correlates of community-level crime, the specific variables chosen for this purpose were based on a previous analysis of community characteristics and school crime (Gottfredson and Gottfredson, 1985).
A total of 15 variables were drawn from the Census file. To summarize these items,
a factor analysis was conducted. This resulted in three dimensions describing the make-up of the zip codes:
! Urban high income—Median family income, percent of population living in an urban area, percent with a college degree, and percent of those in managerial or professional occupations.
! Social Disadvantage—Percent of households that were female-headed, percent receiving public assistance, percent of population reporting race as black, percent divorced and percent unemployed.
! Residential mobility—Percent of housing units that are owner occupied, and households in the same unit between 1985 and 1990.
Based on the factor loadings, composite scales were created for each of these dimensions. The scales were created to have a mean of 0 and a standard deviation of 1. A positive value should be interpreted as high on each of the above dimensions (e.g., high residential mobility, high social disadvantage). A negative value should be interpreted as low on each of the above dimension. Table 6 compares the mean composite scores for schools in the crime pattern groups.
As with the results above, the largest differences are between the No Crime and Violent Crime groups. The former are less likely to be in urban high income communities, more likely to have low levels of social disadvantage, and more likely to have low residential mobility. No significant differences were found between the three groups of schools that experience at least some crime (Isolated, Moderate and Violent).
The power of the community characteristics, therefore, seems to be in distinguishing
between schools with very low and very high crime rates. The community characteristics do not distinguish among the Isolated, Moderate and Violent Crime groups. This could reflect the complex relationship between communities and school disorder. Previous analyses have used
12

relatively small units, such as blocks or Census Tracts, to measure the immediate geographic area of the school. The areas used for matching in the present analysis (i.e., zip codes) may be too large. In addition, the school’s zip code does not necessarily relate to the neighborhoods in which the students are living. With busing, magnet schools, and other special programs, the “catchment area” of schools may not coincide with the geographic area covered by the zip code. Finally, 1990 Census data was used, so communities may have changed by the time of the survey (1996-1997 school year).
Table 6. Community Characteristics and School Crime Patterns in U.S. Public High Schools
(standard error in parentheses)
Crime Pattern Group++ (Mean Composite Score for Schools in that Group)
Community Characteristic Composite+
No Crime
Isolated Crime
Moderate Crime
Violent Crime
Urban high income −.25 (.10)
.17 (.08)
.26 (.11)
.14 (.14)
Social disadvantage −.18 (.07)
.07 (.07)
−.05 (.13)
.40 (.21)
Residential mobility −.24 (.14)
.07 (.07)
.06 (.15)
.15 (.15)
Source: Principal-School Disciplinarian Survey on School Violence; U.S. Census +There is a composite score for each of the three characteristics listed in the table. All composites have a mean of 0 and standard deviation of 1. Positive values indicate higher than average for that characteristic. Negative values indicate lower than average for that characteristic. A high value on “urban high income” reflects the contrast between urban high income areas and all others (e.g., rural areas, suburban areas, etc..). ++ None of the differences between the Isolated Crime group, the Moderate Crime group and the Violent Crime
Group were statistically significant. Violent Crime – High level of serious violent crime reported to the police or schools with moderate levels of serious violent crime reported to the police and a high level of less serious violent crime reported to the police. Moderate Crime – Not in violent crime group, but with a high level of either less serious violent crime reported to the police or property crime reported to the police. Isolated Crime – Schools not in either violent or moderate crime, but with a moderate level of some type of crime reported to the police. No Crime – No incident reported to the police of any type of crime. Crimes reported to the police did not necessarily involve students or school personnel as either victims or perpetrators.
This complexity is also reflected in the finding that the Violent Crime Group has a
positive score on "urban high income" dimension. One would not normally expect violent crime to be located in affluent areas. For example, the Violent Crime Group has a high score on the "social disadvantage" composite. It should be noted that the score for the Violent Crime Group is not statistically different from zero. Nonetheless, the positive value for the Violent Crime
13

Group for the "urban high income" composite may also reflect the urban nature of these communities when compared to rural areas, which are more likely to be in the No Crime Group.
4. Are the Methods to Control School Disorder Related to the Level of Violence?
In this section, we discuss whether high schools in the four crime groups differ by the methods they used to prevent violence. We first discuss the use of specific violence prevention activities and programs. We next discuss whether schools in different crime groups have implemented different security practices.
4.1 Prevention Programs and Activities
The P-SDSSV asked principals to report whether their schools conducted specific programs or activities intended to prevent or reduce school violence. The list of program types was developed as part of another effort concerned with documenting and evaluating these activities (Gottfredson, et al., 2000).
The programs included on the P-SDSSV were:
! Prevention curriculum, instruction, or training for students;
! Behavioral programming or behavior modification for students;
! Counseling, social work, psychological or therapeutic activity for students;
! Other activities involving individual attention for students (e.g., tutoring, mentoring);
! Recreational, enrichment, or leisure activities for students;
! Student involvement in resolving student conduct problems (e.g., conflict resolution, student court);
! Training, supervision, or technical assistance in classroom management for teachers;
! Review, revision, or monitoring of school wide discipline practices and procedures;
! Community or parent involvement in school violence prevention programs or efforts; and
14

! Reorganization of school, grades, or schedules (e.g., “houses” or “teams” of students.
Across all high schools, the most common prevention activity in 1996-97 was reviewing or monitoring school wide discipline (62% of schools). The least common activity was reorganization of schools, grades, or schedules (25%). On average, high schools reported implementing 3.2 violence prevention activities during 1996-97.
Table 7 compares crime groups by the use of each prevention activity. Some
prevention programs or activities were very unlikely to be used across all crime groups. These included school reorganization efforts, community or parent involvement in violence prevention, and student involvement in resolving student conduct problems. Likewise, other activities were used frequently regardless of crime pattern. These included review, revision, and monitoring school disciplinary practices, and counseling or therapeutic activities for students.
The No Crime group was the least likely to have used any of the activity types. In
contrast, the Violent Crime group was most likely to use seven of the ten activities. The higher use of some activities by this group may reflect these schools’ greater need to control violence and other types of disorder. These schools may respond by instituting more programs to try to reduce the problem.
15
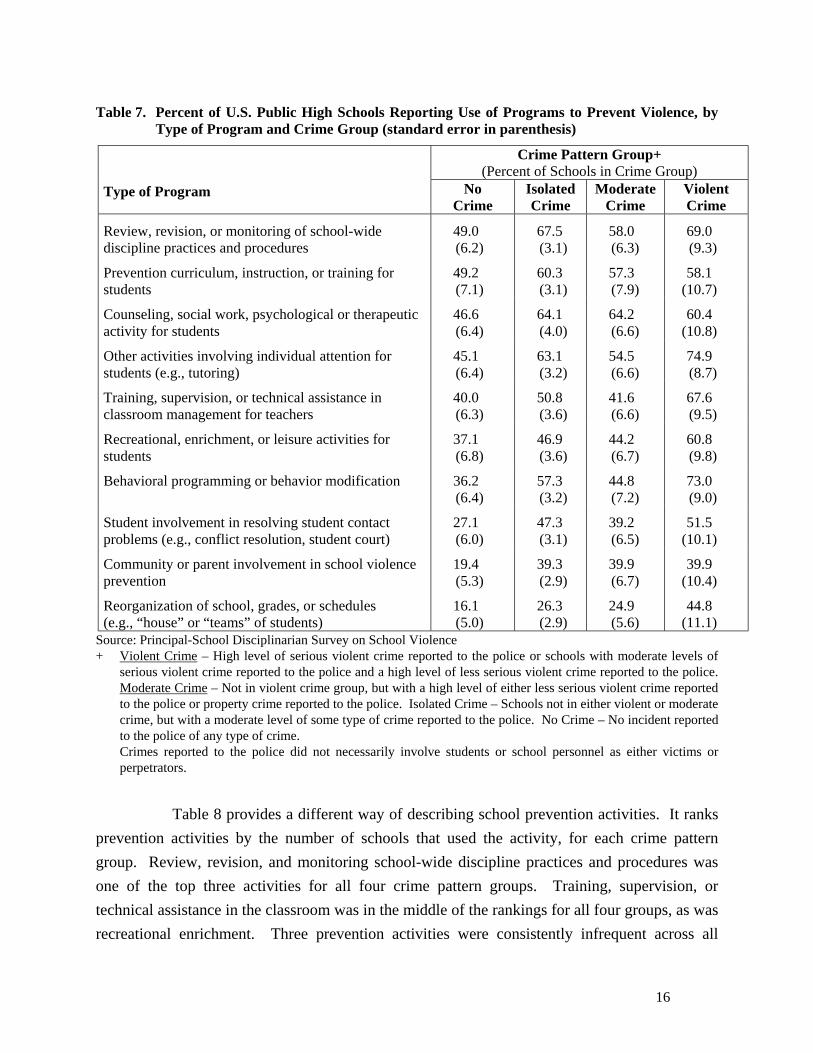
Table 7. Percent of U.S. Public High Schools Reporting Use of Programs to Prevent Violence, by Type of Program and Crime Group (standard error in parenthesis)
Crime Pattern Group+ (Percent of Schools in Crime Group)
Type of Program No Crime
Isolated Crime
Moderate Crime
Violent Crime
Review, revision, or monitoring of school-wide discipline practices and procedures
49.0 (6.2)
67.5 (3.1)
58.0 (6.3)
69.0 (9.3)
Prevention curriculum, instruction, or training for students
49.2 (7.1)
60.3 (3.1)
57.3 (7.9)
58.1 (10.7)
Counseling, social work, psychological or therapeutic activity for students
46.6 (6.4)
64.1 (4.0)
64.2 (6.6)
60.4 (10.8)
Other activities involving individual attention for students (e.g., tutoring)
45.1 (6.4)
63.1 (3.2)
54.5 (6.6)
74.9 (8.7)
Training, supervision, or technical assistance in classroom management for teachers
40.0 (6.3)
50.8 (3.6)
41.6 (6.6)
67.6 (9.5)
Recreational, enrichment, or leisure activities for students
37.1 (6.8)
46.9 (3.6)
44.2 (6.7)
60.8 (9.8)
Behavioral programming or behavior modification 36.2 (6.4)
57.3 (3.2)
44.8 (7.2)
73.0 (9.0)
Student involvement in resolving student contact problems (e.g., conflict resolution, student court)
27.1 (6.0)
47.3 (3.1)
39.2 (6.5)
51.5 (10.1)
Community or parent involvement in school violence prevention
19.4 (5.3)
39.3 (2.9)
39.9 (6.7)
39.9 (10.4)
Reorganization of school, grades, or schedules (e.g., “house” or “teams” of students)
16.1 (5.0)
26.3 (2.9)
24.9 (5.6)
44.8 (11.1)
Source: Principal-School Disciplinarian Survey on School Violence + Violent Crime – High level of serious violent crime reported to the police or schools with moderate levels of
serious violent crime reported to the police and a high level of less serious violent crime reported to the police. Moderate Crime – Not in violent crime group, but with a high level of either less serious violent crime reported to the police or property crime reported to the police. Isolated Crime – Schools not in either violent or moderate crime, but with a moderate level of some type of crime reported to the police. No Crime – No incident reported to the police of any type of crime. Crimes reported to the police did not necessarily involve students or school personnel as either victims or perpetrators.
Table 8 provides a different way of describing school prevention activities. It ranks
prevention activities by the number of schools that used the activity, for each crime pattern group. Review, revision, and monitoring school-wide discipline practices and procedures was one of the top three activities for all four crime pattern groups. Training, supervision, or technical assistance in the classroom was in the middle of the rankings for all four groups, as was recreational enrichment. Three prevention activities were consistently infrequent across all
16

groups: student involvement in resolving student conduct problems, community or parent involvement in school violence prevention efforts, and reorganization of schools.
Table 8. Rank of Use of Different Programs to Prevent Violence within each Crime Group for U.S.
Public High Schools
Crime Pattern Group+ (1= most frequent; 10=least frequent)
Type of Program
No
Crime
Isolated Crime
Moderate
Crime
Violent Crime
Review, revision, or monitoring of school-wide discipline practices and procedures
1 1 2 3
Prevention curriculum, instruction, or training for students
1 4 3 7
Counseling, social work, psychological or therapeutic activity for students
3 2 1 5
Other activities involving individual attention for students (e.g., tutoring)
4 3 4 1
Training, supervision, or technical assistance in classroom management for teachers
5 6 7 4
Recreational, enrichment, or leisure activities for students
6 7 6 6
Behavioral programming or behavior modification 7 5 5 2
Student involvement in resolving student contact problems (e.g., conflict resolution, student court)
8 7 9 8
Community or parent involvement in school violence prevention
9 9 8 10
Reorganization of school, grades, or schedules (e.g., “house” or “teams” of students)
10 10 10 9
Source: Principal-School Disciplinarian Survey on School Violence + Violent Crime – High level of serious violent crime reported to the police or schools with moderate levels of
serious violent crime reported to the police and a high level of less serious violent crime reported to the police. Moderate Crime – Not in violent crime group, but with a high level of either less serious violent crime reported to the police or property crime reported to the police. Isolated Crime – Schools not in either violent or moderate crime, but with a moderate level of some type of crime reported to the police. No Crime – No incident reported to the police of any type of crime. Crimes reported to the police did not necessarily involve students or school personnel as either victims or perpetrators.
There were differences in the prevention activities used by the different crime groups, especially between the Violent Crime group and the other three groups. For example,
17

prevention curriculum, instruction, and training differed between the Violent Crime group and the other three groups. Prevention curriculum activities involve classroom instruction that aims to prevent problem behaviors such as drug use or fighting. This strategy was the most commonly used by schools in the No Crime group. Similarly, schools in the Isolated Crime group mentioned it third most frequently, while the Moderate Crime group mentioned it fourth most frequently. In contrast to this, this activity ranked seven out of ten for the Violent Crime group.
A high proportion of the Violent Crime group used activities that required more
planning and individual attention. This suggests that broad-brush approaches to violence prevention may be viewed as ineffective in schools that have a significant amount of violence. Behavioral programming and modification ranked second among schools in this group, but ranked fifth for schools in the Moderate and Isolated Crime groups. It ranked seventh for the No Crime group. Schools in the Violent Crime group also relied on other activities involving individual attention for students, which ranked first among these schools. This strategy varied between the third and fourth most common activity among the schools with other crime patterns.
A final difference among the crime groups involves prevention strategies that
involve counseling and social work. Among schools in the No Crime, Isolated Crime, and Moderate Crime groups, this type of activity appeared as one of the top three approaches. This contrasted to the Violent Crime group, where it ranks as the fifth most commonly used strategy. 4.2 Security Strategies
An obvious way for schools to prevent violence is through security devices and strategies. The P-SDSSV included a series of questions on security strategies, including whether the school used the following:
! Controlled access to school grounds,
! Metal detectors through which all students pass each day,
! Random metal detector checks on students,
! One or more drug sweeps, and
! Police or security officers (hours per week that officers were on campus).
18

Table 9 compares the use of security strategies by schools in the different crime groups. The high schools that experience the most violent crime are also the ones that report using these devices and strategies most frequently. Schools in the Violent Crime group consistently use the most security devices. On average, these schools use 1.23 different strategies, significantly more than in the other crime groups. Schools in the No Crime group use significantly fewer types of security strategies than do schools in the Isolated or Moderate Crime groups.
Differences between crime groups also appear within particular strategies. As would
be expected from the mean number of security measures, a higher proportion of the schools in the Violent Crime group reported using each of the individual strategies more often than the other types of schools. The largest difference is for the use of a random metal detector check, where 32.7% of the Violent group reported using this strategy compared to 10% or less among the other three groups. The Moderate Crime group and the Isolated Crime group exhibited some interesting differences. On the one hand, compared to the Isolated Crime group, a higher proportion of the Moderate Crime group used drug sweeps. On the other hand, more schools in the Isolated Crime group used controlled access to school grounds and random metal detectors.
The use of police or other security personnel was another approach used by schools.
The P-SDSSV asked principals the amount of time enforcement personnel were stationed in the school. The survey defined enforcement personnel to include police officers, school resource officers, and other security with arrest powers that are hired by the school. The four groups of schools differ on this as well.
Among schools in the Violent Crime group, 33.1 percent report having this type of
personnel on campus for at least 30 hours per week, compared to only 5 percent of the schools in the No Crime group. The schools that reported at least some crime also reported more police presence than did those in the schools No Crime group (22% - 24% vs. 5%). Smaller, marginally significant differences appeared between the Violent Crime group and the Moderate Crime and Isolated Crime groups.
19

Table 9. Descriptions of Security Devices and Strategies Implemented in U.S. Public High Schools, by Crime Group (standard error in parenthesis)
Crime Pattern Group+
No
Crime
Isolated Crime
Moderate
Crime
Violent Crime
Average number of security measures per school
.60 (.08)
.86 (.07)
.77 (.11)
1.23 (.23)
Percent of Schools With: Controlled access to school grounds 14.3
(3.9) 30.8 (2.8)
17.6 (5.6)
36.3 (9.8)
Metal detectors and pass .3 (.3)
2.2 (.85)
2.5 (2.1)
6.7 (3.6)
Random metal detectors 2.7 (1.6)
10.5 (1.8)
5.2 (2.4)
32.7 (8.0)
> 1 drug sweeps 42.3 (6.6)
43.0 (4.3)
51.8 (6.7)
51.1 (11.0)
No police 83.2 (5.0)
47.8 (3.7)
45.5 (6.6)
30.5 (9.4)
Police > 30 hours per week 5.0 (2.1)
22.5 (1.9)
24.4 (5.7)
33.1 (9.4)
Source: Principal-School Disciplinarian Survey on School Violence + Violent Crime – High level of serious violent crime reported to the police or schools with moderate levels of
serious violent crime reported to the police and a high level of less serious violent crime reported to the police. Moderate Crime – Not in violent crime group, but with a high level of either less serious violent crime reported to the police or property crime reported to the police. Isolated Crime – Schools not in either violent or moderate crime, but with a moderate level of some type of crime reported to the police. No Crime – No incident reported to the police of any type of crime. Crimes reported to the police did not necessarily involve students or school personnel as either victims or perpetrators.
5. Summary and Conclusions
During the 1996-1997 school year, most U.S. public high schools were safe and secure. A large majority of high schools in the U.S. did not have high levels of violence and did not experience traumatic events. Rather, this analysis found that a disproportionately small number of schools accounted for a very high proportion of violent incidents. Roughly 60 percent of serious violent crimes occurred in 4 percent of the schools, four times higher than would be expected if these incidents were evenly distributed across schools. Schools that reported high levels of serious violence also reported high levels of other types of crimes as well, such as property crime and fights without weapons.
20

The analyses described in this report clearly show differences between schools with high and low levels of violence. This suggests that focusing on how high and low violence schools react to crime and then evaluating these policies would be an effective way to reduce violence in U.S. Further identification and analysis of these schools at a more in-depth level can increase understanding of the obstacles and successes that are related to controlling violence in these locations.
High schools with the highest levels of violence tended to be located in urban areas
and have a high percentage of minority students, compared to high schools that reported no crime to the police. They also tended to be located in areas with high social disorganization and residential mobility. It should be noted, however, that a relatively large minority of the schools in the Violent Crime group were located in rural areas (36%), so that the image of school violence being solely restricted to central cities is not accurate.
The types of violence prevention programs differed between crime groups. The
schools that experience a high level of serious violence also reported high use of prevention measures and programs that were specifically aimed at controlling violence. Schools in the Violent Crime group appeared to put more emphasis on programs geared toward changing individual behavior, such as behavioral modification or other types of individual attention. This contrasted with high schools in the other three crime groups, which tended to place a higher priority on prevention instruction or counselors within the school.
Similarly, the Violent Crime group was more likely than the other groups to adopt a
variety of security measures to reduce risk of crimes, particularly random metal detectors, used by about one-third of the Violent Crime group (compared to 10% or less in the other groups). The crime groups also differed in their use of law enforcement and security personnel. The schools in the Violent Crime group were more likely to use this as a measure to control disorder than were schools with lower levels of crime.
These observations indicate that schools with the greatest need (i.e., highest rate of
violent crime) took action at a fairly high rate (e.g., around two-thirds of the schools reported using many of the programs/activities). A follow-up question is whether these programs are effective at reducing violence. The current analysis did not allow for assessment of whether programs were implemented in an effective way and/or significantly reduced the amount of violence in the school.
21

Several caveats must be applied to the above results. First, there is error in the measure of crime. One type of error relates to how the principal or school disciplinarian provided information for the survey. Ideally, the information on the number of crimes reported to the police, the types of programs implemented, and other data are based on records residing within the school. However, the process of respondents actually looking up information in their records is not entirely clear-cut. The records may not exist at all, they may be organized in ways that are not consistent with how the question was asked, or the respondents may not understand that they need to use records. All of these possible problems likely contribute to the accuracy of the information reported.
A second caveat, as mentioned briefly above, is the reliance on crimes reported to
the police as the primary measure of disorder in the school. Whether or not a crime is reported to the police depends on a two step process. First, the principal has to learn about the event, and second, the principal has to decide to report the event to the police. As with any data related to police-recorded crime, these steps may not be followed. The reasons they are not may very well differ by the type of event that occurs (e.g., serious vs. non-serious crime), the relationship of the school with the police, and the relationship among students, faculty, and administrators (e.g., student fear of retribution).
In conclusion, this analysis has shown that while many high schools in the country
are safe, a small percentage of schools experience a disproportionate amount of serious violence, at least as measured by crimes the principal reported to the police. These schools are quite different from other schools along several important dimensions and merit more intensive investigation. This report also suggests that future measurement of crime within schools should be designed to pick up more detail on the small percentage of schools that seem to be experiencing this crime. The low frequency of any violent event, even in those schools with a relatively high crime rate, is such that detailed analysis in a national sample for a single year is quite difficult. Future surveys like the P-SDSSV should consider ways to increase the statistical power for these types of analyses. This would include increasing the sample size of schools with high rates of disorder and schools that have similar characteristics (e.g., urban, high social disadvantage). 7
7 A concrete suggestion to address this would be to continue to follow-up a sample of schools in future data
collection efforts like the P-SDSSV. By being able to cumulate reports of crime over time, the problems experienced with the small sample sizes in any single year’s survey would be mitigated. This would also provide a way to assess whether crime in particular schools persists over time.
22

References Crosse, S., Burr, M., Cantor, D., & Hartman, I. (Forthcoming). Casting A Wide Net: Drug and
Violence Prevention Efforts in American Schools. Study on School Violence and prevention. Draft report submitted to the U.S. Department of Education.
Kaufman, P., Chen, X., Choy, S.P., Ruddy, S.A., Miller, A.K., Fleury, J.K., Chandler, K.A.,
Rand, M.R., Klaus, P., & M.G. Planty. (2000). Indicators of School Crime and Safety, 2000. [NCES 2001-017/NCJ-184176]. Washington D.C.: U.S. Departments of Education and Justice.
Gottfredson, G.D. & Gottfredson, D.C. (1985). Victimization in Schools. New York: Plenum. Gottfredson, G., Gottfredson, D.C., Czeh, E.R., Cantor, D., Crosse, S.B., & Hantman, I. (2000). National
Study of Delinquency Prevention in Schools. Final Report for the National Institute of Justice, U.S. Department of Justice, Grant # 96-MU-MU-008. Ellicot City, MD: Gottfredson Associates, Inc.
McCutcheon, A. (1987). Latent Class Analysis. Newbury Park: Sage Publications, Inc. Heaviside, S., Rowand, C., Williams, C., & Farris, E. (1998). Violence and discipline problems in U.S.
public schools: 1996-97. Washington, D.C.: National Center for Education Statistics, U.S. Department of Education.
23

Appendix A Identifying Schools by Crime Rates
Section 3 of this report describes the characteristics of four groups of schools with
different levels and types of crimes. This appendix provides a description of how these four groups were created.
For each type of crime (described in Section 2), school-level crime rates per 1000
students were computed. Crime rates were then divided into three crime levels. For serious violent crime, these levels were:
• Low—A rate of less than 1 incident per 1000 students;
• Moderate—A rate between 1 and 5 incidents per 1000 students; and
• High—A rate greater than 5 incidents per 1000 students (equivalent to five times the average rate or higher).
Slightly different levels were used for fighting without a weapon and property
crimes:
• None—No crimes reported;
• Moderate—A rate more than zero and less than 21 incidents per 1000 students; and
• High—A rate of 21 or more incidents per 1000 students (equivalent to twice the average rate or higher).
There is a correlation among these different crimes. Schools that experienced
moderate or high levels of serious violence were also more likely to experience other, less serious, types of crimes (e.g., vandalism). This is illustrated in Table A-1, which provides cross-tabulations of the crime level classifications for the three crime types reported on the P-SDSSV. Schools classified as having a high level of violent crime also experienced higher levels of the other two types of crimes.8 For example, of the schools with high violent crime, 84 percent reported a moderate to high level of fighting without a weapon and 100 percent reported a
8 All of the relationships displayed in Table A-2 are statistically significant at p<.05.
24

moderate to high level of property crime. Among schools in the low serious violence level, only 50 percent had a moderate to high level of and only 62 percent reported a moderate to high level of property crime. Table A-2 displays the cross-tabulation of fighting without a weapon and property crime. Again, schools with a high level of fighting are more likely to have moderate or high property crime levels, compared to other schools. Table A-1. Co-Occurrence of Rates of Crimes Reported to the Police for Serious Violence,
Attack Without a Weapon, and Property Crime+ Among U.S. Public High Schools
Serious Violence* None Moderate High Total
Attack Without a Weapon (Percent of Schools)
No incidents 49.5 12.1 16.7 45.1 Moderate rate of incidents 38.4 56.2 59.8 41.3 High rate of incidents 12.1 21.7 24.1 13.6 100.0 100.0 100.0 100.0
Total Number of Schools 13,057 1,935 448 15,440
Property Crime* (Percent of Schools)
No incidents 37.8 14.4 0.0 33.7 Moderate rate of incidents 49.9 62.6 83.9 52.5 High rate of incidents 12.2 22.9 16.1 13.7 100.0 100.0 100.0 100.0
Total Number of Schools 13,057 1,935 448 15,440
*Serious violence includes: murder, sexual battery, suicide, physical attack or fight with a weapon and robbery. Schools participating in the survey did not report any murders or suicides. Property crime includes theft/larceny (stealing without confrontation) and destruction of school property.
25

Table A-2. Co-Occurrence of Rates of Crimes Reported to the Police for Attack Without a Weapon and Property Crimes Among U.S. Public High Schools (percent of schools)
Attack Without a Weapon None Moderate High Total
Property Crime* (Percent of Schools)
No incidents 54.3 15.7 20.6 33.8 Moderate rate of incidents 37.0 74.0 38.7 52.5 High rate of incidents 8.7 10.3 40.7 13.7 100.0 100.0 100.0 100.0
Total Number of Schools 6,967 6,375 2,098 15,440
* Property crime includes theft/larceny (stealing without confrontation) and destruction of school property.
A Latent Class Analysis (LCA) was conducted using the three crime variables
described above. This tested whether schools can be classified into groups defined by the rate of serious violence, fights without a weapon and property crime. The results of this analysis indicate that schools can be described by these three different types of crimes. Schools with a great deal of serious violence also tend to have other types of crimes. Conversely, there is a disproportionate number of schools that do not experience any of these types of crimes.
The classification into four groups was done by cross-classifying the three crime
variables described above. This resulted in a table with 27 cells (3 x 3 x 3 = 27). The crime groups were formed by collapsing these 27 cells to form the following groups:
• Violent Crime—Schools with a high level of serious violent crime or schools with a moderate level of serious violent crime and a high level of fighting without a weapon.
• Moderate Crime—Schools not in group 1 above, but with a high level of either fighting without a weapon or property crime.
• Isolated Crime—Schools not in groups 1 or 2, but with a moderate level of some type of crime.
• No Crime—Schools with no incidents of any type of crime.
26