Embed Size (px)
Citation preview
CHAPTER 3
ARCHITECTURE OF SOFTWARE SYSTEMS
3.1 INTRODUCTION
Development of large software systems has always faced problems due to several
reasons; one among them is the fact that not all systems are built with sound architectural
framework. Unless a large software system is engineered by sound architectural basis, it
is liable to failure as it is designed and developed by members belonging to different
teams, countries and cultural backgrounds. Such large software system architecture
needs to be flexible as these systems are built with many years of effort. In the mean
time technology might change rapidly. More often it is so in computer science and
software engineering. The number of computer architectures and programming
languages developed, taught and utilized in the past five decades or so stands testimony
for the rapid change in these fields. If a large software system commits to a particular
algorithm or a hardware component at the architectural level then that surely will result in
the failure of the system. This argument might be extended further to make the
technology itself as a component in developing architectures for large software systems.
Apparently there has been almost no effort on the part of software system architects to
allow technologies themselves to become the components of the system architecture.
Rigorous research in this direction is needed if one has to develop any reasonably useful
system in future.
63
Before exploring architecture, information discovery that IS essential In the
networked environment and its associated issues are presented.
3.2 INFORMATION DISCOVERY PARADIGM
The information space can be near infinite considering the exponential growth of
the networks around the world. The collection of such networks, which is now
ubiquitous and pervasive in the form of Internet, manifests itself as the largest distributed
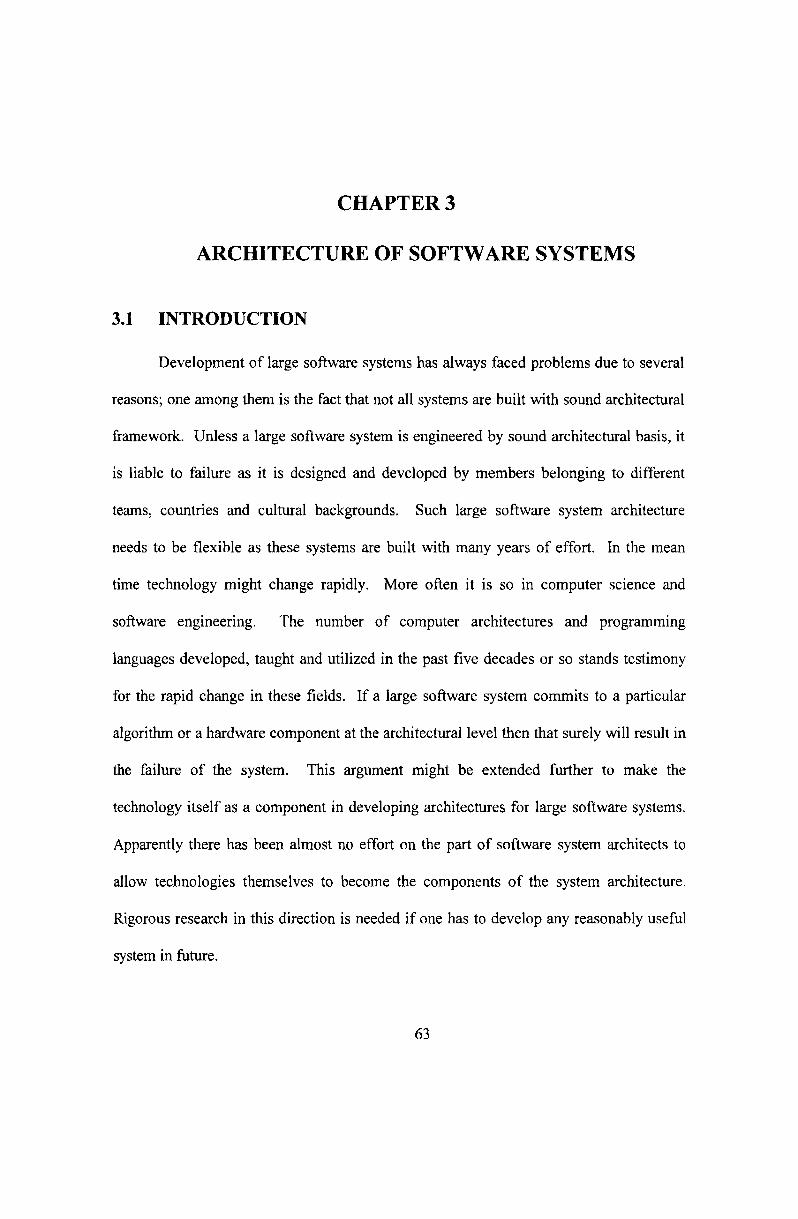
system. Information discovery therefore, could be within a distributed system. Figure
3-1 shows essentially an Information Discovery Paradigm (lOP) proposed by Srinivas
Kini & others [134]. The figure depicts an ocean of information at one end containing
the information the discoverer wants -represented by a small white square-, and the
discoverer himself at the other end along with information need being conceptualized in
his mind. The conceptualized information-need is provided to the information discovery
system (lDS) in the form of queries.
The penta-tier architecture of the software, (described in the section 3.4), helps in
exploring information from information space available in distributed environment. This
process of information exploration is nontrivial with complex activities. These are shown
symbolically in the background of the penta-tier architecture in the form of a group of
people discussing a point (refer figure 3-1).
64

..-.
•••
••••
-.·.0
..••
••••
••..-
.....
••..
Info
rmat
ion
Exp
lora
tion
...0 • • • • r
IQuer
ies
I..
Info
rmat
ion
Dis
cove
rer
Pent
a-tie
rarc
hite
ctur
eof
soft
war
e.O
cean
ofI
nfor
mat
ion
Fig
ure
3-1
Info
rmat
ion
Dis
cove
ryP
arad
igm
65
In order to facilitate better and quicker response it is essential to organize and
classify information space. In order to do this in an efficient and expedient manner the
granularity at which the information must be confronted should be the lowest possible.
The need has been expressed by researchers and scientists in various fields including but
not limited to information science, cognitive psychology, information theory, library
science, computer science, signaling theory and the like. This is evident from the
growing number of research papers by many authors in recent times that are trying to
describe and define information (discussed in chapter 4 in more detail).
Information discovery in a networked environment is inevitable. Though in
literature some authors use the term Resource Discovery (RD) to mean the information
resource discovery, H.A.Proper & P.D. Bruza have preferred the term information
discovery. This is appropriate, as users prefer to discover information of interest to them
than just the sources of information. They agree with the definition provided by Lynch
for information discovery. The definition for information discovery provided by Lynch
is as follows
Ita complex collection of activities that can range from simply
locating a well-specified digital object on the network through lengthy
iterative research activities which involve the identification of a set of
potentially relevant networked information resources, the organization
and ranking resources in this candidate set, and repeated expansion or
restriction of this set based on characteristics of the identified resources
and exploration ofspecific resources H.
66
This definition of ID clearly distinguishes itself from the "Information Retrieval"
a term coined by C.N Moores in 1952 and popularized later by Faithhorne in 1961. The
dissimilarity between ID, IR and (IF) is discussed by H.A.Proper & P.D. Bruza. To
summarize, the IR term is usually utilized in a more or less restricted (closed)
environment whereas ID occurs III a networked, uncontrolled, distributed (open)
environment. This openness of the networked environment makes the discovery of
information resources (which could be in any form viz., text, images, sound, movie,
animated pictures etc.), a nontrivial activity of repetitive nature. The repetitive nature of
the problem is mainly due to the following reasons.
First of all, the user of the networked environment (i.e. an information discoverer)
may not have a concrete and clear idea of what he/she is trying to discover. This makes
them often to reformulate their queries. They assume that the needed information exists
somewhere in the information space and there exists a path to reach the corresponding
information. Information discoverer views the problem of ID as that of exploring the
path, which takes himlher to the information that best suits the conceptual idea they have
had. As the users learn increasingly, they become more competent in describing their
needs to the IDS.
Secondly, the information can be reached only by applying multiple
characteristics one after the other. The biggest problem at times is to know when to stop
expansion and based on what criteria to restrict the candidate set. There are a large
number of alternatives available and consequently the present Internet has so many
67
varieties of search engines available that follow different strategies (See section 2.5
above.).
Thus, the ID problem is essentially to identify the right information from a vast
information space in any network. The issues identified with the ID problem are:
• Behavior of users (information discoverers).
• Representation of information.
• Refining the documents for more detailed analysis.
• Selection ofInformation.
• Characterization and categorization of information based on content.
The behavior of the information discoverers is mainly constrained by the time
available for them to discover the information. The larger the time available, the more
queries can be formulated and in different ways. The reformulation of queries by
expansion or restriction of certain characteristics is also possible. The reformulation and
multiple queries become a necessity, as it is a nontrivial task to precisely formulate the
information need of information discoverer.
Representation of information making them amenable for ID is a nontrivial task
and many alternatives have been suggested among which the metadata and new formats
(like RDF) are proposed in literature. Documents may have to be refined before really
using them in ID context. Refining them for more detailed analysis could be more
68
effective if the user (information discoverer) in a networked environment has some
control over selecting the resources and subjecting them for analysis, based on their
content.
Classification of information based on certain characteristics leading to
categorization is similar to that of document classification in library environment. The
need for a classification and analysis of information sources is pronounced by Ellis David
and Vasconcelos Ana.
Keeping in view that the information discovery paradigm is an issue involved
with the distributed systems, the experience gained by the design and development of an
Election Counting and Reporting Software (ECRS) system -that exemplifies a DS- is
considered in detail in this thesis. The following section illustrates design and
development of architecture for a DS, which in turn is composed of five different
technologies.
3.3 ARCHITECTURE OF DISTRIBUTED SYSTEMS
In order to arrive at an appropriate architecture for a DS, investigations on certain
typical application packages were carried out. It was observed that an application
relating to the counting of votes in a general election to a parliamentary constituency in
India, called Election Counting and Reporting Software (ECRS) system, would fit as an
ideal candidate as DS. ECRS system is distributed in nature and covers all the problems
discussed earlier in section 2.2. The observations recorded and the experience gained in
69
developing a monolithic architecture [161], has resulted in an architecture that further
evolved into penta-tier architecture. This architecture is presented in the next section.
3.3.1 Background
India is the biggest democracy in the world. The data of recent general elections
substantiate this fact. Elections in India generate enormous data. In order to publish the
trends and statutory reports and such other details, which would help the district
administration in managing the process of elections, it is necessary to compile data from
different points within the system.
Elections are held for various constituencies; each constituency consisting of
assembly segments. The number of assembly segments and the number of polling booths
in each assembly segment are dependent on the population. The election counting
process as it was planned and executed at the constituency where this ECRS system was
implemented is explained below.
The counting process at Shimoga (a district head quarters in Karnataka State)
constituency was carried out according to the following scheme: There were 30 counting
tables for each assembly segments (there were 8 such assembly segments), and a total of
240 counting tables were used. The ballot papers are bundled, after mixing them
properly from the ballot boxes. Each bundle contains 1000 ballot papers (except the
residual ones). Bundles are served to each table. In one round thus 2,40,000 votes would
be counted. The total number of rounds of counting depends on the votes to be counted.
70
The data was fed to the computers with software components specially designed to
analyze election data, generate reports, etc., running on different systems. These
computers were further networked in order to share the data and information.
3.3.2 System Architecture
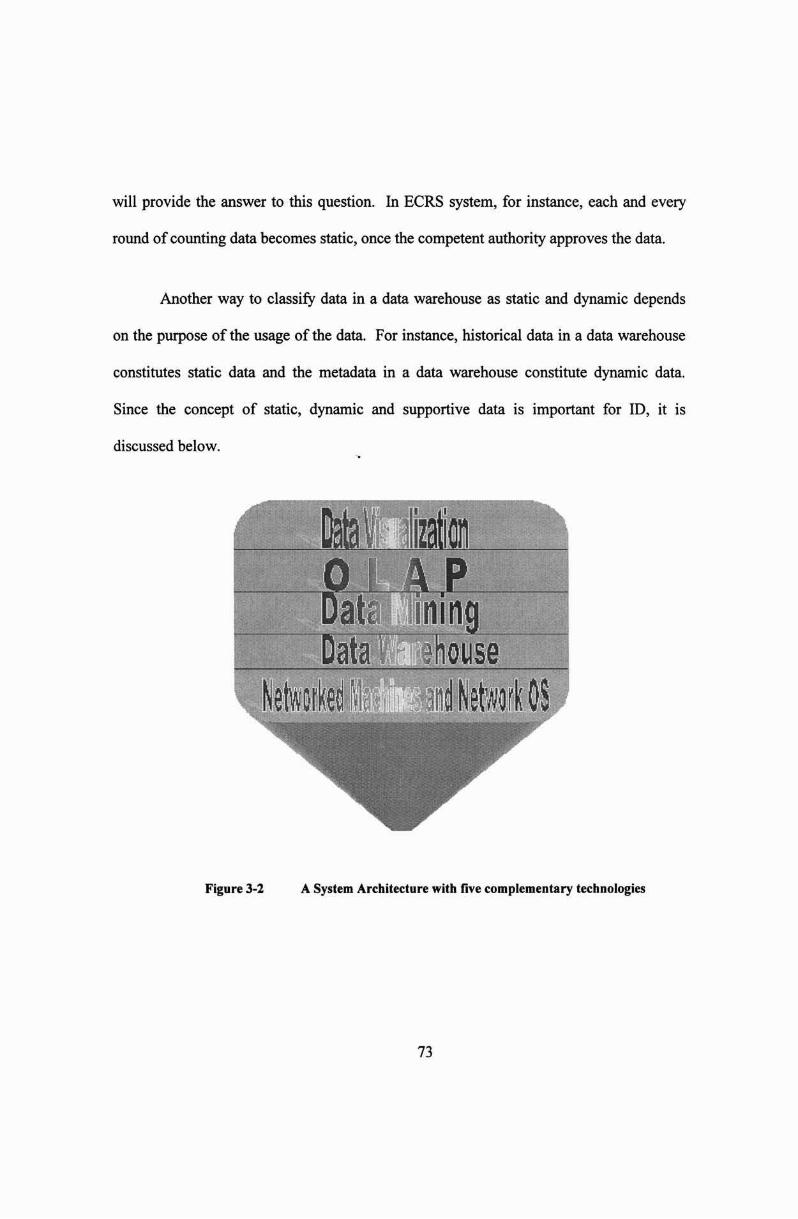
The system architecture (refer figure 3-2) contains five distinct components [162].
Theses five components are identified based on observation and experience in dealing
with any DS, which is amenable for ID.
A. Networked computing machines and Network Operating System.
B. Data warehouse
C. Data mining
D. OLAP
E. Data visualization
A. Networked computing machines and Network Operating System
It contains the necessary hardware along with the network operating system and
the network servers.
B. Data warehouse
The data warehouse is the repository for stored data and metadata. Data
warehousing involves the storage and maintenance of the data specific to the domain in
question. Any domain contains two types of data - static and dynamic. It is important to
distinguish the data in a data warehouse as static and dynamic. It serves two purposes.
71
First, it helps in determining the state of the data warehouse at any given point of time.
Secondly, such a classification of data (into static and dynamic) allows us to concentrate
on the data that is to be maintained. Different approaches for classification of data into
static and dynamic data can be had, depending on the vulnerability of data, intended
usage of data, frequency of update, the source of data and its reliability. Such a
classification helps us to increase the overall efficiency of the data warehouse. This also
helps in building fault tolerance into the system [163].
It is observed that most ofthe data in the data warehouse would be static. Almost
all data enters in to domain as dynamic data except in the initial phase of creating the data
warehouse. However in the initial phase of the creation of data warehouse, it is left to the
designer of the data warehouse to choose which data will act as static and which data will
be dynamic. The importance of the need for such a distinction between the data items
calls for a lot of attention of the designer. A failure at this point by the designer to
classify data properly results in degraded performance of the data warehouse. In
addition, mistakes committed can result at worst in total failure of the system to respond
to the user queries later.
Slowly over a period of time, depending on the domain, dynamic data becomes
static. It is an important issue for the architect of data warehouse to determine at what
point of time a dynamic data becomes static. This is where the designer of the data
warehouse must be careful. Fortunately most of the times the domain in question itself
72
will provide the answer to this question. In ECRS system, for instance, each and every
round of counting data becomes static, once the competent authority approves the data.
Another way to classify data in a data warehouse as static and dynamic depends
on the purpose of the usage of the data. For instance, historical data in a data warehouse
constitutes static data and the metadata in a data warehouse constitute dynamic data.
Since the concept of static, dynamic and supportive data is important for ID, it is
discussed below.
Figure 3-2 A System Architecture with five complementary tech nologies
73
Static (Historical) Data
Populating static data contains the following steps.
• Data Collection.
• Data preparation and validation.
Data Collection
In Shimoga constituency the general elections were held from 1952 onwards. All
the data related to election results were in the form of paper documents, which had to be
converted into electronic form. This involved a lot of interaction with the staff concerned
for collecting all the data intended to be placed in the data warehouse. During discussions
it was decided to maintain only records of the candidates and political parties who have
secured more than 50,000 votes. Such a decision is important irrespective of the domain.
Otherwise the data warehouse may be containing a lot of junk, which is not useful. For
instance, consider an independent candidate who contests only once in an election and
secures less than 50,000 votes. These records need not be maintained. In this way
system user determines the decision as to which data is to be maintained in the data
warehouse. This is so as the user is the one who wants to query on the data warehouse
and generally more competent in domain knowledge. But the designer has to educate the
user of the consequences of storing the data, which may not be very useful in the long run
and is negligible in its magnitude to disturb the final results expected by the system.
74
Data preparation and Validation
The data so collected was entered into suitable place within the data warehouse.
Automatic validation checks were performed on this data at the time of data entry. Only
the "clean data" was allowed to enter the data warehouse. A strict and stringent policy
has to be developed to make sure the data is clean. One must remember that query results
are directly affected by the cleanliness of the data warehouse. It is not only necessary to
see to it that one gets the clean data in the data warehouse, but also to maintain the data
warehouse itself clean is an issue that needs to be emphasized.
Dynamic (Election Counting) Data
In a special questionnaire form, the data was collected from each election vote
counting table. After entering the details of each counted bundle of ballot papers, these
special forms were duly signed by the authorized person. Once these special forms are
signed, they arrive at the desk of the computer data entry operator. Operator enters all the
details in the form including the assembly segment code and the counting table code into
the computer. Cross verification of the data entered by the data entry operator can be
automatically done with already available information in the system4 about the assembly
segment. The data about the number of ballot papers in one bundle fed earlier was also
used to check the entered data. In addition, the total number of votes counted and
categorized as belonging to different candidates was then summed up and it was verified
with the other data maintained by the system. Thus even before populating data into the
4 The historical data and other static data that represent the assembly segment could be used to support validation and verificationchecks.
75

data warehouse, cleanliness of data entering the data warehouse afresh was doubly
ensured by above procedure. In case of any discrepancies, they were handled in an
intelligent way. Discrepancies were also logged into a special log file. System even
drew the attention of data entry operator, who was instructed to report the matter to his
immediate supervisor to verify and take proper action. The above procedure was
followed to make sure the quality of the data and data consistency are not compromised
at any cost, which might other wise result in wrong interpretations by the software used
for its analysis later. It is advocated and emphasized that preserving data consistency and
integrity should be invariably done as it plays a vital role in the overall success of the
system.
Supportive (Meta) data
Metadata basically refers to the data of data. When the size of the data warehouse
is extremely large, metadata helps in retrieving the data in the data warehouse in an easy
and faster manner. Since metadata has to reflect the current state of the data warehouse,
it can be treated as dynamic data. This dynamic nature of metadata warrants at times
replicating the information on metadata. Such replication of metadata provides fault
tolerance to the data warehouse. Replication imposes additional overhead to the system
but it is worth carrying this out.
76

C. Data mining
Data mining is an attractive technology for users looking to make sense out of a
large volume of complex data. The fact that programs can analyze an entire data
warehouse and identify the key relationships relevant to the users is interesting for all
data analysts. Data mining uses algorithms employed to determine the key relationships
in the data. Data mining can look at numerous multidimensional data relationships,
highlighting those that are exceptional.
Different approaches that are available here include sequence-based analysis,
clustering, classification, estimation and various other techniques. In ECRS system
however simple IR techniques that are mentioned in section 2.4 earlier are used in
addition to some of the simple statistical analysis on the data.
D. OLAP
OnLine Analytical Processing (OLAP) helps in providing the kind of information
the end user is looking for, by making use of all of the data that is available in the data
warehouse at the instance of query execution. The end user requirements can be
implemented in the form of canned query. If an a priori knowledge of what the end user
is looking for can be heuristically guessed, then the data warehouse can be tuned to meet
the request of the user in the fastest possible way by using appropriate algorithms (refer
section 2.4.5). In ECRS system, the online analytical processing was employed in trend
finding, comparison of the new results with that of the old ones (by party, by candidate,
77
by assembly segments etc.). OLAP tools, process the user query for instantaneously
providing the results from the data warehouse. The analysis can vary from simple
aggregation, to complex modelling of the data. The OLAP tools can add some metadata
to the data warehouse to facilitate instantaneous results to the queries anticipated. At this
layer of the architecture, the interface with the end user must be capable of generating
query results quickly [162].
E Data Visualization
"A picture is worth a thousand words" - end users would like to view the results
in the form of graphs, charts, pictures and animations. The reason for such a demand
from the user community is two fold. First of all the user is not having interest in seeing
just numbers in the form of tables. Secondly the user's time is precious and they can
efficiently and effectively analyze the results by saving time, if the results are in a more
convenient visual fonn. Rather than simply creating statistical printouts of the results,
sophisticated online visualization for end users is appreciated. Features like the ability to
display graphics dynamically, show related 3-D graphs on the screen, and rotate graphs
so that they can be viewed from different perspectives can be therefore included here.
Basically this layer acts as the presentation layer for the system.
To conclude, a system developed by following the above architecture is far more
informative than simple tables that represent the same information, Comparison of the
results of older elections with the current one and that too using special-effect
visualization was well appreciated in informed quarters. One important attracting feature
78
of the ECRS system was to predict the result of the elections from the point when the
second round of counting results were entered into the data warehouse. The technologies
blended as discussed in the architecture are needed for full exploitation of the data
warehouse and OLAP.
The concept of static and dynamic data becomes handy in creation and
maintenance of the data warehouse. It also brings in the fault tolerance and reliability to
the data warehouse, which is an important aspect for any system.
The visualization of the data helps users to understand the interrelationships
among the data. This in turn helps them to get rid of conflicts and makes their
understanding clearer by saving their precious time. The architecture of complementary
technologies helps in making strategic decisions by the users themselves without
botheration of how and where the data is stored.
All layers in the system architecture are complementary to the other adjacent
layers. The five complementary technologies help in developing and deploying a better
system. Since most of the organizations already have networked their computing
machines for proper sharing of data and information, the lowest layer in the architecture
is already present. What is required is the creation of a data warehouse, proper selection
of data mining technique for the specific domain, using OLAP for necessary processing,
and finally the data visualization for presenting the results to the user. Five
complementary layers in the architecture can therefore be filled up with appropriate
79
subsystems within the distributed system. Each group of subsystems if assigned for a
corresponding layer in the architecture, resulting in a tier, would end up in an architecture
comprising five tiers that can conveniently be called penta-tier architecture.
This approach has mainly following advantages
• If any technology evolves, all the advantages it encompasses may he
carried into the final system instantaneously.
• If any component (basic/composite) is found to be unreliable, faulty, and
inefficient, due to underlying technology used in the development and/or
deployment of that primitive basic component and/or composite derived
components, it is easy and safe to revert hack to previously used
components, which were reliable, correct and efficient with least/no effect
on the system.
3.4 ECRS SYSTEM ARCHITECTURE
The monolithic architecture that was used in a version earlier to ECRS system
contained modules listed in table 3-1. Any single fault occurring in it could bring down
the system to a grinding halt. This is due to the architecture being fragile. In monolithic
architecture, modules were essentially developed and deployed with the assumption that
the integrity of the database is intact. This assumption may not always be true. In a
complex environment that any DS is supposed to function, all sorts of errors and faults
are possible including a compromise of database integrity. The deficiency of the
monolithic architecture was its fragileness with respect to these errors and faults.
80

Sl.No Module Name Module FunctionI Get Data To get the data from the user and populate-
database.2 Update_Data To modify the existing data in the database either
using a programming interface or directly bytampering the database.
3 Analyse Make analysis of Election database withappropriate algorithms, which includes statisticalanalysis.
4 Display Display the information in the form of graphs,charts and tables making it attractive, appealingand easy to understand for the end user.
5 PrepareForDisplay In order to display the information properlyconsolidating, classifying and assimilating relatedinformation may have to be done and this moduledoes that.
Table 3-1 Modules used in monolithic architecture
The modules listed in table 3-1 were put in appropriate layers in the penta-tier
architecture as shown in figure 3-3. Thus ECRS system is made to conform to the
penta-tier architecture. This architecture is conveniently called "ECRS system
architecture". Further wrappers around each of these modules were developed to
efficiently and effectively identify and block faults. These wrappers were designed in
such a way that they can identify both internal and external faults, especially at the
interface (layer) boundaries. In situations where the fault is detected two alternatives
exist. In the first one, either the system on its own, changes system parameters (thus
continues to function as if it is normal) or user is given a chance to review and restart
computing from the previous layer with appropriate changes in the system parameters. In
the other case a message is flashed mentioning the inability to continue further and the
culprit module and/or data is identified and reported.
81
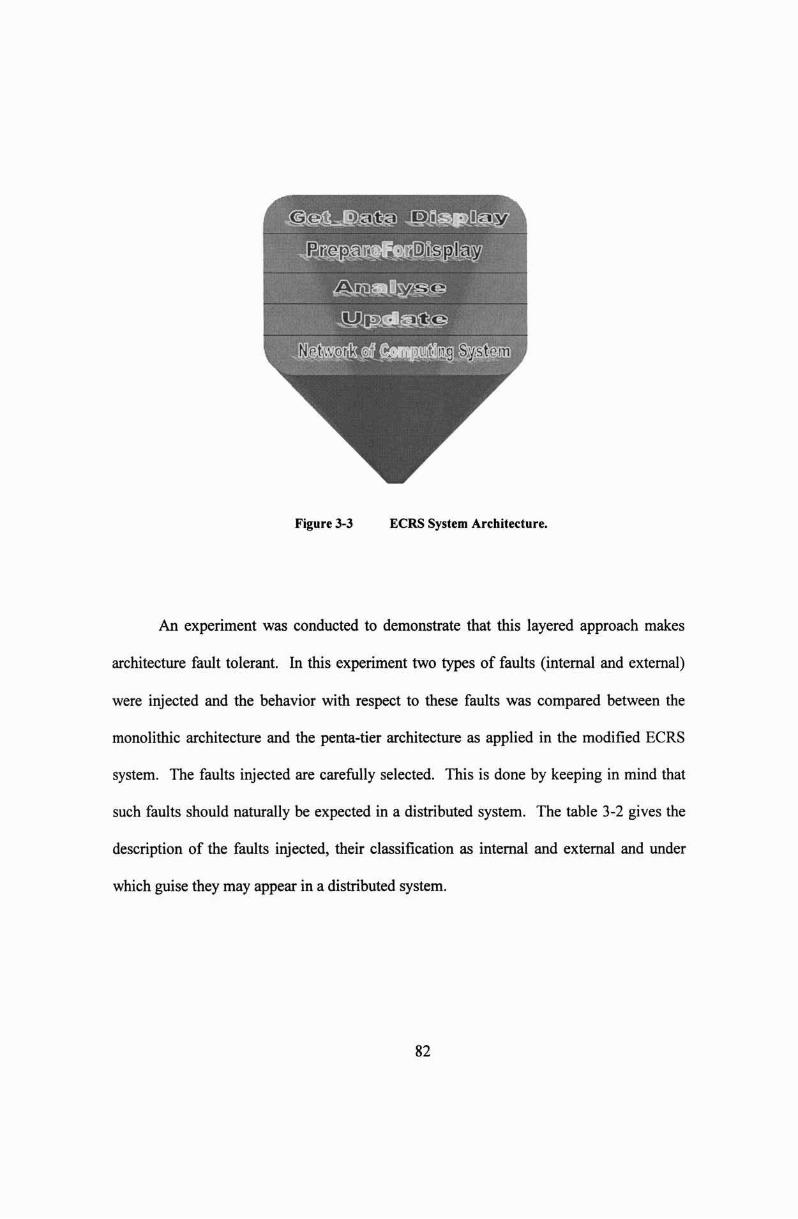
Figure 3-3 ECRS System Architecture.
An experiment was conducted to demonstrate that this layered approach makes
architecture fault tolerant. In this experiment two types of faults (internal and external)
were injected and the behavior with respect to these faults was compared between the
monolithic architecture and the penta-tier architecture as applied in the modified ECRS
system. The faults injected are carefully selected. This is done by keeping in mind that
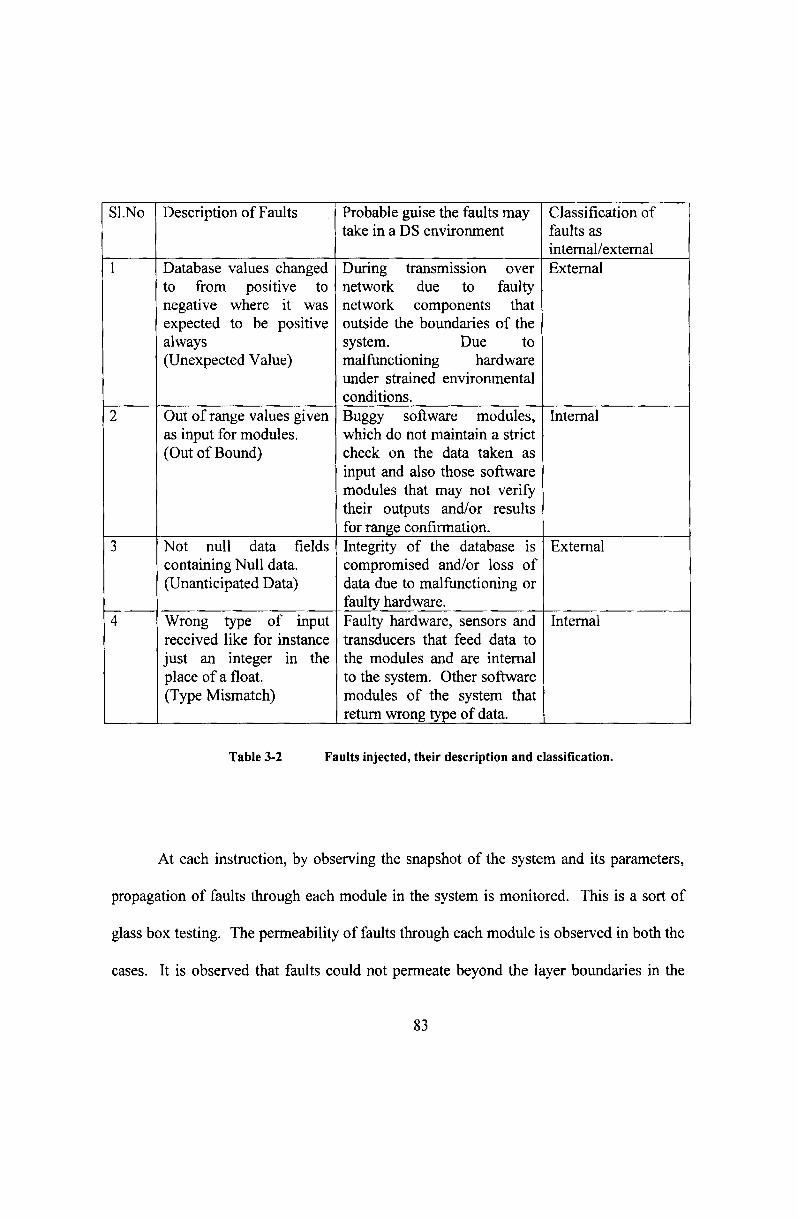
such faults should naturally be expected in a distributed system. The table 3-2 gives the
description of the faults injected, their classification as internal and external and under
which guise they may appear in a distributed system.
82
Sl.No
2
3
4
Description of Faults
Database values changedto from positive tonegative where it wasexpected to be positivealways(Unexpected Value)
Out of range values givenas input for modules.(Out ofBound)
Not null data fieldscontaining Null data.(Unanticipated Data)
Wrong type of inputreceived like for instancejust an integer In theplace of a float.(Type Mismatch)
Probable guise the faults maytake in a DS environment
During transmission overnetwork due to faultynetwork components thatoutside the boundaries of thesystem. Due tomalfunctioning hardwareunder strained environmentalconditions.Buggy software modules,which do not maintain a strictcheck on the data taken asinput and also those softwaremodules that may not verifytheir outputs andlor resultsfor range confirmation,Integrity of the database iscompromised andlor loss ofdata due to malfunctioning orfaulty hardware.Faulty hardware, sensors andtransducers that feed data tothe modules and are internalto the system. Other softwaremodules of the system thatreturn wrong type of data.
Classification offaults asinternal/externalExternal
Internal
External
Internal
Table 3-2 Faults injected, their description and classification.
At each instruction, by observing the snapshot of the system and its parameters,
propagation of faults through each module in the system is monitored. This is a sort of
glass box testing. The permeability of faults through each module is observed in both the
cases. It is observed that faults could not permeate beyond the layer boundaries in the
83
case of ECRS system architecture. Further, the fault was either identified as belonging to
a module or an intervention from the user is sought (in extreme cases only).
For each fault injected, the fault is monitored for its movement in the system,
especially across the boundaries of the layers and a measure of how many modules they
could permeate (without the fault being detected) is recorded. The permeability is
inversely proportional to the reliability and fault tolerance. This means more the value of
this measure worse is the systems reliability and/or fault tolerance capability. In the
experiment this measure is calculated using the formula pIN where p is the number of
modules permeated and N is the total number of modules in the system (5 in this
experiment as is clear from table 3-1). In the table 3-3 given below in monolithic
architecture for two of the faults, the number of modules permeated was 0 (zero) but the
system crashed (exhibiting its fragileness and non fault tolerance), while for all the cases
of faults in ECRS system architecture the measure was 0 (zero). Neither the system
stopped functioning normally nor did it crash either. In the case of fault 1 (i.e.,
Unexpected Value fault) the system changed the parameters by itself to expected values
(changing negative values to positive) and continued to function normally (bringing in
fault tolerance to the system). In the case of fault 2 (Le. Out of Bound fault), system
changed the system parameters by itself and continued to function normally by bringing
the values of parameters within the expected range. While in the case of Unanticipated
Data and Type Mismatch faults (fault 3 and 4 respectively) system asked for user
intervention (bringing in fault avoidance feature).
84

Type of Type of Classes of faults injected Number % Overall %Faults Faults (refer table 3-2.) of Permeability
modulesPermeated
Monolithic Internal 2 (Out of Bound) 5 100%Architecture 4 (Type Mismatch) o (System 0%
Crashed) 50%External 1 (Unexpected Value) 5 100%
3 (Unanticipated Data) o(System 0%Crashed)
ECRS Internal 2 (Out of Bound) 0 0%System
architecture 4 (Type Mismatch) 0 0% 0%following External 1 (Unexpected Value) 0 0%penta-tier 3 (Unanticipated Data) 0 0%
model
Table 3-3 Summarised results of the fault tolerance experiment
Table 3-3 shows the summarized results of the experiment. This table assumes
that permeability through modules, for each module in the system is equally difficult.
Based on this assumption the entries in the percentage columns (column 5 and 6
respectively) in the above table are derived.
It can be concluded from this experiment and the results in the tables that
"A layered architecture if designed for handling faults with appropriate
measures like wrappers can be fault tolerant and more reliable than a monolithic
architecture. "
85

3.5 SUMMARY
This chapter has viewed the architectural issues concerned with any DS. Some
important concepts like static, dynamic and supportive data are discussed. They
constitute the basis for the necessity of a better architectural framework. It is illustrated
that five complementary technologies can be blended together resulting in penta-tier
architecture that is fault tolerant and hence reliable. The fault tolerance of the penta-tier
architecture was justified with an experiment conducted using two versions of the ECRS
system. A more detailed analysis of information, including its definition can support
researchers in diverse fields. In the next chapter we shall throw some light on these
Issues.
86