Embed Size (px)
Citation preview

Errol Haarhoff, Paola Boarin, Natalie Allen
Architecture Graduate progression to Practice in New Zealand: 1987-2018
Research Report 1/2020

Suggested citation
Haarhoff, E., Boarin, P. & Allen, N. (2020). Architecture Graduate progression to Practice in New Zealand: 1987-2018. Research Report, School of Architecture & Planning, University of Auckland, Auckland: New Zealand.
© Copyright by Errol Haarhoff, Paola Boarin & Natalie Allen. ISBN: 978-0-473-50611-7
Cover image: MODOS Thesis Show 2019, School of Architecture and Planning, University of Auckland. Photo credits: Dean Carruthers.
Published by the School of Architecture and PlanningFaculty of Creative Arts and Industries (CAI)The University of Auckland26 Symonds StreetAuckland 1010New Zealand
Architecture Graduate progression to Practice in New Zealand: 1987-2018
This publication is copyright. Apart from any fair dealing for the purposes of research or private study or criticism or review, as permitted under the Copyright Act, no part of this publication may be reproduced, stored or transmitted in any form, without prior permission of the authors.The views expressed and the conclusions drawn are those of the authors and do not necessary reflect the views of those who have assisted with the research. This document has successfully completed formal and independent peer review for quality-assurance purposes.

Table of content
1
Table of content
Table of content ....................................................................................................................................................................... 1
Acknowledgments ..................................................................................................................................................................3
Abstract .................................................................................................................................................................................... 5
1. Introduction ........................................................................................................................................................................... 7
2. Research context............................................................................................................................................................... 11
3. Methodology ....................................................................................................................................................................... 15
4. Architectural graduates in New Zealand: 1987 to 2018......................................................................................... 19
4.1. An increasing number of architecture graduates .......................................................................................... 19
4.2. Graduates and Architecture Programmes ...................................................................................................... 20
4.3. Graduates and ethnicity ........................................................................................................................................ 23
4.4. Summary points ...................................................................................................................................................... 25
5. Registration ....................................................................................................................................................................... 27
5.1. Introduction ................................................................................................................................................................ 27
5.2. Graduates 1987-2018 and registration .............................................................................................................. 28
5.3. Progression towards registration in New Zealand ........................................................................................ 31
5.4. The ‘gap’ between graduation and registration ............................................................................................. 32
5.5. Regional distribution of graduates..................................................................................................................... 32
5.6. Summary points ....................................................................................................................................................... 35
6. Professional membership ............................................................................................................................................. 37
6.1. Membership categories .......................................................................................................................................... 37
6.2. Membership among the graduates: 1987-2018 ............................................................................................... 40
6.3. Accounting for the ‘missing’ graduates ............................................................................................................ 40
6.4. NZIA membership and engagement with practice ........................................................................................ 42
6.5. Registered Architects and NZIA Architect membership. ............................................................................. 44
6.6. Summary points ....................................................................................................................................................... 45
7. Women and Architecture .............................................................................................................................................. 47
7.1. Women and the profession of Architecture...................................................................................................... 47
7.2. Women among the architecture graduates 1987-2018. ............................................................................... 48
7.3. Women registered as Architects ........................................................................................................................ 52
7.4. Women as members of the New Zealand Institute of Architects ............................................................. 56
7.5. Summary points ....................................................................................................................................................... 60

Architecture Graduate progression to Practice in New Zealand: 1987-2018
2
8. Speaking with women about the practice and profession of Architecture ................................................... 63
8.1. Architectural education and the transition to practice ................................................................................ 65
8.2. The registration process ....................................................................................................................................... 67
8.3. Defining Architecture and the roles of the Architect ................................................................................... 69
8.5. The experiences of women in the profession .................................................................................................. 71
8.6. The future of the profession ................................................................................................................................. 73
8.7. Summary points ....................................................................................................................................................... 74
9. Conclusions and recommendations ........................................................................................................................... 77
9.1. Recommendations for the NZRAB ....................................................................................................................... 80
9.2. Recommendations for the NZIA .......................................................................................................................... 80
9.3. Recommendations for Practices......................................................................................................................... 80
9.4. Recommendations for the Schools of Architecture in New Zealand........................................................ 81
9.5. General final recommendations .......................................................................................................................... 81
References ............................................................................................................................................................................. 83
List of figures ........................................................................................................................................................................ 87
List of tables .......................................................................................................................................................................... 89

Acknowledgments
3
Acknowledgments
Producing this report has required the help of
many. We would like to thank the following key
people at New Zealand’s tertiary education
organisations:
▪ At The University of Auckland’s School of
Architecture and Planning, the Head of
School Professor Deidre Brown and her
predecessor in this role, Associate Professor
Julia Gatley; and for the provision of data,
Chris Rollins and Marlita Lovich in the CAI
Student Centre.
▪ At the School of Architecture, Victoria
University of Wellington, the Head of School
Professor Andre Brown and his predecessor
in this role, Associate Professor Morten
Gjerde; and for the supply of data, Anne
Keogh in the Architecture and Design Faculty
Office.
▪ At Unitec, the Head of School Peter
McPherson and Dr Yusuf Patel; and for the
supply of data, Riza Aguilar.
We also acknowledge the New Zealand Institute
of Architects / Te Kāhui Whaihanga (NZIA) for its
continuing support, and thank the Chief
Executive, Teena Hale Pennington, and the
immediate past NZIA President, Christina van
Boheman. Our thanks, also, to the Chief
Executive of the New Zealand Architects
Registration Board / Te Poari Kaihoahoa Ngaio
Rēhita o Aotearoa, Paul Jackman.
Our thanks to Architecture+Women•NZ and the
NZIA for assisting with the recruitment for the
focus groups.
Finally, we would like to thank the focus group
participants who gave their time and shared
their wisdom about their experiences of the
practice and profession of Architecture in New
Zealand.
Also acknowledged with appreciation is the
funding received from The University of
Auckland’s Faculty of Creative Arts and
Industries’ Faculty Research Development Fund
(Project no. 3715554).
The supply and use of data in this research and
publication is subject to protocols approved by
The University of Auckland Human Participants
Ethics Committee (reference number 021819).
While every effort has been made to ensure the
accuracy of the information presented, any
errors in the data, the interpretation of data,
and the opinions expressed and conclusions
drawn, are entirely the responsibility of the
authors and not those of the organisations and
people named.

Architecture Graduate progression to Practice in New Zealand: 1987-2018
4

Abstract
5
Abstract
This report presents the findings of longitudinal
research exploring the progression of
architecture graduates from The University of
Auckland, Victoria University of Wellington and
Unitec over a 32-year period. An initial Survey
tracked graduates from 1987 to 1999 and a
Second Survey extended the tracking to 2008.
This Third Survey in the series takes the
analysis to 2018.
The research seeks to understand how New
Zealand architecture graduates progress into
the architecture profession in New Zealand,
indicated by registration as architects and/or
membership of the New Zealand Institute of
Architects (NZIA). In addition, the report
explores gender balance among graduates and
within the profession, analysing challenges,
barriers and expectations of women among
architecture graduates and in the practice of
architecture in New Zealand.
Graduate lists were gathered from The
University of Auckland, Victoria University of
Wellington and Unitec, all offering accredited
architecture programmes in New Zealand. Data
were then compared with the public list of the
New Zealand Registered Architects Board
(NZRAB) and the various individual membership
categories of the NZIA. Additional information on
women graduates was gathered through two
focus groups held in Auckland and Wellington in
late 2019.
The research provides an evidence-based
account for use by the Schools of Architecture,
the NZRAB and the NZIA and, beyond, to all
architecture practices in New Zealand.

Architecture Graduate progression to Practice in New Zealand: 1987-2018
6

1. Introduction
7
1. Introduction
Interest in tracking the progression of
architecture graduates, and especially women
graduates, to the architecture practice and
professional registration in New Zealand was
triggered when one of the authors, Errol
Haarhoff, served as a Member of the (now
defunct) Architects Education and Registration
Board (AERB) that had powers to register (or
‘licence’) architects to practice in New Zealand1.
At that time, an observation made was that,
despite professional architecture programmes
in New Zealand then having close to gender
parity among graduates, the number of women
architects who were registered fell far short of
this proportion (Haarhoff, 2001). Of special
interest in this report is to see what changes the
data reveals.
This led to the two previous Surveys undertaken
as part of this longitudinal study, tracking the
progression of graduates from professional
architecture programmes in New Zealand, to
membership of the New Zealand Institute of
Architects (NZIA) and legal registration with the
New Zealand Registered Architects Board
(NZRAB). The First Survey tracked graduates
over the period from 1987 to 1999 (Haarhoff,
2001), and the Second Survey extended the
tracking to 2008 (Haarhoff, 2010). This is the
Third Survey and follows a 32 year cohort of
architecture graduates from 1987 to 2018.
Joining the study in this Third Survey is Dr Paola
Boarin (Senior Lecturer at the School of
1 The Architects Education and Registration Board (AERB) was
replaced in 2005 by the New Zealand Registered Architects Board under the Registered Architects Act (2005).
Architecture and Planning, The University of
Auckland), and Dr Natalie Allen (Adjunct Senior
Lecturer in the same School, and Director of The
Urban Advisory Ltd).
The Surveys have aimed to provide an evidence-
based account of the number of architecture
graduates from professional architecture
programmes in New Zealand. At the time of
writing there were three such programmes – at
The University of Auckland, Victoria University of
Wellington and Unitec Institute of Technology.
The Surveys provide a quantitative
understanding over time about the progression
of graduates into the practice of architecture in
New Zealand. They also examine the impacts of
other changes in both architectural education
and the organisation of the profession. For
example, in 2009/2010 the five-year Bachelors
programme was replaced by the so-called ‘3+2
model’ – a three-year Bachelor of Architectural
Studies followed by a two-year Master of
Architecture (Professional). The Survey period
also covers the introduction of a new
professional architecture programme at Unitec,
Auckland, in 1998.
Progression of architecture graduates to the
formal practice2 is taken as being an indicator
by membership of the NZIA and registration with
the NZRAB. While it is accepted that graduates
may engage with architecture as a career in
other ways, and in other places, it is the formal
2 In this report, the term ‘formal practice’ in this report refers to
membership of NZIA and/or registration with the NZRAB. Please see section 3. Methodology for more information.

Architecture Graduate progression to Practice in New Zealand: 1987-2018
8
links established with the NZIA and the NZRAB
that are able to be quantified.
Perhaps most important, the data and its
analysis over a 32-year period enables tracking
of women graduates, and their entry into the
profession and practice of architecture. The
First Survey (Haarhoff, 2010) found that of the
1,779 graduates between 1987 and 1999, 32 per
cent were women, but of these, only 22 per cent
went on to be registered as architects. The
Second Survey (Haarhoff, 2010) covering the
period 1987 to 2009 found that, among the 2,983
graduates, 37 per cent were women, a 16 per
cent increase between 1999 and 2009. However,
the percentage of women graduates who were
registered architects when surveyed was 17 per
cent (a reduction from the 22 per cent reported
for 1999). Gill Matthewson (2014) found a similar
proportion in Australia – despite women
constituting around 40 per cent of architecture
graduates, only 21 per cent of registered
architects were women. This most recent
Survey tracks any further changes to these
metrics in the New Zealand context through to
2018.
Since the publication of the Second Survey in
2010, there has been an expansion of interest
and concern expressed about perceived
inequalities of opportunities for women to
progress in the profession of architecture. Gill
Matthewson (2016) does however detect some
changes: the percentage of registered
architects in South Australia who were women
was relatively low, but noticed that the ‘number
of women on the register has steadily
increased’. She also observed that the number
of male registered architects seemed to have
plateaued, when compared to female
counterparts. This, as Gill Matthewson (2016)
suggested, means that women “are the main
engine of growth for registered architects.”
Despite this observation and despite there now
being gender parity among architecture
graduates, the proportion of women who are
registered as architects, while slowing
increasing, is still low when compared to men.
Allison Arieff (2018), writing in the New York
Times, reports on the same situation prevailing
in the USA: “The last major survey found that
women account for half of graduates from
architecture programmes in this country, but
they make up about 20 per cent of licensed
(registered) architects and 17 per cent of
partners or principals in architecture firms”.
These concerns have led to a deeper probe into
what lies behind the data, leading to women
architects and graduates forming stronger
alliances.
A recent response to Allison Arieff’s (2018) New
York Times article cited above, is from Julia
Gamolina (2018) who retorted with her article
Stop asking where all the female architects are:
we’re right here. She went on to argue that
instead of asking where the female architects
are, we “should start writing about their stories”
(Gamolina, 2018). Indeed, Gamolina saw the New
York Times article as one:
[…] not titled to advance our cause.
The piece did talk about redefining
success since there’s often a limited
view of what being an architect
means. But its headline, along with
a slew of others lately asking where
are the female architects, adds to
the misleading narrative that there
1. Introduction
9
are none out there. It’s a negative
story to suggest because there are
truly so many. […] We need to listen
to them [women], write about them,
amplify them, and support them in
combating the issues our industry
faces in order to change this
situation. (Gamolina, 2018)
Taking up the challenge of not asking where
they are and writing about them, Women in
Architecture organisations have emerged. Julia
Gamolina established a website, Madame
Architect3, with the mission of making the work
of women architects more visible. This was the
aim of a recent edition of the KwaZulu-Natal
Institute of Architects Journal in South Africa,
under the editorship of Karuni Naidoo, Chair of
the Women in Architecture South Africa, that
highlighted the work of women architects,
whether registered or not (Naidoo, 2016). In New
Zealand, these concerns have seen the
formation of Architecture+Women•NZ in 2011.
Now with 805 members4, its mission is to make
the work of women architects more visible. One
outcome was an exhibition of 500 women
architects’ work “as a snapshot of the
contemporary condition of how architecture and
women relate” (Simmons, 2014).
Lynda Simmons, a founding member of
Architecture+Women•NZ, made the following
observation:
I have taught almost a thousand
women during my 24 years in
3 See https://www.madamearchitect.org/. 4 Architecture+Women•NZ brings together the diverse practices
of women trained in the field of architecture and seeks to raise their profile in the public realm. See: https://www.architecturewomen.org.nz/.
education, and have watched sadly
as so much talent is lost or reduced
to the profession over time at a
higher rate than is the case with
their male friends. (How dare the
profession benefit from the skills of
graduates for their first five to 10
years of working, and then ignore
them when the issue of reduced
working hours arises? And how
foolish). I want to be part of a
profession that is able to offer more
than that to the incredible talent
that we benefit from working with.
(Simmons, 2019)
Given the importance of these issues, we have
included in this report the findings from two
focus group sessions with female architects and
architectural graduates in Auckland and
Wellington. This builds a picture of the context in
which to interpret what the numbers (that are
quantitative) are telling us.
Following this introduction, the research context
and the methodology underpinning the work are
presented. The next sections trace an analysis
of the graduates from architecture programmes
in New Zealand from 1987 to 2018 and the
progression of these graduates to registration
by the NZRAB and to Membership of the NZIA.
Two sections are devoted to women in
architecture: the first extracts relevant
quantitative data related to women graduates,
and their progression to registration and
professional membership of the NZIA; the
second, reports on the outcomes to the focus
group discussions. A summary of key points is
given at the end of the main sections, and
overall conclusion are drawn in the final
Architecture Graduate progression to Practice in New Zealand: 1987-2018
10
section, along with recommendations to
relevant organisations.
The data and the information presented provide
a profile of architecture graduates and
progression to the practice of architecture in
New Zealand. Given that this is the third in a
series of studies, we are also able to make
comparisons with previous findings and reveal
key changes. We also identify what may be key
issues for educators and the profession in the
decade ahead to ensure the relevance of the
profession in a changing world and for the
profession to have continuing leadership roles
in the shaping the built environment.
2. Research context
11
2. Research context
As outlined in the previous Survey (Haarhoff,
2010), it is surprising to discover that not all
graduates of architecture appear to enter
architecture practice, given the competition for
places in programmes and the commitment that
is required to complete the degree. The 2010
report noted that there seemed to be little
empirical data on what Olsen (1994) saw as the
“significant falloff between graduation (in
architecture) and licensure” and this largely
remains the case. To investigate the context
surrounding this falloff, a review of the
literature surrounding the profession – and the
education that underpins it – has been
undertaken to frame the findings developed in
this research.
Architecture is a long-established profession
that has evolved alongside the environments in
which we live. To understand what constitutes
the architectural profession in today’s context,
the following section of the literature review
explores both the practice of architecture and
the roles of those practising. The terms
‘architecture’ and ‘architect’ are not easily
defined, with diverse views of what makes both
the practice and the practitioner (Quintal, 2016).
Historically, definitions of architecture have
connotations of “mastery”, “genius” and
“autonomy” (Lange & Scott, 2017) and recent
literature explores these terms as supporting
the traditional, competitive, “hero” culture of
architecture (Matthewson, 2012; Heynen, 2012;
Thompson, 2016; Ahuja, Nikolova, & Clegg, 2017).
In New Zealand, the New Zealand Registered
Architects Board (NZRAB) defines an architect in
legislative terms (a ‘title registration’ approach)
– “only a person who is a Registered Architect is
allowed to describe him or herself as an
architect” (New Zealand Registered Architects
Board, 2004) –, while the New Zealand Institute
of Architects (NZIA) offers a definition of the
architect described in terms of skill – “an
architect’s work is essentially driven by four
fundamental elements: technical skill, practical
understanding, analytical ability and creativity”
(New Zealand Institute of Architects, n.d.-a).
In 2011, the Royal Institute of British Architects
(RIBA) published a study in which they
interviewed over forty individuals from across
the built environment professions, to compare
long term views of the industry (Jamieson,
Robinson, Worthington & Cole, 2011). The study
found that, generally, the architect’s role is
growing and morphing in line with the changing
nature of built environment projects, with many
architects diversifying by forming new identities
alongside their existing ‘architect’ identity. A
more recent wide-scale study of architectural
education and the profession across Australasia
found many architects working in more
specialist areas rather than the “established
generalist model” of architecture (Architects
Accreditation Council of Australia, 2019, p.25).
The study also identified a growing tension
between architecture and surrounding
disciplines, with “a proliferation of other
professionals and semi-professionals operating
in specialist fields of knowledge, some of which
are seen as encroaching on the architect’s

Architecture Graduate progression to Practice in New Zealand: 1987-2018
12
traditional domain” (Architects Accreditation
Council of Australia, 2019).
The ‘title registration model’ that we use in New
Zealand is under question. RIBA’s 2011 study
determined that the label ‘architect’ (as used in
a title registration model in the UK) can be
restrictive, prompting questions around whether
regulatory bodies may need to evolve the “20th
century definition of what it means to be an
architect in order to fit better with the broader
21st century reality of the profession”
(Etherington, 2011). Further to this, a 2015 study
by Architecture Accreditation Council of
Australia (AACA) found that the title registration
model may discourage people from registering
because they “can work in architect-like roles
indefinitely – including rising to senior
management and even partnership positions in
firms – without there necessarily being an
imperative to undertake registration”
(Architects Accreditation Council of Australia,
2015, p.17).
Early adopters of modern, flexible, modes of
working have seen benefits in their employees’
well-being and overall productivity (Werk, 2019).
Still, architecture, as a traditionalist profession,
has been said to have been lagging in its
adoption of these modes as it clings to its
nineteenth-century roots (Lange & Scott, 2017).
Lisa Hinton, director of a New Zealand
architecture firm, highlights this as an
important issue:
Our industry hasn’t worked out how
to accommodate flexible working,
which is partly because of the
nature of construction and the five
day a week commitment often
required […]. Our industry should be
doing more to promote flexible
working and address what is a real
issue of losing our talented women
because of rigidity and old ways of
working. (Strang, 2018)
In the previous study (Haarhoff, 2010), one
explanation offered for the falloff between
education and registration of graduates was the
pursuit of alternative careers. This explanation
is increasingly valid with the flexible future of
work. Recent literature references the diverse
skill sets of architecture graduates, enabling
easy “side-stepping” to other careers (Waldrep,
2014; Thompson, 2016). A recent study by the
AACA (2019) highlights the many pathways
available to architectural graduates within and
beyond traditional practice, finding that,
anecdotally, many graduates pursue careers
outside the traditional practice but in related
fields. However, little research has been
undertaken specifically about career paths of
Australian and New Zealand graduates, so there
is little data on graduate ‘destinations’
(Architects Accreditation Council of Australia,
2019).
Historical architectural pedagogies are widely
still in use. However, their relevance is
questioned (Barton, 2015), with alternative
pedagogies increasingly adopted to promote
collaboration and empathy in architectural
education, as a reflection of aspirations for the
profession (Thompson, 2016; Brown & Moreau
Yates, 2000; Carpenter & Hoffman, 1997; Fisher,
2000; Sara, 2000; Sutton, 2014). There is a
particular focus on the introduction of ‘live
projects’ into architectural education (Harriss &
Widder, 2014; Harriss, 2015; Pretty & McPherson,

2. Research context
13
2017). In Encountering the Pedagogy of Live and
Interactive Architectural Projects (2017), Pretty
& McPherson look to ‘untangle’ the live projects
model in a New Zealand context. They find value
in live projects to enable education to come
closer to practice, “moving from the speculative
notions within many of the traditional studio
briefs to the quite tangible build, i.e., potential
architecture”. Further, the findings in AACA’s
report on architectural education and the
profession (2019) reinforces the value of
bringing architectural practice closer in line
with education, in parallel with aspirations for
enhanced student exposure to practice and
increased focus on practical matters in
education.
As identified in the introduction, research shows
that more women are studying architecture and
that the proportion of women in architecture
overall is increasing (Haarhoff, 2010;
Matthewson, 2018). However, despite rising
numbers, women’s representation at senior
levels remains low and some research indicates
that there has been a sustained disappearance
of women from the profession (Matthewson,
2018). The aforementioned labels, historically
used to describe architects and architecture,
include “master(y)”, “genius” and “hero”. Studies
have suggested that these labels not only
reinforce the individualist nature of architecture
but also are attributed to masculinity in the
profession (Heynen, 2012; Matthewson, 2017;
Reimer, 2016). In discussion about her seminal
PhD study (2015), in which she interviewed over
seventy architects, Matthewson comments that:
No man in my study mentioned
fragility of confidence in design
ability, but a significant number of
the women did. This kind of self-
critique is a reaction of the
internalisation by women of their
‘other’ status, of at some level
knowing that creative genius (or
even merit) resides with men not
women, and that they therefore
don’t quite “belong”. (Matthewson,
2017)
Since the previous report on this study
(Haarhoff, 2010), the voice of women in
architecture has been amplified, alongside the
‘fourth wave of feminism’ that began in 2012
(Clark, 2016). As mentioned in the report
introduction, there has been a substantial
growth in women’s architecture groups. This
growth includes the formation of
Architecture+Women•NZ (A+W•NZ) in New
Zealand, Parlour in Australia, Women in
Architecture South Africa, Equity by Design
(EQxD) and ArchiteXX in the US, and the UK-
based annual Women in Architecture survey and
awards (Matthewson, 2017). In New Zealand,
A+W•NZ contributes to research, through
surveys and publications, as well as guidelines
for practise and networking events. Since 2011,
A+W•NZ has ‘collected stories’ from its members
and colleagues and published them on their
website, to highlight the experiences of women
in architecture in New Zealand and make this
voice louder.
Recent studies have highlighted the continued
pattern of women ‘disappearing’ from
professional demographics following graduation
and absent in registration statistics (Clark,
2016). General findings are that women
‘disappear’ as seniority increases and that a
higher proportion of women are employees

Architecture Graduate progression to Practice in New Zealand: 1987-2018
14
rather than employers; these trends are
noticeable in New Zealand, as well as Australia,
the US, the UK and Canada (Matthewson, 2016;
Matthewson, 2017; Strang, 2018; Campbell, 2019).
In line with this, it is frequently noted that
women in architecture lack role models and
that this lack of visible role models is a crucial
contributor to the departure of women from
architecture (Omoyeni et al., 2019; Hochstein,
2017). A recent Equity by Design survey revealed
that almost a third of the women who had left
architecture in the US cited the lack of role
models as the deciding factor (Pitts at al., 2015).
As Hochstein, in New Zealand, points out:
Many architectural graduates
highlight a need for female role
models who hold senior positions
who could act as mentors. To help
with architectural and career
development, female graduates are
encouraged to request a mentor.
(Hochstein, 2017).
Long working hours and difficulty balancing
professional and family life are problems for
both men and women in architecture. These
issues impact women in the profession in
different, specific and compounded ways (Stead
et al., 2017). The combination of a ‘long-hours’
working culture which impacts work-life
balance, and a lack of flexible hours, were the
number one reasons listed in the May 2016
Australian Institute of Architects (AIA) survey
about why women are under-represented in
architecture (Hochstein, 2017). Clark (2016)
notes that women are adopting survival tactics
in light of this, by diversifying, moving to small
practice or stepping sideways within the wider
profession.
As the profession of architecture is evolving, it
is timely to investigate the current nature of the
architectural profession and education in New
Zealand. The literature has revealed challenges
in the formation of a modern architect identity,
particularly for women, and highlighted barriers
to progression in the industry. These factors
have informed the need for an updated study on
the contemporary context of architecture in the
country to understand how they impact New
Zealand and identify areas for improvement.
3. Methodology
15
3. Methodology
The quantitative methodology used in the
previous two Surveys is repeated in this third
instalment of the research. Although relatively
simply, it is remarkable what numbers it can
reveal, a point underscored by Gill Matthewson
(2018) in relation to gender:
Numbers matter! They help us
understand the macro picture of
women in architecture. Analysing
data allows us to identify patterns,
both pleasing and worrying; it
provides evidence of the structural
impediments faced by women as a
group, and gives important context
for the stories of women in
Australian architecture. The
knowledge gained through data
analysis is vital for developing
strategies for change. (Matthewson,
2018)
The method involves tracking architecture
graduates by name across two data sets: the
public list of individual architects registered by
the New Zealand Registered Architects Board
(NZRAB)5, and the various individual
membership categories of the New Zealand
Institute of Architects (NZIA)6. While this sounds
easy, the quantity of data is large and
processing is complicated.
5 For the purposes of this study, Licenced Building Practitioners
are excluded. 6 It is to be clarified that, while membership to the NZIA is not
mandatory, it still represents an important measure of engagement with the professional community.
Crucial to the Survey are the graduate lists from
the educational organisation in New Zealand
providing relevant architecture qualifications,
applying approved research methods and data
confidentiality protocols7. While educational
organisations offer a range of qualifications in
the field of architecture and related disciplines,
such as the Bachelor of Architectural Studies,
and research degrees at Master and Doctoral
levels, it is only the graduates from architecture
programmes recognised and accredited by the
professional organisations that are included in
this Survey. These are the qualifications that
provide pathways to the profession of
architecture and formal practice. Over the
survey period (1987-2018) there were three
Schools of Architecture providing qualifications
recognised by the NZRAB and the NZIA: those at
The University of Auckland, the Victoria
University of Wellington and the Unitec Institute
of Technology in Auckland8. Over the 32 years
covered by this Survey, the accredited
qualification has changed from the Bachelor of
Architecture (BArch), to the Master of
Architecture (Professional) (MArch(Prof)).
Each educational organisation provided
graduate lists for their BArch and MArch(Prof)
qualifications for the period 2008-2018. The lists
gave the full legal name, gender identification
7 Research protocols approved by The University of Auckland
Human Participants Ethics Committee reference number 021819.
8 These are the three professional programmes offered up to the end of 2018. There are currently proposals for new architecture programmes at other universities, such as one at the Auckland University of Technology’, but there were no graduates up to the end of 2018 for inclusion in this survey.

Architecture Graduate progression to Practice in New Zealand: 1987-2018
16
and the year in which the qualification was
completed. The graduation data was merged
with that used in the First and Second Surveys,
to provide a comprehensive data set of all
relevant graduates between 1987 and 2018
inclusive.
As in the previous two Surveys, formal
engagement with the architecture profession in
New Zealand is taken to be indicated by holding
membership of the New Zealand Institute of
Architects, and/or legal registration (‘licensing’)
by the New Zealand Architects Registration
Board. This Third Survey is inclusive of all
relevant graduates who completed
qualifications between 1987 the end of 2018.
Their names are compared and identified on the
NZIA membership list as it stood at the end of
2018, and to graduates admitted to the NZRAB
register during 2018. The list and the register
are dynamic, with people joining and leaving at
various times. Consequently, the method
provides a ‘snapshot’ of NZIA membership and
registration status among the all relevant
graduates between 1987 and 2018.
Tracking the progression of graduates to
registration by the NZRAB and membership of
the NZIA is done by comparing lists and
identifying names across spreadsheet lists.
Automation of this process, however, was not
possible because of inconsistencies in the way
data is recorded by the organisations
concerned. For example, while educational
organisations provide full legal names of
graduates, these are not necessarily used when
graduates register with the NZRAB or seek
membership of the NZIA. Many, for example, use
informal or shortened first names. In most case
these can be resolved by cross-checking other
data, such as that on the registration list (if
registered) and the date of degree completion. A
further difficulty is matching graduates where
Asian first names are ‘anglicised’, especially
when part of a group with common family
names and when family names change (such as
through marriage). In a few cases, graduates
had identical first and family names, but most of
these were resolved by considering their
registration, degree completion dates, and
location. Consequently, the comparison of
names across lists was done manually,
resolving inconsistencies by interrogating the
information available.
Given these difficulties, not all graduates from
the Schools who are registered or members of
the NZIA are fully identified. This means that the
analysis is likely to be undercounting those
registered and/or members of the NZIA.
However, the margin of error is calculated to be
small – less than 5 per cent – and does not
impact the broad trends and conclusions
indicated by the data.
In this Third Survey, the declared ethnicity of
each graduate between 2009 and 2018 was also
collected for the first time. Processing this data
proved to be difficult because organisations use
different self-declared ethnic descriptions. For
some organisations, ‘Asian’ is a single category,
but for others this is divided into categories
such as ‘Indian’, ‘Chinese’, and so on. For some
‘European’ means from Europe, while in other
cases this is linked to ‘Pakeha’9 meaning New
Zealanders of European origin. Some
9 Originally, the Pakeha were the early European settlers,
however, today 'Pakeha' is used to describe any peoples of non-Maori or non-Polynesian heritage.

3. Methodology
17
organisations permitted multiple ethnic choices,
such as ‘Pakeha/Māori’. Variable terms are also
used to describe those of Polynesian origin, and
not declaring ethnicity is an option. To overcome
these problems, various categories and
descriptions are recombined to produce broad
categories useful for analysis. However, a
relevant problem with this data is the large
number of graduates who do not self-declare
their ethnicity.
The other inconsistency is the date of
qualification completion, with confusion
between the year of graduation (degree
conferment) and the year of completing
requirements for the award of the degree. To be
consistent across the data set, we have used the
year in which the qualification is completed as
the graduation date. While in the past, most
qualifications were completed within a calendar
year (usually by the end of a calendar year),
Schools now offer mid-year completion,
especially with newer Masters’ degree.
Consistency is maintained by identifying the
year in which requirements for the award of the
qualification is completed. This introduces a
potential small difference when calculating
certain information, such as the number of
months between qualification completion and
registration with the NZ Registration Board.
There are also potential terminological
confusions to be highlighted. At the time of the
Survey, there were three professional
architecture programmes offered in New
Zealand at the named educational organisations.
Although each organisation has different
administrative structures around a range of
degree programmes and qualifications offered,
reference is made to the commonly understood
term of ‘Schools of Architecture’ (abbreviated to
‘Schools’). Where used, this means that the
academic unit delivering the architecture
programme of study is recognised by the
professional bodies in New Zealand. A further
potential confusion is between ‘graduates’ from
the Schools of Architecture, and the ‘Graduate’
category of membership offered by the NZIA. To
make the distinctions, the term ‘graduate’ is
used generically as reference to all those who
complete the recognised qualification, whether
or not they are registered by the NZRAB or hold
membership of the NZIA. A distinction is made
between such ‘graduates’ and those who hold
‘NZIA Graduate’ membership, one of a number of
membership categories offered by the NZIA.
New in this Third Survey, is the inclusion of
outcomes from two focus group discussions in
Wellington and Auckland with women
architecture graduates. In the previous Survey
(Haarhoff, 2010), it was found that despite the
architecture programmes reaching a point of
gender equity among graduates, this was not
the case with women who were Registered
Architects. While accepting that there will be a
‘lag’ before registrations to catch up with
historic graduate gender inequity, this Third
Survey will reveal whether or not this has been
achieved, or the extent to which this may have
changed. The quantitative part of the Survey
that analyses numbers can describe what the
situation is now, but it cannot explain why this is
the case. It is for this reason that we have
included the focus group discussions. The
methodology used in this part of the study is
described below.
Focus groups were audio recorded and
transcriptions made, in alignment with the

Architecture Graduate progression to Practice in New Zealand: 1987-2018
18
requirements of The University of Auckland
Human Participants Ethics Committee. To
interpret the focus group discussion
transcriptions, a coding system was used to find
common themes and inform further discussion.
The coding system allowed these themes to be
examined on both macro and micro scales, by
passing them through three levels of coding.
The first code (Code 1) identified broad, key
themes from the discussions in both Auckland
and Wellington, keeping the Auckland and
Wellington transcripts separate. Each transcript
was then categorised by these themes,
allocating all text to a macro category (by
highlighting text according to a colour code).
Code 2 was used to refine this further, by using
these macro categories as headings under
which the text from each transcript was
grouped to form the beginnings of
comprehensible clusters of information (at this
point it became evident that overlapping text
was relevant to more than one category). Code
3 was used to distil these clusters into more
refined categories, introducing subheadings to
each broad category. This produced micro-
categories under which all text from Auckland
and Wellington transcripts was organised,
grouping similar ideas from the two focus
groups together. The resulting micro categories
are generally aligned with themes from the
literature review.
While noting the small margin of under-
counting discussed above when matching
graduates with the lists of registered architects
and membership of the professional
organisation, this provides a reasonably
accurate ‘snapshot’ of the progression of
graduates into practice in New Zealand, using
association with NZRAB and NZIA as a measure
of such practice engagement. It also enables
more detailed analysis, such as changing trends
over time, and in particular is able to trace the
roles of women. However, as the analysis will
show, less than half of all graduates become
registered architects or join the NZIA. While
numbers concerned can be calculated, precisely
where the other half of graduates are, and what
they are doing, cannot be determined using this
data. It requires post-qualification surveys able
to track graduates – something that some
tertiary institutions attempt to do. However,
these surveys tend to be very unreliable
because the percentage of returns to requests
for information tend to be very low. Also
included will be international students, who
either have no intention to enter practice in New
Zealand or have visa limitations preventing
them from doing so. In professional architecture
programmes in New Zealand, international
enrolments have only become prominent in the
past 10-15 years, but account for no more than 11
per cent of graduates (Architects Accreditation
Council of Australia, 2019).
Percentages given in the Tables across this
report in some case include one decimal point,
but when discussing in the text these are
rounded to whole numbers.
4. Architectural graduates in New Zealand: 1987 to 2018
19
4. Architectural graduates in New Zealand: 1987 to 2018
This section presents the findings about
architectural graduate numbers from 1987 to
2018 in New Zealand.
4.1. An increasing number of architecture
graduates
The data provided by the three New Zealand
Schools of Architecture shows that, from 1987 to
2018 inclusive, 4,814 students graduated with
accredited professional programmes in
architecture. The number of graduates in each
year significantly increases from 85 in 1987 to
226 in 2018 – an increase of 165 per cent over 32
years. This growth is a consequence of an
increasing number of graduates produced by
each School (a consequence of larger intake to
the Schools), and the commencement of the
new programme at Unitec producing its first
graduates in 1998.
While the data shows an increase in the number
of graduates over the survey period, this occurs
over a period when the New Zealand population
has increased. Understanding of the relationship
between the increases in the number of
graduates and the national population indicates
if graduate numbers are keeping pace with
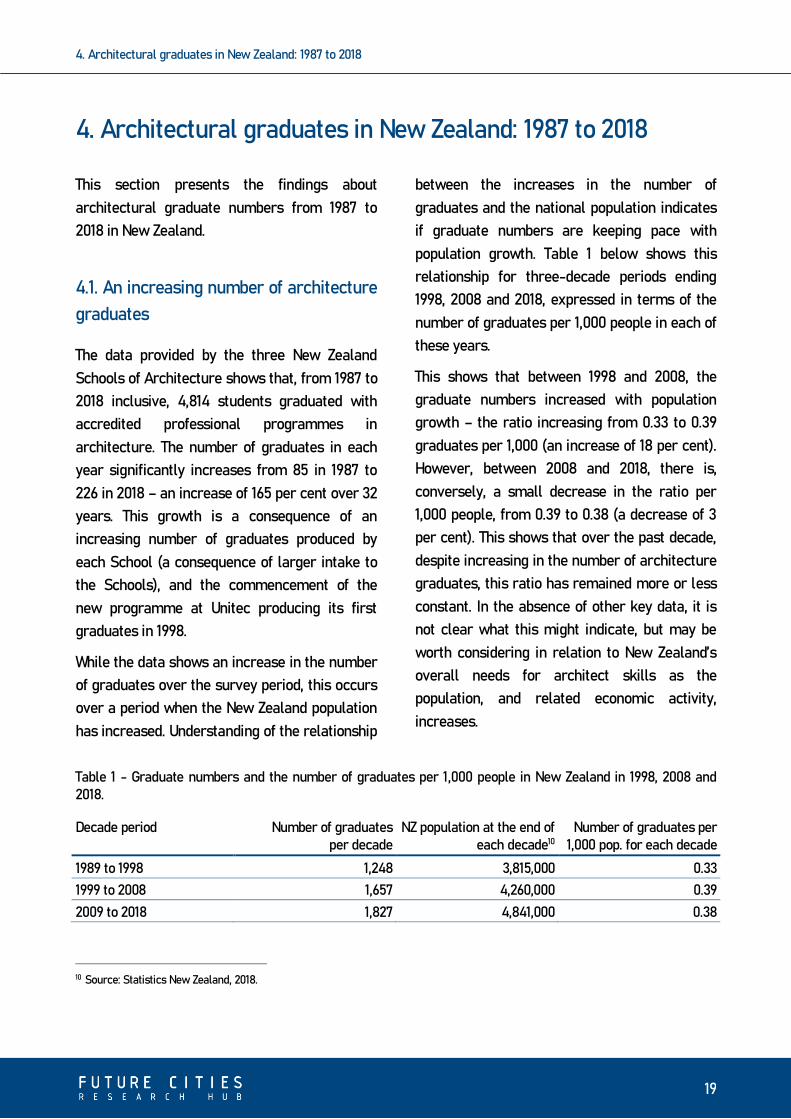
population growth. Table 1 below shows this
relationship for three-decade periods ending
1998, 2008 and 2018, expressed in terms of the
number of graduates per 1,000 people in each of
these years.
This shows that between 1998 and 2008, the
graduate numbers increased with population
growth – the ratio increasing from 0.33 to 0.39
graduates per 1,000 (an increase of 18 per cent).
However, between 2008 and 2018, there is,
conversely, a small decrease in the ratio per
1,000 people, from 0.39 to 0.38 (a decrease of 3
per cent). This shows that over the past decade,
despite increasing in the number of architecture
graduates, this ratio has remained more or less
constant. In the absence of other key data, it is
not clear what this might indicate, but may be
worth considering in relation to New Zealand’s
overall needs for architect skills as the
population, and related economic activity,
increases.
Table 1 - Graduate numbers and the number of graduates per 1,000 people in New Zealand in 1998, 2008 and 2018.
Decade period Number of graduates per decade
NZ population at the end of each decade10
Number of graduates per 1,000 pop. for each decade
1989 to 1998 1,248 3,815,000 0.33
1999 to 2008 1,657 4,260,000 0.39
2009 to 2018 1,827 4,841,000 0.38
10 Source: Statistics New Zealand, 2018.
Architecture Graduate progression to Practice in New Zealand: 1987-2018
20
4.2. Graduates and Architecture
Programmes
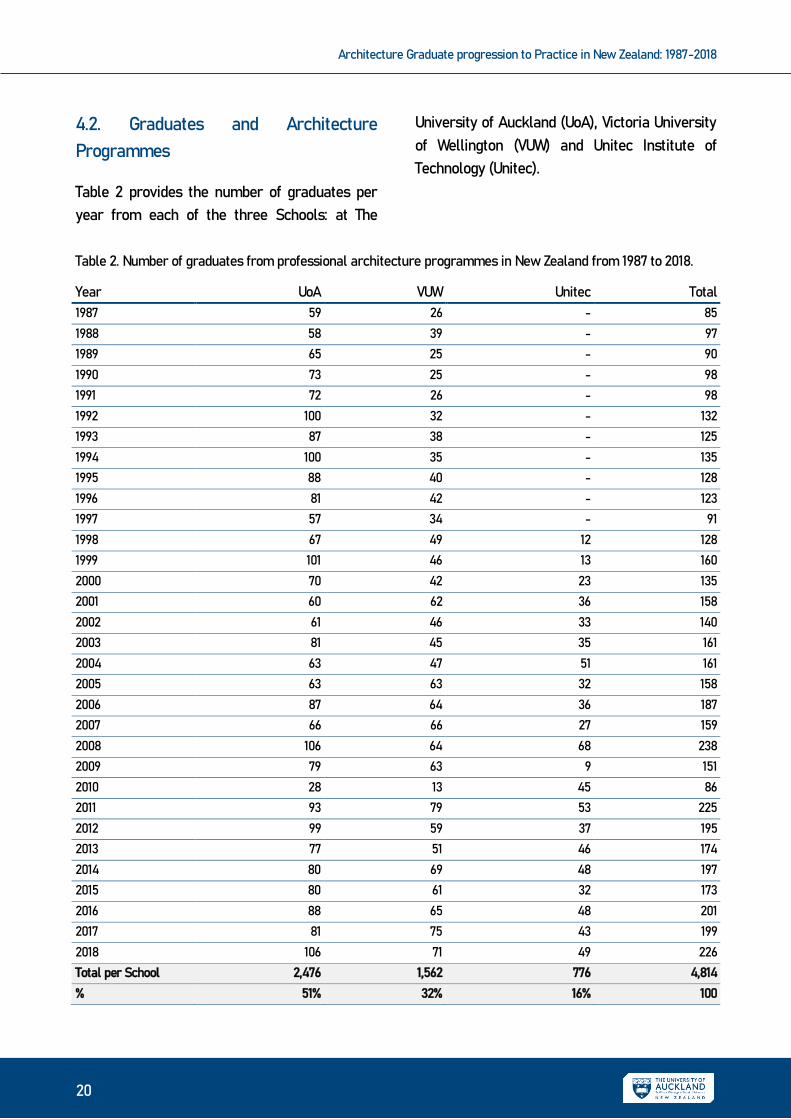
Table 2 provides the number of graduates per
year from each of the three Schools: at The
University of Auckland (UoA), Victoria University
of Wellington (VUW) and Unitec Institute of
Technology (Unitec).
Table 2. Number of graduates from professional architecture programmes in New Zealand from 1987 to 2018.
Year UoA VUW Unitec Total
1987 59 26 - 85
1988 58 39 - 97
1989 65 25 - 90
1990 73 25 - 98
1991 72 26 - 98
1992 100 32 - 132
1993 87 38 - 125
1994 100 35 - 135
1995 88 40 - 128
1996 81 42 - 123
1997 57 34 - 91
1998 67 49 12 128
1999 101 46 13 160
2000 70 42 23 135
2001 60 62 36 158
2002 61 46 33 140
2003 81 45 35 161
2004 63 47 51 161
2005 63 63 32 158
2006 87 64 36 187
2007 66 66 27 159
2008 106 64 68 238
2009 79 63 9 151
2010 28 13 45 86
2011 93 79 53 225
2012 99 59 37 195
2013 77 51 46 174
2014 80 69 48 197
2015 80 61 32 173
2016 88 65 48 201
2017 81 75 43 199
2018 106 71 49 226
Total per School 2,476 1,562 776 4,814
% 51% 32% 16% 100

4. Architectural graduates in New Zealand: 1987 to 2018
21
While both The University of Auckland and
Victoria University of Wellington produced
graduates over the full survey period (1987-
2018), Unitec had its first graduating cohort in
1998. Over this period, the Bachelor of
Architecture was replaced with a Master of
Architecture (Professional) at The University of
Auckland and Unitec in 2009, and at Victoria
University of Wellington in 2010.
Table 2 also shows, over the 32-year Survey
period, that The University of Auckland produced
just over half of all professional architecture
graduates in New Zealand (51 per cent). Just
short of one-third were from Victoria University
of Wellington (32 per cent), while the new
programme at Unitec produced 16 per cent. The
percentage for Unitec is misleading because
they only produced their first graduates in 1998.
Recalculating this for all schools from 1998 to
2018 shows that, over this period, Unitec
contributed 22 per cent of graduates. Figure 1
shows the data in Table 2 in chart form.
Despite annual variations, Figure 1 clearly
shows the steady increase in the number of
graduates from 1987 to 2018. Also shown are
different growth rates when comparing the
three programmes. Graduation numbers for The
University of Auckland indicates strong growth
from 1987 (59 graduates) to 1994 (just over 100
graduates), but over the following decade (1999
to 2008) the number of graduates averaged 76
per year. The average over the past decade
(2009-2018) is 73 per year. This indicates that
apart from the growth between 1987 and 1994,
graduate numbers have remained fairly
consistent without significant growth. In part,
this reflects the cap on new enrolments that is
linked to the available studio resources, despite
the number of applications far exceeding places
available.
Figure 1. Number of professional architecture graduates by year of completion at The University of Auckland, Victoria University of Wellington and Unitec, and the total number of graduates in the period 1987-2018.
0
50
100
150
200
250
300
1987
1988
1989
1990
1991
1992
1993
1994
1995
1996
1997
1998
1999
2000
2001
2002
2003
2004
2005
2006
2007
2008
2009
2010
2011
2012
2013
2014
2015
2016
2017
2018
UoA VUW Unitec Total

Architecture Graduate progression to Practice in New Zealand: 1987-2018
22
The programme at Victoria University of
Wellington, on the other hand, shows more
vigorous growth. Figure 1 shows that there has
been a steady increase in the number of
graduates from 1987 (26), to 2018 (71), fed by a
steady increase in enrolments over the survey
period. In part this has been facilitated by
investment in a new building on the Te Aro
campus, opened in 1994, and further expansion
of space and other improvements over more
recent years. Over the last decade, the average
number of graduates was 61 per year.
As a new programme, it is not surprising that
the Unitec graduate numbers grew sharply from
the first graduates in 1998 (12) to 2004 (51).
Graduate numbers over the past decade have
been fairly stable, averaging 41 per year.
There are also two prominent ‘dips’ in graduate
numbers in Figure 1: around 1997 and 2009/2010.
The 1997 dip was explained in the Second
Survey (Haarhoff, 2010, p.13) and related to the
restructuring of the programme at this time that
delayed degree completions. This involved the
disestablishment of the one-year Architecture
Immediate and four-year Bachelor of
Architecture, replaced with a five-year Bachelor
of Architecture. This required some students to
complete an additional year before graduating.
The second and more dramatic decline in
graduate numbers occurs in the years
2009/2010 across all Schools, clearly tracked in
Figure 1. This is attributed to yet another
programme restructuring: the change from the
five-year Bachelor of Architecture to the two-
degree ‘3+2 model’ adopted by all architecture
programmes. This involved the introduction of
the 3-year Bachelor of Architecture Studies
followed by a 2-year Master of Architecture
(Professional). In part, it reflects students
strategically delaying their academic study in
terms of progression rules, in order to graduate
with a Masters’ degree. This was also preceded
by the Global Financial Crisis (GFC) in 2007 that
may have impacted enrolments to these years.
Despite annual variations, increases in graduate
numbers over the 32-year period are
significant: from 85 in 1987 to 226 in 2018. The
previous Survey (Haarhoff, 2010, p.10) forecasted
that the total number of architecture graduates
would increase to around 230-240 per year by
the 2020’s, based on the growth trends indicated
over the previous decade. This Third Survey now
shows that the forecast growth has not
eventuated, with an average number of
graduates from all programmes over the past
decade (2009-2018) being 183 per year. The
average over the past five years is 199 per year.
It is not known how graduate numbers reflect
career opportunities in New Zealand. The
government website ‘Careers’ states that the
“demand for architectural graduates has
remained stable over recent years with most
finding work in the industry [and that this]
demand is expected to continue at the same
rate”11. It is noteworthy that Immigration New
Zealand does not currently lists ‘Architect’
among prioritised qualifications12. This contrasts
with what was reported in the Second Survey
(Haarhoff, 2010), when the then Department of
Labour identified a shortage of architects and a
need for about 200 graduates per year. No
update and forecast on these needs is available.
11 See: https://www.careers.govt.nz/jobs-database/construction-
and-infrastructure/architecture-technical-design-mapping/architect/.
12 See: https://skillshortages.immigration.govt.nz/architect/.

4. Architectural graduates in New Zealand: 1987 to 2018
23
4.3. Graduates and ethnicity
Data on ethnicity is important to reveal the
representation of minority groups among the
graduates and, in New Zealand, the inclusion of
Māori and Pacific Islanders. While not collected
in the First and Second Surveys, this data is
included in this Third Survey, for graduates
completing programmes from 2009 to 2018
inclusive.
As noted in a previous section, reporting on
ethnicity by each programme is not consistent,
and is optional. This has required some
combining of categories from the three
programmes to achieve a comparable data set,
and outcomes need to be understood in this
light. Data has been grouped into the following
categories: ‘European’ (Pakeha), Asian (includes
India), Māori, Pasifika (Pacific Islanders) and
‘Other’ (including those from Africa, the
Americas, Europe and the Middle East).
Table 3 shows the ethnicity of graduates from
2009 to 2018 inclusive from the data provided by
the Schools.
Table 3. Ethnicity of graduates 2009 to 2018.
Year European13 Asian14 Māori Pasifika15 Other16 Totals
2009 81 44 14 3 8 150
2010 12 25 14 2 3 56
2011 93 68 22 1 8 192
2012 82 56 13 4 10 165
2013 63 44 12 9 4 132
2014 93 46 12 2 3 156
2015 66 58 8 7 2 141
2016 74 66 13 5 5 163
2017 75 58 12 7 10 162
2018 86 75 9 8 4 182
Total 725 540 129 48 57 1,499
Percentage 48 36 9 3 4 100
13 Includes the descriptors European, Pakeha, European/Pakeha. 14 Asia is a broad categorization for people from Asian, including SE Asia and India. Some programmes separate some of the Asia
categories out, but others do not. 15 Pasifika is also identified as Pacific Islander or Pacific and relates collectively to those from the Pacific Islands. 16 This is a group of various ethnicities all combined in different ways in the programmed data. Included is African, Middle Eastern,
European, and the Americas.

Architecture Graduate progression to Practice in New Zealand: 1987-2018
24
Figure 2. Annual numbers of graduates by ethnic group 2009 to 2018.
Almost one-fifth (18 per cent) of the 1,827
graduates in this group did not declare ethnicity.
The analysis is based on the 1,499 who did
declare (82 per cent). Unsurprisingly, the
largest ethnic group – 48 per cent – consists of
graduates variably describing themselves as
‘European/Pakeha’. Asian ethnicity is the second
largest group, representing 36 per cent of
graduates, and reflects the significance of Asia
as a major source of international students and
migrants to New Zealand. Māori is identified by
9 per cent of graduates compared to being
approximately 15 per cent of the total New
Zealand population (Stats NZ, 2019), while
Pasifika identification constitute 3 per cent of
graduates.
A relevant question is the extent to which this
ethnic profile may have changed the past
decade, and Figure 2 shows ethnic groups by
graduating year. This shows the same decline
already reported on above in the discussion of
Figure 1, consequent to programme
restructuring. Ignoring this unusual factor,
Figure 2 indicates a number of trends. For the
largest group, ‘European’ ethnicity has remained
stable over the period with an increase of only 6
per cent. By contrast, Asian ethnicities have
increase by 70 per cent over the past decade.
The number of graduates identifying Māori has
decreased from 16 in 2009 to 9 in 2018: a
percentage decrease of 44 per cent. By
contrast, the number of Pasifika increased by
167 per cent from 3 in 2009 to 8 in 2018.
These numbers need to be interpreted with
some caution, because of the lack of
consistency in how each School records ethnic
data and because of the large number of
graduates who do not declared an ethnicity.
Nevertheless, the data indicates that Māori and
Pasifika have relatively small numbers and that
for Māori these have declined over the past
decade, across the Schools.
0
10
20
30
40
50
60
70
80
90
100
2009 2010 2011 2012 2013 2014 2015 2016 2017 2018
European Asian Māori Pasifika Other

4. Architectural graduates in New Zealand: 1987 to 2018
25
4.4. Summary points
In summary, the following key points are
highlighted:
▪ Between 1987 and 2018 there were 4,814
graduates from professional architecture
programmes in New Zealand.
▪ The number of graduates increased from 85
to 226 per year over the survey period, an
increase of 165 per cent.
▪ This increase has not kept pace with New
Zealand’s population growth, and the number
of graduates per 1,000 reduced in the last
decade of the Survey.
▪ The University of Auckland produced just
over half of all graduates (51 per cent), and
Victoria University of Wellington produced
almost one-third (32 per cent). Unitec
produced its first graduates in 1998 and has
contributed 16 per cent of all graduates.
▪ Changes to architecture programmes at the
three Schools led to a sharp reduction in the
number of graduations by graduates in
2009/2010; where student progression is
delayed or where students elect to adjust
their progression to gain a perceived
advantage. This is particularly marked with
the change from the professional Bachelors
to Masters qualification.
▪ Graduate ethnicity over the past decade
indicates that almost half of all graduates
identify as ‘European’ (40 per cent), 36 per
cent as ‘Asian’, 9 per cent Māori and 4 per
cent ‘Pacific’. While noting that 18 per cent of
graduates did not declare their ethnicity, the
percentage of those declaring Māori (at 9 per
cent) falls well short of the 15 per cent Māori
representation in the New Zealand
population. Moreover, there is an indication
of a decline in the number of Māori
graduates over the last decade.
▪ Victoria is dominated by graduates with
‘European’ ethnicity, while The University of
Auckland has the highest proportion of
‘Asian’ graduates. Unitec has the highest
proportion of Māori and Pacific graduates.

Architecture Graduate progression to Practice in New Zealand: 1987-2018
26

5. Registration
27
5. Registration
This section presents the progression by
architecture graduates in the survey to
registration as architects in New Zealand.
5.1. Introduction
Many countries have legal requirement over the
use of the title “Architect”, and to different
extents, over the practice of architecture. These
controls are directed towards consumers of
architectural services to give assurance that
the practitioners concerned have the necessary
qualifications, training and experience to carry
out the work. In New Zealand this is regulated
by ‘registering’ architects who meet set
standards and experience and is the equivalent
to ‘licensing’ regimes in North America.
The New Zealand Registered Architects Board
(NZRAB), which gains its authority from the
Registered Architects Act 2005, controls the
registration of architecture practitioners in New
Zealand. Under the Act, no one except a New
Zealand Registered Architect can use the title
“Registered Architect” or describe themselves
as an "architect" when providing building design
services17.
In New Zealand, architecture programmes are
accredited through the Architects Accreditation
Council of Australia (AACA). This is a peer
review process accrediting programmes that
are assessed against prescribed standards
every five years by an independent
17 See: https://www.nzrab.nz/.
Accreditation Review Panel18. This also enables
the mutual recognition of architecture
qualifications across all Australian States and
Territories and New Zealand, and, as part of the
agreement, Singapore and Hong Kong are now
included19.
Noting that this number is dynamic, at the time
of Survey there were 2,347 Registered
Architects in New Zealand, of whom 2,038 were
‘active’ and 309 granted Voluntary Suspension.
Voluntary Suspension may happen for reasons
that typically include working overseas, raising
a family, redundancy or health reasons, and is
valid initially for five years20. The overall
number of Registered Architects in New Zealand
increased from 1,824 at the time of the Second
Survey in 2009 – a 29 per cent increase
(Haarhoff, 2010, p.18). Registered Architects in
New Zealand include practitioners who have
recognised qualifications from a New Zealand
School of Architecture, through the Trans-
Tasman Mutual Recognition Act (1997) those who
hold registration in an Australian State, and
graduates from other countries across the
world who have met the registration
requirements.
In New Zealand (2018) the 2,347 registered
architects equate to a ratio of 0.48 per 1,000
people. This compares favourably with
Australia, where this is estimated at 0.5 per
1,000 people, and is similar to the United
18 See: https://www.aaca.org.au/accreditation-of-architecture-
programs/. 19 Ibid. 20 See: https://www.nzrab.nz/c/Accreditation.

Architecture Graduate progression to Practice in New Zealand: 1987-2018
28
Kingdom and France (Architects Accreditation
Council of Australia, 2014). However, of
particular interest in this report is what
proportion of the 4,814 graduates, all of whom
hold recognised qualifications for the purposes
of registration in New Zealand, are registered as
architects by the NZRAB.
5.2. Graduates 1987-2018 and registration
As explained, the methodology involves
comparing the list of graduates over the survey
period with the NZRAB register. All graduates
who held registration up to and including 2008
were identified in the register. This information
is set out in Table 3 and shows the total number
of graduates by graduating year, and the
number and per cent who were registered.
One of the requirements for registration by the
NZRAB is completing a recognised qualification
from a New Zealand School. All 4,814 graduates
in this Survey hold such qualifications: the
Bachelor of Architecture, and, since 2009-2010,
the Master of Architecture (Professional), and
other degree combinations that include
professional architecture studies21.
Following graduation, there are a number of
pathways towards registration as an Architect
by the NZRAB. For graduates of accredited
programmes, this normally requires a minimum
of between 140 and 260 weeks of post-
21 The full list of New Zealand qualifications currently recognised
by the NZ Registration Board for the purposes and making application for registration are: The University of Auckland – MArch(Prof), MArch(Prof) HerCons, MArch(Prof)UrbDes, MArch(Prof)UrbPlan, BArch (5 year - historic). Unitec Auckland – MArch(Prof), BArch (5 year - historic). Victoria University of Wellington – MArch(Prof), BArch (5 year - historic).
graduation practical experience, with a
specified proportion being with a Registered
Architect, before making application. The
minimum period between the completion of the
qualification and registration is consequently
between 2.5 and 5 years. This requirement for
experience explains why there are no and, in
some years, very few registered architects,
among the last three-year cohorts (2016-2018)
as shown in the shaded cells of Table 4.
Of the 4,814 graduates completing qualifications
between 1987 and 2018, 1,023 were registered
architects in New Zealand (21 per cent of all
architecture graduates). This obviously excludes
graduates who may be registered in other
countries. However, given the requirement for
experience before making applications, this
percentage needs to be calculated by only
considering graduates who are eligible to seek
registration. Taking this into account and
excluding graduates from 2016-2018, 4,188
graduates remain eligible to seek registration.
On this basis, the 1,023 graduates who were
registered represents 24 per cent – almost a
quarter of all eligible graduates. Surprisingly,
this is a reduced proportion when compared to
the First Survey in 1999 (when this was 30 per
cent of 1,459 graduates) and equal to the
percentage found in the Second Survey in 2009
(24 per cent). This level of registration among
eligible architecture graduates compares
favourably with other studies – based on
graduates between 1999 and 2011 in South
Australia, the percentage was 26 per cent
(Matthewson, 2016).

5. Registration
29
Table 4. Number of graduates by cohort year and the number and percentage who are Registered Architects.
Year Graduates Registered % Registered
1987 85 26 31
1988 97 31 32
1989 90 37 41
1990 98 38 39
1991 98 39 40
1992 132 54 41
1993 125 46 37
1994 135 44 33
1995 128 50 39
1996 123 44 36
1997 91 26 29
1998 128 47 37
1999 160 44 28
2000 135 37 27
2001 158 45 28
2002 140 51 36
2003 161 45 28
2004 161 30 19
2005 158 37 23
2006 187 37 20
2007 159 35 22
2008 238 48 20
2009 151 21 14
2010 86 11 13
2011 225 35 16
2012 195 24 12
2013 174 21 12
2014 197 15 8
2015 173 4 2
2016 201 1 0
2017 199 0 0
2018 226 0 0
Totals 4,814 1,023 21

Architecture Graduate progression to Practice in New Zealand: 1987-2018
30
Figure 3. Total number of graduates 1987-2018, and the number from each graduating year cohort who were registered at the end of 2018.
This underpins the growing suggestion of there
being a perceived ceiling on the proportion of
graduates who go on to register as architects -
at around one-quarter of all graduates. One
explanation for this relative low proportion of
conversion to registrations is that some
graduates move to other countries to pursue
careers.
More significant is the fact that graduates
included a growing cohort of international
students who do not, or due to visa restrictions,
are unable to seek registration in New Zealand.
However, compared to Australia, the proportion
of international students enrolled in New
Zealand universities is comparatively low at 11
per cent (Architects Accreditation Council of
Australia, 2019). Making an assumption that 11
per cent of all graduates in the Survey are
international students, still only brings to
percentage of remaining domestic graduates to
27 per cent of the total, and this still leaves a
large number who have never registered as an
architect in New Zealand.
This factor is emphasised when comparing the
total number of graduates with the number of
those registered in New Zealand.
Figure 3 shows that despite the steady increase
in graduate numbers over the 32-year period
(1987-2018), the number of registered architects
from each graduating cohort remains fairly
constant. This is an average of 35 registrations
per year, compared to an average of 145
graduates per year. Despite graduates numbers
increasing year by year, the number being
registered remains much the same.
0
50
100
150
200
250
30019
87
1988
1989
1990
1991
1992
1993
1994
1995
1996
1997
1998
1999
2000
2001
2002
2003
2004
2005
2006
2007
2008
2009
2010
2011
2012
2013
2014
2015
2016
2017
2018
Tot Grads Tot Regd
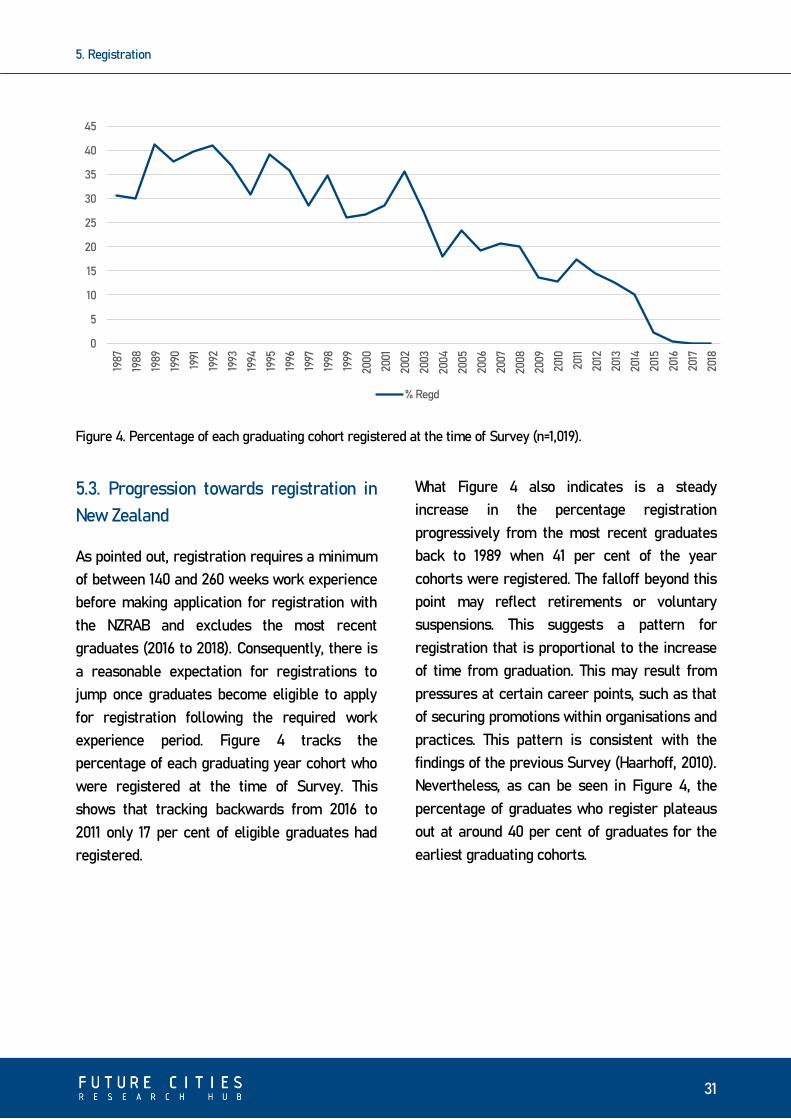
5. Registration
31
Figure 4. Percentage of each graduating cohort registered at the time of Survey (n=1,019).
5.3. Progression towards registration in
New Zealand
As pointed out, registration requires a minimum
of between 140 and 260 weeks work experience
before making application for registration with
the NZRAB and excludes the most recent
graduates (2016 to 2018). Consequently, there is
a reasonable expectation for registrations to
jump once graduates become eligible to apply
for registration following the required work
experience period. Figure 4 tracks the
percentage of each graduating year cohort who
were registered at the time of Survey. This
shows that tracking backwards from 2016 to
2011 only 17 per cent of eligible graduates had
registered.
What Figure 4 also indicates is a steady
increase in the percentage registration
progressively from the most recent graduates
back to 1989 when 41 per cent of the year
cohorts were registered. The falloff beyond this
point may reflect retirements or voluntary
suspensions. This suggests a pattern for
registration that is proportional to the increase
of time from graduation. This may result from
pressures at certain career points, such as that
of securing promotions within organisations and
practices. This pattern is consistent with the
findings of the previous Survey (Haarhoff, 2010).
Nevertheless, as can be seen in Figure 4, the
percentage of graduates who register plateaus
out at around 40 per cent of graduates for the
earliest graduating cohorts.
0
5
10
15
20
25
30
35
40
4519
87
1988
1989
1990
1991
1992
1993
1994
1995
1996
1997
1998
1999
2000
2001
2002
2003
2004
2005
2006
2007
2008
2009
2010
2011
2012
2013
2014
2015
2016
2017
2018
% Regd

Architecture Graduate progression to Practice in New Zealand: 1987-2018
32
Figure 5. Frequency distribution, by percentage, of the number of years between graduation and registration (n=1,019).
5.4. The ‘gap’ between graduation and
registration
The work experience period required by the
NZRAB is between 2.5 and 5 years (140 to 260
weeks) before applying for registration.
However, the median time between graduation
and registration among the relevant graduates
in the Survey is 6 years. This indicates that most
of those who register do so closer to, and
beyond, the 5-year period, rather than in
minimum time. Figure 5 shows the frequency
distribution of the number of years between the
completion of the qualification and registration
for graduates who were Registered Architects
in 2018.
Only 13 per cent of graduates were registered
within 2 to 3 years (the minimum) and 44 per
cent registered within 5 years. This leaves well
over half of graduates (56 per cent) who were
registered with a ‘gap’ of over 6 years. Indeed,
there is a long ‘tail’ stretching back to over 20
years between completing the qualification and
registration.
This shows that just over half of graduates who
were registered at the time of Survey, did so
within the 140 to 240 week time range. This
underscores the observation already made that
for many graduates there is no apparent rush to
register, and that registration will be pursued at
varying points of times according to individual
needs, such as changing work situations,
establishing small practices on their own
account, or seeking promotions.
5.5. Regional distribution of graduates
The NZRAB register invites Registered
Architects to provide their address or practice
location in a publically accessible website, and
among the 1,023 graduates who were registered
at the time of Survey, 767 (75 per cent) did so.
0
2
4
6
8
10
12
14
16
18
2 3 4 5 6 7 8 9 10 11 12 13 14 15 16 17 18 19 20+
%

5. Registration
33
Figure 6. Percentage distribution of graduates who report their practice location by NZIA Regions (n=754).
Figure 6 shows the distribution of locations by
Regions: in the North Island (Auckland,
Wellington, Waikato/Bay of Plenty and
Gisborne/Hawkes Bay) and in the South Island
(Canterbury, Southern, Western and
Nelson/Marlborough). Thirteen (2 per cent) gave
locations outside of New Zealand and none were
given for the Western District. Excluding
overseas addresses, there were 741 graduates
who identified their locations in one of the New
Zealand regions.
As the region that includes the largest city of
Auckland, it is not a surprise to find that just
over half (52 per cent) of the registered
graduates who gave addresses located in the
Auckland Region (that includes Northland).
Wellington is second in terms of ranking (22 per
cent) and Canterbury third with 10 per cent22.
22 Statistics New Zealand Occupation Survey gives the
percentage distribution of the self-declared standard classification of occupation of ‘Architect’ by region as follows: Auckland and Northland: 47.5%; Wellington and Manawatu:
These three regions include New Zealand’s
three largest cities and together account for 84
per cent of the locations of registered graduates
in this Survey. In terms of geographically
spread, the North Island (Te Ika A Maui)
accounts for 82 per cent of the locations and the
South Islands (Te Wai Pounamu) for 18 per
cent23. The two regions that have the largest and
second largest combined percentage of
reported locations (74 per cent), Auckland and
Wellington, are also the locations of two of the
Schools of Architecture providing the
architecture programmes: The University of
Auckland and Unitec in Auckland, and Victoria
University of Wellington.
20.6%; and Canterbury: 13.6%. Distribution close to the registered graduate distributions. See: https://www.stats.govt.nz/2018-census/
23 Statistics New Zealand Occupation Survey gives the percentage distribution of the self-declared standard classification of occupation of ‘Architect’ for the North Island (78%) and South Island (22%). Distributions are close to the data on registered graduate distributions. See: https://www.stats.govt.nz/2018-census/.
0
10
20
30
40
50
60
% dist

Architecture Graduate progression to Practice in New Zealand: 1987-2018
34
Figure 7. Percentage distribution of reporting graduates in each region by graduating programme source (n=754).
At the time of the Survey there were no
professional architecture programmes offered
in the South Island. This raised a question about
how registered graduates who complete their
degree at one of these Schools, subsequently
are distributed between the regions, and this is
shown in Figure 7, that shows a distribution of
graduates from the three Schools by their
reported locations.
As can be seen, graduates from the Auckland-
based programmes (at The University of
Auckland and Unitec), largely go on to work in
the Auckland regions. This is particularly high
for Unitec graduates who were registered: 87
per cent are located in the Auckland region. In
descending order, the remaining Unitec
graduates who were registered report working
in equal proportions in Waikato and in the
Southern region that includes Dunedin and
Queenstown (4 per cent). Very small
percentages report locations in the Wellington
region. Of the registered graduates from The
University of Auckland, 69 per cent work in the
Auckland region, with the balance distributed in
small percentages between Wellington (6 per
cent), Waikato/BOP (7 per cent), Canterbury (8
per cent) and Southern (5 per cent).
As may be expected, registered graduates from
Victoria University dominate those working in
the Wellington region (49 per cent). A presence
is also found elsewhere in the North Island:
Auckland (15 per cent) and Waikato/BOP (6 per
cent). There is also a significant presence in
South Island Regions: Canterbury (16 per cent),
Southern (7 per cent), and Nelson/Marlborough
(3 per cent).
0
10
20
30
40
50
60
70
80
90
100
UOA VUW Unitec

5. Registration
35
This distribution presents few surprises: that
most graduates who were registered from the
two Auckland Schools go on to work in the
Auckland region and most graduates who were
registered from Victoria University go on to
work in Wellington. However, VUW graduates
have a larger presence in the South Island
regions. Of the registered graduates working
overseas, The University of Auckland has 54 per
cent of the total, Victoria University has 38 per
cent and Unitec has 8 per cent. Also of interest
is that not a single registered graduate reported
working in the Western district that comprises
the West Coast of the South Island. This is not
surprising given its relatively small population
and economic base when compared with the
rest of New Zealand24.
5.6. Summary points
In summary, the following key points are
highlighted:
▪ There were 2,347 registered architects in
New Zealand at the time of Survey (2018);
this equates to 0.48 registered architects per
1,000 people. This compares favourably with
Australia where this is estimated to be 0.5
per 1,000 people, and similar to the United
Kingdom and France.
▪ Of the 2,347 Registered Architects 44 per
cent have origin from among the 4,814
graduates in this Survey.
▪ Given that registration requires between 140
and 260 weeks of work experience before an
24 See: http://archive.stats.govt.nz/Census/2013-census/profile-
and-summary-reports/quickstats-about-a-place.aspx?request_value=14641&tabname=.
application for registration can be made, the
three most recent graduating cohorts will
not be eligible to apply. Excluding these
three cohorts, 24 per cent of the total eligible
number of graduates in the Survey were
Registered Architects in 2018.
▪ The high proportion of graduates who do not
register can be partly explained by an
increasing number of international students
among graduates, who may not seek
registration in New Zealand. While the
proportions of international students are
high in Australia (between 35-45 per cent),
this is not the case in New Zealand (around 11
per cent). Even accounting for this factor,
this still leaves a large majority of eligible
architecture graduates who do not go on to
register with the NZRAB.
▪ The percentage of graduates who are
registered has reduced since the First
Survey (1999) from 30 per cent to 24 per cent
in the subsequent two surveys (2009, 2019).
This suggests a ceiling to the proportion of
graduates who go on to be registered.
▪ Among eligible graduates, there is no
apparent urgency to be registered. Although
most would have been eligible to be
registered, only 13 per cent of graduates
were registered within 2 to 3 years (the
minimum) and 44 per cent registered within
5 years (the upper range). More than half of
graduates who were registered in 2018, did
so beyond the 6 year ‘gap’, to includes some
from the from the 1880’s.
▪ Among graduates who were registered and
declared their location, the Auckland Region
is where just over half of all registered
graduates practice (52 per cent), followed by

Architecture Graduate progression to Practice in New Zealand: 1987-2018
36
Wellington (22 per cent) and Canterbury (10
per cent).
▪ Most registered graduates from The
University of Auckland and Unitec gave their
practice location as the Auckland Region. For
registered graduates from Victoria
University, Wellington dominates as their
practice location. Victoria University
contributes the majority of registered
graduates located in the South Island.

6. Professional membership
37
6. Professional membership
This section discusses the progression of
architecture graduates to professional
membership of the New Zealand Institute of
Architects (NZIA).
6.1. Membership categories
Established in 1905 as an incorporated society,
the NZIA’s primary role is that of being a
professional organisation for architects. On
behalf of members, the NZIA extends its role to
“promoting and celebrating outstanding
architecture and to creating greater awareness
of the values and benefits well designed
buildings and public spaces can bring to our
cities and towns” (New Zealand Institute of
Architect, n.d.-b). The NZIA offers professional
memberships in a number of categories and
these are listed and defined Table 5.
As discussed in the Methodology (chapter 3), to
avoid confusion, between ‘graduates’ of concern
in this Survey and the NZIA ‘Student’ and
‘Graduate’ membership categories, ‘graduates’
refers to all graduates from the New Zealand
Schools between 1987 and 2018, while the ‘NZIA
Student’ and ‘NZIA Graduate’ refer to those
graduates who are members of the NZIA at the
time of the Survey at the end of 2018.
The NZIA reported having 4,216 Members at the
end of 2018, of which 209 were Retired
Members. The 4,007 ‘active’ Members by
category as of the end of 2018 is given in Table
6.
Architect members25 are the largest category
(48 per cent), all of who will also be Registered
Architects. Surprisingly, NZIA Student members
are the second largest category (29 per cent),
followed by NZIA Graduate members (14 per
cent). Student membership signals, on the part
of those concerned, an intention to engage with
formal practice, as do the NZIA Graduate
members who will be participating in
development programmes offered by the NZIA.
Many NZIA Graduate and Student members are
also employed by architecture practices and,
together with Affiliated and Allied Members,
constitute a significant part of the workforce
engaged with the active practice of architecture
in New Zealand. Table 6 shows that almost half
are Architect members (all of whom will be
registered) and that, collectively, all other
membership categories make up the other half.
25 This combines a number of sub-categories: Architect,
Architect Fellow, Architect Overseas and Architect with overseas registration.

Architecture Graduate progression to Practice in New Zealand: 1987-2018
38
Table 5. NZIA categories of membership (Source: New Zealand Institute of Architects).
Category Summary attributes
Architect Any person who: a. is a New Zealand or Australian Registered Architect; or b. is an APEC Architect; or c. any NZ degree qualified architect who holds registration overseas and is working
overseas; or d. any Architect who is registered in an overseas jurisdiction and is working in an NZIA
Practice.
Graduate Any person who: a. holds a degree diploma or certificate recognised by the NZIA Council as being
acceptable for registration as an architect by the Council; or b. holds an NZRAB or AERB equivalency assessment as a step towards registration as an
architect by the Council; or c. is a participating in the Institute's Registration Programme.
Student Any person who is a student participating in an architecture or architecture related course, the completion of which entitles that person to gain a degree, diploma, or certificate recognised by the NZIA Council as being acceptable for Architect membership.
Academic Any person who is an educator of architecture in a recognised teaching institution and teaching an architecture or architecture related course, the completion of which entitles the student to gain a degree, diploma or certificate recognised by the Council as being acceptable for member of the Institute.
Affiliated Any person who: a. is not a registered architect but who is an employee of an NZIA Practice; or b. is a registered architect in a jurisdiction other than New Zealand and is approved by the
NZIA Council as being accepted for Affiliated Membership; or c. is working in an allied profession such as urban design, building science, architectural
studies, or landscape architecture; or d. shares an interest of the Institute and is approved by the NZIA Council as being
accepted for Affiliated Membership.
Allied Professionals Architecture graduates of more than 6 years’ standing.
Retired Any person who is an Architect Member or Academic Member who has retired from architectural practice, related activity or teaching appointment in architecture and has applied to and been approved by the NZIA Council for retired membership.
Table 6. Numbers of NZIA members by category (end of 2018) (Source: New Zealand Institute of Architects).
Active Membership Categories Number %
Architect/Arch Fellow 1,905 48
NZIA Student 1,148 29
NZIA Graduate 567 14
Affiliated 207 5
Allied Professional 158 4
Academic 22 1
Tot 4,007 100
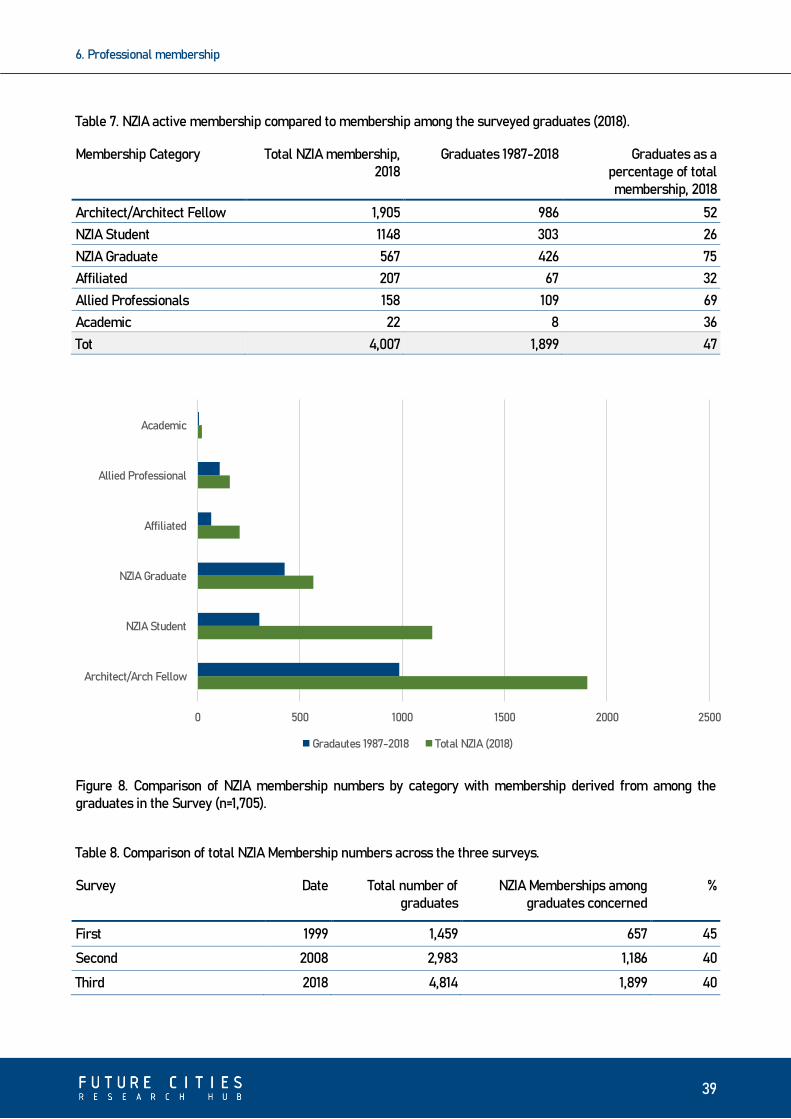
6. Professional membership
39
Table 7. NZIA active membership compared to membership among the surveyed graduates (2018).
Membership Category Total NZIA membership, 2018
Graduates 1987-2018 Graduates as a percentage of total membership, 2018
Architect/Architect Fellow 1,905 986 52
NZIA Student 1148 303 26
NZIA Graduate 567 426 75
Affiliated 207 67 32
Allied Professionals 158 109 69
Academic 22 8 36
Tot 4,007 1,899 47
Figure 8. Comparison of NZIA membership numbers by category with membership derived from among the graduates in the Survey (n=1,705).
Table 8. Comparison of total NZIA Membership numbers across the three surveys.
Survey Date Total number of graduates
NZIA Memberships among graduates concerned
% First 1999 1,459 657 45 Second 2008 2,983 1,186 40 Third 2018 4,814 1,899 40
0 500 1000 1500 2000 2500
Architect/Arch Fellow
NZIA Student
NZIA Graduate
Affiliated
Allied Professional
Academic
Gradautes 1987-2018 Total NZIA (2018)

Architecture Graduate progression to Practice in New Zealand: 1987-2018
40
6.2. Membership among the graduates:
1987-2018
Of the 4,814 architecture graduates completing
qualifications between 1987 to 2018, 1,899 (47
per cent) are members of the NZIA across the
various categories. This shows that over half (53
per cent) of the 4,814 graduates were not
members of the NZIA at the end of 2018.
Table 7 sets out the total NZIA membership in
2018 in all active categories (excluding
retirements) and membership numbers among
the 4,814 graduates.
Architect members at 986 are the largest group
sourced from the graduates surveyed (52 per
cent of the total membership in this category).
Also significant are the 426 NZIA Graduate
members and 109 Allied Professional members
who respectively contribute 75 and 69 per cent
of Members to these categories. It may seem
surprising to see Student members in this
survey of graduates (26 per cent of the total
membership), but they will be members who, at
the time of survey, had not changed to another
more appropriate membership category. The
relationships between total NZIA membership
numbers in various categories and the
proportion sourced from among the 4,814
graduates in the Survey are graphically shown
in Figure 8.
Direct comparisons by membership categories
with the two previous surveys is difficult,
because over time, the NZIA has changed
membership categories. Architect Membership
is consistent, but Colleague Membership in the
First Survey (1999) was abandoned, and now
includes the more numerous categories listed in
Table 5. Table 8 compares all memberships of
the NZIA among graduates at the three Survey
dates.
This shows that graduates in the Survey holding
membership with the NZIA declined from the
First Survey to the Second Survey, from 45 per
cent in 1999 to 40 per cent in 2008. However, the
percentage has stabilised at 40 per cent
between the Second and Third surveys. This can
be compared to 27 per cent of the same
graduate group who were registered at the
same time.
Attention has been drawn to the fact that among
the 4,814 graduates between 1987 and 2018, just
over half were not members of the NZIA at the
time of Survey (2018) nor registered with the
NZRAB. This raises question about who this
group is constituted of.
6.3. Accounting for the ‘missing’
graduates
We have identified that only 24 per cent of
eligible graduates in the Survey progressed to
be Registered Architects and that this
proportion remained unchanged from the
previous Survey. The data also shows that 40
per cent of graduates in this Survey are
members of the NZIA. Given the competitiveness
to gain entry to architecture programmes,
programme enrolments caps, the length of
study (5 years) and the associated expenses, it
is surprising to discover that so few
architectural graduates progress to formal
practice in New Zealand.
The data provides no information on what the 60
per cent of graduates not engaged in formal

6. Professional membership
41
practice is doing. On this question, it is
instructive to compare NZIA membership with
those who self-declare their occupation as
‘architect’ in the 2018 census. Using the
Australia and New Zealand Standard
Classification of Occupational categories, 6,453
people identified ‘architect’ as their primary
occupation (Stats NZ, 2020). This excludes a
further 2,082 who identified their occupation as
‘architectural draftsperson’, and 423 as
‘Architectural Technicians’. At this level, those
declaring their occupation to be ‘architect’ far
exceeds the 2,347 NZRAB registered architects
and the 1,905 NZIA Architect Members in 2018.
All NZIA membership categories in 2018 total of
4,007 and, while this comes closer to the census
number, there is still a shortfall. This may
indicate that those who hold professional
architecture qualifications, may identify their
occupation as architect, while engaged in
employment outside of formal profession. It also
strongly suggests that many claim ‘architect’ to
be their occupation in the census. In addition, as
membership to the NZIA is not mandatory, some
recent graduates may not consider it to be
relevant or necessary in that point of their
career, as they might be still finding their
position within the profession or waiting for
different career opportunities, possibly
overseas, and some less recent graduates might
be satisfied with a role that doesn’t necessarily
benefits from said membership.
We also know that some graduates travel
overseas after graduation, while others will
seek employment in other countries. In our
discussion on Registration (chapter 5), we have
already noted that part of the ‘missing’
graduates will be accounted for when
considering international students (Architects
Accreditation Council of Australia, 2019).
Another explanation is that many architecture
graduates simply do not progress to
occupations in architecture but move into other
career options. Noting a similar situation in
Australia, the AACA Report (2019) makes the
following observation:
There are many pathways for
architectural graduates within and
beyond traditional practice. Little
research has been undertaken
about the career paths of graduates
of Australian and New Zealand
schools, so there is little detailed
data on graduate destinations.
Anecdotally, many architectural
graduates pursue careers outside
traditional practice but related to
architecture and the built
environment, while Australian
registration data suggests fewer
than half of architectural masters
graduates will go on to be
registered architects (excluding
those overseas students who return
to their country of origin).
(Architects Accreditation Council of
Australia, 2019, p.93)
We concur with the AACA (2019) that there is
very little information on overall graduate
destinations. The fact that we cannot account
for the career destination of over half of the
architecture graduates from New Zealand
Schools, certainly marks an area for further
research that should be of interest to both
educators and the profession.
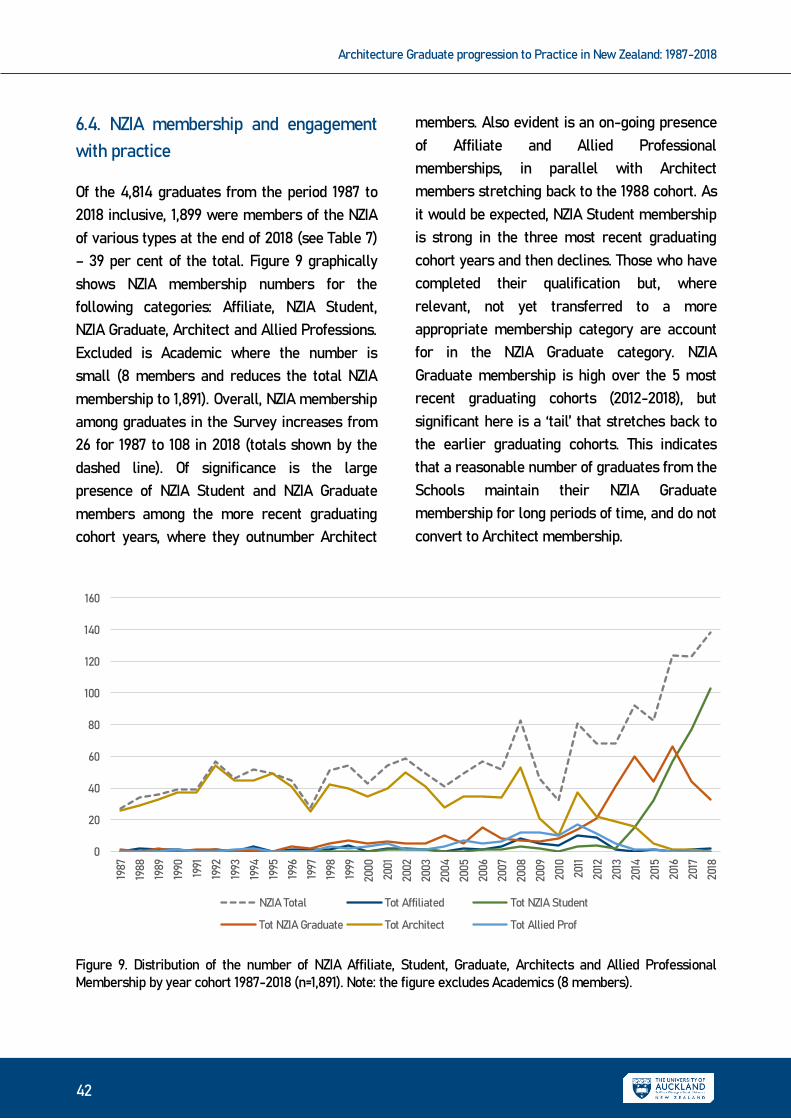
Architecture Graduate progression to Practice in New Zealand: 1987-2018
42
6.4. NZIA membership and engagement
with practice
Of the 4,814 graduates from the period 1987 to
2018 inclusive, 1,899 were members of the NZIA
of various types at the end of 2018 (see Table 7)
– 39 per cent of the total. Figure 9 graphically
shows NZIA membership numbers for the
following categories: Affiliate, NZIA Student,
NZIA Graduate, Architect and Allied Professions.
Excluded is Academic where the number is
small (8 members and reduces the total NZIA
membership to 1,891). Overall, NZIA membership
among graduates in the Survey increases from
26 for 1987 to 108 in 2018 (totals shown by the
dashed line). Of significance is the large
presence of NZIA Student and NZIA Graduate
members among the more recent graduating
cohort years, where they outnumber Architect
members. Also evident is an on-going presence
of Affiliate and Allied Professional
memberships, in parallel with Architect
members stretching back to the 1988 cohort. As
it would be expected, NZIA Student membership
is strong in the three most recent graduating
cohort years and then declines. Those who have
completed their qualification but, where
relevant, not yet transferred to a more
appropriate membership category are account
for in the NZIA Graduate category. NZIA
Graduate membership is high over the 5 most
recent graduating cohorts (2012-2018), but
significant here is a ‘tail’ that stretches back to
the earlier graduating cohorts. This indicates
that a reasonable number of graduates from the
Schools maintain their NZIA Graduate
membership for long periods of time, and do not
convert to Architect membership.
Figure 9. Distribution of the number of NZIA Affiliate, Student, Graduate, Architects and Allied Professional Membership by year cohort 1987-2018 (n=1,891). Note: the figure excludes Academics (8 members).
0
20
40
60
80
100
120
140
160
1987
1988
1989
1990
1991
1992
1993
1994
1995
1996
1997
1998
1999
2000
2001
2002
2003
2004
2005
2006
2007
2008
2009
2010
2011
2012
2013
2014
2015
2016
2017
2018
NZIA Total Tot Affiliated Tot NZIA Student
Tot NZIA Graduate Tot Architect Tot Allied Prof

6. Professional membership
43
Figure 10. Percentage distribution of NZIA Affiliate, Student, Graduate, Architects and Allied Professional Membership by year cohort 1987-2018 (n=1,891).
Figure 10 shows the distribution of NZIA
membership categories by graduating cohort,
except her expressed in terms of a percentage
of each membership type by year. As it can be
seen, Architect members dominate as a
proportion of other membership categories from
2012 back to the start of the Survey in 1987
(where 96 per cent of graduates in this year
hold NZIA Architect membership). However, the
significance of NZIA Students and NZIA Graduate
membership is clearly highlighted over more
recent graduating cohorts (2012 to 2018), where
they collectively constitute the majority of NZIA
memberships among the graduates in the
Survey. In part, this is related to the need to
gain at least three years of work experience
before applying for registration and becoming
eligible for NZIA Architect membership. Both
NZIA Students and NZIA Graduate membership
‘tail off’ as Architect membership ‘kicks in’. Also
evident in Figure 10 are the proportions of other
membership categories, especially Allied
Professional and Affiliates that persist back to
1987. These provide categories of membership
for those not registered, and thus not moving to
NZIA Architect Membership, but who constitute
a part of the overall workforce in formal
practice.
0.0
20.0
40.0
60.0
80.0
100.0
120.019
87
1988
1989
1990
1991
1992
1993
1994
1995
1996
1997
1998
1999
2000
2001
2002
2003
2004
2005
2006
2007
2008
2009
2010
2011
2012
2013
2014
2015
2016
2017
2018
% Affiliated % NZIA Student % NZIA Graduate % Architect % Allied Prof % Academic

Architecture Graduate progression to Practice in New Zealand: 1987-2018
44
Figure 11. Distribution of numbers by graduating cohort years for NZIA Architects and NZRAB (n=1,642).
6.5. Registered Architects and NZIA
Architect membership.
The comparative relationship of NZIA Architects
and NZRAB registered architects to a
combination of NZIA Student, NZIA Graduate,
Allied Professional and Affiliate memberships is
demonstrated in Figure 11 (the ‘non-Architect’
categories).
This serves to emphasise the role played by
non-Architect Members of the NZIA in the more
recent graduating years. Architect membership
does not suddenly increase after three years,
reflecting the median gap between degree
completion and registration of six years. As it
can been seen, the combined memberships
excluding Architect dominates over the most
recent graduating cohorts, but also remains
present back to the earliest graduating cohorts.
Figure 11 also compares the numbers among the
graduating cohorts NZIA Architect membership
and NZRAB Registered Architects. Although the
numbers are close for each year cohort,
Registered Architects exceeds the number of
NZIA Architect members. This is because those
registered by the NZRAB are not required to be
members of the NZIA. At the end of 2018, there
are 1,019 NZRAB Registered Architects and 986
NZIA Architect members among the 4,814
graduates from the three Schools between
1987-2018. This indicates that, among the
graduating cohorts, 33 (3 per cent), while
registered, are not members of the NZIA. This
percentage has decreased since the Second
Survey, when this stood at 15 per cent (Haarhoff,
2010, p.26-27).
What has also changed since the Second Survey
is the percentage of Architect members on
Voluntary Suspension. In 2009 this was 17 per
cent among the graduating cohorts, but this
0
20
40
60
80
100
120
140
16019
87
1988
1989
1990
1991
1992
1993
1994
1995
1996
1997
1998
1999
2000
2001
2002
2003
2004
2005
2006
2007
2008
2009
2010
2011
2012
2013
2014
2015
2016
2017
2018
NZIA Student, NZIA Graduate, Allied Prof, Affiliate NZIA Architect NZRAB Architect

6. Professional membership
45
reduces to 4.5 per cent in 2019. Speculated that
this relates to a relatively higher level of
economic activity in the construction sector at
the time of this Survey (2018), when compared
with 2009.
6.6. Summary points
In summary, the following key points are
highlighted:
▪ In 2018 there were 4,916 members of the
NZIA across all membership categories.
Retired members numbered 209, with 4,007
‘active’ members in the Architect, NZIA
Student, NZIA Graduate, Affiliated, Allied
Professionals and Academic categories.
▪ Almost half (47 per cent) are Architect
members (who will also be Registered
Architects).
▪ Significantly, the second and third largest
categories of membership are Graduate (75
per cent) and Student (26 per cent), together
constituting 38 per cent of NZIA
memberships among the graduates. With
Affiliates, Allied Professionals and Academic
categories, non-Architect members
constitute almost half of the NZIA
memberships among the graduates.
▪ Of the 4,814 graduates in the Survey, 1,899
are NZIA members and they represent 40 per
cent of all graduates in the Survey
(compared to 24 per cent of eligible
graduates who are Registered Architects).
This percentage has remained constant
between the Second and Third surveys.
▪ Through their members of the NZIA, non-
Architect members contribute towards the
architecture practice workforce.
▪ Architect members (and thus Registered
Architects) appear to plateau at around 40
per of graduates in the Survey, irrespective
of the increasing number of architect
graduates produced.

Architecture Graduate progression to Practice in New Zealand: 1987-2018
46

7. Women and Architecture
47
7. Women and Architecture
This section focuses on how the data tells a
story about women among the architecture
graduates between 1987-2018.
7.1. Women and the profession of
Architecture
An analysis of the NZRAB register at the end of
2018 gave the number of registered architects in
New Zealand as 2,038. Of these, 25 per cent
were women, close to the 24 per cent reported
by Kathlyn Loseby (2019) for Australia.
Moreover, the percentage of women who are
registered in New Zealand has increased over
the past three decades, as revealed in the
previous two surveys (Haarhoff, 2001; Haarhoff,
2010): 10 per cent in 1999, 18 per cent in 2010,
and now 25 per cent.
We have reported on the 2018 Census
Occupation Survey, but this does not show
gender distribution. This was given for the 2013
census26, where women represented 21 per cent
of those identifying ‘architect’ as their
occupation. In Australia those nominating their
occupation as ‘architect’ in their 2016 census
were 31 per cent (Matthewson, 2018). This
suggests that women in New Zealand account
for around a quarter of those registered as
architects and those self-declaring ‘architect’ as
an occupation in New Zealand.
Registration can be contrasted with NZIA
membership: among the 4,007 active members
26 While data is available from the 2018 census, this does not
give gender information.
of the NZIA in 2018, women constituted 35 per
cent across all membership categories. This can
be compared to the reported 29 per cent women
who are members of the Australian Institute of
Architects (AIA). By this measure the NZIA is
doing better, but what is not clear is whether
the Australian figures include the same
categories of membership. Where there are
marked difference, however, is when gender is
considered by NZIA membership categories. As
can be seen in Table 9, whereas women NZIA
Graduate, NZIA Student, Allied Professional and
Affiliated members constitute 52, 51, 45 and 40
per cent respectively of the total, this falls to 30
per cent for the Architect category where
registration with the NZRAB is required.
The gender disparity in part comes from the
profession’s history of being male dominated,
reflected by the fact that 87 per cent of retired
members are men. However, the larger
questions concern the representation of women
among graduates from the Schools of
Architecture in this Survey, and their
registration and membership of the professional
organisation, and these are considered in the
next section.

Architecture Graduate progression to Practice in New Zealand: 1987-2018
48
Table 9. Gender distribution of NZIA membership by category (2018). (Source: New Zealand Institute of Architects). Note: Percentages as given in the 2018 NZIA Annual Report do not all total 100 per cent because of non-specified gender.
Membership category Per cent Male Per cent Female
Architect 69.5 30.0
Graduate 46.5 52.0
Student 49.0 51.0
Allied Professional 55.0 45.0
Affiliated 60.0 39.5
Retired 87.0 13.0
Academic 65.0 35.0
7.2. Women among the architecture
graduates 1987-2018.
Table 10 gives the total number of graduates by
year between 1987 and 2018, and the number
and percentage of men and women in each
graduating year.
Overall, Table 10 shows that among the 4,814
graduates in the Survey, 42 per cent have been
women. However, over the past decade gender
equity has been reached among graduates from
architecture programmes in New Zealand, with
women comprising 49 per cent of graduates on
average over the period 2009-2018. These
gender changes are more pronounced when
considering the percentage of women in each
graduating year, and this is shown in Figure 12.
This shows the changing proportion of women
and men in each graduating cohort. There is a
clear convergence toward gender equity from
1987, when women constituted 20 per cent of
graduates, to 2006, when parity with men was
first reached. Although there are annual
variations, on average since 2006, gender equity
has been sustained. In 2018, the end of the
Survey period, women comprised 54 per cent of
graduates.
This is consistent with data from Australia – the
AACA (2019) reports that, by the mid-1990’s, 42
per cent of graduates from Australian
architecture programmes were women, and
that this has averaged 45 per cent for the last
decade. Table 11 shows the average percentage
of women graduating from architecture
programmes in New Zealand over the three-
decade periods: 1989-1998, 1999-2008 and 2009-
2018. This has changed from women being one-
third of graduates in the decade ending in 1998,
to a half in 2018.
Gender equity among professional architecture
graduates has largely been driven by increases
in the numbers of women participating in
architecture programmes and, consequently,
graduating. Figure 13. Number of male and
female graduates, and the total by year: 1987 to
2018. shows the numbers of men and women
graduating by year over the Survey period.

7. Women and Architecture
49
Table 10. Number and percentage of male and female graduates by year: 1987 to 2018.
Year Male number Female number Total number % Male % Female
1987 68 17 85 80 20
1988 70 27 97 72 28
1989 73 17 90 81 19
1990 65 33 98 66 34
1991 70 28 98 71 29
1992 89 43 132 67 33
1993 84 41 125 67 33
1994 91 44 136 67 33
1995 87 41 128 68 32
1996 83 40 123 67 33
1997 53 38 91 58 42
1998 80 48 129 62 38
1999 99 61 161 62 38
2000 90 44 134 67 33
2001 97 61 158 61 39
2002 80 60 140 57 43
2003 86 75 161 53 47
2004 93 68 161 58 42
2005 94 64 158 59 41
2006 92 95 187 49 51
2007 80 79 159 50 50
2008 144 94 241 61 39
2009 83 68 154 55 45
2010 49 37 86 57 43
2011 110 115 225 49 51
2012 94 102 196 48 52
2013 105 69 174 60 40
2014 103 94 197 52 48
2015 76 97 173 44 56
2016 112 89 201 56 44
2017 99 100 199 50 50
2018 104 122 226 46 54
Totals 2,808 2,011 4,814 (58%) (42%)
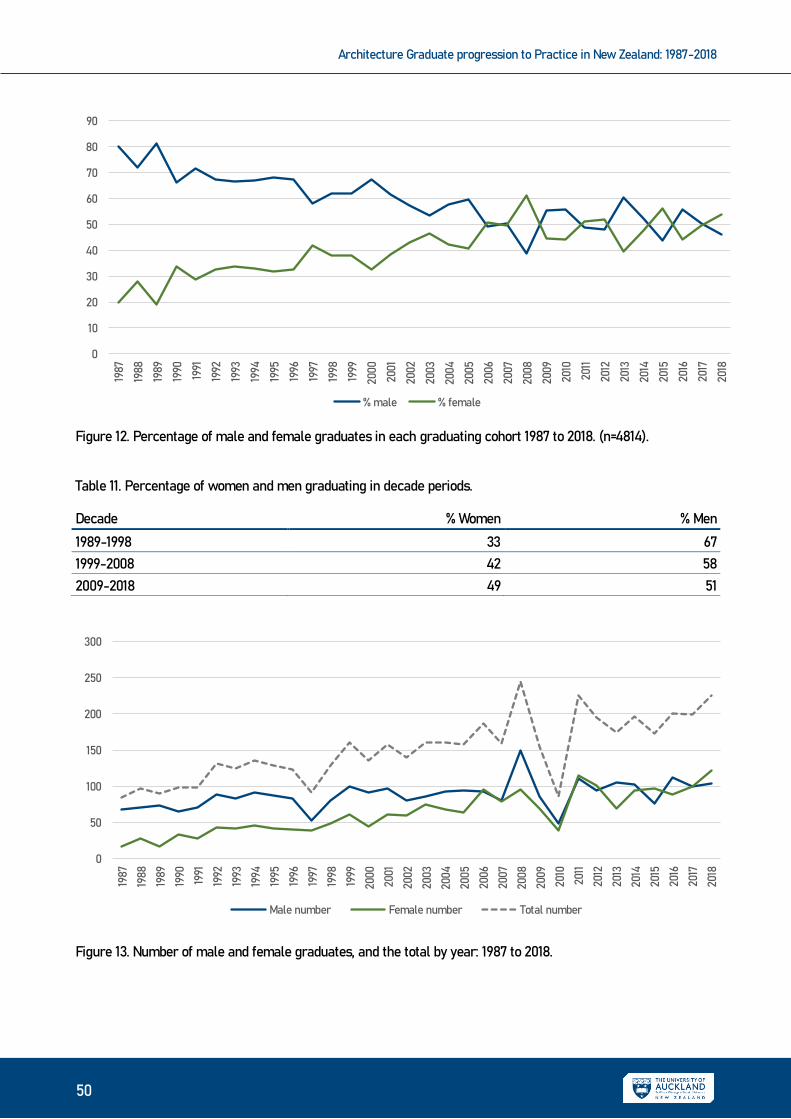
Architecture Graduate progression to Practice in New Zealand: 1987-2018
50
Figure 12. Percentage of male and female graduates in each graduating cohort 1987 to 2018. (n=4814).
Table 11. Percentage of women and men graduating in decade periods.
Decade % Women % Men
1989-1998 33 67
1999-2008 42 58
2009-2018 49 51
Figure 13. Number of male and female graduates, and the total by year: 1987 to 2018.
0
10
20
30
40
50
60
70
80
9019
87
1988
1989
1990
1991
1992
1993
1994
1995
1996
1997
1998
1999
2000
2001
2002
2003
2004
2005
2006
2007
2008
2009
2010
2011
2012
2013
2014
2015
2016
2017
2018
% male % female
0
50
100
150
200
250
300
1987
1988
1989
1990
1991
1992
1993
1994
1995
1996
1997
1998
1999
2000
2001
2002
2003
2004
2005
2006
2007
2008
2009
2010
2011
2012
2013
2014
2015
2016
2017
2018
Male number Female number Total number

7. Women and Architecture
51
Figure 14. Percentage of female graduates in each graduating cohort from 1987 to 2018 by Architecture School.
This shows the growth in total architecture
graduate numbers over the survey period. More
significantly, also shown is that the increase in
the number of female graduates has not been
accompanied by an increase in the number
male graduates. Comparing the numbers for the
decades 1999 to 2008 with 2009 to 2018 shows
male graduates decreasing from 955 to 953 (2.1
per cent). However, female graduates increased
from 701 to 893 between the same two decades,
an increase of 27 per cent. Consequently, while
the numbers of female graduates have
significantly increased over past years, this is
not the case among male graduates. The move
to gender parity relates to an increasing
number of women graduates, while the
numbers of male counterparts have plateaued.
In the Second Survey terminating in 2008
(Haarhoff, 2010), gender parity had just been
reached and it was forecast that this trend
would be continued into the decade ahead. The
data from this Third Survey confirms that this
forecast trend was achieved. It should be
emphasised that, while gender parity with men
has been achieved, this is not necessarily a
target. There is no reason why the percentage of
women should not be greater than 50 per cent.
Figure 14 shows the percentage of women in
each graduating year cohort by School,
compared to the overall average. All three
Schools indicate the same overall trend of an
increasing proportion of women in graduating
years since 1987. The University of Auckland and
Victoria University of Wellington have graduates
over the full 32-year period. The first graduates
from Unitec in 1998 have female percentages at
this time similar to the other two Schools, and
the trajectory follows a similar pattern.
Overall, over the past decade (2009 to 2018), the
average percentage of women among graduates
was 49 per cent. Considering each School, the
average percentage of women among graduates
over the past decade for The University of
Auckland, Victoria University of Wellington and
Unitec is 55, 45 and 41 per cent respectively.
0
10
20
30
40
50
60
7019
87
1988
1989
1990
1991
1992
1993
1994
1995
1996
1997
1998
1999
2000
2001
2002
2003
2004
2005
2006
2007
2008
2009
2010
2011
2012
2013
2014
2015
2016
2017
2018
% UOA % VUW %Unitec % Overall

Architecture Graduate progression to Practice in New Zealand: 1987-2018
52
7.3. Women registered as Architects
We have established that among the 4,814
graduates in the Survey, overall only 1,022 (21
per cent) were registered architects with the
New Zealand Registered Architects Board.
Discounting those graduates who at the time of
Survey were not eligible to apply for
registration, increases this to 24 per cent.
Table 12 gives the number and percentage of
registered by the NZRAB and, for each year
cohort, the number and percentage of men and
women who were registered at the time of the
Survey. This provides a perspective of change
over time. Over the five-year period 1987 to 1991,
26 per cent of graduates were women and 22
per cent of this female group was registered in
2019. This can be compared with the most
recent five years during which graduates were
eligible to apply for registration (2011-2015).
Over this period, the percentage of women was
50 per cent, but only 10 per cent were
registered. This needs to be interpreted with
care because, as we have argued, there appears
to be no particular urgency for graduates to
register once becoming eligible, whether male
or female. Notwithstanding, in this last five-year
period, while 10 per cent of eligible women
graduates were registered, for men this was
slightly higher at 14 per cent.
Figure 15 shows the numbers of men and
women registering by year cohort graphically.
The number of women and men registering
among the most recent eligible year cohorts
indicates that men and women are registering
at more or less the same rate. However, there is
a gender divergence moving to the earlier
graduating cohorts: the numbers of men
registered increases steadily, while for women
this appears to plateau. This suggests that,
while more and more men are registering over
time, this is not the case for women graduates.
Beyond numbers, of more interest is to consider
changes over time in the percentages of women
in each graduating cohort who are registered.
Overall, of the 1,023 graduates over the survey
period who were registered, 73 per cent were
men, and 27 per cent women. This can be
compared to gender distributions among
graduates over the same period: 58 per cent are
male and 42 per cent female. In other words,
although women constitute 42 per cent of all
graduates, only 28 per cent overall were
registered at the time of survey.
Figure 16 graphically shows the percentage of
males and females in each graduating cohort
who at the time of survey (end of 2018) were
registered architects.
The percentage of women graduates who go on
to registration has increased over the 32-year
survey period, from slightly more than 10 per
cent in 1987, to have approximate parity with
men at around 50 per cent over more recent
years. In part this is driven by the increased
number of women among graduates over the
period and supports Gill Matthewson’s (2016)
contention “women are an increasingly
important proportion of registered architects”.
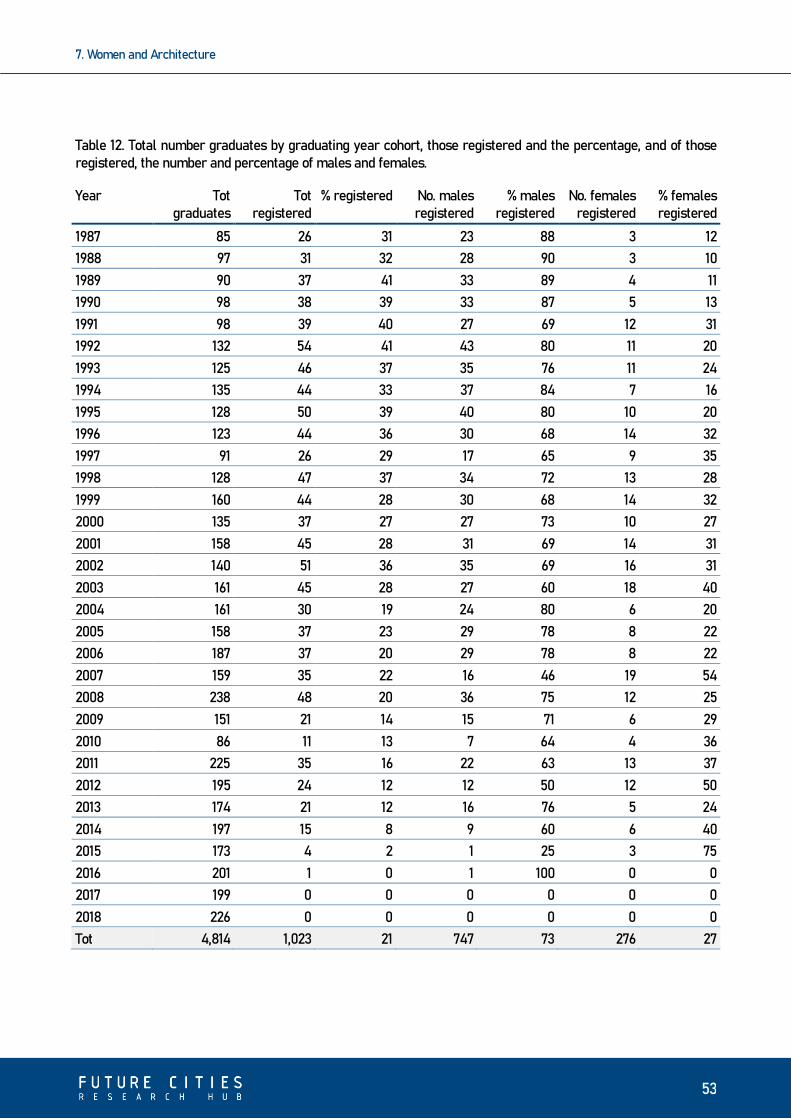
7. Women and Architecture
53
Table 12. Total number graduates by graduating year cohort, those registered and the percentage, and of those registered, the number and percentage of males and females.
Year Tot graduates
Tot registered
% registered No. males registered
% males registered
No. females registered
% females registered
1987 85 26 31 23 88 3 12
1988 97 31 32 28 90 3 10
1989 90 37 41 33 89 4 11
1990 98 38 39 33 87 5 13
1991 98 39 40 27 69 12 31
1992 132 54 41 43 80 11 20
1993 125 46 37 35 76 11 24
1994 135 44 33 37 84 7 16
1995 128 50 39 40 80 10 20
1996 123 44 36 30 68 14 32
1997 91 26 29 17 65 9 35
1998 128 47 37 34 72 13 28
1999 160 44 28 30 68 14 32
2000 135 37 27 27 73 10 27
2001 158 45 28 31 69 14 31
2002 140 51 36 35 69 16 31
2003 161 45 28 27 60 18 40
2004 161 30 19 24 80 6 20
2005 158 37 23 29 78 8 22
2006 187 37 20 29 78 8 22
2007 159 35 22 16 46 19 54
2008 238 48 20 36 75 12 25
2009 151 21 14 15 71 6 29
2010 86 11 13 7 64 4 36
2011 225 35 16 22 63 13 37
2012 195 24 12 12 50 12 50
2013 174 21 12 16 76 5 24
2014 197 15 8 9 60 6 40
2015 173 4 2 1 25 3 75
2016 201 1 0 1 100 0 0
2017 199 0 0 0 0 0 0
2018 226 0 0 0 0 0 0
Tot 4,814 1,023 21 747 73 276 27

Architecture Graduate progression to Practice in New Zealand: 1987-2018
54
Figure 15. Registration numbers by graduating year cohort, for men, women and the total 1987-2018.
Figure 16. Percentage of males and females who were registered at the time of survey by graduating year (n=1,023).
0
10
20
30
40
50
60
1987
1988
1989
1990
1991
1992
1993
1994
1995
1996
1997
1998
1999
2000
2001
2002
2003
2004
2005
2006
2007
2008
2009
2010
2011
2012
2013
2014
2015
2016
2017
2018
Total Reg Number Male Number Female
0
10
20
30
40
50
60
70
80
90
100
1987
1988
1989
1990
1991
1992
1993
1994
1995
1996
1997
1998
1999
2000
2001
2002
2003
2004
2005
2006
2007
2008
2009
2010
2011
2012
2013
2014
2015
2016
2017
2018
per cent Male per cent Female

7. Women and Architecture
55
Despite a move towards equity of registration of
men and women, there is considerable
inconsistency in the percentages over the years
since 2007. The average number of women
registered between 2007 and 2018 is 39 per
cent, versus 61 per cent for men. At 39 per cent
this still falls short of equity with men. This
proportion, however, is better when compared
to the percentage of women among all of the
2,347 Registered Architects at the time of
survey given in Table 12. This provides
comparative data from the register of the NZ
Registered Architects Board and the data from
the graduates in the Survey. It also shows the
number and percentage of registered architects
who had taken voluntary suspension at the time
of survey. In total there were 2,347 registered
with the NZRAB, of whom 2,038 were ‘active’
Registered Architects and 309 on Voluntary
Suspension.
Graduates from the Survey constituted half of
all Registered Architects in New Zealand (1,023
out of 2,038). When comparing the NZRAB
register with registration among the 4,814
graduates, the differences are relatively small.
Women represent 25 per cent of all NZRAB
Registered Architects compared to 28 per cent
among the Graduates.
Graduates from the Survey constitute only 15
per cent of all those on Voluntary Suspension.
Perhaps this is not surprising because they are
the younger cohorts establishing their careers,
while the NZRAB totals will include those
nearing retirement ages or established
overseas. For the NZRAB total, the Voluntary
Suspension proportion for women is similar to
that for active Registered Architects: 24 per
cent versus 25 per cent respectively. Among
graduates, however, the proportion of women is
higher, at 43 per cent.
Overall, despite there being close to equal
numbers of men and women graduates over the
past 15 years from New Zealand architecture
Schools, the overall proportion of female
Registered Architects is 25 per cent. This
percentage has increased from 10 per cent in
1999 and 18 per cent in 2008. This indicates that
the proportion of women among registered
architects in New Zealand is increasing,
although it is still relatively low at 25 per cent.
Alison Arieff (2018) points out that increasing
this percentage is not a ‘pipeline’ problem:
It would seem obvious: if you want
more female architects, teach more
women to be architects. Other fields
where women are under-
represented speak of a pipeline
problem, the belief that a lack of
diversity stems from a scarcity of
available talent. But nearly half of
architecture students are women,
so why are so few sticking with the
industry after graduation? (Arieff,
2018)

Architecture Graduate progression to Practice in New Zealand: 1987-2018
56
Table 13. Comparison of all registered Architects with those registered from among the graduates 1987-2018 (all percentages rounded to whole numbers).
Registered Voluntary Suspension
Number % Males % Females Number % Males % Females
NZRAB total 2,038 75 25 309 76 24
Registered Graduates 1,023 72 28 47 57 43
The data shows that while there has been close
to gender parity among architecture graduates
from New Zealand architecture programmes,
and while there is a progression towards an
increase in the number of women graduates
who go on to become registered, this is still far
from matched by the proportion of women who
go on to register as architects in New Zealand.
This conclusion is important in relation to a new
joint programme between the NZIA and the
Association of Consulting Engineers (ACENZ)
that has set a goal of getting 20 per cent more
women in engineering and architecture by 2021
(New Zealand Institute of Architects, 2018). In
the case of architecture, the issue is not related
to education given the gender parity among
graduates, but potential obstacles in the
pathways towards registration and
representation in senior level leadership roles.
Also needing consideration is ensuring that
women (and men) in practice who are not
registered achieve enhanced status that
recognises their important role in the workforce
and the delivery of architecture services.
7.4. Women as members of the New
Zealand Institute of Architects
The New Zealand Institute of Architects had a
total 4,007 active members (excluding retired
members) at the time of survey (2018), and 35
per cent were women. Of this total membership,
1,899 are among the graduates completing
qualifications between 1987-2018, constituting
47 per cent of the total membership in 2018.
Table 14 sets out the NZIA membership at the
time of survey among these graduates by
membership category and gender for each of
the year cohorts. As it can be seen, of the 986
Architect Members (all of whom will also be
registered), 256 were women – 26 per cent of
this membership category. While this
percentage falls well short of equity with men, it
is an increase from the Second Survey in 2009
(Haarhoff, 2010) when women in the NZIA
Architect category were just 17 per cent.
Women, however, do feature more in other
categories of membership. They constitute 52
per cent of NZIA Student memberships and 43
per cent of NZIA Graduate membership. In the
Allied Professional and Affiliate categories,
women constitute 36 and 33 per cent
respectively. There is gender equity among
Academic members, but here the numbers are
very small.

7. Women and Architecture
57
Table 14. Membership of the NZIA, by category, year of graduation and gender, 2008 (Source: New Zealand Institute of Architects).
Year
Affiliated NZIA Student NZIA Graduate
Architect Allied Prof Academic
NZI
A T
otal
M F Tota
l
M F Tota
l
M F Tota
l
M F Tota
l
M F Tota
l
M F Tota
l
1987 - - - - - - 1 - 1 23 3 26 - - - - - - 27
1988 2 - 2 - - - - - - 27 2 29 - - - 1 2 3 34
1989 1 - 1 - - - - 2 2 29 4 33 - - - - - - 36
1990 1 - 1 - - - - - - 34 3 37 1 - 1 - - - 39
1991 - - - - - - 1 - 1 25 12 37 - - - 1 - 1 39
1992 1 - 1 - - - - 1 1 44 10 54 - - - - 1 1 57
1993 - - - - - - - - - 36 9 45 - 1 1 - - - 46
1994 1 2 3 - - - 1 - 1 39 6 45 1 1 2 1 - 1 52
1995 - - - - - - - - - 40 9 49 - - - - - - 49
1996 - 1 1 - - - 3 - 3 31 10 41 - - - - - - 45
1997 1 - 1 - - - 2 - 2 16 9 25 - - - - - - 28
1998 1 - 1 - - - 3 2 5 29 13 42 3 - 3 - - - 51
1999 2 2 4 - - - 6 1 7 27 13 40 1 1 2 - 1 1 54
2000 - - - - - - 4 1 5 26 9 35 3 - 3 - - - 43
2001 2 - 2 - 1 1 4 2 6 30 10 40 5 - 5 - - - 54
2002 2 - 2 1 - 1 4 1 5 37 13 50 1 - 1 - - - 59
2003 1 - 1 1 - 1 3 2 5 28 13 41 1 - 1 - - - 49
2004 - - - - - - 8 2 10 21 7 28 2 1 3 - - - 41
2005 1 1 2 - - - 4 1 5 27 8 35 4 3 7 - - - 49
2006 - 1 1 - 1 1 9 6 15 27 8 35 2 3 5 - - - 57
2007 2 1 3 - 1 1 6 2 8 17 17 34 5 1 6 - - - 52
2008 6 2 8 2 1 3 5 2 7 42 11 53 6 6 12 - - - 83
2009 3 2 5 1 1 2 4 2 6 12 9 21 9 3 12 - - - 46
2010 4 - 4 - - - 5 3 8 6 4 10 7 3 10 - - - 32
2011 7 3 10 1 2 3 8 6 14 25 12 37 11 6 17 - - - 81
2012 5 4 9 4 - 4 9 12 21 9 13 22 3 8 11 1 - 1 68
2013 1 - 1 1 1 2 19 22 41 13 6 19 4 1 5 - - - 68
2014 - - - 6 9 15 37 23 60 8 8 16 - 1 1 - - - 92
2015 1 - 1 9 23 32 23 21 44 2 3 5 1 - 1 - - - 83
2016 - - - 24 33 57 39 27 66 1 - 1 - - - - - - 124
2017 - 1 1 43 34 77 20 24 44 - 1 1 - - - - - - 123
2018 - 2 2 52 51 103 15 18 33 - - - - - - - - 0 138
Tot 45 22 67 145 158 303 243 183 426 731 255 986 70 39 109 4 4 8 1,899
% 67 33 - 48 52 - 57 43 - 74 26 - 64 36 - 50 50 - -

Architecture Graduate progression to Practice in New Zealand: 1987-2018
58
Figure 17. Number of graduates who held membership of the NZIA (except Retired members) by year of graduation.
Figure 17 shows the distribution of
membership by year cohort for men, women
and the total in 2018. This shows the growing
number of graduates in each year cohort
joining the NZIA over the 32 years. Also
indicated is the convergence in the number
of men and women membership numbers
among the graduates joining over the past
decade.
More significantly, Figure 17 shows that the
numbers of male memberships remain fairly
constant over the 32-year period, whereas
there is a very clear increase in women
members when moving towards the more
recent graduate year cohorts.
Other changes over time can be seen. The
average female membership over the 32-
year period is 35 per cent, but if measured
over the past decade, this is 47 per cent. This
suggests that, while overall measures reflect
conditions of previous decades (the male
domination of memberships), there is an
indication that, among more recent
graduates, there is an increasing proportion
of women members of the NZIA. This is
largely due the higher proportion of women
among the NZIA Student and Graduate
membership.
The overall distribution of NZIA membership
looks very different when only considering
the Architect category, where women on
average constitute 26 per cent (Figure 18).
This shows the convergence of male and
female Architect Membership numbers in the
most recent graduating year cohorts, but
there is a widening gap between the number
of women and the number of men towards
1987. However, as is the case with overall
membership, when looking at the past
decade, the percentage of women who are
Architect members is 56 per cent. Again, this
suggests that the increasing number of
women graduates is beginning to have an
impact on membership and their role in the
formal profession.
0
20
40
60
80
100
120
1987
1988
1989
1990
1991
1992
1993
1994
1995
1996
1997
1998
1999
2000
2001
2002
2003
2004
2005
2006
2007
2008
2009
2010
2011
2012
2013
2014
2015
2016
2017
2018
Total Male Total: Female Overall Total

7. Women and Architecture
59
Figure 18. Number of Architect Members of the NZIA by graduating cohort year and gender.
Figure 19. Number of Graduate, Student, Allied Professional, Affiliate and Academic Members combined and Architect Members, by year and gender.
0
10
20
30
40
50
6019
87
1988
1989
1990
1991
1992
1993
1994
1995
1996
1997
1998
1999
2000
2001
2002
2003
2004
2005
2006
2007
2008
2009
2010
2011
2012
2013
2014
2015
2016
2017
2018
Architect: Male Architect: Female Total Arch
0
20
40
60
80
100
120
140
160
1987
1988
1989
1990
1991
1992
1993
1994
1995
1996
1997
1998
1999
2000
2001
2002
2003
2004
2005
2006
2007
2008
2009
2010
2011
2012
2013
2014
2015
2016
2017
2018
All except Architect: Male All except Architect: Female Architect: Male
Architect: Female Overall Total

Architecture Graduate progression to Practice in New Zealand: 1987-2018
60
Figure 19 looks at the same data from another
perspective and compares Architect members
of the NZIA with the summation of all other non-
Architect categories active in practice: Students,
Graduates, Affiliates, Allied Professionals and
Academics by gender.
Overall, among all categories of NZIA
membership held by the graduates of concern,
excluding Architect members, 53 per cent are
men and 47 per cent are women. Membership of
the NZIA signals an engagement with the
professional body and, to some extent, to the
practice of architecture. In this context, the
significant role played by the non-Architect
membership categories is also evident in the
most recent graduating years – providing an
important part of the workforce before Architect
membership becomes more significant.
Moreover, Figure 19 shows that, for this group of
non-Architect members, the participation of
women is relatively high: 44 per cent are
women. Indeed, participation by women in this
non-Architect group increases among the more
recent graduating cohorts. Among graduates
from the last decade (2009 to 2018), female in
this group is 47 per cent. However, as already
noted, these levels of female representation
among non-Architect members is not matched
by the NZIA Architect member category, where
this is 26 per cent. This indicates that, while
women are increasingly participating in formal
practice (as indicated by professional
membership), there remains a lag when it
comes to Architect membership (and associated
registration). Whether this relates to career
choices women make or to perceived obstacles
in the practice of architecture, it is explored in
the focus groups with women practitioners in
the next chapter.
7.5. Summary points
In summary, the following key points are
highlighted for women among graduates,
registered architects and members of the NZIA.
Women among graduates
▪ Among the 4,814 graduates between 1987-
2018, 42 per cent are women. Over the past
decade, the percentage of women among
architecture graduates has been 49 per cent
(reaching close parity with men).
▪ Over the past three decades, women
graduates have increased by 113 per cent,
while male counterparts have a smaller
growth of 2.6 per cent.
▪ Over the next decade, gender parity will
likely persist among graduates and there is a
prospect that the female proportion may
further increase.
Women among registered Architects
▪ Of the 2,083 registered Architects in New
Zealand, 25 per cent are women. For
comparison, the number is very, a
percentage close to 24 per cent in Australia.
▪ Of the 1,022 graduates who were registered,
27 per cent were women, despite the fact
that women made up 42 per cent of all
graduates.
▪ While there is a progression towards an
increase in the number of women graduates
who go on to become registered, this is still

7. Women and Architecture
61
far from matched by the proportion of
women who go on to register as architects in
New Zealand.
Women among memberships of the NZIA
▪ Among the 3,986 members of the New
Zealand Institute of Architects (NZIA), 39 per
cent were women in 2018.
▪ Among the graduates in the Survey, women
constitute 26 per cent of Architect members.
▪ Women constitute 43, 52, 36 and 33 per cent
of the membership in the categories
Graduate, Student, Allied Professional and
Affiliate respectively.
▪ Overall, Architect Members constitute about
half of the NZIA members, but only 30 per
cent of this figure are women.
▪ Among the graduates in the Survey, only 27
per cent were Architect members (all of
whom will also be registered with the
NZRAB).
▪ To the extent that membership of the NZIA
signals an engagement with the practice of
architecture, the significant role played by
the non-Architect membership categories is
evident in the most recent graduating years
– seemingly providing an important part of
the workforce in practices.

Architecture Graduate progression to Practice in New Zealand: 1987-2018
62

8. Speaking with women about the practice and profession of architecture
63
8. Speaking with women about the practice and profession of
Architecture
A total of 26 women were interviewed at the
two hour-long focus group sessions in Auckland
and Wellington. The profiles of the women at
each session were similar, as were their
responses when identified during data coding.
Therefore, the responses from the participants
are grouped together in this report.
A number of key themes emerged to add
richness to the quantitative data revealed by the
statistics about graduates over the last 32
years. First, to describe the focus group
participants, most were 25-34 years of age
(Figure 20) and of NZ European ethnicity. Māori
and Pasifika graduates were represented, but
less so than had been hoped in this self-
selecting sample. The majority of the
participants who fall in to the ‘other’ category
for ethnicity are of varying Asian origins (Figure
21).
Figure 20. The ages of focus group participants.
Figure 21. The ethnicities of focus group participants.
Participants were asked if they were registered
architects and the split was 65 per cent not
registered and 35 per cent registered. Of those
not registered, their roles were varied, but
predominantly they worked as architectural
graduates or in roles in adjacent built
environment disciplines such as urban design or
project management (Figure 22). Of those
registered, roles varied between being an
Architect, Principal or Project Architect, Project
Lead or Director.
To further build the profile of the focus group,
participants were asked about the type of work
they did and, if they worked in a design firm, the
size of the practice they worked in. Most worked
on residential projects, followed by commercial,
public architecture and industrial (Figure 23).
62%15%
8%
15%
18-24 years old 25-34 years old
35-44 years old 45-54 years old
55-64 years old 65+ years old
66%4%
4%
4%
22%
New Zealand EuropeanMāoriChineseIndianOther

Architecture Graduate progression to Practice in New Zealand: 1987-2018
64
Figure 22. Current roles undertaken by focus group participants.
Figure 23. Type of work undertaken by focus group participants.
Figure 24. Size of the practice where participants worked in a firm.
This may have followed a pattern for the work
available to be related to the size of the firms
where participants were working. However, the
majority worked in large practices of 20 people
and over, with 26 per cent working in firms of
over 100 staff. Sole practitioners made up 11 per
cent and firms of less than 10 made up 15 per
cent of the participants (Figure 24).
In line with the locations of the two focus
groups sessions, participants were nearly
evenly split between the two locations in terms
of where they studied. As shown in Figure 25
and Figure 26, Auckland was split between The
University of Auckland and Unitec, with only a
small number of participants in either city
having studied elsewhere.
When asked if they had done further studies, 77
per cent said no and 23 per cent said that yes,
they have gone on to do further post-graduate
study.
13%
6%
35%
3%3%
10%
9%
3%
3%
3%
3%3% 3% 3%
ArchitectSenior AssociateArchitectural GraduateSenior Architectural GraduateProject ArchitectProject LeadPrincipalLecturerAdminRegistered ArchitectDirectorProject ManagerUrban Design ManagerSet designer
46%
4%11%
27%
8%
4%
Residential TertiaryPublic CommercialIndustrial Healthcare
11%
15%
11%
26%
11%
26%
Sole practitioner Less than 1010+ 20+30+ 50+100+

8. Speaking with women about the practice and profession of architecture
65
Figure 25. The institutions where focus group participants studied for their first degree.
Figure 26. The institutions where focus group participants studied for their second degree.
The following sub-sections summarise and
discuss the main outcomes from the two focus
group in Auckland and Wellington. It is to be
noted that, although focus groups are not
representatives of the opinions of all women in
the architecture profession in New Zealand but
just of those of the participants, they offer
useful inputs for a reflection for all institutions
involved in this study.
8.1. Architectural education and the
transition to practice
The focus group sessions began by asking the
participants about why they had chosen to study
architecture. Responses ranged from the
influence of family to suggestions made by
school career councillors. The majority had
chosen to study architecture early and worked
towards it through their schooling, being all-
rounded and succeeding in both art and
mathematics/science disciplines. Both focus
groups had a high proportion of participants
that cited a balance between art and
mathematics/sciences as a key driver for
choosing architecture. The words “creativity”
and “practicality” were used by many
participants, one noting “I think I studied
architecture because it was a balance as I’ve
always been quite creative and enjoyed that
aspect of life and then just being good at
mathematics and physics […] so I just tried to
pursue something that I was both good at and
enjoyed”.
Early childhood experiences, including being on
construction sites or experiencing
buildings/places that impacted them were also
mentioned as a factor. One participant recalled
“as a really young kid [...] we stayed in a
modernistic apartment and it had this huge
impact on me”. Another added: “my father was
an architect so as a child [...] on a Saturday I
would go and play in piles of gravel on building
sites and so it was just part of my world and it
seemed very natural to just become an architect
as well”. Parental influences were considered
by many to be a driver towards architecture:
“my dad’s a civil engineer and my brother has
26%
22%
52%
University of AucklandUnitecVictoria Universit of Wellington
30%
15%
55%
University of Auckland
Unitec
Victoria Universit of Wellington

Architecture Graduate progression to Practice in New Zealand: 1987-2018
66
become a civil engineer as well and grandfather
was an engineer, so it’s kind of in the blood”.
Architecture was also seen as a solid career
choice, which appealed to both the participants
and their families.
Other participants cited a desire for social
impact as a driver for their studying
architecture. One participant commented: “I feel
like we have an opportunity to really contribute
positively to society through architecture and
yeah, it gives me a sense of purpose designing
and bringing it to fruition”. Another added: “the
thing I love about architecture is it’s about
people ultimately”.
When asked about their views on their
experiences in architectural education, the
predominant view expressed by participants
was a general feeling that their education
experiences were not aligned to their
experiences of practice. Some preferred
practice to education and others preferred
education to practice. One participant lamented
that “the office is completely different to what I
expected leaving University”, noting that they
“came out of architecture school thinking I
wouldn’t practice architecture at all [...] as soon
as I started working it was much better”.
The future of education was not discussed in
detail in the focus groups. One participant
mentioned the value of diverse groups studying
together, identifying that equality begins in
education and continues into practice.
Another strong view shared by participants was
that their education had not fully prepared them
for the profession and business of architecture.
Both focus groups suggested that education
should teach life, business and people skills to
better prepare students for the 'real world’. One
participant commented that “the fantasy in
architecture school doesn’t quite translate into
being a graduate […] one of the problems is a
quite big disconnection between what is
happening in practices and what the schools are
preparing the students for, so they get in to the
working force and it is a shock on both sides”.
Another key aspect of architectural education
that was discussed by participants was the way
education is not collaborative across the built
environment disciplines to represent how
people work together in practice. One
participant, for example, commented:
The idea that it’s about autonomy of
working independently isn’t how it
is, it’s a very collaborative space [...]
working with different consultants
and coordinating things is more
accurate but that doesn’t translate
through in university study.
This led on to discussing the role of the size and
structure of participants’ practices on their
experiences in the profession. It was generally
seen that smaller practices could provide
greater exposure and breadth of experience on
projects, in turn making registration easier and
more attainable. One participant, for example,
commented that they were “very fortunate to be
in a very small firm so there were only 10 of us
so I was forced to do things I didn’t even like
doing”. Others spoke more about the quality of
the firm in terms of their commitment to giving
diverse experiences. One participant observed
that they had found the path to registration
“pretty straightforward” because they worked
for “a great firm” which deliberately gave them
a wide variety of experiences.

8. Speaking with women about the practice and profession of architecture
67
8.2. The registration process
When it came to reflecting on the aspirations
the participants remembered having for their
career prior to commencing it, a majority spoke
about the autonomy and registration (so they
can call themselves Architects) as aspirations
for their careers. One participant commented:
“I’d like to register so that I can someday have
my own business; being my own boss would be
nice”.
A series of questions were asked to try and
unpack some of the reasoning behind the
statistics presented about registration and
women. Participants who were not registered
were asked if it was something they were
considering and either, if not, why not. Or if so,
how they felt registration would affect or
benefit them and if there were any challenges
or barriers they perceived they may face. For
those who were registered, participants were
asked what the path to registration was like for
them and if they had found benefits and
challenges to becoming and being registered.
There was a division among the not registered
respondents between whether registration was
worthwhile or not.
Participants who were not registered and who
did not intend to follow a path to registration
predominantly felt that being registered “was
not a priority” and would not assist their
careers. One participant highlighted this idea
stating: “the definition of what a registered
architect in New Zealand is not the path for me”.
Others observed that it did not affect their pay
or, if they were in adjacent roles as urban
designers or project managers, then working
towards registration would likely require
working for less money as an architect and
seen as an unnecessary step.
Comments about why both want-to-become and
registered participants thought that registration
was a good pathway for them revealed a variety
of themes when coding the data. Firstly,
registration was linked to having a sense of
identity as ‘a real architect’. One participant
noted that “when you register there’s no
question mark”, another added that it was “nice
to have that title on my email”. Identity also
merged with convenience, with several
participants commenting that “being able to call
yourself an architect would be quite good cause
it’s a bit hard trying to explain it to other people
[…] some people would just call me an architect
but, no I’m not, I’m an architectural graduate [...]
so that’s a big pro for registration”. This was
fuelled by confusion about the differences
between an Architect and an Architectural
Graduate; one participant explaining: “when you
say you’re an architectural graduate they think
you’re studying still, or they’re just completely
confused, so it’s just quite a vague place to sit
while practicing, I think”.
Similarly, registration was also viewed by many
participants as part of the pathway to
completion for the degree or “box ticking”. One
participant said: “I see it as the completion of
your study [...] it’s sort of the final thing you go
through to wrap up you practising”. Another
quipped “I thought it was just the icing on the
cake. Made the cake might – as well get it iced!”
For others, registration was seen as motivation
to fill gaps in their experience. One participant
highlighted this idea, commenting: “I did
registration to find the gaps I know I had [...]
then after that I can specialise, but I felt like I

Architecture Graduate progression to Practice in New Zealand: 1987-2018
68
needed to just get an across-the-board
knowledge”. Another added: “I found the
registration process good for me. It made sure
that I filled in all the gaps [...] I found the
registration process incredibly rigorous and
very thorough.” The final positive reason
discussed by those planning on registration was
the idea that it signalled “safety” and
competence to the public. Registration was
described as the “minimum requirements that
you’re competent and you’re no danger for the
public”.
Barriers to becoming and staying registered, for
those who did intend to follow this path, were
numerous and included the time and expense
for registering and the difficulties experienced
by many women in accessing the CPD
programme. Describing registration, one
participant who wanted to work towards it said:
“the reason why I haven’t done it yet is mainly
time [...] a matter of having enough time to do
the registration documentation”. Another
recently registered participant reflected by
noting: “I found the actual registration process
so time consuming, it just took so much time. [It
has] been the biggest stress in my life [...] my
whole life has come to this moment. It felt very
big [...] occupied every waking hour probably for
a minimum of six months”. This sentiment was
shared by all of the other recent registrants at
the focus group session.
Another generally held view by participants was
that CPD sessions were often inaccessible for
people with families because they were in the
school holidays or evenings. One participant
observed that “you’ve still got to do CPD even if
you’re under suspension [...] which is seminars
at 6pm or 7pm”. This was linked to a discussion
in the focus groups and whether the registration
process was becoming out-of-date as the future
of work changed. One participant observed that:
“how we practice architecture has changed
hugely in the last 20 years and the registration
requirement framework has stayed pretty much
the same”.
Another key barrier to registration raised by
participants was that of being “pigeon-holed” in
to doing only one type of architectural work
(such as detailing, CAD or rendering) and the
need to move practices to gain a full breadth of
experience for registration. One participant
shared that:
Being pigeon-holed is quite a big
thing...they see you’re good at
something...a certain aspect of
architecture and they kind of throw
you in there…From my experience a
lot of graduates just get shoved into
certain roles and get made just to
do that and they don’t get the
experience they need.
Another, speaking about registration,
considered that they were “on the fence right
now” about continuing to try for registration
because they had been through the process but
initially failed “through lack of experience,
where, I’ve been pigeon-holed in my job [...] I
need to move companies if I want to get
registered, so it wasn’t a positive experience [...]
if it’s not going to be supported […] then why
should I try?”. Recounting a similar story,
another participant’s view was that: “you just
have to move on because if they’re not going to
support you and give you that broad experience
we owe it to ourselves to find that and just move

8. Speaking with women about the practice and profession of architecture
69
on [...] it’s only natural you’re going to be
pigeon-holed and it’s not right but unfortunately
that’s how it is”.
This led to a discussion in the focus groups
about the support and mentorship (or lack
thereof) available for those seeking registration.
The general consensus was that there is little in
the way of support and mentorship freely or
readily available and focus group participants
identified this lack of support as a contributor to
not pursuing registration or leaving the
profession entirely. One participant lamented
that “the core practice of architecture is still
really exploitative [...] they expect Heaven and
Earth to be moved by their graduates. They offer
very little in terms of mentorship”. Another
added: “I started out thinking I was going to
follow the kind of set path and get registered
and tick the boxes as I went. And when I worked
in London [...] my practice there was really
supportive of that. I came back and worked in
New Zealand and that all sort of fell away
because I wasn’t supported and I just lost sight
of the registration thing because I felt like I
needed a little help getting there and the help
wasn’t there”.
The new health and safety legislation was a
final reason perceived as being a barrier to
registration because it meant greater liability
could be placed with the architect. One
participant observed that “health and safety
obviously with the big law change [...] means
more responsibility on the architect [...] maybe
that in itself is a barrier [to registration]
because it seems like an insurmountable
barrier.”
The series of reasons explored in the focus
groups sessions support the statistical findings
in this report about the low rates of registration.
It also revealed that the reasons are
multifaceted and affect potential architects at
all different ages and stages of their careers.
8.3. Defining Architecture and the roles
of the Architect
Discussing registration early in the focus group
sessions revealed many frustrations about the
process, but also raised a significant discussion
in the focus groups about how the terms
‘architects’ and ‘architecture’ were defined and
what the role of the architect meant. This
section presents the key themes that emerged
on these topics from across the two focus group
sessions.
Fundamentally, the focus group participants
described architecture as being a broad and
varied discipline. One participant described
architecture as “a way of being [...] there are
many kinds of architects and the practice of
architecture is a very broad thing”. Another
added that the practice of architecture “teaches
you to connect problems, find solutions for a
whole lot of different users and different
clients”. Architecture was also described as an
innately collaborative profession, bringing
different industry professionals together in
projects. However, the changing nature of the
broader profession and the way many newer
professions were perceived to have encroached
on the work an architect would have once done
exclusively led some participants to raise
concerns about defining the architect of the
next 20 to 30 years. One commented: “We need

Architecture Graduate progression to Practice in New Zealand: 1987-2018
70
to expand to a new place where we sit amongst
this growing industry in construction [...] where
we are the point of contact for every different
consultant”.
It was through this focus on the broad, complex
nature of architecture and the role of an
architect that the focus group participants were
divided in their views about the 'title
registration’ model being the best
representation of how to define an ‘architect’.
While the participants acknowledged that being
an architect is defined by legislation and means
you can only use the title if you are registered,
the confusion, particularly by the public, about
the term made it difficult to use. One participant
noted: “you’re practicing as an architect, doing
everything that an architect does but you might
not be registered which is where the confusion
comes, because how you do you explain that to
people?”. Both focus groups commented about
public perceptions being a difficult part of
defining the term architect and the general
consensus was that the public do not
understand what an architect is (especially with
reference to registration and the legalities
around the use of the term). One participant
described this issue of defining an architect by
saying:
The public don’t really understand
the difference [between a
registered and non-registered
architect]. There are lots of
draughtspeople out there who
people will think are architects
because they provide a particular
service which is similar and so
you’re kind of caught up in trying to
explain it to people.
Alongside the registration discussion,
’responsibility’ was a term used to describe the
term ‘architect’. Some participants felt that
architects had a great responsibility because
they were always dealing with people’s money
and lives. One participant summed up their
perceived role as follows:
I think it’s really powerful being an
architect because, unlike other
professions or so-called
professions, we are working under
an Act and we do have a
disciplinary body and we have all of
that to back us up so that you know
the public should feel safer working
with an architect...there should be
that surety there about working
with an architect.
Focus groups participants identified ’hard work’
as a defining and necessary feature of success
as an architect, also noting that this differed
between individuals and practices. This was also
coupled with the idea of needing to be ’assertive’
and have ’confidence’ to succeed, particularly in
an industry dominated by males. One participant
surmised: “we have to double down on our
assertiveness if we want to get the exact same
as a male”. Another added that “being heard,
being assertive” is important because as a
young woman in a large firm she had noticed
that there were “a lot of headstrong young men
and it’s really competitive [...]. I believe there’s
this perception that if you’re confident you’re
also competent which is absolutely not the case:
[you] have to become more confident to appear
more competent”. Another similarly commented:
“I worked it out very quickly. Being a woman in a
building industry, it’s not an easy task and to
8. Speaking with women about the practice and profession of architecture
71
show that you are worth it, you actually need to
go through the process and show that and be
assertive”. This led on to a discussion, shared in
the next section, about the experiences of being
a woman in the profession and practice of
architecture in New Zealand.
8.5. The experiences of women in the
profession
Throughout the focus group sessions, a number
of themes emerged about the nature of the
profession and the experiences of women. A
first theme to emerge was the historically male
nature and continued male dominance in the
profession. There was a view shared that “the
expectation [...] is that you assimilate a male’s
approach to be successful”. Both focus groups
commented on the disproportionate number of
men still in senior roles when compared to
women. One asked: “Why is there [...] a lower
proportion of female principal directors? [...] And
few other senior women just generally?”. Both
focus groups highlighted the lack of senior
women and female role models in architecture,
although did note the increase in support
organisations and a general awareness of the
lack of senior women, that was creating positive
shifts to bring more women into the profession.
One participant felt that “there are more women
now so simply by numbers we’re going to
change the environment, which is great”.
Both focus groups made references to there still
being an ’old boys’ club’ or an ’old boys’
network’, although some participants also noted
it was ’getting less and less’ as time went on.
The Wellington focus group commented on a
general lack of respect for (young) women in
the industry and younger focus group
participant spoke about the ways in which they
often wanted to appear older to gain respect.
One participant commented: “I couldn’t wait to
turn 30 […] I had grey hair and I purposely did
not want to dye them [...] because I wanted to
appear older”. Another added “all of a sudden
you turn 42 and you get this mantle of wisdom
[...] I suddenly became a senior female architect,
which is evidently quite rare, and so you have to
be respected”.
Both focus groups also commented on different
preferences in ways of working between men
and women, highlighting: “I think a lot of women
actually deliberately choose not to work in
those bigger practices and not to do those big
commercial jobs because they don’t want to,
they don’t want to go there, they don’t like that
lifestyle”. This was linked to the idea that long
working hours were still expected and that the
‘time-equals-productivity’ mindset was still
prevalent, an aspect found in overseas studies
as well (Padavic, Ely & Reid, 2020). One
participant described it as:
[The] industry is caught up with this
notion that time equals productivity:
we totally know it doesn’t […] I just
wish we could go towards more of a
project base where productivity is
about getting the job done, cause
that’s how we work […]. It would be
a whole shakeup because everyone
bases everything on time.
The differences between the ways participants
perceived men and women to work also raised
concerns about part-time versus full-time work.
It was seen that it is difficult to gain or retain

Architecture Graduate progression to Practice in New Zealand: 1987-2018
72
registration when working part-time, because
CPD events are less accessible. A participant
commented that “if you’re only working half
time and you want to stay registered that they
need to make it easier because paying all that
money for registration and trying to keep up
with the CPD was a real problem”.
Other observations during the focus group
sessions included that:
▪ Career breaks or voluntary suspension can
diminish confidence when mothers return to
work.
▪ It can take time and effort to regain career-
momentum after taking time off for family,
and this may put women off returning to the
profession.
▪ Voluntary suspension creates ambiguity
because the title 'architect’ cannot be used
while on suspension. This makes being a
mother and being a sole practitioner where
very small jobs may keep coming in
especially difficult.
Changes to voluntary suspensions were one of
the areas that focus group participants felt
needed to change the most about practice in
New Zealand.
The gender pay gap had been felt by focus group
participants and many of them had considered
moving professions for better pay. There was a
view that women need to ‘fight’ for equal pay. A
number of participants shared stories about
their issues with architecture not being a well-
paid, albeit a publicly respected profession. One
noted: “money’s a big thing and I’m stuck in a
position now where I can’t go down to
residential practice because I can’t afford to [...].
I’ve been also looking at potentially shifting into
project management because I want to afford to
buy a house”. Not being able to buy a home on
an architectural salary was a concern for many
of the younger focus group participants. Another
recounted an experience where a firm she was
applying to “went for the most exploitative
starting point they could, and I am sure if I
wasn’t a woman that would have been a
different starting point”.
Both focus groups discussed the need or want
for more options to diversify within the
profession of architecture and felt that women
were strong proponents of this. Reasons for
diversification included: pursuing a higher
salary, specialisation or looking for work that
better matched interests. Similarly to the ‘pay-
gap’ discussion, one participant commented: “I’m
starting to explore other options now as
well...go in to project management...become a
design manager for a construction company...I
want to still keep that passion of looking at
details, working stuff out but not necessarily
working for an architecture practice”.
Both focus groups discussed the value of
support networks and mentorship (or a desire
for better mentorship) for women in the
profession. One observed that “as a profession
we’re not necessarily very supportive of each
other, particularly with women”. Another
commented: “as a woman you know in our
position [...] we need to join forces together to
support each other [...] really work hard to
increase our knowledge, competency and self-
esteem”. One participant suggested that New
Zealand’s professional body was well-placed to
do more to enable and encourage mentorship
for women and break down some of the barriers
facing women in the profession, saying: “the

8. Speaking with women about the practice and profession of architecture
73
NZIA, for example, could play a role in sort of
talking about these [chauvinist] cultures, we can
change these cultures and support people
talking about varying work hours and flexible
working…and also talk with other industry
professional groups”.
8.6. The future of the profession
The focus group sessions concluded by
discussing the future the participants saw for
their profession. Generally, there was a feeling
that the profession was changing, but that
historical concepts of architecture are making
the practice slower to adapt to change than
some other professions. One participant
commented: “although it’s progressing and
changing, we still have a very exploitative
history [...] it’s part of where we come from
historically, and I think it’s going to be bloody
hard to shake it off”. Another added that “having
more women on your project teams would be
great. While there are almost 50/50 in
architecture…not so for engineers, not so for
your builder, project managers [where] you’re
probably still the only woman”.
However, while registration was noted as being
more stringent and harder to obtain than it has
been historically, it was acknowledged that
progress had been made to date; particularly, a
major change was acknowledged in moving
towards more flexible and part-time hours
being available. One participant observed “over
the last three-ish years there’s been massive
change in the general expectation of employees.
They actually kind of expect now some part-
time work from home [...] positive changes are
happening, rapidly”. Another added “Everyone in
the workplace is getting on board with the
flexibility. When I started, I had no flexibility at
all. Now I work in a workplace where I do a
nine-day fortnight”. Younger practices were
noted (in both focus groups) as having a great
impact on changing the profession. One
participant shared that:
There’s a whole lot of younger
practices that are coming through
[...] which are led by these kind of
generation X or Y. They are not just
kicking the system but they’re
creating a different system, so in
comparison to the older structures
they’re much more flexible with
time, with themselves as well with
their employees.
Technological changes too meant that “the
whole structure of practice is changing”. The
younger participants felt this was an
opportunity for them and, in general, the
increasing number of women in architecture
held hope for the participants of a changing
environment for architectural practice.
This led to a concluding discussion about
diversity in the architecture profession. One
participant summed this up by saying: “I’d really
like to see that different and wider-ranging
approaches [to architecture] are respected and
appreciated […] so you don’t just have to be
confident to be competent, so that you can be
soft spoken or you can approach from a
different direction or you can be working in a
different field and they’re all still equally
respected”. This included the notion that
increased trans-disciplinarity may become part

Architecture Graduate progression to Practice in New Zealand: 1987-2018
74
of a technologically savvy, diverse and
respectful architecture profession in the future.
8.7. Summary points
In summary, the following key points from the
focus groups are highlighted.
Architectural education and the transition to
practice
▪ Reasons for choosing to study architecture
were varied, but most decided to study
architecture early and worked towards it
through their schooling; being all-rounded
and succeeding in both art and
mathematics/science disciplines.
▪ When asked about their views on their
experiences in architectural education, the
predominant view expressed by participants
was a general feeling that their education
experiences were not aligned to their
experiences of practice.
The registration process
▪ There was a division among the not
registered respondents between whether
registration was worthwhile or not.
▪ In the focus groups, participants who were
not registered and who did not intend to
follow a path to registration predominantly
felt that being registered “was not a priority”
and would not assist their careers.
▪ Registration was linked to having a sense of
identity as ‘a real architect’ and was also
viewed by many participants as part of the
path completion for the degree or ’box
ticking’.
▪ Barriers to registration were noted as being
numerous and included the time and expense
for registering, the inaccessibility of the CPD
programme and being “pigeon-holed”.
▪ Views on registration explored in the focus
groups sessions support the statistical
findings in this report about the low rates of
registration. They also revealed that the
barriers to registration are multifaceted and
affect potential architects at all different
ages and stages of their careers.
Defining architecture and the roles of the
architect
▪ Fundamentally, the focus group participants
described architecture as being a broad and
varied discipline.
▪ Focus group participants were divided in
their views about the 'title registration’ model
being the best representation of how to
define an ‘architect’. The confusion,
particularly by the public, about the term
‘architect’ made it difficult to use.
▪ Focus group participants identified “hard
work”, the need to be “assertive” and have
“confidence” as factors to success,
particularly in an industry dominated by
males.
The experiences of women in the profession
▪ Both focus groups commented on the
disproportionate number of men still in
senior roles when compared to women and
highlighted the lack of senior women and
female role models in architecture. The
groups also both discussed the value of

8. Speaking with women about the practice and profession of architecture
75
support networks and mentorship (or a
desire for better mentorship) for women in
the profession.
▪ Changes to voluntary suspensions was an
area that focus group participants felt
needed to change the most about practice in
New Zealand.
▪ The gender pay gap had been felt by focus
group participants and many participants had
considered moving professions for better
pay.
▪ Both focus groups discussed the need or
want for more options to diversify within the
profession of architecture and felt that
women were strong proponents of this.
The future of the profession
Generally, there was a feeling that the
profession was changing, but that historical
concepts of architecture make the practice
slower to adapt to change than some other
professions
.

Architecture Graduate progression to Practice in New Zealand: 1987-2018
76

9. Conclusions and recommendations
77
9. Conclusions and recommendations
The analysis reveals that between 1987 and
2018, there were 4,814 architecture graduates
from the three Schools of Architecture, with
annual numbers increasing over the 32-year
period – from 85 in 1987 to 226 in 2018. The
University of Auckland produced just over half
of the graduates, Victoria University of
Wellington just short of one-third, and the
balance from the new School at Unitec, that
produced its first graduates in 1998. Among the
4,814 graduates surveyed, 42 per cent are
women. Graduate ethnicity was surveyed for the
past decade (2009-2018) and this shows that
those identifying as ‘European/Pakeha’ are the
largest group at 48 per cent, and as a
proportion have remained fairly consistent over
the past decade (6 per cent growth). Those
identifying broadly as ‘Asian’ constitute 36 per
cent and have grown by 70 per cent. Māori
represented 9 per cent of graduates (compared
to 15 per cent in the general population), while
Pasifika was 4 per cent. The data indicates that
Māori and Pasifika have relatively small
numbers, and that for Māori these have declined
over the past decade.
Of interest in the research, was the progression
of these graduates to the profession and
practice of architecture in New Zealand. This is
measured by formal registration with the
NZRAB and/or membership of the NZIA. The data
reveals that 24 per cent of eligible graduates
from the 32-year period were Registered
Architects in New Zealand in 2018, while 40 per
cent held membership of the NZIA across a
number of categories. Among 1899 graduates
who hold NZIA membership, Architect members
comprise 52 per cent, while the balance of 48
per cent comprises NZIA Student, NZIA
Graduate, Allied Professional, Affiliate and
Academic categories. This shows that roughly
half of the NZIA membership from the graduate
group in 2018 were non-Architect members,
underscoring their significance to the NZIA and
the wider profession.
While registration does not require membership
of the NZIA, it was noted that the percentage of
Registered Architects not a member of the NZIA
was 3 per cent, a significant drop from the
previous Survey in 2010. Moreover, while the
NZRAB requires between 2.5 and 5 years of
specified experience before making application
for registration, only 44 per cent of the eligible
graduates in the Survey had done so. Indeed, for
most, registration occurs at various points of
time after graduation over the 32-year period.
This suggests that for many, there is no
perceived urgency for registration and that this
may be driven by personal career progression
motives. This was very much underlined in the
focus group discussions with women graduates.
The analysis shows that less than half of all
graduates (just over 40 per cent) completing
qualifications over the period are engaging in
formal practice within New Zealand. This
identifies a sizable number of graduates (over
half) over the past 32 years who have not
progressing to formal practice within New
Zealand. They will include international students
(although a relatively small number in New
Zealand), those pursuing architecture careers in

Architecture Graduate progression to Practice in New Zealand: 1987-2018
78
other countries, recent graduates seeking
employment in the architecture profession and
those pursuing other occupations.
Noting that less than half of the graduates in the
Survey are registered or members of the NZIA,
raises question about the relationship between
industry needs and supply, and the growth of
New Zealand’s population (soon to be 5 million).
When comparing data from the three graduate
surveys, what is shown is that in the last
decade, the ratio of graduates per 1,000 people
shows a small decline. On the other hand, the
ratio of registered architects at 0.48 per 1,000
people compares favourably to the 0.5 in
Australia. In the previous Survey (Haarhoff,
2010) attention was drawn to Department of
Labour’s 2005 data indicating that New Zealand
required 200 graduates a year to replaced
forecast retirements. Getting a better
understanding the complex relationships
between architecture graduate numbers,
industry demand, the roles of the organised
profession and how practice may change in
future is perhaps an area for further study. For
example, to what extent are architecture
graduates contributing to the practice of
architecture from outside the formal
profession? How might this change in the
future? And how might this influence education?
With regard to women, of the 4,814 graduates
over the past 32 years, 42 per cent are women,
although the number of women among
graduating cohorts has progressively increased
over more recent years: in the decades ending
in 1998, 2008 and 2018 this has been 33, 42 and
49 per cent, and is evident at all three Schools.
This clearly indicates that the percentage of
women graduates has reach parity with men,
and this is likely to be sustained over future
years. Where parity has not been reached is the
percentage of women who go on to be
registered in New Zealand and join the NZIA as
an Architect member. Among the 1,023
graduates in the Survey who were registered
with the NZRAB in 2018, 27 per cent were
women. Among the 1,899 members of the NZIA
among the graduates, 35 per cent were women
in 2018. However, of the 986 graduates from the
Survey who hold Architect category of
membership, the percentage of women is 26 per
cent. While these percentages still fall short of
parity with men, it is nevertheless an
improvement over previous surveys.
While registration and Architect membership of
the NZIA involves only a quarter of survey
graduates, the percentage of women in other
categories of membership indicates higher
participation by women. The percentage of
women among the NZIA Student and Graduate
member categories is 52 and 43 per cent
respectively. These categories of membership,
along with Affiliate and Allied Professional
categories persist across all year cohorts, and
this underscores their role in practice, and
especially the women involved.
An issue identified in the focus groups is a
perceived lower status for those who are not
registered (and Architect members of the NZIA),
despite key roles they perform in practice.
Focus group participants who were not
registered and who did not intend to follow a
path to registration, predominantly felt that
being registered “was not a priority” and would
not assist their careers. Comments about why
those who want to become registered and those
who were, nevertheless expressed a view that

9. Conclusions and recommendations
79
registration was a good pathway for them
because: it linked to having a sense of identity
as ‘a real architect’; was viewed as part of the
path completion for the degree; and was seen
as a gap-filler that helped architects to be all-
rounded in their skills.
Barriers to becoming and staying registered, for
those focus group participants who did intend to
follow this path were numerous. They included
the time and expense involved in registering,
the difficulties in accessing CPD events for
those with families, the risk of being ’pigeon-
holed’ in to doing only one type of architectural
work and the liability risks associated with the
new health and safety legislation in New
Zealand.
Within the focus groups, there was generally a
feeling that the profession was changing. A
major change was acknowledged in moving
towards more flexible and part-time hours.
Changes to voluntary suspensions were
identified as key areas needing improvement in
architecture practice in New Zealand.
Both the Wellington and Auckland focus groups
commented on the disproportionate number of
men still in senior roles as compared to women
and also raised ongoing concerns about the
gender pay gap, although improvements were
perceived to have been made.
Amidst the evolution of female representation in
architecture, the profession generally is
undergoing change: ”how architects define
themselves, how practices operate, and the
range of roles and types of work pursued: are
all being rethought” (Clark, 2015). Parlour’s
Guides to Equitable Practice (Clark, 2015) aim to
facilitate this change by providing
recommendations to architecture practices,
employees and the wider profession and offer a
framework of key goals to enable an equitable
architectural profession in which people want to
stay. These goals are explored in eleven key
areas: pay equity, long hours, part-time work,
flexibility, recruitment, career progression,
negotiation, career break, leadership,
mentorship and registration. These key areas
align with the themes explored in and emerged
from the focus groups and offer core areas that
deserve attention when considering the future
of architecture profession in New Zealand.
The following sections of this report include
specific recommendations for NZRAB, NZIA,
Schools of Architecture and options for future
research to expand this discussion.
This research has provided new data and
insights on the progression of graduates in the
architecture profession and identified areas for
further research by architecture academics
working with the profession. These include the
following broad topics:
▪ In light of the focus group discussions and
with reference to the research context,
further focus groups could be run to gain a
broader representation of graduates (by
increasing numbers). Some highlighted
issues from the focus groups that could be
given specific attention are the definitions of
‘architecture’ and ‘architect’ and the impacts
and value of mentorship and collaboration.
▪ Understanding what teaching pedagogies and
approaches could be more effective to
increase the preparedness of graduates at
the end of their university journey (e.g.
adopting ‘live projects’ model, increasing the

Architecture Graduate progression to Practice in New Zealand: 1987-2018
80
level of multi-disciplinarity of university
courses, especially design courses, etc.).
▪ Little research has been undertaken
specifically about career paths of Australian
and New Zealand graduates, so there is little
data on graduate destinations outside of the
formal profession architecture.
9.1. Recommendations for the NZRAB
▪ As definitions of ‘architecture’ and ‘architect’
are evolving, there is a need to engage more
publically in this conversation under the key
areas described by the Parlour Guides to
Equitable Practice, as outlined in the
introduction of this chapter.
▪ Focus group participants in this study
identified that support and mentoring for
those seeking registration, and for women
generally, could be more vigorous and
flexible.
▪ Engage with industry and government
towards identifying future demand for
architects in New Zealand, taking into
account pending retirements in the
profession and to better drawn on the large
pool of New Zealand architecture graduates
currently not pursuing careers in the formal
profession.
9.2. Recommendations for the NZIA
▪ Continue to promote with members and
especially practices, ways to put into place
mentorships, and liaise with the NZRAB over
the registration process.
▪ It was identified from the focus groups that
there is a lack of public knowledge around
the roles of an architect and the value that
an architect has (over other built
environment designers or technicians). With
this in mind, there is a need for public
education about these definitions, to better
inform the public and clients of the value of
an architect.
▪ Further to the above, as the architecture
profession evolves and diversifies, there is a
need for better acknowledgement of the full
range of architecture roles, outside of
traditional practice, especially as the nature
of practice evolves over the next decade.
▪ Participants in the focus groups expressed
perceptions of unequal value placed on
registration over many other valuable roles
played by non-Architect members in the
profession. This was noted in the previous
study (Haarhoff, 2010) and there remains a
case for better nurturing of non-Architect
members who may not seek registration and
creating recognition that gives higher status
to the roles they play, and making such roles
worthy goals in themselves.
▪ The remuneration and gender pay gaps of
architects when compared to other built
environment professions is a growing
concern that needs more attention in order
to retain graduates in the architectural
profession.
9.3. Recommendations for Practices
▪ Maximise opportunities for mentoring
employees to progress their careers in
directions they identify.
▪ Maximise opportunities for more flexibility in
the way practices work and breaking the

9. Conclusions and recommendations
81
historic idea that long hours are measures of
loyalty and worthiness.
▪ Working with the NZIA through the NZIA
Council and local Branches to explore the
issues identified and helping to find new
pathways.
9.4. Recommendations for the Schools of
Architecture in New Zealand
▪ Investigating the roles of graduates who do
not pursue career in the formal profession
and recognising that the qualifications and
curricula offered may need to be better
aligned with the range of career pathways
pursued, especially over future years.
▪ The focus group participants highlighted a
perceived disconnect between architectural
education and practice, with one not being
always fully representative of the other. With
this in mind, Schools of Architecture could
look to better align themselves with practice,
for example through suggestions offered in
the focus groups of ‘live projects’, more
problem-based examples and providing
better education on the realities of practice
and their multiple interconnected aspects
and disciplines. An increased community
engagement and involvement of industry
stakeholders across architecture
programmes could also help students find
their specialisation and interest in the
architecture sector much in advance.
▪ Working on activities supporting the
development of soft skills amongst students,
particularly regarding communication, team-
work, self-awareness and leadership. Soft
skills are an important component of a
successful career in architecture and can
help improve graduates’ employability, in
addition of their agency within the
architecture sector and architecture
practices.
▪ An increasingly urgent point of reflection for
Schools of Architecture is the offer of online
architecture education and the extent to
which distant learning can meet the
Architecture Program Accreditation
Procedure and the delivery of the AACA’s
National Standard of Competency for
Architects (Architects Accreditation Council
of Australia, 2020), while retaining teaching
and learning quality. The urgent need to
ensure teaching continuity during the Covid-
19 lockdown period in New Zealand has
forced all Schools of Architecture to reflect
on limits and opportunities of online
teaching, both synchronous and
asynchronous. It will be interesting to see
what changes, if any, this alternative mode of
delivery will bring to Architecture education
once the emergency will be over.
9.5. General final recommendations
▪ Tracking the progression of architecture
graduates into the practice of architecture
and the affiliation to relevant professional
bodies is important to understand the status
and direction of the profession, as well as to
monitor the presence of gender inequality
and barriers to career advancement.
Considering the difficulties experienced in
this Third and in the previous Surveys in
aligning names between data sets from the
different institutions, and in view of future

Architecture Graduate progression to Practice in New Zealand: 1987-2018
82
studies (also beyond the purposes of this
now recurrent Survey), it is recommended
that the NZIA and NZRAB make an effort in
achieving a consistent approach in collecting
relevant data from their members and
registered professionals, such as asking for
full legal name instead of preferred names.
In addition, asking for gender and ethnicity
information as well would increase data sets
that can be analysed in the future.
▪ The focus groups completed in this research
offered a very useful ‘snapshot’ on changing
perspectives of graduates and registered
architects, highlighting barriers and
challenges perceived by this group of
professionals. These focus groups could be
held by the researchers at shorter intervals,
to collect ongoing feedback from relevant
profiles that can inform activities and
initiatives of the NZIA and NZRAB in the next
future.

References
83
References
Ahuja, S., Nikolova, N., & Clegg, S. (2017). Paradoxical
identity: The changing nature of architectural work and its
relation to architects’ identity. Journal of Professions and
Organization, 4(1), 2-19. https://doi.org/10.1093/jpo/jow013.
Architects Accreditation Council of Australia (2014).
Australia’s architecture sector. Retrieved on January 31st
2020 from http://comparison.aaca.org.au/industry-profile.
Architects Accreditation Council of Australia (2015). AACA
Matrix Analysis: Comparing architect registration
systems. Retrieved on January 31st 2020 from
http://comparison.aaca.org.au/library/aaca_comparative_
analysis.pdf.
Architects Accreditation Council of Australia (2018).
Architectural Education and the Profession in Australia
and New Zealand. Retrieved on January 31st 2020 from
https://www.aaca.org.au/wp-
content/uploads/Architectural-Education-and-the-
Profession-Study-Research-Plan-1.pdf.
Architects Accreditation Council of Australia (2019). AACA
Paper – August 2019 Online Architecture Education and
the Australian context Introduction. Retrieved on January
31st 2020 from https://www.aaca.org.au/wp-
content/uploads/Online-Architecture-Education-
Paper.pdf.
Architects Accreditation Council of Australia (2020).
National Standard of Competency for Architects.
Retrieved on April 1st 2020 from
https://www.competencystandardforarchitects.aaca.org.a
u.
Arieff, A. (2018). Where are all the female architects?
Retrieved on January 31st 2019 from
https://www.nytimes.com/2018/12/15/opinion/sunday/wom
en-architects.html.
Barton, G. (2015). Architecture: Teaching the Future /
Future of Teaching. In Proceedings of the 3rd International
Conference for Design Education Researchers, pp.347-
365.
Brown, R., & Moreau Yates, D. (2000). Seeing the world
through another person’s eyes. In D. Nicol & S. Pilling
(Eds.), Changing Architectural Education: Towards a New
Professionalism (pp. 49–57). New York: Taylor & Francis.
Campbell, V. (2019). Not Just Jane Jacobs: An Exploration
of Gender Discrimination in Architecture and Urbanism.
Retrieved on November 12th 2019, from
https://www.4cities.eu/not-just-jane-jacobs-an-
exploration-of-gender-discrimination-in-architecture-
and-urbanism/.
Carpenter, W. J., & Hoffman, D. (1997). Learning by
building: design and construction in architectural
education. New York: Van Nostrand Reinhold.
Clark, J. (2015). Parlour Guides to Equitable Practice.
Retrieved January 21st 2020 from
https://archiparlour.org/parlour-guides/.
Clark, J. (2016). Six Myths about Women in Architecture. In
Benedict Brown, J., Harriss, H., Morrow, R, & Soane, J.
(Eds.). A Gendered Profession. London, UK: RIBA
Publishing.
Padavic, I., Ely, J. R., & Reid, E. M. (2020). What’s Really
Holding Women Back? Administrative Science Quarterly,
65(1), 61-111. https://doi.org/10.1177/0001839219832310.
Etherington, R. (2011). Will architects exist in 2025? - RIBA
Building Futures. Retrieved November 22nd 2019, from
https://www.dezeen.com/2011/03/07/will-architects-
exist-in-2025-riba-building-futures/.
Fisher, A. (2000). Developing skills with people: a vital
part of architectural education. In D. Nicol & S. Pilling
(Eds.), Changing Architectural Education: Towards a New
Professionalism (pp. 137–144). New York: Taylor & Francis.
Gamolina, J. (2018). Stop asking where all the female
architects are; we right here. Retrieved on December 21st
2019 from https://archpaper.com/2018/12/madame-
architect-op-ed.
Haarhoff, E. (2001). Women and the Architecture
Profession in New Zealand: A survey of Architecture
Graduates 1987-1999. Report prepared for the AERB.
Auckland, Auckland UniServices Ltd.
Haarhoff, E. (2010). Practice and gender in architecture: A
survey of New Zealand architecture graduates 1987-2008.

Architecture Graduate progression to Practice in New Zealand: 1987-2018
84
Report. Auckland, School of Architecture and Planning,
The University of Auckland.
Harriss, D. H., & Widder, L. (2014). Architecture live
projects: Pedagogy into practice. London: Routledge.
https://doi.org/10.4324/9781315780764.
Harriss, H. (2015). Architecture Live Projects: acquiring
and applying missing practice-ready skills. PhD Thesis
discussed at the Oxford Brookes University. Retrieved on
January 31st 2020 from
http://researchonline.rca.ac.uk/2225/.
Heynen, H. (2012). Genius, gender and architecture: The
star system as exemplified in the Pritzker Prize.
Architectural Theory Review, 17(2–3), 331–345.
https://doi.org/10.1080/13264826.2012.727443.
Hochstein, G. (2017). Gender and Architectural Practice In
NZ. Retrieved on November 12th 2019 from
https://www.architecturewomen.org.nz/archives/gender-
and-architectural-practice-nz-gina-hochstein.
Jamieson, C., Robinson, D., Worthington, J. & Cole, C.
(2011). The future for Architects? Project Report. London:
Institute of British Architects. Retrieved on November 12th
2019 from
http://ualresearchonline.arts.ac.uk/8856/1/The_Future_for
_Architects_Full_Report_2.pdf.
Lange, T., & Scott, E. E. (2017). Making Trouble to Stay With:
Architecture and Feminist Pedagogies. FIELD2017
Becoming a Feminist Architect, 7(1), 89-100.
Loseby, K. (2019). Diversity Inside and Out. Architecture
and Design. Retrieved on July 1st 2019
https://www.architectureanddesign.com.au/features/feat
ures-articles/diversity-inside-and-out.
Matthewson, G. (2012). Architect Barbie through the
Looking Glass: Gender, identity and architecture. In K.
Stuart, A. Chatterjee & S. Loo, Fabulation: Myth, Nature,
Proceedings of the 29th Annual SAHANZ conference,
pp.707-720.
Matthewson, G. (2014). Women in Architecture: who
counts? Architecture AU, Accessed on November 3rd 2014
from https://architectureau.com/articles/counting-
women/.
Matthewson, G. (2016). Architects in SA - a view from the
APBSA data. Adelaide, SA, Australia: Association of
Consulting Architects.
Matthewson, G. (2017). Thinking Through Creative Merit
and Gender Bias in Architecture. FIELD2017 Becoming a
Feminist Architect, 7(1), 163-174.
Matthewson, G. (2018). Parlour Census Report 2001-2016:
Women in Architecture in Australia. Retrieved from
https://archiparlour.org/wp-
content/uploads/2018/11/Parlour_Census_Report_Final2.pd
f.
Naidoo, K (2016). Women in Architecture. Journal of the
KwaZulu-Natal region of the South African Institute of
Architects, 2(41), 1-19.
New Zealand Institute of Architects (n.d.-a). What does an
architect do? Retrieved on November 28th 2019 from
https://www.nzia.co.nz/connect/working-with-an-
architect/what-does-an-architect-do.
New Zealand Institute of Architects (n.d.-b). Who we are.
Retrieved on November 28th 2019 from
https://www.nzia.co.nz/about-us/who-we-are.
New Zealand Institute of Architects (2018). Architects and
engineers confront their gender problem. Retrieved on
April 12th 2018 from
https://www.nzia.co.nz/explore/news/2018/architects-
and-engineers-confront-their-gender-problem.
New Zealand Registered Architects Board (2004). FACT
SHEET: Using the title “architect”. Retrieved on November
12th 2019 from https://www.nzrab.nz/c/Advice-for-recent-
graduates/__6C91E.
Olsen, S. (1994). ‘Diversity: Architecture doesn’t look much
like America’, Architectural Record. 182(11), 25.
Omoyeni, F. et al. (2019). Besides Zaha or Adenowo:
Investigating the Visibility status of Female Architects as
role models for students of architecture. International
Journal of Innovative Technology and Exploring
Engineering, 8(9), 400–407.
Pitts, A., Sheng, R., Evenhouse, E., & Hu, R. (2015). EQxD -
Equity in Architecture Survey Final Report 2014. Retrieved
on November 12th 2019 from
https://issuu.com/rsheng2/docs/equityinarch2014_finalrep
ort.

References
85
Pretty, A., & McPherson, P. (2017). Encountering the
pedagogy of live and interactive architectural projects.
The Journal of Public Space, 2, 63.
https://doi.org/10.5204/jps.v2i3.114.
Quintal, B. (2016). 121 Definitions of Architecture. Retrieved
on December 6th 2019 from
https://www.archdaily.com/773971/architecture-is-121-
definitions-of-architecture.
Reimer, S. (2016). ‘It’s just a very male industry’: gender
and work in UK design agencies. Gender, Place and
Culture, 23(7), 1033–1046.
https://doi.org/10.1080/0966369X.2015.1073704.
Sara, R. (2000). Introducing clients and users to the studio
project: a case study of a “live” project. In D. Nicol & S.
Pilling (Eds.), Changing Architectural Education: Towards
a New Professionalism (pp. 71–83). New York: Taylor &
Francis.
Simmons, L. (2014). Let’s look at the numbers,
Architecture NZ, 4, 33-34.
Simmons, L. (2019). Opinion: Making room. Retrieved on
January 17th 2020 from
https://architecturenow.co.nz/articles/opinion-making-
room/.
Stats NZ (2018). Population. Retrieved on February 20th
2020 from https://www.stats.govt.nz/topics/population.
Stats NZ (2019). Māori population estimates: Mean year
ended 31 December 2018. Retrieved on February 20th 2020
from https://www.stats.govt.nz/information-
releases/maori-population-estimates-mean-year-ended-
31-december-2018.
Stats NZ (2020). 2018 Census totals by topic – national
highlights (updated). Retrieved on February 20th 2020
from https://www.stats.govt.nz/information-
releases/2018-census-totals-by-topic-national-
highlights-updated.
Stead, N., Matthewson, G., Clark, J., & Burns, K. (2017).
Parlour: The First Five Years. FIELD2017 Becoming a
Feminist Architect, 7(1), 143-162.
Strang, E. (2018). Where are the women in architecture
going? Retrieved on November 12th 2019 from
https://idealog.co.nz/design/2018/03/where-are-women-
architecture-going.
Sutton, S. E. (2014). Reality-based learning in design
education. In C. J. Bell (Ed.), Space Unveiled: Invisible
Cultures in the Design Studio (pp. 102–112). New York:
Routledge.
Thompson, J. (2016). Becoming an Architect: Narratives of
Architectural Education. PhD thesis discussed at the
University of Washington. Retrieved on December 6th 2019
from
https://digital.lib.washington.edu/researchworks/handle/1
773/38079.
Waldrep, L. W. (2014). Becoming an Architect: A Guide to
Careers in Design. Hoboken, NJ: John Wiley & Sons.
WERK. (2019). The Future Is Flexible: The Importance of
Flexibility in The Modern Workplace. Retrieved on
November 6th 2019 from
https://werk.co/documents/The%20Future%20is%20Flexib
le%20-%20Werk%20Flexibility%20Study.pdf.

Architecture Graduate progression to Practice in New Zealand: 1987-2018
86

List of figures
87
List of figures
Figure 1. Number of professional architecture
graduates by year of completion at The
University of Auckland, Victoria University of
Wellington and Unitec, and the total number of
graduates in the period 1987-2018. .......................21
Figure 2. Annual numbers of graduates by
ethnic group 2009 to 2018. ......................................24
Figure 3. Total number of graduates 1987-2018,
and the number from each graduating year
cohort who were registered at the end of 2018.
......................................................................................... 30
Figure 4. Percentage of each graduating cohort
registered at the time of Survey (n=1,019). ..........31
Figure 5. Frequency distribution, by percentage,
of the number of years between graduation and
registration (n=1,019). ................................................ 32
Figure 6. Percentage distribution of graduates
who report their practice location by NZIA
Regions (n=754). ......................................................... 33
Figure 7. Percentage distribution of reporting
graduates in each region by graduating
programme source (n=754). ...................................34
Figure 8. Comparison of NZIA membership
numbers by category with membership derived
from among the graduates in the Survey
(n=1,705). ....................................................................... 39
Figure 9. Distribution of the number of NZIA
Affiliate, Student, Graduate, Architects and
Allied Professional Membership by year cohort
1987-2018 (n=1,891). Note: the figure excludes
Academics (8 members). .........................................42
Figure 10. Percentage distribution of NZIA
Affiliate, Student, Graduate, Architects and
Allied Professional Membership by year cohort
1987-2018 (n=1,891)..................................................... 43
Figure 11. Distribution of numbers by graduating
cohort years for NZIA Architects and NZRAB
(n=1,642). ....................................................................... 44
Figure 12. Percentage of male and female
graduates in each graduating cohort 1987 to
2018. (n=4814). ............................................................. 50
Figure 13. Number of male and female
graduates, and the total by year: 1987 to 2018. 50
Figure 14. Percentage of female graduates in
each graduating cohort from 1987 to 2018 by
Architecture School. .................................................. 51
Figure 15. Registration numbers by graduating
year cohort, for men, women and the total 1987-
2018. ............................................................................... 54
Figure 16. Percentage of males and females who
were registered at the time of survey by
graduating year (n=1,023). ....................................... 54
Figure 17. Number of graduates who held
membership of the NZIA (except Retired
members) by year of graduation. ......................... 58
Figure 18. Number of Architect Members of the
NZIA by graduating cohort year and gender. .... 59
Figure 19. Number of Graduate, Student, Allied
Professional, Affiliate and Academic Members
combined and Architect Members, by year and
gender. .......................................................................... 59
Figure 20. The ages of focus group participants.
......................................................................................... 63
Figure 21. The ethnicities of focus group
participants. ................................................................ 63

Architecture Graduate progression to Practice in New Zealand: 1987-2018
88
Figure 22. Current roles undertaken by focus
group participants. .................................................... 64
Figure 23. Type of work undertaken by focus
group participants. .................................................... 64
Figure 24. Size of the practice where
participants worked in a firm................................. 64
Figure 25. The institutions where focus group
participants studied for their first degree. ........ 65
Figure 26. The institutions where focus group
participants studied for their second degree. ... 65

List of tables
89
List of tables
Table 1 - Graduate numbers and the number of
graduates per 1,000 people in New Zealand in
1998, 2008 and 2018. ................................................... 19
Table 2. Number of graduates from professional
architecture programmes in New Zealand from
1987 to 2018. ................................................................. 20
Table 3. Ethnicity of graduates 2009 to 2018. .... 23
Table 4. Number of graduates by cohort year
and the number and percentage who are
Registered Architects. .............................................. 29
Table 5. NZIA categories of membership (Source:
New Zealand Institute of Architects). .................. 38
Table 6. Numbers of NZIA members by category
(end of 2018) (Source: New Zealand Institute of
Architects). ................................................................... 38
Table 7. NZIA active membership compared to
membership among the surveyed graduates
(2018). ............................................................................ 39
Table 8. Comparison of total NZIA Membership
numbers across the three surveys. ..................... 39
Table 9. Gender distribution of NZIA membership
by category (2018). (Source: New Zealand
Institute of Architects). Note: Percentages as
given in the 2018 NZIA Annual Report do not all
total 100 per cent because of non-specified
gender. ......................................................................... 48
Table 10. Number and percentage of male and
female graduates by year: 1987 to 2018. ............. 49
Table 11. Percentage of women and men
graduating in decade periods.................................50
Table 12. Total number graduates by graduating
year cohort, those registered and the
percentage, and of those registered, the number
and percentage of males and females. .............. 53
Table 13. Comparison of all registered Architects
with those registered from among the graduates
1987-2018 (all percentages rounded to whole
numbers). ..................................................................... 56
Table 14. Membership of the NZIA, by category,
year of graduation and gender, 2008 (Source:
New Zealand Institute of Architects). .................. 57

Architecture Graduate progression to Practice in New Zealand: 1987-2018
90

The Future Cities Research Hub brings together researchers at the School of Architecture and Planning of The University of Auckland, addressing different disciplines concerned with the built environment and their multiple interfaces with the natural environment. The aim of the Hub is to better understand the complexities of cities across the building, neighbourhood and urban scales, as well as the challenges of ecosystems during and after urbanisation, in order to find innovative solutions to address built and natural environments’ challenges and contributing to the achievement of national, regional and global sustainable develop-ment goals and plans.
ERROL HAARHOFF is Emeritus Professor of Architecture in the School of Architecture and Planning at the University of Auck-land. He holds qualifications in Architecture and Urban Design, and a PhD in Urban Planning. He has twice served as Head of School and as Associate Dean (Research), and for over a decade has been responsible for the Master of Urban Design programme, and teaching urban design theory and the urban design studios. He is the co-founder of the Future Cities Research Hub and the inaugural co-director. He has led a number of research initiatives concerned with urban design and higher density housing and, most recently, a �2.5M National Science Challenge 11 multi-institutional research project ‘Shaping Places: Future Neighbourhoods’. This has involved assessments of design approaches to living at higher density, and post-oc-cupancy evaluations of higher density living.
PAOLA BOARIN is Senior Lecturer of Architectural Technology in the School of Architecture and Planning at the University of Auckland where she is the Architecture Technology and Sustainability Stream Leader and the past Faculty Associate Dean Teaching and Learning. Together with Errol Haarhoff, she is the co-founder and inaugural co-director of the Future Cities Research Hub. Her research addresses the links between architecture, technology and environment, with a focus on sustain-able conservation, adaptation and retrofit of existing and heritage buildings, sustainable and regenerative design, and post-occupancy evaluation of buildings and neighbourhoods.
NATALIE ALLEN is an urban researcher and strategist. With a background in architecture and a PhD in urban design, she values thinking across all scales of design. She specialises in medium density housing research, spatial planning and design advice focussed on the relationships between delivering urban intensification and maintaining or enhancing the liveability experienced by residents. She works alongside industry providers in both the public and private sectors who are interested in seeking out new ways of thinking about the development of neighbourhoods. Natalie also lectures as an Adjunct Senior Lecturer in the School of Architecture at The University of Auckland.