Embed Size (px)
Citation preview

ARCHIE: A User-Focused Framework for TestingAugmented Reality Applications in the WildSarah M. Lehman*
Temple UniversityHaibin Ling†
Stony Brook UniversityChiu C. Tan‡
Temple University
ABSTRACT
In this paper, we present ARCHIE, a framework for testing aug-mented reality applications in the wild. ARCHIE collects user feed-back and system state data in situ to help developers identify anddebug issues important to testers. It also supports testing of multipleapplication versions (called “profiles”) in a single evaluation session,prioritizing those versions which the tester finds more appealing.To evaluate ARCHIE, we implemented four distinct test case ap-plications and used these applications to examine the performanceoverhead and context switching cost of incorporating our frame-work into a pre-existing code base. With these, we demonstrate thatARCHIE provides no significant overhead for AR applications, andintroduces at most 2% processing overhead when switching amonglarge groups of testable profiles.
Index Terms: Software and its engineering—Software testing anddebugging; Human-centered computing—User interface toolkits;Human-centered computing—Mixed / augmented reality
1 INTRODUCTION
Augmented reality (AR) applications are increasing in popularity,with applications moving beyond just gaming to fields such as health-care [46, 59, 70], education [50, 82, 85], manufacturing [41, 61, 65],and so on. On mobile application marketplaces, AR apps for enter-tainment [12, 24, 27], measurement [3, 4], translation [11, 16], andmore are reaching millions and hundreds of millions of downloads.While augmented reality systems have been around since the early1990s [66], the current rise in popularity is due to two reasons. Thefirst reason is the hardware able to support AR is relatively inexpen-sive and widely available. The market niche originally dominatedby bulky and expensive head-mounted displays (HMDs) such asGoogle Glass [8], Microsoft Hololens [15], and Oculus Rift [19] isnow being filled by conventional smartphones, particularly whenpaired with inexpensive headsets such as Google Cardboard [9].Even older devices such as the Google Nexus 5, originally releasedin 2013 [14], are able to download an AR app as easily as a regularsmartphone app.
The second reason is that AR-specific development kits (such asGoogle’s ARCore for Android [10] and Apple’s ARKit for iOS [2])and integrated development environments (such as Unity3D [32]with Vuforia [36]) have made it easier for developers to build ARapps without specialized knowledge of machine learning, computervision, or graphics. Developers who desire greater control overtheir systems can make use of computer vision libraries such asTensorFlow [29] or OpenCV [21] to create even more powerfulapplications.
However, the current AR software development landscape is lack-ing any software tools to test and debug AR apps. AR apps are
*e-mail: [email protected]†e-mail: [email protected]‡e-mail: [email protected]
different from conventional apps in that the augmented images andlabels are generated and positioned based on the user’s behaviorand environment. For example, a navigation app like Google MapsAR [37] will need to determine the user’s context from their position,facing direction, and visible entities in their environment to deter-mine what directions to place on the screen and where. This makesAR applications very difficult to test in the wild due to high vari-ability of user behavior and environmental factors. User movementspeed, weather, lighting, presence and movement of bystanders, andmany other factors all contribute to the performance of an AR sys-tem. However, traditional software engineering practices such asthe creation and automation of unit tests are ill-equipped to captureand recreate these conditions, as the test writers would be unableto predict which combinations and interactions of conditions a userwould encounter. Similarly, because these conditions are likely tooccur in tandem, logic to handle one set of conditions is likely tointerfere with the logic for another set, making regression testingdifficult as well. Once the evaluations are over, even with detailedinterviews or questionnaires filled out by the testers, it is impossibleto know what underlying errors in the system caused the observableissue. For example, incorrect label placement in an AR navigationapp could be due to a lag in the output generation or an error in theplacement logic.
To help address these needs, we present ARCHIE, theAugmented Reality Computer-Human Interaction Evaluatorframework, specifically designed to help AR application developerswith system testing and the collection of feedback and debuggingdata. Our framework makes the following contributions:
• Identifying performance and usability issues in the wild.ARCHIE collects performance and usability feedback fromtesters using a smartwatch-based companion app. Feedback isgathered after specific system events to verify positive results(such as identifying an AR target), and after periods of inac-tivity to verify negative results (such as failing to identify atarget). Testers are also able to identify any specific issues theyobserve (such as slow output, poor output placement, etc.)
• Recreating and debugging run-time errors. When testerssubmit poor performance or usability feedback, it is importantto understand what underlying errors caused that poor feed-back. ARCHIE aggregates environmental and system statedata during run-time, and provides collections of that data foreach instance of poor feedback submitted by the tester. Devel-opers can then query that data, or feed it to the app back in thelab to identify and debug system errors.
• Testing multiple implementations. ARCHIE also allows de-velopers to implement multiple logical modules, called profiles,which can be used to compare different functional options foran application, such as user interfaces or event recognition.ARCHIE instantiates these profiles at run-time, and interleavesthem for the tester, collecting dedicated feedback for each one.
The rest of the paper is organized as follows: Section 2 providesan overview of current issues facing AR application testers and theevaluation methods they employ. Section 3 describes the design

(a) Classifier error generates wrong warn-ing text
(b) Slow processing, quick user movementprevents classification
(c) Poor label placement covers pertinentreal-world content (car in intersection)
(d) Alert correctly placed but difficult toread due to poor color choice
Figure 1: Conditions that may negatively impact users’ experience of ”distracted pedestrian” AR application.
(a) Length of evaluation (b) Evaluation method * (c) Size of test group
Figure 2: Evaluation trends of surveyed AR systems. Figures marked with asterisks (*) show papers which fall into multiple categories.
of ARCHIE, and Section 4 describes how developers and testersinteract with ARCHIE. Sections 5 and 6 evaluates our solution, anddiscusses how to extend ARCHIE to support virtual reality (VR)app testing respectively. Section 7 discusses the related work, andSection 8 concludes.
2 OBSERVATIONS OF REAL-WORLD TESTING PRACTICES
An AR app has some common errors that are difficult to detect usingconventional software engineering testing. To illustrate, consider anAR app for smartphones that seeks to warn distracted pedestrianswhen they might be walking into an intersection, such as the oneshown in Figure 1.
The first kind of error are classification errors, as seen in Figure1a. These are errors that result in incorrect label or image to bedisplayed. The causes of classification error can be due to themismatch between the training and testing data sets used in thelab, and the actual visual inputs encountered in the wild. Somecontributors to classification errors include environmental conditionssuch as poor light and viewing angle, as well as intra-class variations(such as different breeds of the same animal or different models ofthe same car). Because AR systems are subject to user movement,classification errors can also occur when the tester is moving tooquickly to get a clear image of the target (such as Figure 1b). As itis impossible to train a classifier for every variation of inputs that itmay receive, or to control exactly the movement and behavior of theuser, classification errors are very common for AR systems.
The second kind of error are placement errors. Placement errorsoccur when the system has correctly classified the visual input, butplaces the label or image output in an inappropriate location onthe display. This kind of error has the potential to be dangerousto testers, as they can affect the tester’s safety in the real world.For example, Figure 1c shows how the stop sign can be correctlyidentified, but the warning label blocks the tester’s view of thevehicle in the intersection.
The third kind of error are resource limitation errors. These are
errors that are caused by insufficient resources (e.g. CPU, RAM, etc.)in the underlying system. It is possible for resource limitation errorsto contribute to a classification or placement error. For example,the classification error shown in Figure 1b may be due to a slowsampling rate from the device camera, or insufficient resources toprocess the input in time.
The fourth kind of error are style errors. Style errors occur whenthe system classifies input and generates output correctly, and placesthe output in an appropriate location, but presents the output in aninappropriate way. For example, in Figure 1d, the warning label forthe stop sign is placed above the intersection, but the white text isunreadable against the bright sky.
Environment System Function Sources
Lab
Label display [69, 79, 80]Label placement [54, 63, 75]UI comparison [44, 64]
Interaction [39, 43, 48, 60, 74]Avatars [52, 78, 84]
Wild Label display [40, 58, 77]Interaction [45, 86]
Table 1: System functions targeted by surveyed AR systems
2.1 Survey of Feedback MethodsTo understand how AR researchers handle testing errors, we con-ducted a survey of recent AR related papers. We first identified thehigh level system function being tested. We then categorized papersby whether the project was tested in the lab or in the wild, the lengthof the evaluation, the size of the test group, and primary method ofcollecting tester feedback. The results are presented in Table 1 andFigure 2, and summarized into the following key points.
• Head-mounted displays (HMDs) are a popular testing

platform. The majority of papers surveyed (62%) testedtheir platform either solely on HMDs or supplementing theHMD with a smartphone. A comparatively small number(24%) [40, 45, 60, 64, 86] tested solely on smartphones, while14% [39, 63, 80] tested on a custom platform.
• Questionnaires and interviews are the primary methodsfor gathering feedback from testers. Of the papers surveyed,81% relied solely on questionnaires, interviews, or both to col-lect tester feedback. The remaining papers [39, 63, 77, 80]substituted or supplemented these methods with manual cod-ing, which is the manual review and labeling of data collectedby the system.
• Most tests are conducted in a single sitting with a smallgroup of testers. The bulk of papers surveyed (62%) con-ducted all tester activities within a single day. Of those papers,69% conducted their evaluations with 25 or fewer testers.
• A non-trivial portion of papers explicitly asked testers tocompare user interface (UI) options. More than one thirdof papers surveyed [44, 54, 64, 74, 75, 77, 78, 84] gave testersmultiple UI options to evaluate, and took feedback specificallyon which UI version was preferred for the target scenario.
2.2 Limitations of Existing MethodsFrom this survey, it is clear that questionnaires, interviews, or acombination of both are the method of choice for eliciting feedbackfrom system testers. Unfortunately, these methods suffer from anumber of limitations. The first limitation is that, while question-naires and interviews can be very helpful in identifying whether theissues discussed above (classifier, placement, resource limitation,style) occurred, they are limited in their ability to identify the is-sues’ underlying cause. For example, a tester might indicate in herinterview that the application failed to identify the stop sign, butwould not necessarily be able to tell you why. Was the tester movingtoo quickly for the camera to get a clear picture, such as in Figure1b? Was she viewing the target from too severe of an angle for theclassifier to recognize it? Was the light too low? Was the classifiertoo slow to process the image, and was overridden by earlier orlater inputs? Using questionnaires and interviews alone cannot helpresearchers answer these questions.
The second limitation is that questionnaires and interviews pro-vide no support for recreating error scenarios upon returning to thelab. Subjective, written responses from testers provide no actionabledata to use as input back into the system. Any data sets, systeminputs, or generated outputs must be recreated from scratch in orderto debug the issues reported by testers.
The third limitation is that, when applications are testing multipleGUIs or implementation versions, questionnaires and interviewscannot guarantee that testing conditions for each version are con-sistent. Specifically, if a tester claims to prefer Interface A overInterface B, it is important to verify that the tester’s preference is dueto the differences in interfaces only, and not because of additionalfactors. For example, if the tester only evaluated Interface A duringthe day and Interface B at night, it is possible that the preference wasimpacted by time of day. Utilizing questionnaires and interviews tocompare application versions or UI alternatives cannot provide thiscrucial insight into the testing conditions for each option.
Based on our observations of current testing methods for ARsystems, and the inability of these methods to handle the testingissues discussed above, we designed ARCHIE to (1) collect testerfeedback in situ to assess system performance and usability, (2) col-lect system input and resource consumption data to assist developerdebugging efforts, and (3) facilitate multi-UI testing to support amore consistent tester experience. ARCHIE’s lightweight designallows it to provide these features without impacting the function of
the application under test. The following sections discuss the designof ARCHIE in greater detail.
3 SYSTEM DESIGN
3.1 Framework Architecture
As shown in Figure 3, the ARCHIE framework consists of threeprimary components: the AR application as developed by the exter-nal research team, the ARCHIE annotator helper application, andthe ARCHIE core library. The annotator helper application is alightweight client responsible only for forwarding input requests tothe evaluator, and returning his or her response to the main system.The core library contains the bulk of our framework functionality.Any application wishing to utilize the ARCHIE framework may alsoimplement modules called profiles to represent a distinct UI designpoint for testers to evaluate. A profile could contain logic for input,output, or core event recognition (such as gesture recognition orobject classification).
Figure 3: ARCHIE framework system architecture
An AR application-under-test (AUT) interactions with the corelibrary by passing a configuration file on start-up to the ARCHIEController, the primary interface point between testable applicationsand the rest of the framework. The configuration file should mini-mally contain the list of input, output, and core event recognitionprofiles the framework is expected to utilize during the test instance.The ARCHIE Controller then instantiates these profiles, raising theappropriate events to connect to input sources, retrieve and pro-cess input data, and communicate the results to the user. Once theconfiguration file settings have been imported and the profile eventhandlers are initialized, the controller is responsible for managingthe profile switching schedule, interfacing with the annotator appli-cation, and monitoring the appropriate device-level resources overthe remainder of the test instance. When the evaluation is complete,ARCHIE generates user feedback and system state output logs forresearchers to review.

Figure 4: Runtime program loop with internal and user-driven data collection events.
Algorithm 1 Profile Scheduler
1: P, LP, T, U, C← configuration file2: if t == 0 then3: for ρ in P do4: Qt(ρ) = IRt = α(ρt)
5: else6: while size(P)> LP do7: for ρ in P do8: IRt = α(ρt)
9: Qt(ρ) = Qt−1(ρ)+( 1U )(IRt −Qt−1(ρ))
10: ρmin←min(Qt(P))11: ρmax←max(Qt(P))12: if diff (ρmax, ρmin)≥C then13: remove(P, ρmin)14: scheduleNextProfile(ρmax)15: while executionTimeRemaining do16: roundRobin(P)
3.2 Profile SchedulingThe straightforward solution for choosing which profile to executenext would be to simply execute each profile in Round Robin order.However, this is not an effective use of a tester’s time, as it couldobligate her to spend a large portion of the trial interfacing withsystem features that may not be applicable or interesting to her.Instead, ARCHIE provides a customized scheduling algorithm thatuses a tester’s feedback data to prioritize the most liked profiles overtime while still collecting the annotation and usability data in whichresearchers are interested.
To implement this algorithm, we utilized a customized solutionfor the Multi-Arm Bandit Problem as shown in Algorithm 1. Wefirst define the reward function for a given data vector collected fromprofile (ρ) at instance (i) within time slice (t) as shown in Equation1. This equation provides a numerical representation of how well thesystem’s event recognition results matched the user’s ground truthlabels, plus the user’s overall likability score at that given moment.Once all the instantaneous rewards have been calculated, the overallreward earned by the profile during the given time slice is calculatedusing Equation 2. It should be noted that both of these equations aresimply default functions provided by ARCHIE, and that researchers
Param Type DescriptionP Collection The set of profiles, classifiers to
be evaluatedLP Integer P min-size constantT Integer Time slice size constantU Float Uncertainty constantC Float Confidence threshold constantt Object Current time slice of size Tρt Collection Set of user response data col-
lected while executing profile ρ
over time slice tIRt Integer Reward received at time t
Qt(ρ) Float Action-value function for profileρ at time t
Table 2: Parameter list for profile scheduler algorithm. Values canbe set in the configuration file for the application-under-test.
wishing to use our framework may provide their own functions thatare better tailored to their specific needs.
A(ρti) =
{1+usrScoreti sysRespti = usrRespti
usrScoreti sysRespti 6= usrRespti(1)
α(ρt) =T
∑i=0
A(ρti) (2)
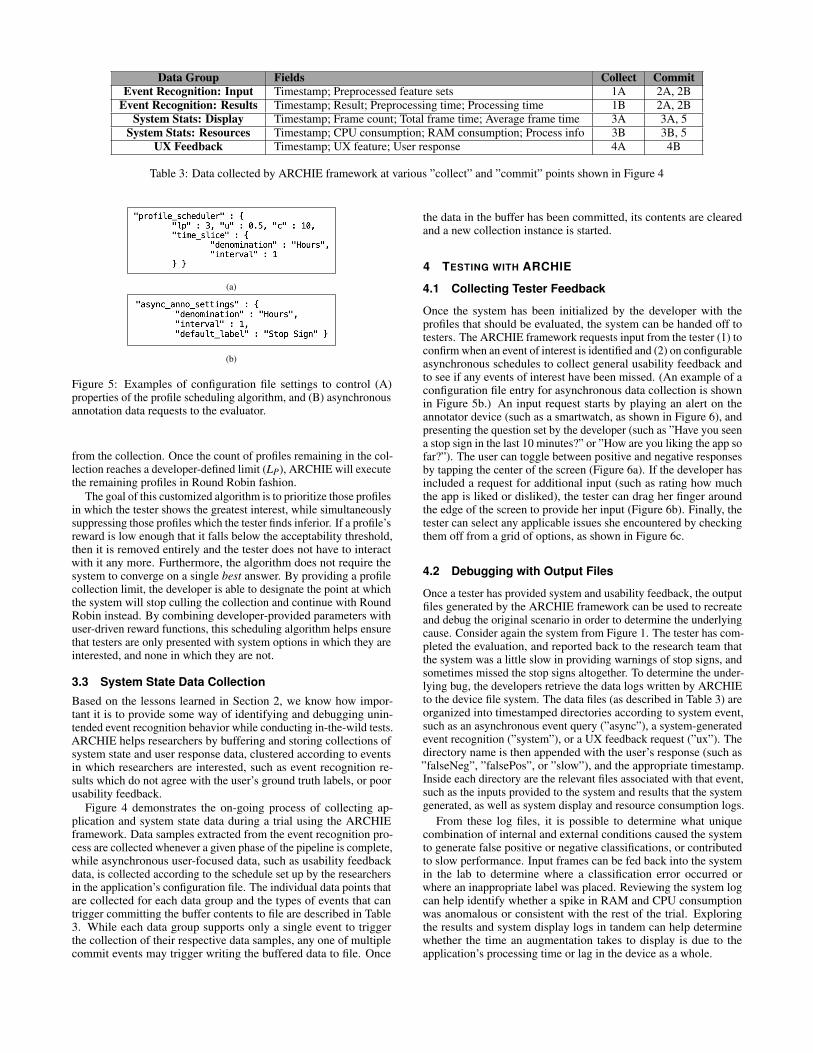
We then customize the traditional upper-confidence-bound solu-tion of the Multi-Arm Bandit Problem, populating the parameters inTable 2 using entries retrieved from the application’s configurationfile, such as those shown in Figure 5a. The algorithm starts withthe entire collection of profiles (P) as listed in the configurationfile and calculates the action-value function (Qt ) for each profile(ρ) at the end of a given time slice (t). Since there is no guaranteethat a user will always give the same feedback for a given profile,the action-value function is calculated in a non-stationary manner,giving greater weight to the most recent reward result for that profile.If the difference between the minimum and maximum action-valuesfor a given time slice falls rises above a developer-defined threshold(C), the profile that earned the minimum score will be eliminated
Data Group Fields Collect CommitEvent Recognition: Input Timestamp; Preprocessed feature sets 1A 2A, 2B
Event Recognition: Results Timestamp; Result; Preprocessing time; Processing time 1B 2A, 2BSystem Stats: Display Timestamp; Frame count; Total frame time; Average frame time 3A 3A, 5
System Stats: Resources Timestamp; CPU consumption; RAM consumption; Process info 3B 3B, 5UX Feedback Timestamp; UX feature; User response 4A 4B
Table 3: Data collected by ARCHIE framework at various ”collect” and ”commit” points shown in Figure 4
(a)
(b)
Figure 5: Examples of configuration file settings to control (A)properties of the profile scheduling algorithm, and (B) asynchronousannotation data requests to the evaluator.
from the collection. Once the count of profiles remaining in the col-lection reaches a developer-defined limit (LP), ARCHIE will executethe remaining profiles in Round Robin fashion.
The goal of this customized algorithm is to prioritize those profilesin which the tester shows the greatest interest, while simultaneouslysuppressing those profiles which the tester finds inferior. If a profile’sreward is low enough that it falls below the acceptability threshold,then it is removed entirely and the tester does not have to interactwith it any more. Furthermore, the algorithm does not require thesystem to converge on a single best answer. By providing a profilecollection limit, the developer is able to designate the point at whichthe system will stop culling the collection and continue with RoundRobin instead. By combining developer-provided parameters withuser-driven reward functions, this scheduling algorithm helps ensurethat testers are only presented with system options in which they areinterested, and none in which they are not.
3.3 System State Data Collection
Based on the lessons learned in Section 2, we know how impor-tant it is to provide some way of identifying and debugging unin-tended event recognition behavior while conducting in-the-wild tests.ARCHIE helps researchers by buffering and storing collections ofsystem state and user response data, clustered according to eventsin which researchers are interested, such as event recognition re-sults which do not agree with the user’s ground truth labels, or poorusability feedback.
Figure 4 demonstrates the on-going process of collecting ap-plication and system state data during a trial using the ARCHIEframework. Data samples extracted from the event recognition pro-cess are collected whenever a given phase of the pipeline is complete,while asynchronous user-focused data, such as usability feedbackdata, is collected according to the schedule set up by the researchersin the application’s configuration file. The individual data points thatare collected for each data group and the types of events that cantrigger committing the buffer contents to file are described in Table3. While each data group supports only a single event to triggerthe collection of their respective data samples, any one of multiplecommit events may trigger writing the buffered data to file. Once
the data in the buffer has been committed, its contents are clearedand a new collection instance is started.
4 TESTING WITH ARCHIE
4.1 Collecting Tester Feedback
Once the system has been initialized by the developer with theprofiles that should be evaluated, the system can be handed off totesters. The ARCHIE framework requests input from the tester (1) toconfirm when an event of interest is identified and (2) on configurableasynchronous schedules to collect general usability feedback andto see if any events of interest have been missed. (An example of aconfiguration file entry for asynchronous data collection is shownin Figure 5b.) An input request starts by playing an alert on theannotator device (such as a smartwatch, as shown in Figure 6), andpresenting the question set by the developer (such as ”Have you seena stop sign in the last 10 minutes?” or ”How are you liking the app sofar?”). The user can toggle between positive and negative responsesby tapping the center of the screen (Figure 6a). If the developer hasincluded a request for additional input (such as rating how muchthe app is liked or disliked), the tester can drag her finger aroundthe edge of the screen to provide her input (Figure 6b). Finally, thetester can select any applicable issues she encountered by checkingthem off from a grid of options, as shown in Figure 6c.
4.2 Debugging with Output Files
Once a tester has provided system and usability feedback, the outputfiles generated by the ARCHIE framework can be used to recreateand debug the original scenario in order to determine the underlyingcause. Consider again the system from Figure 1. The tester has com-pleted the evaluation, and reported back to the research team thatthe system was a little slow in providing warnings of stop signs, andsometimes missed the stop signs altogether. To determine the under-lying bug, the developers retrieve the data logs written by ARCHIEto the device file system. The data files (as described in Table 3) areorganized into timestamped directories according to system event,such as an asynchronous event query (”async”), a system-generatedevent recognition (”system”), or a UX feedback request (”ux”). Thedirectory name is then appended with the user’s response (such as”falseNeg”, ”falsePos”, or ”slow”), and the appropriate timestamp.Inside each directory are the relevant files associated with that event,such as the inputs provided to the system and results that the systemgenerated, as well as system display and resource consumption logs.
From these log files, it is possible to determine what uniquecombination of internal and external conditions caused the systemto generate false positive or negative classifications, or contributedto slow performance. Input frames can be fed back into the systemin the lab to determine where a classification error occurred orwhere an inappropriate label was placed. Reviewing the system logcan help identify whether a spike in RAM and CPU consumptionwas anomalous or consistent with the rest of the trial. Exploringthe results and system display logs in tandem can help determinewhether the time an augmentation takes to display is due to theapplication’s processing time or lag in the device as a whole.

(a) (b) (c)
Figure 6: Tester using ARCHIE annotator to provide feedback: (A) tapping to toggle between affirmative and negative reactions, (B) scrollingalong the edge of the watch to rate her experience, (C) selecting issues she experienced from a grid of options.
(a) TF Classify (b) TF Speech (c) Color Blob Detector (d) DroneTracker
Figure 7: Sample screenshots of the ARCHIE evaluation candidate applications
5 EVALUATIONS
We implemented and evaluated ARCHIE using a Google Pixel 2running Android 8.1.0. We elected to test our framework using asmartphone because it could also double as an HMD when placed inan appropriate head mount. For testing purposes, we are primarilyinterested in the performance impacts when incorporating ARCHIEinto different types of AR applications, to ensure that any negativefeedback a tester may provide is due to the performance of theapplication itself, and not the influence of ARCHIE.
The design for the ARCHIE framework supports the collectionof camera frames, video clips, audio clips, GPS and IMU data assources of input for the data logs. Currently, only support for cameraframe collection has been implemented because it was sufficientto meet the needs of our evaluations. The framework design alsosupports the collection of output camera frames containing the finalaugmented view displayed the user, but was not implemented dueits library-specific (ARKit, Vuforia, etc.) nature. We anticipateadding this functionality to the framework in the future when moreimplementation-agnostic API support becomes available.
5.1 Evaluation Candidates
We used the following four case study applications to evaluateARCHIE: TF Classify, TF Speech, Color Blob Detector, and Drone-Tracker. These applications were chosen to showcase how ourframework integrates with three of the most popular computer vi-sion support libraries in research and industry: TensorFlow [29],OpenCV [21], and Vuforia [36]. Each application was either takenfrom the publicly available sample applications published by thelibrary developers or created as part of a tutorial, and represents a
range of sensor and UI interactions.“TF Classify” [30] (shortened to “TF-C”, shown in Figure
7a) is an image classification application distributed and maintainedby the TensorFlow development team which utilizes preview framesfrom the device’s camera, categorizes the primary subject of theimage, and populates a text box on the phone screen with the resultsin real-time. The camera preview is not manipulated directly; onlythe content of the text box is updated.
“TF Speech” [30] (shortened to “TF-S”, shown in Figure 7b)is another application from TensorFlow which focuses on audioprocessing rather than image processing. Instead of using the camera,it captures audio snippets from the microphone and parses them inorder to identify words it recognizes. The list of known words isdisplayed on the application screen, and when a recognized word isheard, the application will briefly highlight the corresponding boxfor that word on the screen.
“Color Blob Detector” [20] (shortened to “CBD”, shown inFigure 7c) is an application distributed by the OpenCV developmentteam which performs active color processing and boundary detectionon a live camera preview. To detect color blobs, the user mustpress the device screen to select an area of the camera preview thathe or she wishes to match. The application then segments thatportion of the preview frame and identifies the primary color. For allsubsequent preview frames until the user selects a new color blob,boundaries of areas within the preview that match the same primarycolor are detected and highlighted in real-time.
“DroneTracker” (shortened to “DT”, shown in Figure 7d) isan application that we obtained from [13], as there are no formallyrecognized sample applications available for Vuforia. The Drone-Tracker app consists of a dual-target tracking system which displays

(a)
(b)
Figure 8: Impacts to (A) app-level classification time and (B) device-level FPS per case study application before and after incorporatingARCHIE framework
a small sci-fi drone that responds to and follows a target moved bythe user around the screen in real-time.
5.2 Overhead of Incorporating ARCHIEBecause each of the evaluation candidate applications differs innature from its fellows, each one had to be tested differently. TF-C was placed on the edge of a desk, pointed downward at a rugwith a design detailed enough to be confused between two of theclassifier’s known classes. TF-S was laid on the desk next to anactive radio. CBD was placed on the edge of the desk and pointedtoward the rug as well, with a single screen touch by the tester toactive the color blob boundary recognition logic. DT was placedon the edge of a stack of books, overlooking the two targets. Eachapplication was then allowed to run for five trials of five minuteseach, while ARCHIE collected the appropriate system state andapplication output data.
Figures 8 and 9 reflect the impact to UI and system performancerespectively when incorporating the ARCHIE framework into anexisting application. While examining impacts to CPU and RAMconsumption is expected, we also included the UI metrics of displayFPS and time to classify in order to demonstrate how ARCHIE mightimpact the user experience. If refactoring an application resulted inlowered FPS or a dramatically increased classification time, thendevelopers could expect users to experience a decreased quality ofoverall system performance due to delayed or inaccurate systemresponses. However, no ARCHIE case studies showed significantimpacts to FPS or classification time.
Of the performance metrics evaluated, the only case in whichperformance showed a significant hit was when ARCHIE was addedto the TF-Speech app. In this case, user-space CPU utilizationwent up from about 28% to about 40%. We believe that the reasonfor this is due to the extremely simple nature of the original app -meaning that adding ARCHIE introduced a non-trivial amount ofadditional processing. The other apps utilize the camera and some
System Tester Resp. Num. ofFunction Method(s) Eval. Sess.
HM
D
DisplayQuestionnaire + 1 [51]
Interview Unclear [73]Questionnaire 3 [47]
UI comparison Questionnaire + 1 [76]Interview
Interaction
Questionnaire + 1 [57, 81]InterviewQuestionnaire Unclear [49]
Interview 1 [68]Avatar Questionnaire 1 [55]
Smar
tph
one
Interaction Manual coding 3 [38]
Bot
h Display Interview 1 [53]Interaction Questionnaire 1 [71]
Table 4: Expanded survey of contemporary VR systems
degree of image processing (operations which already require a gooddeal of resource consumption), such that introducing the additionalprocessing for ARCHIE was negligible.
5.3 Cost of Switching Profiles
Providing context-switching ability for a collection of profiles andclassifiers is a key contribution of the ARCHIE framework. However,this feature provides no benefit if the cost of context-switching ishigh. Therefore, we ran a series of tests evaluating the CPU andRAM consumption overhead of context-switching for collectionsof profiles ranging in size from one to ten, as reflected in Figure 10.TF-C was used for this evaluation. Five configurations were createdwith various numbers of profiles (one, three, five, seven and ten)for ARCHIE to manage, with each profile representing a distinctinstance of the core image recognition classifier. Each profile wasallowed to execute for one minute before switching to the next; eachconfiguration was executed five times for 25 minutes per execution.
During testing, however, the camera interface would occasion-ally freeze, causing a significant drop in resource consumption untilthe next context switch, at which point the camera preview wouldrefresh and processing began again. Over all of the trials for allconfigurations, only 5% of the records were affected and removed.The results in Figure 10 reflect the aggregated results for the re-maining 95%. At most, resource consumption fluctuates by 2%when considered across five trials of 25 minutes each for each ofthe five test cases. This leads us to conclude that ARCHIE providesno significant overhead when switching between profiles duringevaluations.
6 ADDITIONAL DISCUSSION
Even though ARCHIE was originally designed with AR applicationsin mind, it could easily be adapted to work with virtual reality(VR) applications. We expanded our survey from Section 2 toexamine VR systems as well (results in Table 4), and observedthe following: (1) all evaluations were conducted in the lab onsome combination of smartphones and HMDs, (2) all papers butone [38] used questionnaires and interviews to collect user feedback,and (3) three papers [51, 76, 81] conducted their own explicit UIcomparisons. Based on this, we believe ARCHIE has real potentialfor use in testing VR applications as they move out of the lab andinto the wild. To accommodate this shift, we would need support fornew profiles to monitor motion sickness, and data collection fromnew sensors such as galvanic skin response.

(a) (b) (c)
Figure 9: Consumption of (A) memory, (B) user-space CPU, and (C) kernel-space CPU before and after incorporating ARCHIE frameworkinto application code base. Results averaged over five trials each.
1 3 5 7 100.9
0.91
0.92
0.93
0.94
Avg. M
em
ory
Utiliz
ation
I/O Profiles Core Event Rec. Profiles
(a)
1 3 5 7 100.3
0.32
0.34
0.36
0.38
Avg. U
ser-
space C
PU
Utiliz
ation
I/O Profiles Core Event Rec. Profiles
(b)
1 3 5 7 100.06
0.065
0.07
0.075
Avg. K
ern
el-space C
PU
Utiliz
ation
I/O Profiles Core Event Rec. Profiles
(c)
Figure 10: Impacts to consumption of (A) memory, (B) user-space CPU, and (C) kernel-space CPU when switching between differently sizedcollections of profiles at run-time. Results averaged over five trials each.
7 RELATED WORK
Many tools and frameworks exist to help developers test their mobileAR systems. These testing platforms serve a number of goals, manyof which can be supplemented with ARCHIE.
Commercial testing tools. The increase in commercially avail-able AR hardware and development environments brings with it anincrease in commercial testing tools as well. Oculus provides officialguidelines for performance optimization [35] as well as an arrayof performance monitoring and debugging tools [6, 18, 23, 25] forapplications built for the Rift headset. Microsoft provides its ownofficial guidelines for testing applications built for the HoloLensheadset [31], in addition to a selection of emulators and simula-tors [22, 33, 34] for testing applications with pre-determined inputs.Similarly, Apple’s latest version of ARKit ships with a testing toolcalled ”Reality Composer” [28], which allows developers to recordand replay system inputs for testing. There are also many general-purpose tools available for graphics and systems-level profiling, suchas NVIDIA’s ”Nsight” suite of tools [17], the ”apitrace” tool forOpenGL [1], Android’s system trace CLI tool [5], and Windows pro-filers for system events [7] and DirectX applications [26]. While allof these tools can be helpful during development and initial testingstages, they are generally suitable only for in-lab testing, as theiroperations are quite resource-intensive. ARCHIE can supplementthese efforts by providing additional lightweight support when anapplication has passed code quality testing in the lab and is readyfor user evaluations in the wild.
Quality of Experience (QoE) testing. In addition to commer-cial tools, there has been research aimed at quantifying the qualityof experience (QoE) that a tester might have while using a givenapplication. Papers such as [42, 62, 83] propose frameworks to iden-tify potential system bottlenecks that could adversely affect userexperience. However, what these systems provide is raw data out-
put; it is up to the researcher to determine the point at which theperceived latency for an application operation becomes insufferableto the user. ARCHIE can supplement these testing frameworks byproviding temporally-aligned user feedback data to identify exactlywhen changes in system performance start to impact the user.
Cross-platform testing. Other general-purpose testing tools fo-cus on supporting heterogeneous hardware platforms [72], softwareplatforms [67], and embedded devices [56]. However, these test-ing platforms do not address the user experience component of thetesting process. ARCHIE can supplement cross-platform testingframeworks such as these by presenting users with different imple-mentations of a given interface on a given device in order to identifywhether any issues or preferences exist from a user’s perspectivewhen porting applications to new environments.
8 CONCLUSIONS
In this paper, we presented ARCHIE, the Augmented RealityComputer-Human Interaction Evaluator framework. We demon-strated the prevalence and limitations of using only questionnairesand interviews for testing augmented reality applications in the wild,and showed how our feedback framework can assist developers inidentifying and debugging UX issues with negligible impact to sys-tem performance. In the future, we would like to expand ARCHIEto include more formal usability testing.
ACKNOWLEDGMENTS
This research was supported in part by NSF grants 1618398,1814745, and 2002434.
REFERENCES
[1] apitrace. https://apitrace.github.io. Accessed: 2019-10-22.[2] Apple developer — arkit. https://developer.apple.com/arkit/. Accessed:
2018-09-04.

[3] Ar ruler app - tape measure and camera to plan.https://play.google.com/store/apps/details?id=com.grymala.aruler.Accessed: 2019-10-15.
[4] Camtoplan - ar measurement / tape measure.https://play.google.com/store/apps/details?id=com.tasmanic.camtoplan.Accessed: 2019-10-15.
[5] Capture a system trace on the command line — android develop-ers. https://developer.android.com/studio/profile/systrace/command-line. Accessed: 2019-10-22.
[6] Compositor mirror — oculus documentation.https://developer.oculus.com/documentation/pcsdk/latest/concepts/dg-compositor-mirror/. Accessed: 2019-10-22.
[7] Event tracing - windows applications — microsoft docs.https://docs.microsoft.com/en-us/windows/win32/etw/event-tracing-portal. Accessed: 2019-10-22.
[8] Glass. https://www.x.company/glass/. Accessed: 2019-10-15.[9] Google cardboard - google vr. https://arvr.google.com/cardboard/.
Accessed: 2019-10-15.[10] Google developers — arcore. https://developers.google.com/ar/. Ac-
cessed: 2018-09-04.[11] Google translate. https://play.google.com/store/apps/details?id=
com.google.android.apps.translatehl=en. Accessed: 2019-10-15.[12] Ingress prime. https://play.google.com/store/apps/details?id=
com.nianticproject.ingress. Accessed: 2018-09-04.[13] Knights of unity — vuforia ar tutorial.
http://blog.theknightsofunity.com/unity-vuforia-guide/. Accessed:2018-09-20.
[14] Lg nexus 5 — newegg. https://www.newegg.com/p/23B-000F-00110.Accessed: 2019-10-15.
[15] Microsoft hololens — mixed reality for business.https://www.microsoft.com/en-us/hololens. Accessed: 2019-10-15.
[16] Mondly. https://play.google.com/store/apps/details?id=com.atistudios.mondly.languages. Accessed: 2019-10-15.
[17] Nvidia nsight systems — nvidia developer.https://developer.nvidia.com/nsight-systems. Accessed: 2019-10-22.
[18] Oculus debug tool — oculus documentation.https://developer.oculus.com/documentation/pcsdk/latest/concepts/dg-debug-tool/. Accessed: 2019-10-22.
[19] Oculus rift. https://www.oculus.com/rift. Accessed: 2019-10-15.[20] Opencv - android - color blob detection.
https://github.com/opencv/opencv/tree/master/ samples/android/color-blob-detection. Accessed: 2018-09-20.
[21] Opencv library. https://opencv.org. Accessed: 2018-09-26.[22] Perception simulation - mixed reality — microsoft docs.
https://docs.microsoft.com/en-us/windows/mixed-reality/perception-simulation. Accessed: 2019-10-22.
[23] Performance heads-up display — oculus documentation.https://developer.oculus.com/documentation/pcsdk/latest/concepts/dg-hud/. Accessed: 2019-10-22.
[24] Pokemon go. www.pokemon.com/us/pokemon-video-games/pokemon-go/. Accessed: 2018-09-04.
[25] Profiler tool reference — unreal engine doc-umentation. https://docs.unrealengine.com/en-US/Engine/Performance/Profiler/index.html. Accessed: 2019-10-22.
[26] Profiling directx apps - windows applications — microsoft docs.https://docs.microsoft.com/en-us/windows/win32/direct2d/profiling-directx-applications. Accessed: 2019-10-22.
[27] Quiver - 3d coloring app. https://play.google.com/store/apps/details?id=com.puteko.colarmix. Accessed: 2018-09-04.
[28] Reality composer - augmented reality - apple developer.https://developer.apple.com/augmented-reality/reality-composer/.Accessed: 2019-10-22.
[29] Tensorflow — open-source machine learning framework.https://www.tensorflow.org. Accessed: 2018-09-04.
[30] Tensorflow android camera demo.https://github.com/tensorflow/tensorflow/tree/ master/tensorflow/ex-amples/android. Accessed: 2018-09-20.
[31] Testing your app on hololens - mixed reality — microsoftdocs. https://docs.microsoft.com/en-us/windows/mixed-reality/testing-
your-app-on-hololens. Accessed: 2019-10-22.[32] Unity3d game engine. www.unity3d.com. Accessed: 2018-09-04.[33] Using the hololens emulator - mixed reality — microsoft
docs. https://docs.microsoft.com/en-us/windows/mixed-reality/using-the-hololens-emulator. Accessed: 2019-10-22.
[34] Using the windows mixed reality simulator - mixed reality — microsoftdocs. https://docs.microsoft.com/en-us/windows/mixed-reality/using-the-windows-mixed-reality-simulator. Accessed: 2019-10-22.
[35] Vr performance optimization guide — oculus documentation.https://developer.oculus.com/documentation/pcsdk/latest/concepts/dg-performance-opt-guide/. Accessed: 2019-10-22.
[36] Vuforia — augmented reality framework. https://www.vuforia.com.Accessed: 2018-09-04.
[37] What is google maps ar navigation and how do you useit? https://www.pocket-lint.com/apps/news/google/147956-what-is-google-maps-ar-navigation-and-how-do-you-use-it. Accessed: 2019-10-15.
[38] K. Ahuja, R. Islam, V. Parashar, K. Dey, C. Harrison, and M. Goel.Eyespyvr: Interactive eye sensing using off-the-shelf, smartphone-based vr headsets. Proceedings of the ACM on Interactive, Mobile,Wearable and Ubiquitous Technologies, 2(2):57, 2018.
[39] F. Bork, R. Barmaki, U. Eck, K. Yu, C. Sandor, and N. Navab. Em-pirical study of non-reversing magic mirrors for augmented realityanatomy learning. In 2017 IEEE International Symposium on Mixedand Augmented Reality (ISMAR), pp. 169–176. IEEE, 2017.
[40] C. Cao, Z. Li, P. Zhou, and M. Li. Amateur: Augmented reality basedvehicle navigation system. Proceedings of the ACM on Interactive,Mobile, Wearable and Ubiquitous Technologies, 2(4):155, 2018.
[41] T. P. Caudell and D. W. Mizell. Augmented reality: An applicationof heads-up display technology to manual manufacturing processes.In System Sciences, 1992. Proceedings of the Twenty-Fifth HawaiiInternational Conference on, vol. 2, pp. 659–669. IEEE, 1992.
[42] Q. A. Chen, H. Luo, S. Rosen, Z. M. Mao, K. Iyer, J. Hui, K. Sontineni,and K. Lau. Qoe doctor: Diagnosing mobile app qoe with automated uicontrol and cross-layer analysis. In Proceedings of the 2014 Conferenceon Internet Measurement Conference, pp. 151–164. ACM, 2014.
[43] M. A. Cidota, P. J. Bank, P. Ouwehand, and S. G. Lukosch. Assessingupper extremity motor dysfunction using an augmented reality game. In2017 IEEE International Symposium on Mixed and Augmented Reality(ISMAR), pp. 144–154. IEEE, 2017.
[44] C. Diaz, M. Walker, D. A. Szafir, and D. Szafir. Designing for depthperceptions in augmented reality. In 2017 IEEE International Sympo-sium on Mixed and Augmented Reality (ISMAR), pp. 111–122. IEEE,2017.
[45] D. Harborth and S. Pape. Exploring the hype: Investigating technologyacceptance factors of pokemon go. In 2017 IEEE International Sympo-sium on Mixed and Augmented Reality (ISMAR), pp. 155–168. IEEE,2017.
[46] M. K. Holden. Virtual environments for motor rehabilitation. Cy-berpsychology & behavior, 8(3):187–211, 2005.
[47] O. Hurd, S. Kurniawan, and M. Teodorescu. Virtual reality videogame paired with physical monocular blurring as accessible therapyfor amblyopia. In 2019 IEEE Conference on Virtual Reality and 3DUser Interfaces (VR), pp. 492–499. IEEE, 2019.
[48] J. Jung, H. Lee, J. Choi, A. Nanda, U. Gruenefeld, T. Stratmann, andW. Heuten. Ensuring safety in augmented reality from trade-off be-tween immersion and situation awareness. In 2018 IEEE InternationalSymposium on Mixed and Augmented Reality (ISMAR), pp. 70–79.IEEE, 2018.
[49] F. Kern, C. Winter, D. Gall, I. Kathner, P. Pauli, and M. E. Latoschik.Immersive virtual reality and gamification within procedurally gener-ated environments to increase motivation during gait rehabilitation. In2019 IEEE Conference on Virtual Reality and 3D User Interfaces (VR),pp. 500–509. IEEE, 2019.
[50] M. Kesim and Y. Ozarslan. Augmented reality in education: currenttechnologies and the potential for education. Procedia-Social andBehavioral Sciences, 47:297–302, 2012.
[51] T. Keskinen, V. Makela, P. Kallioniemi, J. Hakulinen, J. Karhu,K. Ronkainen, J. Makela, and M. Turunen. The effect of cameraheight, actor behavior, and viewer position on the user experience of

360 videos, 2019.[52] K. Kim, L. Boelling, S. Haesler, J. Bailenson, G. Bruder, and G. F.
Welch. Does a digital assistant need a body? the influence of visualembodiment and social behavior on the perception of intelligent virtualagents in ar. In 2018 IEEE International Symposium on Mixed andAugmented Reality (ISMAR), pp. 105–114. IEEE, 2018.
[53] W. Kim, K. T. W. Choo, Y. Lee, A. Misra, and R. K. Balan. Empath-d:Vr-based empathetic app design for accessibility. In Proceedings of the16th Annual International Conference on Mobile Systems, Applications,and Services, pp. 123–135. ACM, 2018.
[54] E. M. Klose, N. A. Mack, J. Hegenberg, and L. Schmidt. Text presenta-tion for augmented reality applications in dual-task situations. In 2019IEEE Conference on Virtual Reality and 3D User Interfaces (VR), pp.636–644. IEEE, 2019.
[55] G. A. Lee, T. Teo, S. Kim, and M. Billinghurst. A user study on mrremote collaboration using live 360 video. In 2018 IEEE InternationalSymposium on Mixed and Augmented Reality (ISMAR), pp. 153–164.IEEE, 2018.
[56] Y.-D. Lin, E. T.-H. Chu, S.-C. Yu, and Y.-C. Lai. Improving the accu-racy of automated gui testing for embedded systems. IEEE software,31(1):39–45, 2014.
[57] F. Lu, D. Yu, H.-N. Liang, W. Chen, K. Papangelis, and N. M. Ali.Evaluating engagement level and analytical support of interactive visu-alizations in virtual reality environments. In 2018 IEEE InternationalSymposium on Mixed and Augmented Reality (ISMAR), pp. 143–152.IEEE, 2018.
[58] R. McNaney, I. Poliakov, J. Vines, M. Balaam, P. Zhang, and P. Olivier.Lapp: a speech loudness application for people with parkinson’s ongoogle glass. In Proceedings of the 33rd annual ACM conference onHuman Factors in Computing Systems, pp. 497–500. ACM, 2015.
[59] A. S. Merians, D. Jack, R. Boian, M. Tremaine, G. C. Burdea, S. V.Adamovich, M. Recce, and H. Poizner. Virtual reality–augmented re-habilitation for patients following stroke. Physical therapy, 82(9):898–915, 2002.
[60] J. Muller, T. Langlotz, and H. Regenbrecht. Panovc: Pervasive telepres-ence using mobile phones. In 2016 IEEE International Conference onPervasive Computing and Communications (PerCom), pp. 1–10. IEEE,2016.
[61] A. Y. Nee, S. Ong, G. Chryssolouris, and D. Mourtzis. Augmentedreality applications in design and manufacturing. CIRP Annals-manufacturing technology, 61(2):657–679, 2012.
[62] A. Nikravesh, H. Yao, S. Xu, D. Choffnes, and Z. M. Mao. Mobilyzer:An open platform for controllable mobile network measurements. InProceedings of the 13th Annual International Conference on MobileSystems, Applications, and Services, pp. 389–404. ACM, 2015.
[63] Y. Park, S. Yun, and K.-H. Kim. When iot met augmented reality:Visualizing the source of the wireless signal in ar view. In Proceed-ings of the 17th Annual International Conference on Mobile Systems,Applications, and Services, pp. 117–129. ACM, 2019.
[64] S. Prakash, A. Bahremand, L. D. Nguyen, and R. LiKamWa. Gleam:An illumination estimation framework for real-time photorealistic aug-mented reality on mobile devices. In Proceedings of the 17th AnnualInternational Conference on Mobile Systems, Applications, and Ser-vices, pp. 142–154. ACM, 2019.
[65] H. Regenbrecht, G. Baratoff, and W. Wilke. Augmented reality projectsin the automotive and aerospace industries. IEEE Computer Graphicsand Applications, 25(6):48–56, 2005.
[66] L. B. Rosenberg. The use of virtual fixtures as perceptual overlaysto enhance operator performance in remote environments. Technicalreport, Stanford Univ Ca Center for Design Research, 1992.
[67] S. Roy Choudhary, M. R. Prasad, and A. Orso. X-pert: a web ap-plication testing tool for cross-browser inconsistency detection. InProceedings of the 2014 International Symposium on Software Testingand Analysis, pp. 417–420. ACM, 2014.
[68] L. Shapira, J. Amores, and X. Benavides. Tactilevr: integrating physicaltoys into learn and play virtual reality experiences. In 2016 IEEEInternational Symposium on Mixed and Augmented Reality (ISMAR),pp. 100–106. IEEE, 2016.
[69] J. Shu, S. Kosta, R. Zheng, and P. Hui. Talk2me: A framework fordevice-to-device augmented reality social network. In 2018 IEEE In-
ternational Conference on Pervasive Computing and Communications(PerCom), pp. 1–10. IEEE, 2018.
[70] J. H. Shuhaiber. Augmented reality in surgery. Archives of surgery,139(2):170–174, 2004.
[71] M. Speicher, S. Cucerca, and A. Kruger. Vrshop: A mobile interactivevirtual reality shopping environment combining the benefits of on-andoffline shopping. Proceedings of the ACM on Interactive, Mobile,Wearable and Ubiquitous Technologies, 1(3):102, 2017.
[72] C. Tao and J. Gao. Modeling mobile application test platform andenvironment: testing criteria and complexity analysis. In Proceedingsof the 2014 Workshop on Joining AcadeMiA and Industry Contributionsto Test Automation and Model-Based Testing, pp. 28–33. ACM, 2014.
[73] J.-D. Taupiac, N. Rodriguez, O. Strauss, and M. Rabier. Ad-hoc studyon soldiers calibration procedure in virtual reality. In 2019 IEEEConference on Virtual Reality and 3D User Interfaces-proceedings,2019.
[74] C. Templeman, F. J. Ordonez, A. Symes, and D. Roggen. Exploringglass as a novel method for hands-free data entry in flexible cystoscopy.In Proceedings of the 2016 ACM International Joint Conference onPervasive and Ubiquitous Computing, pp. 581–592. ACM, 2016.
[75] C. Trepkowski, D. Eibich, J. Maiero, A. Marquardt, E. Kruijff, andS. Feiner. The effect of narrow field of view and information densityon visual search performance in augmented reality. In 2019 IEEEConference on Virtual Reality and 3D User Interfaces (VR), pp. 575–584. IEEE, 2019.
[76] K. Vasylevska, H. Yoo, T. Akhavan, and H. Kaufmann. Towards eye-friendly vr: How bright should it be? In 2019 IEEE Conference onVirtual Reality and 3D User Interfaces (VR), pp. 566–574. IEEE, 2019.
[77] C. Voss, P. Washington, N. Haber, A. Kline, J. Daniels, A. Fazel,T. De, B. McCarthy, C. Feinstein, T. Winograd, et al. Superpowerglass: delivering unobtrusive real-time social cues in wearable systems.In Proceedings of the 2016 ACM International Joint Conference onPervasive and Ubiquitous Computing: Adjunct, pp. 1218–1226. ACM,2016.
[78] M. E. Walker, D. Szafir, and I. Rae. The influence of size in augmentedreality telepresence avatars. In 2019 IEEE Conference on VirtualReality and 3D User Interfaces (VR), pp. 538–546. IEEE, 2019.
[79] S. Werrlich, A. Daniel, A. Ginger, P.-A. Nguyen, and G. Notni. Compar-ing hmd-based and paper-based training. In 2018 IEEE InternationalSymposium on Mixed and Augmented Reality (ISMAR), pp. 134–142.IEEE, 2018.
[80] C. A. Wiesner, M. Ruf, D. Sirim, and G. Klinker. 3d-frc: Depictionof the future road course in the head-up-display. In 2017 IEEE Inter-national Symposium on Mixed and Augmented Reality (ISMAR), pp.136–143. IEEE, 2017.
[81] M. Wirth, S. Gradl, J. Sembdner, S. Kuhrt, and B. M. Eskofier. Eval-uation of interaction techniques for a virtual reality reading room indiagnostic radiology. In The 31st Annual ACM Symposium on UserInterface Software and Technology, pp. 867–876. ACM, 2018.
[82] H.-K. Wu, S. W.-Y. Lee, H.-Y. Chang, and J.-C. Liang. Current sta-tus, opportunities and challenges of augmented reality in education.Computers & education, 62:41–49, 2013.
[83] L. Xue, C. Qian, and X. Luo. Androidperf: A cross-layer profilingsystem for android applications. In Quality of Service (IWQoS), 2015IEEE 23rd International Symposium on, pp. 115–124. IEEE, 2015.
[84] B. Yoon, H.-i. Kim, G. A. Lee, M. Billinqhurst, and W. Woo. Theeffect of avatar appearance on social presence in an augmented realityremote collaboration. In 2019 IEEE Conference on Virtual Reality and3D User Interfaces (VR), pp. 547–556. IEEE, 2019.
[85] S. C.-Y. Yuen, G. Yaoyuneyong, and E. Johnson. Augmented reality:An overview and five directions for ar in education. Journal of Ed-ucational Technology Development and Exchange (JETDE), 4(1):11,2011.
[86] J. Zhang, A. Ogan, T.-C. Liu, Y.-T. Sung, and K.-E. Chang. Theinfluence of using augmented reality on textbook support for learnersof different learning styles. In 2016 IEEE International Symposium onMixed and Augmented Reality (ISMAR), pp. 107–114. IEEE, 2016.