Embed Size (px)
Citation preview
INTERNATIONAL JOURNAL OF SPORT BIOMECHANICS, 1992,8,305-319
Archery Bow Grip Force Distribution: Relationships With Performance
and Fatigue
Philip E. Martin and Gary D. Heise
Archery instructors believe that force distribution (FD) between the hand and bow grip can have a considerable effect on arrow flight, but there is no empirical support for this speculation. This study examined FD on the bow grip in experienced archers and explored the possible relationships between FD, performance, and fatigue. FD was quantified for 15 experienced archers (8 highly skilled [HS] and 7 less skilled [LS]) using 15 unobtrusive force sensors as each archer completed 72 shots. Arrow position relative to the target center, estimated net moments and moment arms about vertical and horizontal axes through the grip, and shot-to-shot variability in the estimated moments and moment arms were computed for three blocks of six shots. Results demonstrated that (a) estimated moments and moment arms were not consistently related to observed vertical or horizontal deviations in arrow position, (b) there were no systematic differences in FD between HS and LS archers, (c) fatigue had no quantifiable effect on FD, and (d) HS archers displayed less shot-to-shot variability in vertical FD than LS archers, but similar variability horizontally. Results did not support the above-noted com- mon belief of archery instructors.
Despite its long history as a recreational and Olympic sport, only a limited amount of research has focused on the biomechanics of archery shooting. Past studies have considered the relationship between body and bow stability and shooting performance (e.g., Martin & Mungiole, 1987; Mason & Pelgrim, 1986; Nishizono, Sasaki, Nakagawa, & Saito, 1987), and the contributions of the draw arm and hand (i.e., the arm and hand used to draw the string backward) to arrow release (Martin, Siler, & Hoffman, 1990). Research on stability has indicated that while a stable body position may be a prerequisite to successful performance, stability tends not to be a clear discriminator of performance. Electromyographic analysis of draw arm musculature has provided only partial support for the hypotheses that better shooting performances are systematically linked to specific
P.E. Martin is with the Dept. of Exercise Science & Physical Education, Arizona State University, Tempe, AZ 85287-0404. G.D. Heise is now with the Dept. of Kinesiology, Louisiana State University, Baton Rouge, LA 70803. The research was conducted at Arizona State U.

306 Martin and Heise
draw-arm muscle activation patterns for releasing the arrow, lower relative muscle activation, and more consistent shot-to-shot EMG patterns (Martin et al., 1990). Thus, results of past biomechanical studies of archery indicate that the variables hypothesized to be important determinants of performance do not by themselves discriminate between experienced archers of differing ability.
Even though it is the general consensus of archery instructors that the bow arm-the arm that grasps and stabilizes the bow handle as the arrow is drawn and released-plays a critical role in maintaining a stable bow during shooting, there are no empirical data to confirm the degree of importance commonly attributed to its role. Numerous archery instructors have commented on the significance of positioning the gripping hand in exactly the same position on the bow with each shot and of maintaining a motionless wrist during the entire shooting process (Haywood, 1989; Klann, 1970; Pszczola, 1976). Haywood noted that "a skilled archer can demonstrate the importance of a consistent, relaxed bow hand position by varying position just slightly on successive shots and producing a spread of arrows across the target" (p. 87). The desired distribution of force is one in which the force applied to the bow by the hand is distributed almost totally on the posterior surface of the grip (Barrett, 1980; Klann, 1970; Pszczola, 1976). It was suggested that net moments (i.e., torquing effects) pro- duced by a poor gripping pattern or a change in hand and/or wrist position in preparation for release directly affect the direction of arrow flight.
Some archers under fatigued conditions may also begin to employ move- ments about the wrist of the bow arm in order to complete the draw of the arrow (N. Myrick, National Archery Association coach/administrator, personal communication, June 18, 1987). This would change the distribution of force between the hand and grip and could alter the response of the upper and lower limbs of the bow. This action also increases the potential for producing undesirable lateral forces or moments of force on the bow that will influence the direction of arrow flight. While these modifications may be very subtle, their effect is magni- fied over the 30- to 90-m shooting distances in such a way that they could have significant impact on arrow scores.
The purpose of this study was to describe the distribution of force between the hand and bow grip in experienced archers as the archers prepared to release the arrow during normal shooting. The specific aims were to determine three things: (a) whether force distribution on the bow grip immediately preceding arrow release is significantly related to the resulting position of the arrow on the target; (b) whether there are differences in grip force distribution and shot-to-shot variability in force distribution immediately preceding arrow release between experienced archers who differ in performance level; and (c) whether archers display changes in grip force distribution due to fatigue that might develop across a series of 72 shots.
Procedures
Subjects
Fifteen experienced Olympic style archers using recurve bows served as subjects for the study. Individuals were recruited into two distinctly different performance subgroups. A highly skilled (HS) group (n=8: 2 females, 6 males) consisted of
Archery Bow Grip Force Distribution 307
archers who had a 12-month average FITA score and most recent FITA score greater than 1,250 (maximum FITA score = 1,440; scores between 1,300 and 1,350 normally win international competitions) and included four of the six members of the 1988 U.S. Olympic Team and four additional members of the U.S. Archery Team. A less skilled (LS) performance group (n=7: 4 females, 3 males) consisted of archers who had a 12-month average and most recent ETA score less than 1,150. These scores normally would not be competitive at international, national, or regional competitions.
Force Measurement Technology
Fifteen force sensing resistors (Interlink Electronics, Santa Barbara, CA) were applied at comparable positions on each archer's bow grip to quantify normal force (Figure 1). The sensors are composed of two surfaces, a conductive polymer surface laid over a conductive grid, and are designed to provide a resistance output that is dependent on applied force. With increasing force, contact between the conductive surfaces increases, resulting in a decrease in resistance. A circuit powered by a 9-V battery was designed to convert sensor resistance into a voltage output. Sensors had overall dimensions of 15 mm x 28 mm x <1 mm with a circular sensing area 12 mm in diameter. Individual bow grips differed little in size and shape. A concerted effort was made to standardize sensor positions on the grip by keeping distances between the centers of adjacent sensors constant (approximately 20 mm vertically and 15 mm horizontally). Because of differences in hand size between subjects, this resulted in some variation in the locations on the hand and fingers that were centered over the individual sensors.
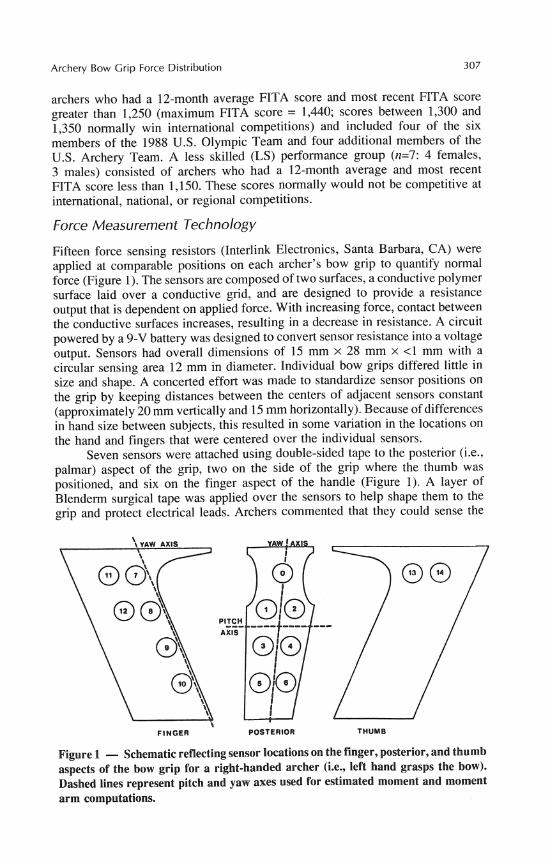
Seven sensors were attached using double-sided tape to the posterior (i.e., palmar) aspect of the grip, two on the side of the grip where the thumb was positioned, and six on the finger aspect of the handle (Figure 1). A layer of Blenderm surgical tape was applied over the sensors to help shape them to the grip and protect electrical leads. Archers commented that they could sense the
FINGER POSTERIOR THUMB
Figure 1 - Schematic reflecting sensor locations on the finger, posterior, and thumb aspects of the bow grip for a right-handed archer (i.e., left hand grasps the bow). Dashed lines represent pitch and yaw axes used for estimated moment and moment arm computations.
308 Martin and Heise
increased size of the bow handle because of the sensors but that their grip and shooting technique were not disrupted by the presence of the sensors.
Others (Jensen, Radwin, & Webster, 1991; Knudson & White, 1989; Stone & Vaughan, 1989) have successfully employed force sensing resistors in human movement analyses. In the present study the sensors offered several advantages, including their flexibility which allowed them to conform to the curved surfaces of the bow grip, thinness which made them relatively unobtrusive to the archer, resilience and general resistance to damage, low hysteresis, low sensitivity to temperature, and low cost. A disadvantage was the overall dimen- sions of the sensors. which limited the number of elements that could be laced on the grip and thus limited measurement resolution in comparison with more sophisticated systems that have been designed for pressure quantification (Hennig, Cavanagh, Albert, & Macmillan, 1982). This limitation was accepted in light of the advantages offered by the sensors and the exploratory nature of the investiga- tion.
Individual elements were calibrated prior to data collection by sequential application and removal of a series of nine normal loads ranging from 0 to 37.4 N. This was accomplished using a stand with a central, vertically loaded rod whose rubber-coated tip was slightly larger in diameter than the sensor active area. The output of each sensor during the calibration process was sampled using a 12-bit analog-to-digital AD) converter (MetraByte Corp., Stoughton, MA). Similar to previous findings (Knudson & White, 1989; Stone & Vaughan, 1989), hysteresis was small and was neglected. The 17 data points (i.e., loading and unloading) were entered into a least-squares curve-fit routine to generate a qua- dratic equation that best expressed the relationship between normal load and A D output for each sensor. Application of higher order equations to a randomly selected subset of the calibration data did not significantly improve the quality of fit over the calibrated range. The result of the calibration process was a unique set of 15 equations for each archer. Of the 225 calibration equations developed, r values exceeded .96 for 79% of the equations. R values for only 2% of the equations were less than .90 but were never less than 30.
Data Collection
Following calibration, each archer completed six practice shots followed by a series of 72 shots at a distance of 30 m from a standard archery target during a single test session lasting approximately 2 hours. While this shooting rate was faster than that used in competition, it was chosen specifically to accentuate the influence that fatigue might have on shooting performance and force distribution on the grip. Archers were instructed to try to strike the target center with each shot.
Output of the 15 force sensors was sampled at a rate of 40 Hz for 6 seconds such that arrow release occurred near the midpoint of this period. Sensor data were recorded for three blocks of six shots from the series of 72 shots (shots 1-6, 34-39, and 67-72). In order to synchronize the force recordings with arrow release, electrical signals that marked two key events in the shooting sequence were sampled simultaneously with the sensors. The first, which marked closure of the clicker (a small metallic strip signaling the archer that full draw has been achieved and that arrow release should be initiated), was produced by contact of

Archery Bow Grip Force Distribution 309
the clicker with a copper strip attached to the bow. Clicker closure occurs approximately 180 ms prior to release. To mark arrow release, an inertia switch was mounted to the horizontal stabilizer of the bow. It consisted of two thin metal strips (approx. 5 mm x 60 mm) mounted vertically 1 mm apart with one strip fixed in position and the other loaded at its free end with a small mass. The abrupt acceleration of the bow accompanying string release caused the strips to come in contact, which produced the desired electrical signal. Shooting performance for each recorded shot was quantified by measuring the position of the arrow on the target in cartesian coordinates. Vertical, horizontal, and resultant distances were computed between the arrow and target center.
Data Analysis
Average force levels recorded from each of the 15 sensors were computed for the final 150 ms immediately preceding arrow release. The time during which net moments applied to the bow potentially affect arrow flight is the brief period from the instant of string release until the arrow loses contact with the string. Preceding arrow release, the bow is essentially in static equilibrium. Any moments produced by the hand on the grip are counteracted by force applied to the string by the opposite hand. It was assumed in our analysis that estimates of net moments on the grip immediately preceding release adequately represented moments during the brief critical period following arrow release.
Force distribution descriptors analogous to moments of force and moment arms about two axes passing through the grip (Figure 1) were estimated. One axis was oriented longitudinally through the grip and was nearly vertical in orientation (hereafter referred to as the yaw axis); the other was horizontal and parallel to the target face (i.e., pitch axis).
Mean descriptors of estimated moments (EM) and moment arms (EMA) and the shot-to-shot variability in these descriptors were subsequently computed for each shot block (i.e., shots 1-6, 34-39, and 67-72) for each archer. The EM about the pitch axis (EMpl,,,), which is indicative of a moment that would tend to tilt the bow up or down, was determined using the seven sensors on the posterior aspect of the grip. The contribution of each sensor force to EM,,,,, was computed as the product of the measured force and a weighting factor that approximated the sensor's vertical distance in centimeters from the pitch axis. Weighting factors for sensors above the axis (i.e., effective moment arms for Sensors 0, 1, and 2) were weighted positively (+3, +1, and +1, respectively) whereas those below the axis (Sensors 3, 4, 5, and 6) were weighted negatively (-1, -1, -3, and -3, respectively), as reflected by the following equation:
where F represents force and the subscripts designate the sensor. The EM about the yaw axis (EM,,,), which is indicative of a moment that
would reorient the arrow to the left or right, was estimated using data from all sensors except Sensor 0, which was centered over the yaw axis. The contributions of the sensors located on the finger side of this axis were weighted positively while those on the thumb side were weighted negatively. The issue of weighting individual sensor contributions to the estimated moments by a distance factor proportional to the sensor's position from the axis of interest is conceptually more

310 Martin and Heise
difficult for EMyaw than EMPitchr for two reasons. First, force applied at different locations about the bow grip affects not only rotation of the bow about a vertical axis but also lateral translation of the bow, both of which could affect arrow flight. Second, because of the curved shape of the bow grip and resulting differences in orientation of the normal force vectors for individual sensors, an accurate estimate of a true moment arm is much more difficult to predict for individual sensors. For these reasons, variable weighting of the individual sensor forces according to position was not attempted for the EMy, computation, as reflected in the following equation:
To obtain an estimate of where grip force tended to be centered, resultant weighting factors (i.e., estimated moment arms, EMAPitch and EMAyaw) were computed:
Using this computational scheme, the maximum and minimum possible values for EMApilch and EMAyaw were 5 3 and f 1, respectively. As an example, if all of the recorded force on the posterior aspect of the grip were isolated at Sensor 0 (i.e., the highest loading pattern that could be achieved), the resulting EMAPiIch would be +3. Similarly, if all of the recorded force were isolated on the sensors on the finger side of the yaw axis through the grip, the resulting EMAyaw would be +l . The expressions of EMApilch and EMAyaw are presented as unitless expres- sions since the weighing factors used in EMpilch and EMyaw computations were not precisely measured distances.
Statistical Analyses
Statistical analyses included correlation and analysis of variance with repeated measures (ANOVA). To examine the relationship between force distribution and arrow position on the target, vertical arrow position for each archer was correlated with EMpiIch and EMAPiwh. Similarly, horizontal arrow position was correlated with EMyaw and EMAyaw. Because an inverse relationship was expected between vertical arrow position and EMpilch and EMAPi,,, (i.e., the higher the loading pattern, the lower the arrow position) and a direct relationship was expected between horizontal arrow position and EMy, and EMAy, (i.e., greater loading toward the finger side of the grip biases arrow position more to the right for a right-handed archer or to the left for a left-handed archer), one-tailed tests of significance (p50.05) were used.
To examine the effects of performance level and fatigue on force distribution descriptors, a two-factor ANOVA (Performance Group x Shot Block) was used. A single-factor ANOVA was also used to compare the mean arrow positions for the two performance groups.
Archery Bow Grip Force Distribution
Results Arrow Position and Grip Force Patterns
Average distances at which the arrows struck the target away from the target center were significantly less for the HS archers than for the LS archers (4.3 f 1.0 cm vs. 8.6 f3.2 cm, respectively; F=13.18, p<0.01). This demonstrated that the two identified skill groups differed in terms of performance during data collection.
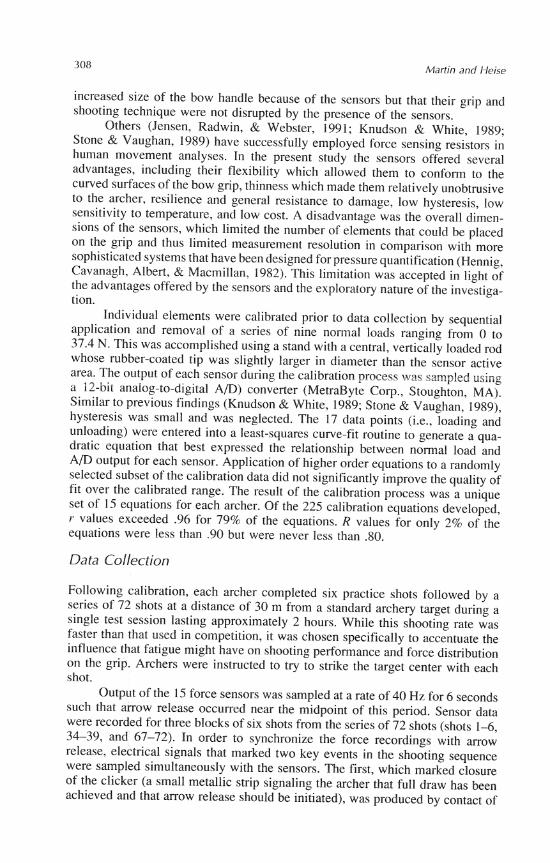
While interindividual differences in vertical and horizontal grip force distri- bution were apparent, two general loading trends were observed. First, nearly all of the loading occurred on the posterior or palmar aspect of the grip. Those sensors on the thumb and finger aspects of the grip recorded considerably lower forces. This was expected since archers are typicaily taught not to grasp the grip but rather simply to push forward against it to counteract the force of the bow pushing against the hand (Barrett, 1980; Klann, 1970; Pszczola, 1976). Second, the sensors positioned higher on the posterior aspect of the grip (Sensors 0, 1, and 2) recorded higher forces than the inferior sensors (3,4,5, and 6), and those sensors located on the finger side (1,3, and 5) displayed higher forces than those on the thumb side of the posterior aspect (Sensors 2,4, and 6). These trends are reflected by the average force levels for each sensor (Table 1) and in positive
Table 1
Forces Detected at Each of the 15 Sensor Locations During Final 150 ms Preceding Arrow Release (data expressed in newtons)
Sensor Highly skilled archers Less skilles archers
M SD M SD
Posterior aspect 0 1 2 3 4 5 6
Finger aspect 7 8 9
10 11 12
Thumb aspect 13 14
aForce levels for some subjects exceeded calibration range. Mean data for Sensors 0 and 3 should be interpreted with caution.

312 Martin and Heise
values for EMpiLch, EMAPitch. EMyaw, and EMAy,, (Figures 2 through 5). It should be noted that the force levels for Sensors 0 and 3 unexpectedly exceeded the calibration range for some of the subjects and thus should be interpreted with caution.
Force Distribution and Arrow Position
Correlations between arrow position and estimated moments and moment arms for each subject generally showed that associations between these variables were weak and did not support the expected inverse relationship between vertical arrow position and EM,,, and EMAPi,,, and the expected direct relationship between horizontal arrow position and EMy,, and EMAy,, (Table 2).
Force Distribution, Performance, and Fatigue
While mean EMPitch and EMAPitch were clearly higher for the HS archers than the LS group (Figures 2 and 3), these differences were not statistically significant. Performance Level x Shot-Block interactions and shot-block main effects for these descriptors also failed to achieve statistical significance. Both EMY,, and EMAY,, showed interactions that approached statistical significance (EMy,: F= 4.53, p=0.053; EMAY,,: F=3.21, p=0.10), such that the mean estimated moment and moment arm increased slightly over time for the HS archers but not for the LS group (Figures 4 and 5). A statistically significant shot-block main effect was observed for EMYaw (F=5.65, p=0.03), as this estimated moment increased later in the shooting session. EMAy,, did not show a similar shot-block effect. Differences
SHOT BLOCK Figure 2 - Average estimated moments about the pitch axis (EM,,,,) during the 150 ms immediately preceding release for highly skilled (HS) and less skilled (LS) archers for the first six, middle six, and last six arrows shot. Estimated moments are expressed in arbitrary units (see text).

Archery Bow Grip Force Distribution 313
1-6 34-39 67-72
SHOT BLOCK Figure 3 - Average estimated moment arm about the pitch axis (EMA,,ch) during the final 150 ms prior to arrow release for highly skilled (HS) and less skilled (LS) archers for early, middle, and late blocks of six arrows. Estimated moment arms are expressed in arbitrary units with a maximum possible range of k3 (see text).
SHOT BLOCK Figure 4 - Average estimated moments about the yaw axis (EMy,) during the 150 ms immediately preceding release for highly skilled (HS) and less skilled (LS) archers for early, middle, and late blocks of six arrows.

Martin and Heise
SHOT BLOCK Figure 5 - Average estimated moment arm about the yaw axis (EMAy,,) during the final 150 ms prior to arrow release for highly skilled (HS) and less skilled (LS) archers for early, middle, and late blocks of six arrows. Estimated moment arms are expressed in arbitrary units with a maximum possible range of +1 (see text).
between HS and LS archers in EMyaw and EMAyaW were small and not statistically significant.
Figures 6 through 9 summarize results for shot-to-shot variability in the estimated moments and moment arms. There were no statistically significant interactions or main effects for any of the four variability descriptors with the exception that HS archers displayed significantly lower shot-to-shot variability in EMAp,,, than LS subjects (F=4.944, p=0.045, Figure 7).
Discussion
Archery instructional literature provides only limited information about gripping technique and flaws. Klann (1970) noted that the "grip of the bow should rest in the palm of your left hand so that the 'life line' follows and pushes against the grip near the pivot point" (p. 50) and that the bow hand "must be placed in exactly the same place on the grip each time you shoot . . . so that [the archer is] not torquing the bow" (p. 51). Pszczola (1976, p. 31) also indicated that the bow hand should be loaded along the life line of the palm and that "rotation of the wrist to the right or left of the bow" (i.e., wrist flexion or hyperextension) should be avoided because these will produce an unbalanced bow position at release, causing lateral deviations of the arrow. Barrett (1980) noted that "pressure [on the bow hand] is felt along the lifeline below the base of the thumb" (p. 55) but provided little additional information linking specific flaws in the grip to shooting errors. When reviewing the research literature, one can find essentially no informa-

Archery Bow Grip Force Distribution 31 5
Table 2
Correlations Between Force Distribution Descriptors During Final 150 ms Preceding Arrow Release and Resulting Arrow Position
on the Target for Individual Archers
Highly skilled archers Subject (n = 8)
Less skilled archers (n = 7)
Verticle arrow positiona vs.
E"~itch EMA~itch E"~itch EMA~itch
Horizontal arrow positionb vs.
EM,, EMA,, EM,, EMAyaw
aThe hypothesized relationship for vertical data was inverse, thus *denotes acorrelation larger than the critical value of -0.40 for a one-tailed test (p = 0.05, df = 16). b ~ h e hypothesized relationship for horizontal data was direct, thus denotes a correlation greater than the critical value of +0.40 for a one-tailed test ( p = 0.05, df = 16).
tion about archery gripping technique. Thus this analysis represents a first attempt to quantify grip force patterns in archery.
Force Distribution and Arrow Position
It was anticipated that significant relationships would be observed between arrow position on the target and estimated moments and moment arms. Results, however, did not support these anticipated relationships. Correlations were small and not consistently in the expected directions. Of the 15 archers studied, only 1 showed a statistically significant link between vertical af-row position and force distribu- tion, and only 3 showed a significant association between horizontal arrow

31 6 Martin and Heise
1-6 34-39 67-72
SHOT BLOCK
Figure 6 - Average shot-to-shot standard deviations (SD) for the estimated moment about the pitch axis (EMpikh) during the final 150 ms preceding arrow release.
1-6 34-39 67-72
SHOT BLOCK Figure 7 - Average shot-to-shot standard deviations (SD) for the estimated moment arm about the pitch axis (EMA,,) during the final 150 ms preceding arrow release.

Archery Bow Grip Force Distribution 31 7
1-6 34-39 67-72
SHOT BLOCK
Figure 8 - Average shot-to-shot standard deviations (SD) for the estimated moment about the yaw axis (EM,,,) during the final 150 ms preceding arrow release.
1-6 34-39 67-72
SHOT BLOCK Figure 9 - Average shot-to-shot standard deviations (SD) for the estimated moment arm about the yaw axis (EMA,,) during the final 150 ms preceding arrow release.
318 Martin and Heise
position and force distribution. Thus the influence of force distribution on arrow position during normal competitive shooting appears to be overestimated in the instructional literature.
There are several research design and procedural issues, however, that may have affected our ability to find the expected relationships. No attempt was made to assess the potentially confounding effects of other technique factors on arrow flight. For example, archery instructors and athletes often stress the importance of producing a clean and consistent string release and suggest that arrow flight can be significantly affected by deviations in string release pattern. In addition, errors in arrow position were quantified as deviations of the arrow from the target center since it was assumed that each archer was consistently aiming at the target center. Even though it would have been more appropriate to quantify deviations of arrow position from the precise location on the target at which the arrow was actually pointed immediately prior to release, determination of this point of aim was not possible.
The results may also reflect in part the limited resolution of the force measurement system. Although the sensors used in the present study appear to have been sufficiently sensitive to small changes in normal force applied to them, the ability to apply only 15 sensors to the entire grip and 7 sensors to the more critical posterior aspect may have been insufficient to assess subtle pressure distribution changes. Finally, we made no attempt to have archers try to manipu- late arrow position on the target by intentionally adjusting bow hand position without adjusting aiming position. While such trials would not be representative of normal competitive shooting, they may have provided additional insight into the degree of force distribution change necessary to significantly affect arrow position. It is equally plausible, however, that normal variations in force distribu- tion by skilled archers during competitive shooting are insufficient by themselves to have a quantifiable effect on arrow position.
Force Distribution and Performance
Despite a lack of statistical significance, the HS archers displayed mean EMpieh and EMA,,,,, values approximately twice as large as those for the LS archers (Figures 2 and 3). The high standard deviations for these variables demonstrated that there were considerable interindividual differences within each performance group. The higher EMpi, values for HS archers is in part dependent on the use of bows of higher poundage (i.e., those that require higher levels of force to achieve full draw of the arrow). Mean data for EMApi,, reflect more directly the distribution of force relative to the pitch axis and suggest that HS archers tended to concentrate the force closer to the top of the grip. These trends are interesting in light of statements in archery instructional literature that generally refer only to "torquing effects" about a vertical axis (i.e., those affecting only lateral position of the arrow). Little if any mention is made of potential torquing effects due to variations in vertical grip force distribution (i.e., that affecting vertical arrow position). The significantly lower shot-to-shot variability in EMAPitch dis- played by HS archers (Figure 7) is consistent with the arrow's smaller average absolute vertical deviation from the target center (2.7 vs. 5.7 cm for the HS and LS archers, respectively) and the closer grouping of arrows on the target by the WS archers.
Archery Bow Grip Force Distribution 319
Force Distribution and Fatigue National and international competitions normally require the completion of 72 shots during a single day of competition. Despite our intention to accentuate a fatigue effect by having subjects complete 72 shots in a single 2-hour test session, no systematic changes in force distribution occurred. This finding is inconsistent with the suggestion that experienced archers, when fatigued, may change hand and/or wrist position in order to achieve full draw.
Conclusions It was concluded that (a) bow grip force distribution as quantified with the 15 force sensors was not related to measured vertical or lateral arrow position on the target; (b) grip force distribution immediately preceding arrow release did not differ significantly between HS and LS archers, despite the tendency for HS archers to concentrate force higher on the grip; however, shot-to-shot variability in vertical force distribution was lower for HS archers; and (c) fatigue had no quantifiable effect on grip force distribution.
References Barrett, J.A. (1980). Archery (3rd ed.). Glenview, IL: Scott, Foresman, & Co. Haywood, K.M. (1989). Teaching archery: Steps to success. Champaign, IL: Leisure Press. H e ~ i g , E.M., Cavanagh, P.R., Albert, H.T., & Macmillan, N.H. (1982). A piezoelectric
method of measuring the vertical contact stress beneath the human foot. Journal of Biomedical Engineering, 4 , 213-222.
Jensen, T.R., Radwin, R.G., & Webster, J.G. (1991). A conductive polymer sensor for measuring external finger forces. Journal of Biomechanics, 24, 851-858.
Klann, M.L. (1970). Target archery. Reading, MA: Addison-Wesley. Knudson, D.V., & White, S.C. (1989). Forces on the hand in the tennis forehand drive:
Application of force sensing resistors. International Journal of Sport Biomechanics, 5, 324-331.
Martin, P.E., & Mungiole, M. (1987, April 16). Body stability differences between skilled and less-skilled archers. Presented at AAHPERD annual meeting, Las Vegas.
Martin, P.E., Siler, W.L., & Hoffman, D. (1990). Electromyographic analysis of bow string release in highly skilled archers. Journal of Sport Sciences, 8, 215-221.
Mason, B.R., & Pelgrim, P.P. (1986). Body stability and performance in archery. Excel, 3(2), 17-20.
Nishizono, H., Sasaki, T., Nakagawa, K., & Saito, K. (1987). Biomechanical analysis of the vertical reaction force related to sudden voluntary releasing movement. Abstracts of the XIth International Congress of Biomechanics. Amsterdam: Free University Press, p. 232.
Pszczola, L. (1976). Archery. (2nd ed.). Philadelphia: Saunders. Stone, K.T., & Vaughan, C.L. (1989). A new transducer for measurement of plantar
pressures. In R.J. Gregor, R.F. Zernicke, & W.C. Whiting (Eds.), XII International Congress of Biomechanics: Congress Proceedings (abstract 100). Los Angeles: UCLA.
Acknowledgment This research was supported by a grant from the U.S. Olympic Committee.