Embed Size (px)
Citation preview

ArcGIS®
9ArcGIS Tracking Analyst Tutorial
Copyright (c) 2004–2008 ESRI.
All Rights Reserved.
Printed in the United States of America.
The information contained in this document is the exclusive property of ESRI. This work is protected under United States copyright law and thecopyright laws of the given countries of origin and applicable international laws, treaties, and/or conventions. No part of this work may be reproducedor transmitted in any form or by any means, electronic or mechanical, including photocopying or recording, or by any information storage or retrievalsystem, except as expressly permitted in writing by ESRI. All requests should be sent to Attention: Contracts Manager, ESRI, 380 New York Street,Redlands, CA 92373-8100, USA.
The information contained in this document is subject to change without notice.
U. S. GOVERNMENT RESTRICTED/LIMITED RIGHTS
Any software, documentation, and/or data delivered hereunder is subject to the terms of the License Agreement. In no event shall the U.S. Governmentacquire greater than RESTRICTED/LIMITED RIGHTS. At a minimum, use, duplication, or disclosure by the U.S. Government is subject to restrictionsas set forth in FAR §52.227-14 Alternates I, II, and III (JUN 1987); FAR §52.227-19 (JUN 1987) and/or FAR §12.211/12.212 (Commercial TechnicalData/Computer Software); and DFARS §252.227-7015 (NOV 1995) (Technical Data) and/or DFARS §227.7202 (Computer Software), as applicable.Contractor/Manufacturer is ESRI, 380 New York Street, Redlands, CA 92373-8100, USA.
ESRI, ArcView, ArcGIS, ArcCatalog, ArcEditor, ArcInfo, MOLE, and ArcMap are trademarks, registered trademarks, or service marks of ESRI in theUnited States, the European Community, or certain other jurisdictions.
Other companies and products mentioned herein are trademarks or registered trademarks of their respective trademark owners.
Attribution.pmd 1/29/2008, 11:28 AM1
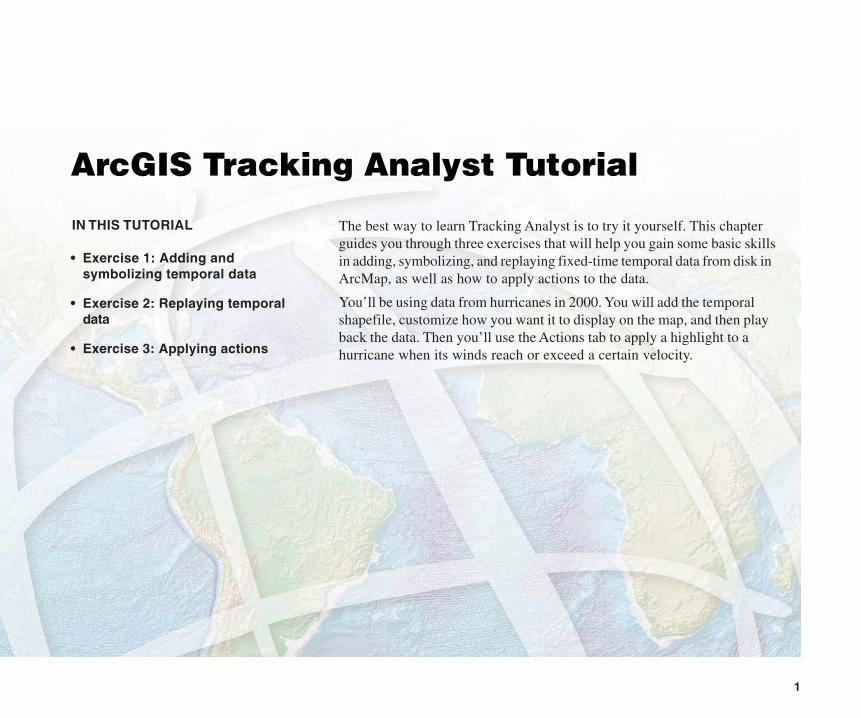
IN THIS TUTORIAL
1
ArcGIS Tracking Analyst Tutorial
• Exercise 1: Adding andsymbolizing temporal data
• Exercise 2: Replaying temporaldata
• Exercise 3: Applying actions
The best way to learn Tracking Analyst is to try it yourself. This chapterguides you through three exercises that will help you gain some basic skillsin adding, symbolizing, and replaying fixed-time temporal data from disk inArcMap, as well as how to apply actions to the data.
You’ll be using data from hurricanes in 2000. You will add the temporalshapefile, customize how you want it to display on the map, and then playback the data. Then you’ll use the Actions tab to apply a highlight to ahurricane when its winds reach or exceed a certain velocity.
Ch02.pmd 1/25/2008, 2:48 PM1
2 ARCGIS TRACKING ANALYST TUTORIAL
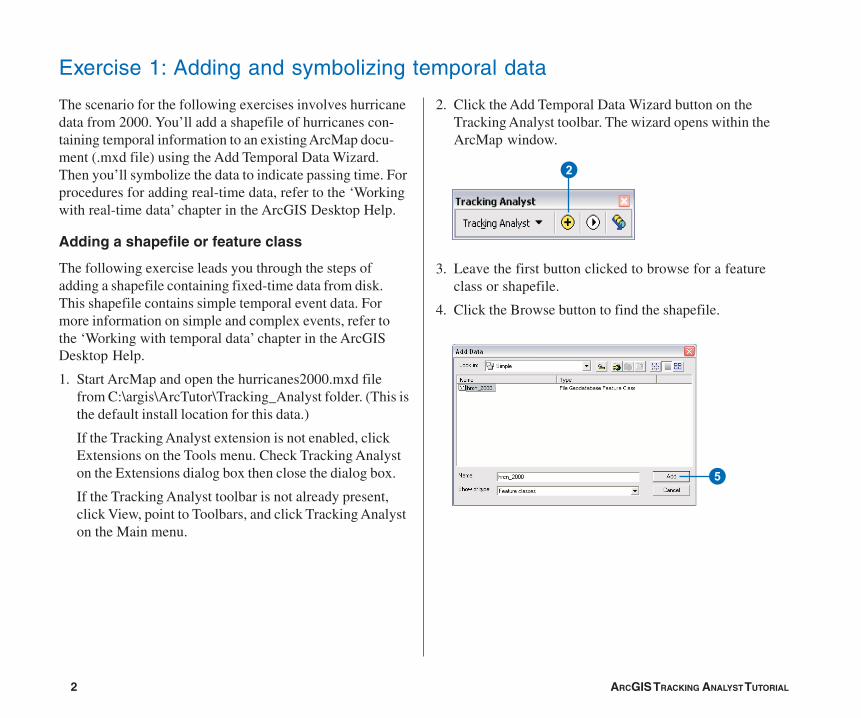
The scenario for the following exercises involves hurricanedata from 2000. You’ll add a shapefile of hurricanes con-taining temporal information to an existing ArcMap docu-ment (.mxd file) using the Add Temporal Data Wizard.Then you’ll symbolize the data to indicate passing time. Forprocedures for adding real-time data, refer to the ‘Workingwith real-time data’ chapter in the ArcGIS Desktop Help.
Adding a shapefile or feature class
The following exercise leads you through the steps ofadding a shapefile containing fixed-time data from disk.This shapefile contains simple temporal event data. Formore information on simple and complex events, refer tothe ‘Working with temporal data’ chapter in the ArcGISDesktop Help.
1. Start ArcMap and open the hurricanes2000.mxd filefrom C:\argis\ArcTutor\Tracking_Analyst folder. (This isthe default install location for this data.)
If the Tracking Analyst extension is not enabled, clickExtensions on the Tools menu. Check Tracking Analyston the Extensions dialog box then close the dialog box.
If the Tracking Analyst toolbar is not already present,click View, point to Toolbars, and click Tracking Analyston the Main menu.
2. Click the Add Temporal Data Wizard button on theTracking Analyst toolbar. The wizard opens within theArcMap window.
3. Leave the first button clicked to browse for a featureclass or shapefile.
4. Click the Browse button to find the shapefile.
Exercise 1: Adding and symbolizing temporal data
5
2
Ch02.pmd 1/25/2008, 2:48 PM2
ARCGIS TRACKING ANALYST TUTORIAL 3
3
4
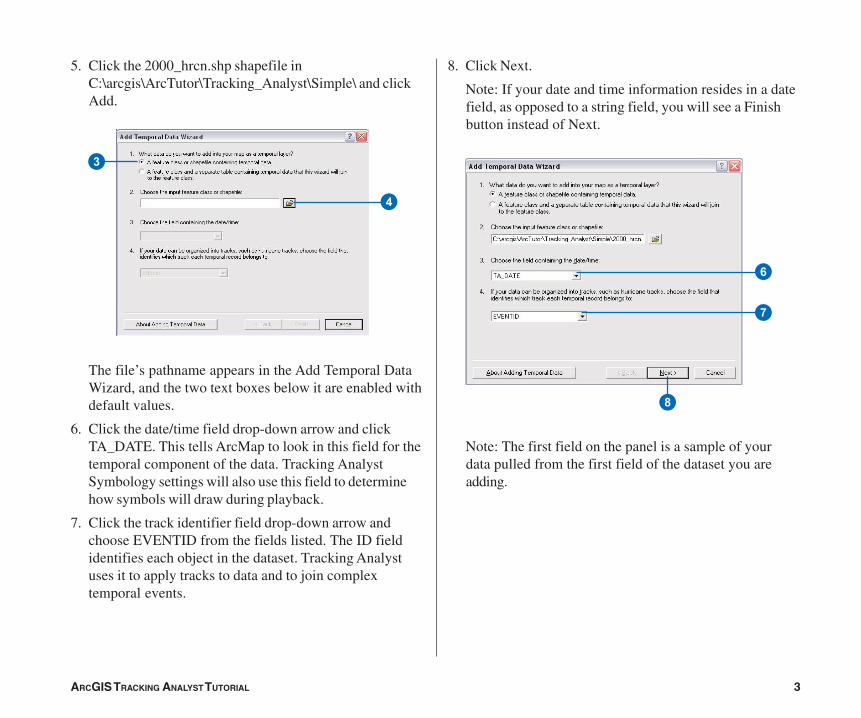
5. Click the 2000_hrcn.shp shapefile inC:\arcgis\ArcTutor\Tracking_Analyst\Simple\ and clickAdd.
The file’s pathname appears in the Add Temporal DataWizard, and the two text boxes below it are enabled withdefault values.
6. Click the date/time field drop-down arrow and clickTA_DATE. This tells ArcMap to look in this field for thetemporal component of the data. Tracking AnalystSymbology settings will also use this field to determinehow symbols will draw during playback.
7. Click the track identifier field drop-down arrow andchoose EVENTID from the fields listed. The ID fieldidentifies each object in the dataset. Tracking Analystuses it to apply tracks to data and to join complextemporal events.
8. Click Next.
Note: If your date and time information resides in a datefield, as opposed to a string field, you will see a Finishbutton instead of Next.
Note: The first field on the panel is a sample of yourdata pulled from the first field of the dataset you areadding.
6
7
8
Ch02.pmd 1/25/2008, 2:48 PM3
4 ARCGIS TRACKING ANALYST TUTORIAL
9
Q
W E
R
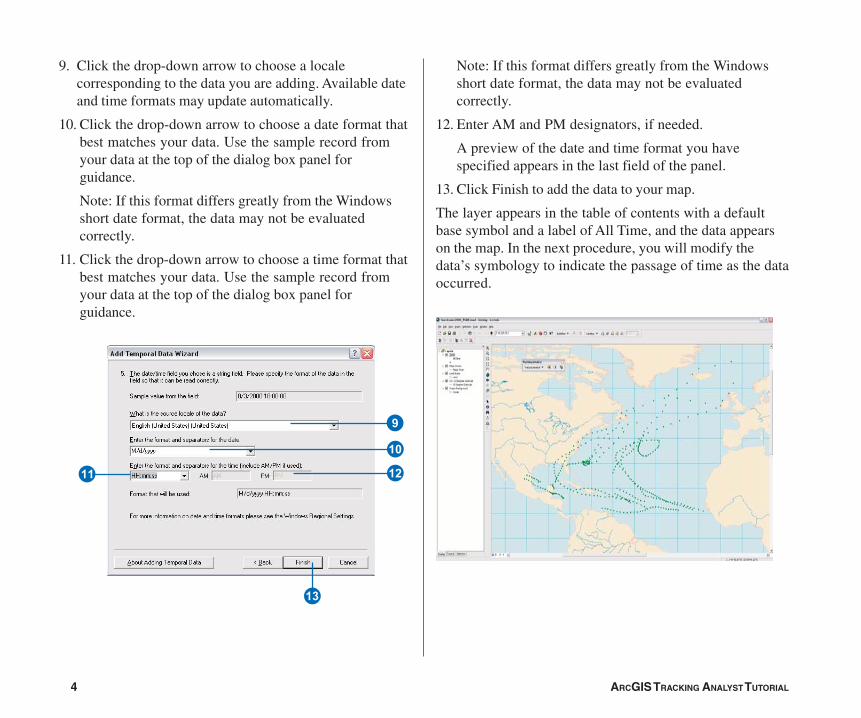
9. Click the drop-down arrow to choose a localecorresponding to the data you are adding. Available dateand time formats may update automatically.
10. Click the drop-down arrow to choose a date format thatbest matches your data. Use the sample record fromyour data at the top of the dialog box panel forguidance.
Note: If this format differs greatly from the Windowsshort date format, the data may not be evaluatedcorrectly.
11. Click the drop-down arrow to choose a time format thatbest matches your data. Use the sample record fromyour data at the top of the dialog box panel forguidance.
Note: If this format differs greatly from the Windowsshort date format, the data may not be evaluatedcorrectly.
12. Enter AM and PM designators, if needed.
A preview of the date and time format you havespecified appears in the last field of the panel.
13. Click Finish to add the data to your map.
The layer appears in the table of contents with a defaultbase symbol and a label of All Time, and the data appearson the map. In the next procedure, you will modify thedata’s symbology to indicate the passage of time as the dataoccurred.
Ch02.pmd 1/25/2008, 2:48 PM4
ARCGIS TRACKING ANALYST TUTORIAL 5
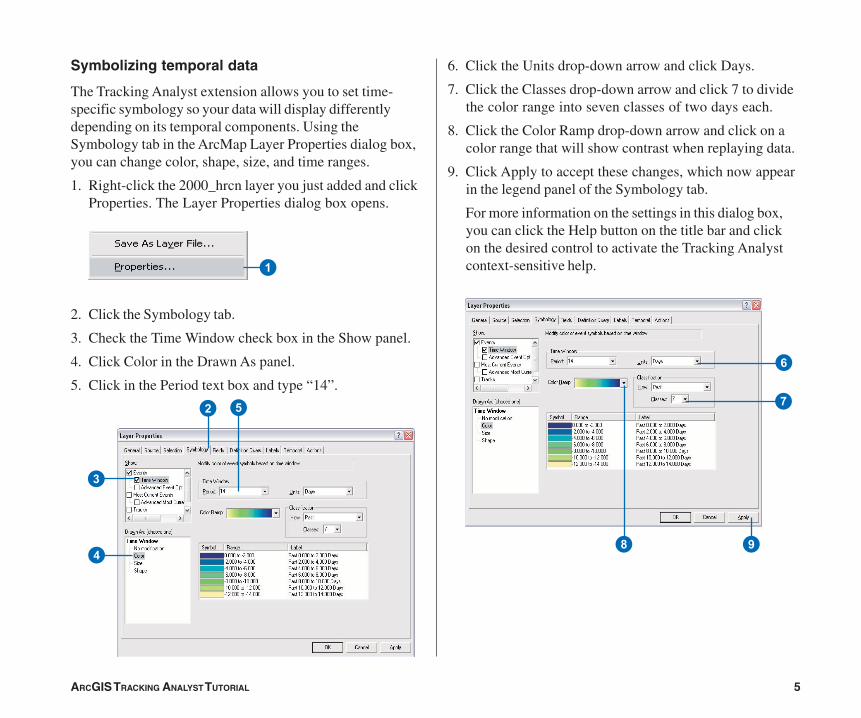
Symbolizing temporal data
The Tracking Analyst extension allows you to set time-specific symbology so your data will display differentlydepending on its temporal components. Using theSymbology tab in the ArcMap Layer Properties dialog box,you can change color, shape, size, and time ranges.
1. Right-click the 2000_hrcn layer you just added and clickProperties. The Layer Properties dialog box opens.
2. Click the Symbology tab.
3. Check the Time Window check box in the Show panel.
4. Click Color in the Drawn As panel.
5. Click in the Period text box and type “14”.
1
6. Click the Units drop-down arrow and click Days.
7. Click the Classes drop-down arrow and click 7 to dividethe color range into seven classes of two days each.
8. Click the Color Ramp drop-down arrow and click on acolor range that will show contrast when replaying data.
9. Click Apply to accept these changes, which now appearin the legend panel of the Symbology tab.
For more information on the settings in this dialog box,you can click the Help button on the title bar and clickon the desired control to activate the Tracking Analystcontext-sensitive help.
3
4
2 5
8 9
6
7
Ch02.pmd 1/25/2008, 2:48 PM5
6 ARCGIS TRACKING ANALYST TUTORIAL
Q
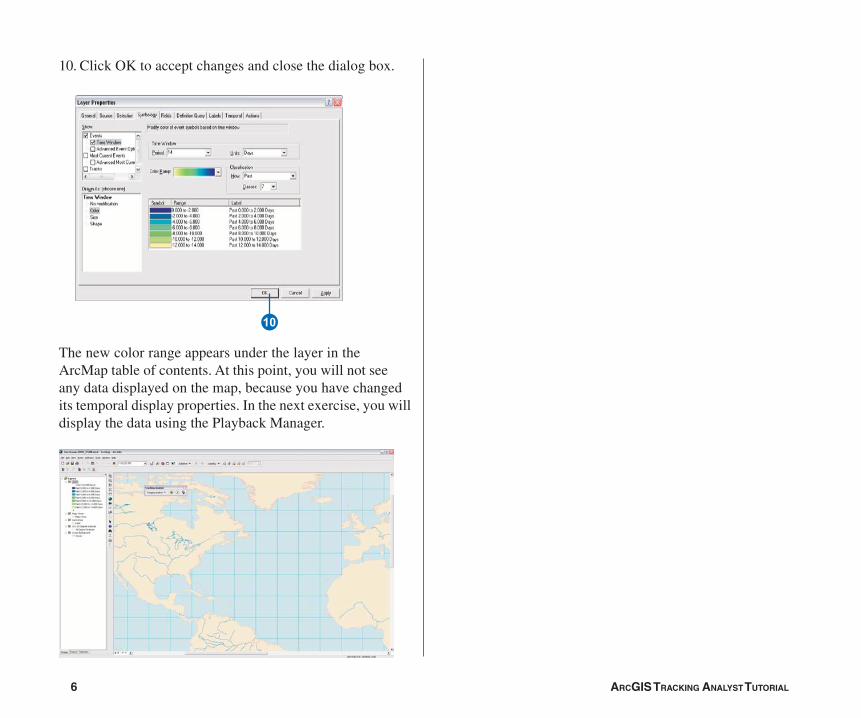
10. Click OK to accept changes and close the dialog box.
The new color range appears under the layer in theArcMap table of contents. At this point, you will not seeany data displayed on the map, because you have changedits temporal display properties. In the next exercise, you willdisplay the data using the Playback Manager.
Ch02.pmd 1/25/2008, 2:48 PM6
ARCGIS TRACKING ANALYST TUTORIAL 7
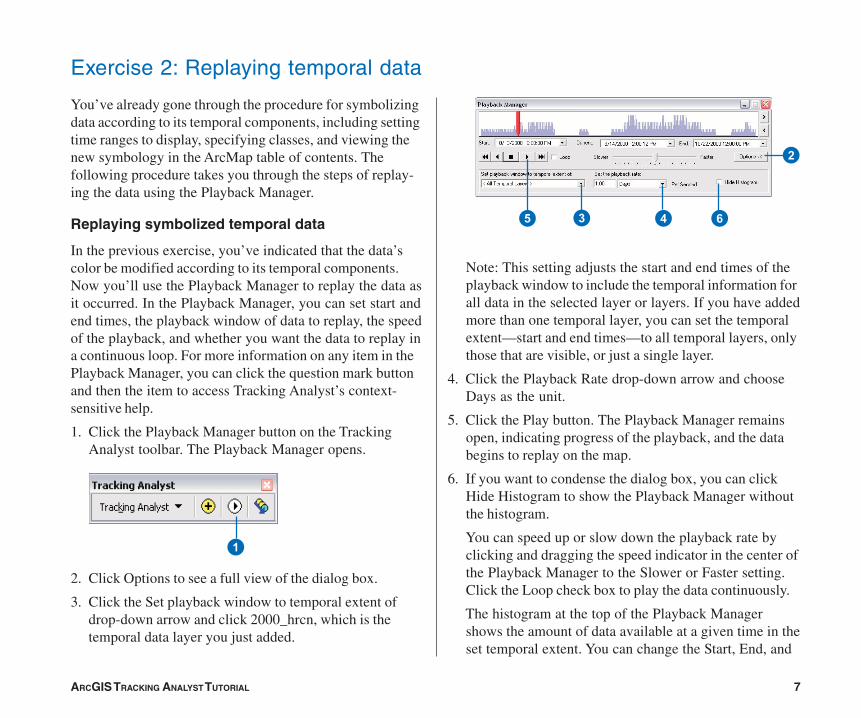
You’ve already gone through the procedure for symbolizingdata according to its temporal components, including settingtime ranges to display, specifying classes, and viewing thenew symbology in the ArcMap table of contents. Thefollowing procedure takes you through the steps of replay-ing the data using the Playback Manager.
Replaying symbolized temporal data
In the previous exercise, you’ve indicated that the data’scolor be modified according to its temporal components.Now you’ll use the Playback Manager to replay the data asit occurred. In the Playback Manager, you can set start andend times, the playback window of data to replay, the speedof the playback, and whether you want the data to replay ina continuous loop. For more information on any item in thePlayback Manager, you can click the question mark buttonand then the item to access Tracking Analyst’s context-sensitive help.
1. Click the Playback Manager button on the TrackingAnalyst toolbar. The Playback Manager opens.
2. Click Options to see a full view of the dialog box.
3. Click the Set playback window to temporal extent ofdrop-down arrow and click 2000_hrcn, which is thetemporal data layer you just added.
Exercise 2: Replaying temporal data
Note: This setting adjusts the start and end times of theplayback window to include the temporal information forall data in the selected layer or layers. If you have addedmore than one temporal layer, you can set the temporalextent—start and end times—to all temporal layers, onlythose that are visible, or just a single layer.
4. Click the Playback Rate drop-down arrow and chooseDays as the unit.
5. Click the Play button. The Playback Manager remainsopen, indicating progress of the playback, and the databegins to replay on the map.
6. If you want to condense the dialog box, you can clickHide Histogram to show the Playback Manager withoutthe histogram.
You can speed up or slow down the playback rate byclicking and dragging the speed indicator in the center ofthe Playback Manager to the Slower or Faster setting.Click the Loop check box to play the data continuously.
The histogram at the top of the Playback Managershows the amount of data available at a given time in theset temporal extent. You can change the Start, End, and
2
35 4 6
1
Ch02.pmd 1/25/2008, 2:48 PM7
8 ARCGIS TRACKING ANALYST TUTORIAL
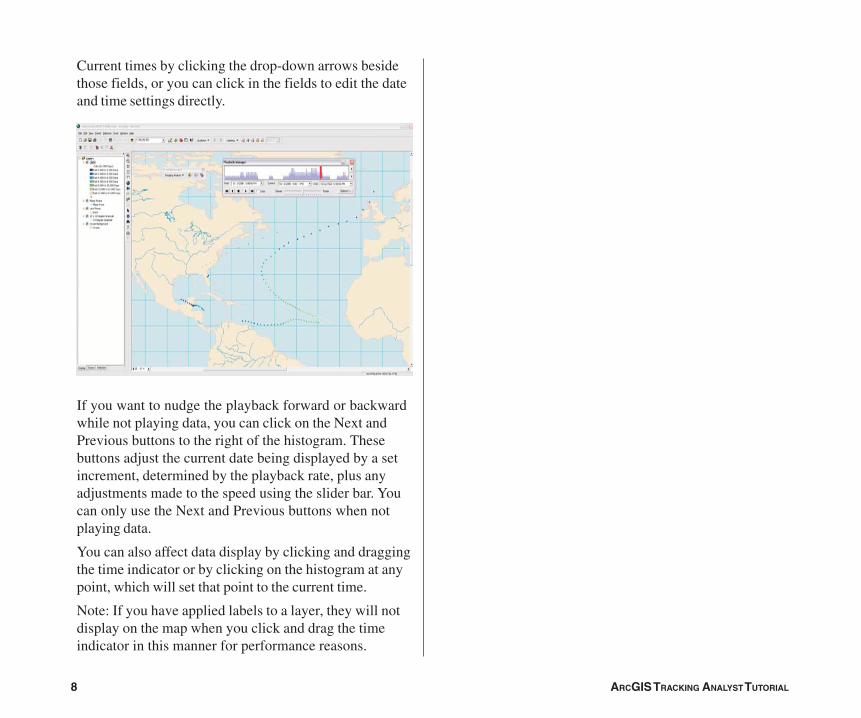
Current times by clicking the drop-down arrows besidethose fields, or you can click in the fields to edit the dateand time settings directly.
If you want to nudge the playback forward or backwardwhile not playing data, you can click on the Next andPrevious buttons to the right of the histogram. Thesebuttons adjust the current date being displayed by a setincrement, determined by the playback rate, plus anyadjustments made to the speed using the slider bar. Youcan only use the Next and Previous buttons when notplaying data.
You can also affect data display by clicking and draggingthe time indicator or by clicking on the histogram at anypoint, which will set that point to the current time.
Note: If you have applied labels to a layer, they will notdisplay on the map when you click and drag the timeindicator in this manner for performance reasons.
Ch02.pmd 1/25/2008, 2:48 PM8
ARCGIS TRACKING ANALYST TUTORIAL 9
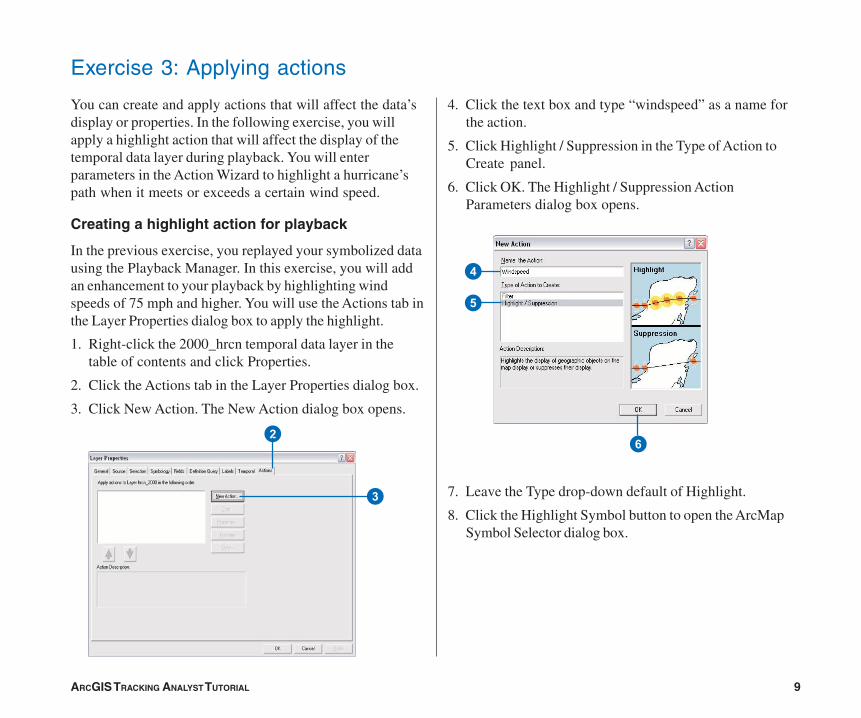
Exercise 3: Applying actions
You can create and apply actions that will affect the data’sdisplay or properties. In the following exercise, you willapply a highlight action that will affect the display of thetemporal data layer during playback. You will enterparameters in the Action Wizard to highlight a hurricane’spath when it meets or exceeds a certain wind speed.
Creating a highlight action for playback
In the previous exercise, you replayed your symbolized datausing the Playback Manager. In this exercise, you will addan enhancement to your playback by highlighting windspeeds of 75 mph and higher. You will use the Actions tab inthe Layer Properties dialog box to apply the highlight.
1. Right-click the 2000_hrcn temporal data layer in thetable of contents and click Properties.
2. Click the Actions tab in the Layer Properties dialog box.
3. Click New Action. The New Action dialog box opens.
3
2
4. Click the text box and type “windspeed” as a name forthe action.
5. Click Highlight / Suppression in the Type of Action toCreate panel.
6. Click OK. The Highlight / Suppression ActionParameters dialog box opens.
7. Leave the Type drop-down default of Highlight.
8. Click the Highlight Symbol button to open the ArcMapSymbol Selector dialog box.
4
5
6
Ch02.pmd 1/25/2008, 2:48 PM9
10 ARCGIS TRACKING ANALYST TUTORIAL
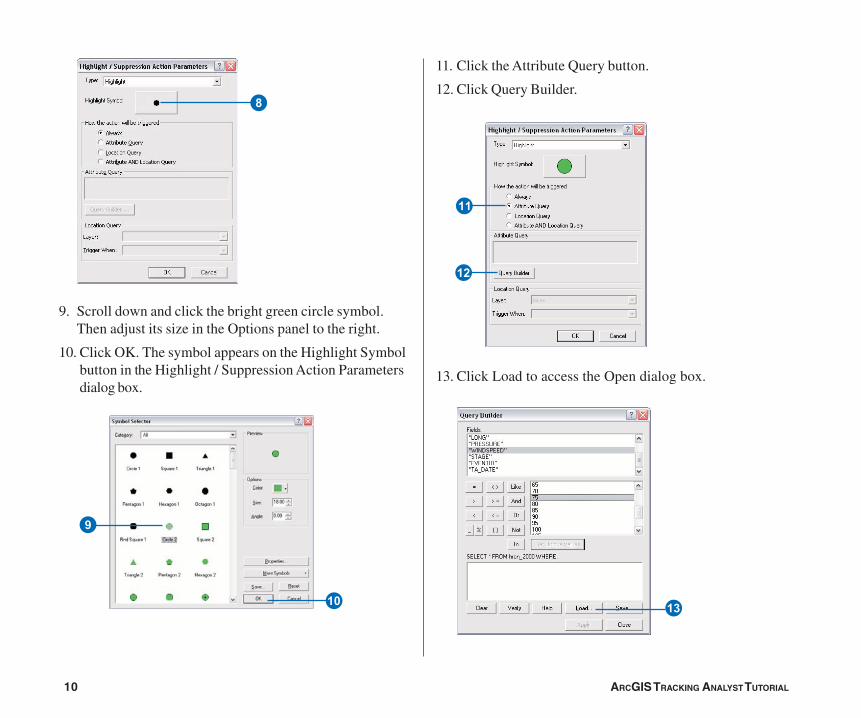
9. Scroll down and click the bright green circle symbol.Then adjust its size in the Options panel to the right.
10. Click OK. The symbol appears on the Highlight Symbolbutton in the Highlight / Suppression Action Parametersdialog box.
RQ
9
11. Click the Attribute Query button.
12. Click Query Builder.
13. Click Load to access the Open dialog box.
W
E
8
Ch02.pmd 1/25/2008, 2:48 PM10
ARCGIS TRACKING ANALYST TUTORIAL 11
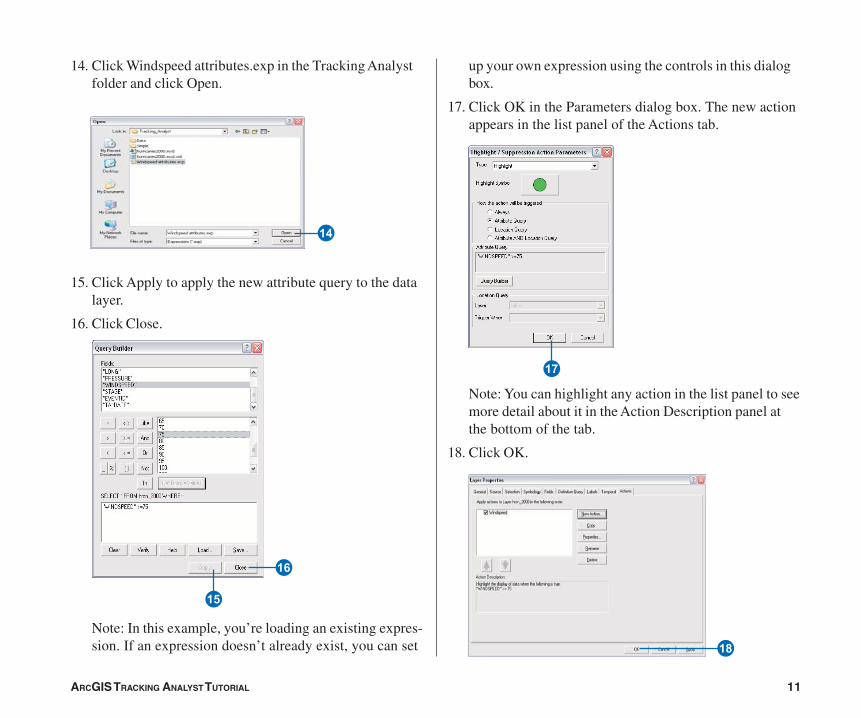
14. Click Windspeed attributes.exp in the Tracking Analystfolder and click Open.
15. Click Apply to apply the new attribute query to the datalayer.
16. Click Close.
Note: In this example, you’re loading an existing expres-sion. If an expression doesn’t already exist, you can set
I
Y
U
O
T
up your own expression using the controls in this dialogbox.
17. Click OK in the Parameters dialog box. The new actionappears in the list panel of the Actions tab.
Note: You can highlight any action in the list panel to seemore detail about it in the Action Description panel atthe bottom of the tab.
18. Click OK.
Ch02.pmd 1/25/2008, 2:48 PM11
12 ARCGIS TRACKING ANALYST TUTORIAL
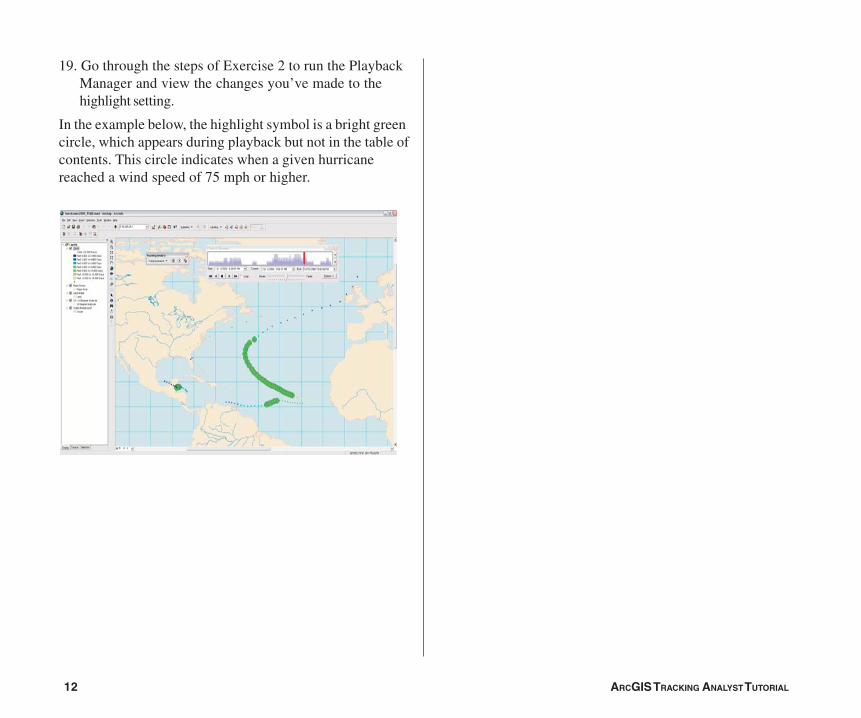
19. Go through the steps of Exercise 2 to run the PlaybackManager and view the changes you’ve made to thehighlight setting.
In the example below, the highlight symbol is a bright greencircle, which appears during playback but not in the table ofcontents. This circle indicates when a given hurricanereached a wind speed of 75 mph or higher.
Ch02.pmd 1/25/2008, 2:48 PM12


![Road network analysis of Guwahati city using GIS · traffic conditions,t different times of the da[3 ].ArGIS proved to be one of the most user friendly, effective and time-ving tools](https://img.pdfslide.us/doc/110x75/5fa3b1e59b9f3b6adb4d77c5/road-network-analysis-of-guwahati-city-using-gis-traffic-conditionst-different.jpg)


![From urban planning and emergency training to Pokémon Go ... · reality GIS [MRGIS] and augmented reality GIS [ARGIS] as closely related terms and concepts.) But more recent developments](https://img.pdfslide.us/doc/110x75/5cca5ac888c993b16c8b7891/from-urban-planning-and-emergency-training-to-pokemon-go-reality-gis-mrgis.jpg)