Embed Size (px)
Citation preview
Page 1 of 20
ArcelorMittal reports fourth quarter 2014 and full year 2014 results Luxembourg, February 13, 2015 - ArcelorMittal (referred to as “ArcelorMittal” or the “Company”) (MT (New York, Amsterdam, Paris, Luxembourg), MTS (Madrid)), the world’s leading integrated steel and mining company, today announced results
1 for the three and twelve-month periods ended December 31, 2014.
Highlights:
Health and safety performance remained stable in FY 2014 with annual LTIF rate of 0.85x
FY 2014 EBITDA of $7.2 billion, 8.5% higher than FY 2013 on an underlying basis2; underlying steel-only
EBITDA/t up 23.6% or $14/t versus FY 2013
4Q 2014 EBITDA of $1.8 billion; notable improvements versus 4Q 2013 in Europe (+36.6%) and ACIS
(+173.6%) segments were more than offset by the negative impact of iron ore prices on the Mining segment (-
73.7%)3 on an underlying basis
FY 2014 net loss of $1.1 billion as compared to FY 2013 net loss of $2.5 billion. Excluding China Oriental
impairment ($0.6 billion), other impairments and other non-recurring items, net income would have been positive
in FY 2014
Free cash flow positive in FY 2014; $3.9 billion of cash flow from operations and capital expenditure of $3.7
billion
Net debt lower at $15.8 billion as of December 31, 2014 as compared to $17.8 billion as of September 30, 2014
due largely to working capital release of $1.0 billion, asset disposal proceeds of $0.6 billion and forex impacts of
$0.2 billion
FY 2014 steel shipments of 85.1Mt (+3.0 YoY); 4Q 2014 steel shipments of 21.2Mt up +3.4% versus 4Q 2013
FY 2014 iron ore shipments of 63.7Mt (+6.9% YoY), of which 39.8Mt shipped at market prices (+13.2% YoY); 4Q
2014 iron ore shipments of 16.3Mt (-1.4% YoY), of which 9.9Mt shipped at market prices (-3.4% YoY)
Annualized management gains improvement of $2.1 billion achieved at end of 2014. On course to reach $3
billion target by the end of 2015
Dividend maintained at $0.20/share, subject to shareholders’ approval
Strategic progress in 2014:
The Company has made notable progress on its strategic objectives during 2014, including:
Increased steel volumes by 3% given improved demand in its core steel markets
Expanded steel margins by $14/t through continued focus on cost optimization: leveraging benefits of European
restructuring, improved performance of ACIS operations as well as lower raw material costs
Page 2 of 20
Expanded mining volumes (including a 4Q 2014 annualized production rate of 26Mt at ArcelorMittal Mines
Canada (AMMC)) whilst further reducing mining costs (4Q 2014 AMMC concentrate unit cost 25% lower than FY
2013 average)
Further developed its automotive steel franchise including new capacity (Calvert, VAMA) and new product
launches
Net debt declined to its lowest level since the ArcelorMittal merger which together with lower average cost of
debt reduced net interest expense by $0.3 billion
Outlook and guidance:
The Company expects Group EBITDA to be within the range of $6.5 billion to $7 billion for 2015
Steel segments: Overall, steel markets continue to grow, in particular for our high value-added products; a
forecast 4-5% increase in shipment volumes (approximately half of which follows the Newcastle reline
completion and full year impact of the restart of BF#3 in Tubarao, Brazil) together with improved cost
performance are expected to offset the impact of lower transaction prices and the impacts of translation
Mining segment: Assuming current market conditions, in excess of one-third of the impact of lower iron ore
prices on revenues will be offset by improved cost performance including the benefits of foreign exchange,
energy and freight as well as higher volumes
Additionally, the Company expects net interest expense to decline to approximately $1.4 billion and capital
expenditure to decline to approximately $3.4 billion in 2015
As a result, at the bottom end of the guidance range the Company would expect to be free cash flow positive.
While net debt is expected to follow a normal seasonal pattern, overall progress towards the medium term net
debt target of $15 billion is anticipated during the course of 2015
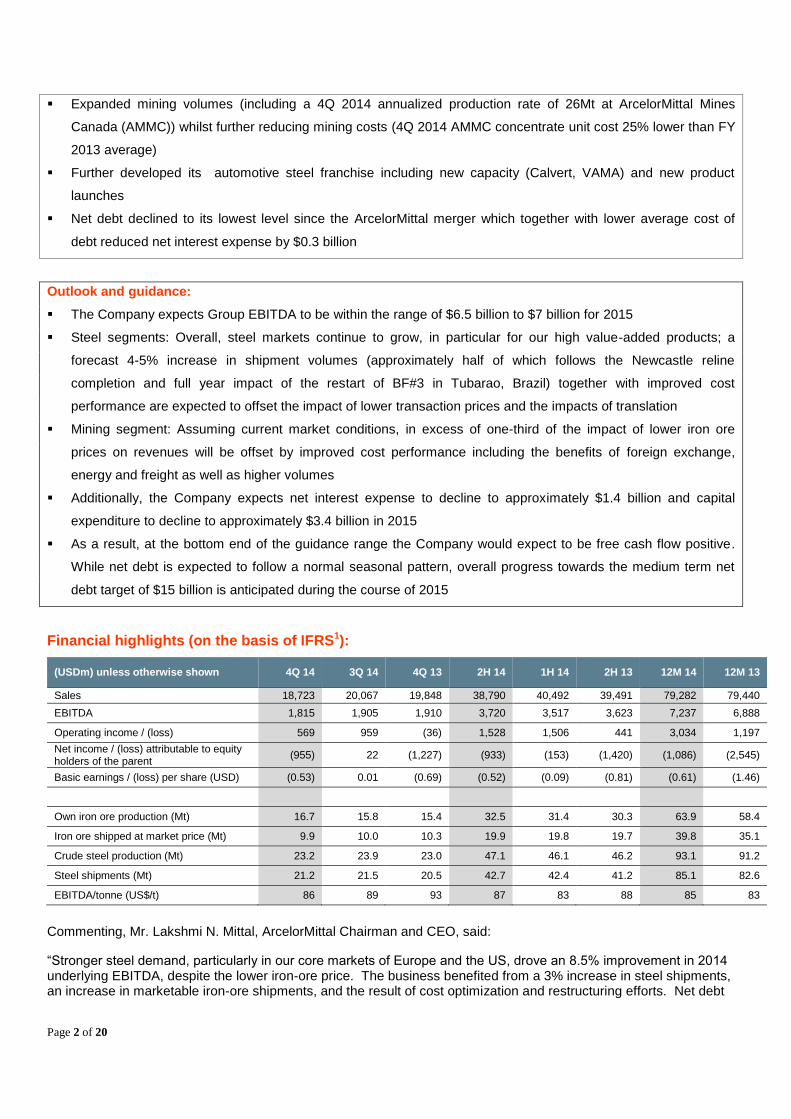
Financial highlights (on the basis of IFRS1):
(USDm) unless otherwise shown 4Q 14 3Q 14 4Q 13 2H 14 1H 14 2H 13 12M 14 12M 13
Sales 18,723 20,067 19,848 38,790 40,492 39,491 79,282 79,440
EBITDA 1,815 1,905 1,910 3,720 3,517 3,623 7,237 6,888
Operating income / (loss) 569 959 (36) 1,528 1,506 441 3,034 1,197
Net income / (loss) attributable to equity holders of the parent
(955) 22 (1,227) (933) (153) (1,420) (1,086) (2,545)
Basic earnings / (loss) per share (USD) (0.53) 0.01 (0.69) (0.52) (0.09) (0.81) (0.61) (1.46)
Own iron ore production (Mt) 16.7 15.8 15.4 32.5 31.4 30.3 63.9 58.4
Iron ore shipped at market price (Mt) 9.9 10.0 10.3 19.9 19.8 19.7 39.8 35.1
Crude steel production (Mt) 23.2 23.9 23.0 47.1 46.1 46.2 93.1 91.2
Steel shipments (Mt) 21.2 21.5 20.5 42.7 42.4 41.2 85.1 82.6
EBITDA/tonne (US$/t) 86 89 93 87 83 88 85 83
Commenting, Mr. Lakshmi N. Mittal, ArcelorMittal Chairman and CEO, said:
“Stronger steel demand, particularly in our core markets of Europe and the US, drove an 8.5% improvement in 2014 underlying EBITDA, despite the lower iron-ore price. The business benefited from a 3% increase in steel shipments, an increase in marketable iron-ore shipments, and the result of cost optimization and restructuring efforts. Net debt
Page 3 of 20
reached $15.8 billion, the lowest level since the onset of the economic crisis, demonstrating continued progress towards our medium term target of $15.0 billion. For 2015, although operating conditions remain tough we expect steel markets to continue to improve, particularly for high value-added products such as automotive, where ArcelorMittal is a world leader.”
Fourth quarter 2014 earnings analyst conference call ArcelorMittal management will host a conference call for members of the investment community to discuss the three- and twelve-month periods ended December 31, 2014 on:
Date US Eastern time London CET
Friday February 13, 2015
9.30am 2.30pm 3.30pm
The dial in numbers:
Location Toll free dial in numbers
Local dial in numbers Participant
UK local: 0800 051 5931 +44 (0)203 364 5807 37787356#
USA local: +1 866 719 2729 +1 240 645 0345 37787356#
France: 0800 914780 +33 17071 2916 37787356#
Germany: 0800 965 6288 +49 692 7134 0801 37787356#
Spain: 90 099 4930 +34 911 143436 37787356#
Luxembourg: 800 26908 +352 27 86 05 07 37787356#
A replay of the conference call will be available for one week by dialing:
Number Language Access code
+49 (0) 1805 2043 089
English 446907#
The conference call will include a brief question and answer session with senior management. The presentation will be available via a live video webcast on http://corporate.arcelormittal.com.
Forward-Looking Statements
This document may contain forward-looking information and statements about ArcelorMittal and its subsidiaries. These statements include financial projections and estimates and their underlying assumptions, statements regarding plans, objectives and expectations with respect to future operations, products and services, and statements regarding future performance. Forward-looking statements may be identified by the words “believe,” “expect,” “anticipate,” “target” or similar expressions. Although ArcelorMittal’s management believes that the expectations reflected in such forward-looking statements are reasonable, investors and holders of ArcelorMittal’s securities are cautioned that forward-looking information and statements are subject to numerous risks and uncertainties, many of which are difficult to predict and generally beyond the control of ArcelorMittal, that could cause actual results and developments to differ materially and adversely from those expressed in, or implied or projected by, the forward-looking information and statements. These risks and uncertainties include those discussed or identified in the filings with the Luxembourg Stock Market Authority for the Financial Markets (Commission de Surveillance du Secteur Financier) and the United States Securities and Exchange Commission (the “SEC”) made or to be made by ArcelorMittal, including ArcelorMittal’s Annual Report on Form 20-F for the year ended December 31, 2013 filed with the SEC and with respect to Items 3, 4, 5, 6 and 18 of such Annual Report on Form 20-F, such Items have been retrospectively adjusted to reflect the retrospective application of changes in its segment information, which can be found in the current report on Form 6-K filed with the SEC on August 5, 2014. ArcelorMittal undertakes no obligation to publicly update its forward-looking statements, whether as a result of new information, future events, or otherwise.
About ArcelorMittal
ArcelorMittal is the world's leading steel and mining company, with a presence in more than 60 countries and an industrial footprint in over 20 countries. Guided by a philosophy to produce safe, sustainable steel, we are the leading supplier of quality
Page 4 of 20
steel in the major global steel markets including automotive, construction, household appliances and packaging, with world-class research and development and outstanding distribution networks. Through our core values of sustainability, quality and leadership, we operate responsibly with respect to the health, safety and wellbeing of our employees, contractors and the communities in which we operate. For us, steel is the fabric of life, as it is at the heart of the modern world from railways to cars and washing machines. We are actively researching and producing steel-based technologies and solutions that make many of the products and components we use in our everyday lives more energy-efficient. We are one of the world’s largest producers of iron ore and metallurgical coal and our mining business is an essential part of our growth strategy. With a geographically diversified portfolio of iron ore and coal assets, we are strategically positioned to serve our network of steel plants and the external global market. While our steel operations are important customers, our supply to the external market is increasing as we grow. In full year 2014, ArcelorMittal had revenues of $79.3 billion and crude steel production of 93.1 million tonnes, while own iron ore production reached 63.9 million tonnes. ArcelorMittal is listed on the stock exchanges of New York (MT), Amsterdam (MT), Paris (MT), Luxembourg (MT) and on the Spanish stock exchanges of Barcelona, Bilbao, Madrid and Valencia (MTS). For more information about ArcelorMittal please visit: http://corproate.arcelormittal.com.
Enquiries
ArcelorMittal Investor Relations
Europe Tel: +352 4792 2652
Americas Tel: +1 312 899 3985
Retail Tel: +352 4792 3198
SRI Tel: +44 207 543 1128
Bonds/Credit Tel: +33 1 71 92 10 26
ArcelorMittal Corporate Communications E-mail: [email protected]
Tel: +352 4792 5000
Sophie Evans Tel: +44 203 214 2882
Laura Nutt Tel: +44 207 543 1125
France Image 7: Sylvie Dumaine Tel: +33 1 53 70 94 17
United Kingdom Maitland Consultancy: Martin Leeburn Tel: +44 20 7379 5151
Page 5 of 20
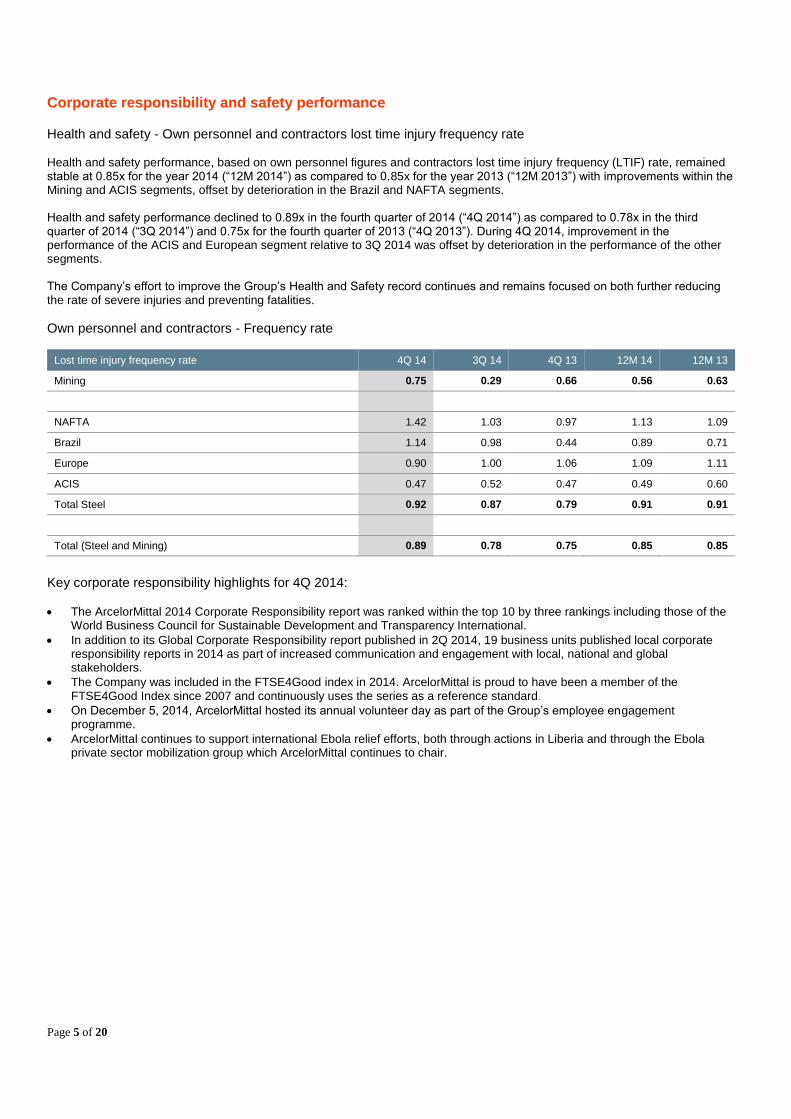
Corporate responsibility and safety performance Health and safety - Own personnel and contractors lost time injury frequency rate
Health and safety performance, based on own personnel figures and contractors lost time injury frequency (LTIF) rate, remained stable at 0.85x for the year 2014 (“12M 2014”) as compared to 0.85x for the year 2013 (“12M 2013”) with improvements within the Mining and ACIS segments, offset by deterioration in the Brazil and NAFTA segments. Health and safety performance declined to 0.89x in the fourth quarter of 2014 (“4Q 2014”) as compared to 0.78x in the third quarter of 2014 (“3Q 2014”) and 0.75x for the fourth quarter of 2013 (“4Q 2013”). During 4Q 2014, improvement in the performance of the ACIS and European segment relative to 3Q 2014 was offset by deterioration in the performance of the other segments. The Company’s effort to improve the Group’s Health and Safety record continues and remains focused on both further reducing the rate of severe injuries and preventing fatalities.
Own personnel and contractors - Frequency rate
Lost time injury frequency rate 4Q 14 3Q 14 4Q 13 12M 14 12M 13
Mining 0.75 0.29 0.66 0.56 0.63
NAFTA 1.42 1.03 0.97 1.13 1.09
Brazil 1.14 0.98 0.44 0.89 0.71
Europe 0.90 1.00 1.06 1.09 1.11
ACIS 0.47 0.52 0.47 0.49 0.60
Total Steel 0.92 0.87 0.79 0.91 0.91
Total (Steel and Mining) 0.89 0.78 0.75 0.85 0.85
Key corporate responsibility highlights for 4Q 2014:
The ArcelorMittal 2014 Corporate Responsibility report was ranked within the top 10 by three rankings including those of the World Business Council for Sustainable Development and Transparency International.
In addition to its Global Corporate Responsibility report published in 2Q 2014, 19 business units published local corporate responsibility reports in 2014 as part of increased communication and engagement with local, national and global stakeholders.
The Company was included in the FTSE4Good index in 2014. ArcelorMittal is proud to have been a member of the FTSE4Good Index since 2007 and continuously uses the series as a reference standard.
On December 5, 2014, ArcelorMittal hosted its annual volunteer day as part of the Group’s employee engagement programme.
ArcelorMittal continues to support international Ebola relief efforts, both through actions in Liberia and through the Ebola private sector mobilization group which ArcelorMittal continues to chair.
Page 6 of 20
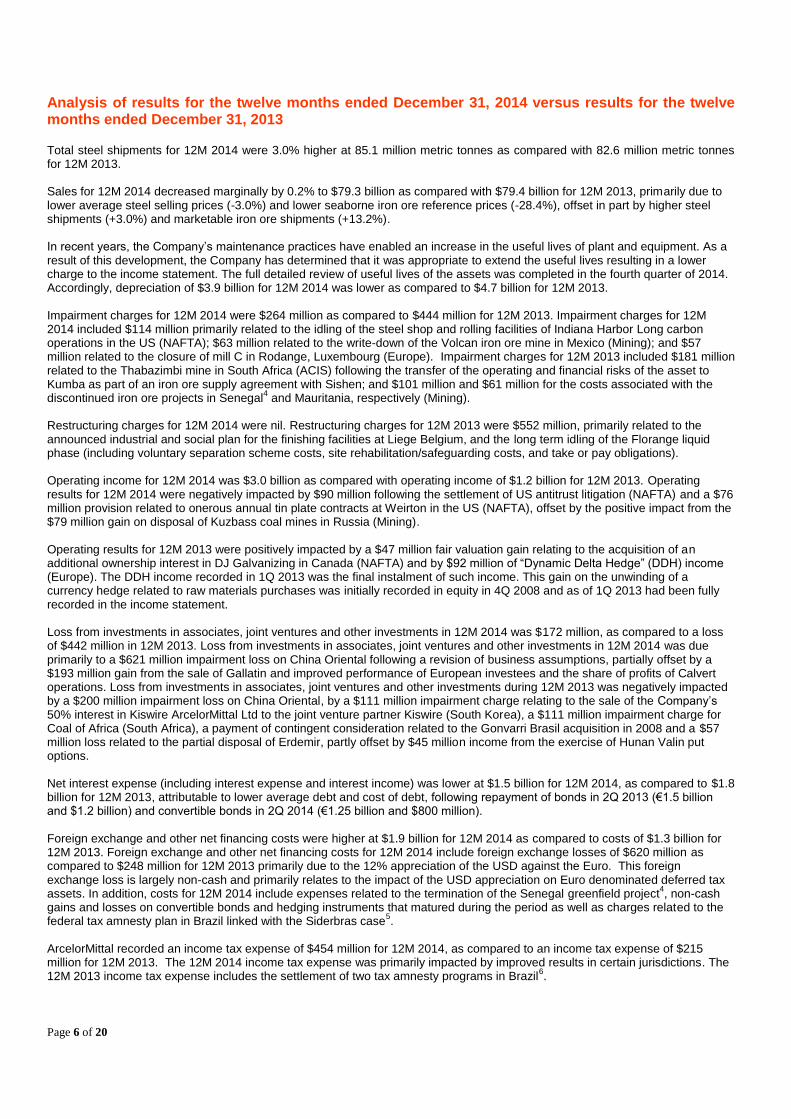
Analysis of results for the twelve months ended December 31, 2014 versus results for the twelve months ended December 31, 2013 Total steel shipments for 12M 2014 were 3.0% higher at 85.1 million metric tonnes as compared with 82.6 million metric tonnes for 12M 2013. Sales for 12M 2014 decreased marginally by 0.2% to $79.3 billion as compared with $79.4 billion for 12M 2013, primarily due to lower average steel selling prices (-3.0%) and lower seaborne iron ore reference prices (-28.4%), offset in part by higher steel shipments (+3.0%) and marketable iron ore shipments (+13.2%). In recent years, the Company’s maintenance practices have enabled an increase in the useful lives of plant and equipment. As a result of this development, the Company has determined that it was appropriate to extend the useful lives resulting in a lower charge to the income statement. The full detailed review of useful lives of the assets was completed in the fourth quarter of 2014. Accordingly, depreciation of $3.9 billion for 12M 2014 was lower as compared to $4.7 billion for 12M 2013. Impairment charges for 12M 2014 were $264 million as compared to $444 million for 12M 2013. Impairment charges for 12M 2014 included $114 million primarily related to the idling of the steel shop and rolling facilities of Indiana Harbor Long carbon operations in the US (NAFTA); $63 million related to the write-down of the Volcan iron ore mine in Mexico (Mining); and $57 million related to the closure of mill C in Rodange, Luxembourg (Europe). Impairment charges for 12M 2013 included $181 million related to the Thabazimbi mine in South Africa (ACIS) following the transfer of the operating and financial risks of the asset to Kumba as part of an iron ore supply agreement with Sishen; and $101 million and $61 million for the costs associated with the discontinued iron ore projects in Senegal
4 and Mauritania, respectively (Mining).
Restructuring charges for 12M 2014 were nil. Restructuring charges for 12M 2013 were $552 million, primarily related to the announced industrial and social plan for the finishing facilities at Liege Belgium, and the long term idling of the Florange liquid phase (including voluntary separation scheme costs, site rehabilitation/safeguarding costs, and take or pay obligations). Operating income for 12M 2014 was $3.0 billion as compared with operating income of $1.2 billion for 12M 2013. Operating results for 12M 2014 were negatively impacted by $90 million following the settlement of US antitrust litigation (NAFTA) and a $76 million provision related to onerous annual tin plate contracts at Weirton in the US (NAFTA), offset by the positive impact from the $79 million gain on disposal of Kuzbass coal mines in Russia (Mining). Operating results for 12M 2013 were positively impacted by a $47 million fair valuation gain relating to the acquisition of an additional ownership interest in DJ Galvanizing in Canada (NAFTA) and by $92 million of “Dynamic Delta Hedge” (DDH) income (Europe). The DDH income recorded in 1Q 2013 was the final instalment of such income. This gain on the unwinding of a currency hedge related to raw materials purchases was initially recorded in equity in 4Q 2008 and as of 1Q 2013 had been fully recorded in the income statement. Loss from investments in associates, joint ventures and other investments in 12M 2014 was $172 million, as compared to a loss of $442 million in 12M 2013. Loss from investments in associates, joint ventures and other investments in 12M 2014 was due primarily to a $621 million impairment loss on China Oriental following a revision of business assumptions, partially offset by a $193 million gain from the sale of Gallatin and improved performance of European investees and the share of profits of Calvert operations. Loss from investments in associates, joint ventures and other investments during 12M 2013 was negatively impacted by a $200 million impairment loss on China Oriental, by a $111 million impairment charge relating to the sale of the Company’s 50% interest in Kiswire ArcelorMittal Ltd to the joint venture partner Kiswire (South Korea), a $111 million impairment charge for Coal of Africa (South Africa), a payment of contingent consideration related to the Gonvarri Brasil acquisition in 2008 and a $57 million loss related to the partial disposal of Erdemir, partly offset by $45 million income from the exercise of Hunan Valin put options. Net interest expense (including interest expense and interest income) was lower at $1.5 billion for 12M 2014, as compared to $1.8 billion for 12M 2013, attributable to lower average debt and cost of debt, following repayment of bonds in 2Q 2013 (€1.5 billion and $1.2 billion) and convertible bonds in 2Q 2014 (€1.25 billion and $800 million). Foreign exchange and other net financing costs were higher at $1.9 billion for 12M 2014 as compared to costs of $1.3 billion for 12M 2013. Foreign exchange and other net financing costs for 12M 2014 include foreign exchange losses of $620 million as compared to $248 million for 12M 2013 primarily due to the 12% appreciation of the USD against the Euro. This foreign exchange loss is largely non-cash and primarily relates to the impact of the USD appreciation on Euro denominated deferred tax assets. In addition, costs for 12M 2014 include expenses related to the termination of the Senegal greenfield project
4, non-cash
gains and losses on convertible bonds and hedging instruments that matured during the period as well as charges related to the federal tax amnesty plan in Brazil linked with the Siderbras case
5.
ArcelorMittal recorded an income tax expense of $454 million for 12M 2014, as compared to an income tax expense of $215 million for 12M 2013. The 12M 2014 income tax expense was primarily impacted by improved results in certain jurisdictions. The 12M 2013 income tax expense includes the settlement of two tax amnesty programs in Brazil
6.
Page 7 of 20
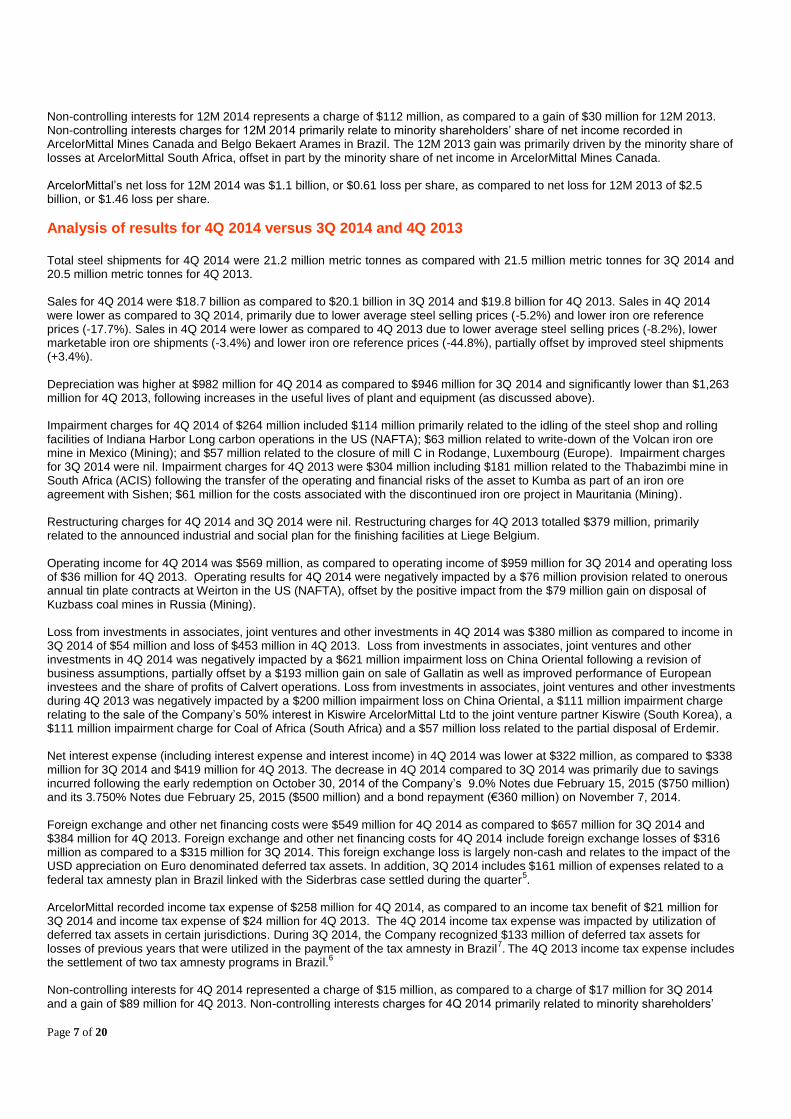
Non-controlling interests for 12M 2014 represents a charge of $112 million, as compared to a gain of $30 million for 12M 2013. Non-controlling interests charges for 12M 2014 primarily relate to minority shareholders’ share of net income recorded in ArcelorMittal Mines Canada and Belgo Bekaert Arames in Brazil. The 12M 2013 gain was primarily driven by the minority share of losses at ArcelorMittal South Africa, offset in part by the minority share of net income in ArcelorMittal Mines Canada. ArcelorMittal’s net loss for 12M 2014 was $1.1 billion, or $0.61 loss per share, as compared to net loss for 12M 2013 of $2.5 billion, or $1.46 loss per share.
Analysis of results for 4Q 2014 versus 3Q 2014 and 4Q 2013 Total steel shipments for 4Q 2014 were 21.2 million metric tonnes as compared with 21.5 million metric tonnes for 3Q 2014 and 20.5 million metric tonnes for 4Q 2013. Sales for 4Q 2014 were $18.7 billion as compared to $20.1 billion in 3Q 2014 and $19.8 billion for 4Q 2013. Sales in 4Q 2014 were lower as compared to 3Q 2014, primarily due to lower average steel selling prices (-5.2%) and lower iron ore reference prices (-17.7%). Sales in 4Q 2014 were lower as compared to 4Q 2013 due to lower average steel selling prices (-8.2%), lower marketable iron ore shipments (-3.4%) and lower iron ore reference prices (-44.8%), partially offset by improved steel shipments (+3.4%). Depreciation was higher at $982 million for 4Q 2014 as compared to $946 million for 3Q 2014 and significantly lower than $1,263 million for 4Q 2013, following increases in the useful lives of plant and equipment (as discussed above). Impairment charges for 4Q 2014 of $264 million included $114 million primarily related to the idling of the steel shop and rolling facilities of Indiana Harbor Long carbon operations in the US (NAFTA); $63 million related to write-down of the Volcan iron ore mine in Mexico (Mining); and $57 million related to the closure of mill C in Rodange, Luxembourg (Europe). Impairment charges for 3Q 2014 were nil. Impairment charges for 4Q 2013 were $304 million including $181 million related to the Thabazimbi mine in South Africa (ACIS) following the transfer of the operating and financial risks of the asset to Kumba as part of an iron ore agreement with Sishen; $61 million for the costs associated with the discontinued iron ore project in Mauritania (Mining). Restructuring charges for 4Q 2014 and 3Q 2014 were nil. Restructuring charges for 4Q 2013 totalled $379 million, primarily related to the announced industrial and social plan for the finishing facilities at Liege Belgium. Operating income for 4Q 2014 was $569 million, as compared to operating income of $959 million for 3Q 2014 and operating loss of $36 million for 4Q 2013. Operating results for 4Q 2014 were negatively impacted by a $76 million provision related to onerous annual tin plate contracts at Weirton in the US (NAFTA), offset by the positive impact from the $79 million gain on disposal of Kuzbass coal mines in Russia (Mining). Loss from investments in associates, joint ventures and other investments in 4Q 2014 was $380 million as compared to income in 3Q 2014 of $54 million and loss of $453 million in 4Q 2013. Loss from investments in associates, joint ventures and other investments in 4Q 2014 was negatively impacted by a $621 million impairment loss on China Oriental following a revision of business assumptions, partially offset by a $193 million gain on sale of Gallatin as well as improved performance of European investees and the share of profits of Calvert operations. Loss from investments in associates, joint ventures and other investments during 4Q 2013 was negatively impacted by a $200 million impairment loss on China Oriental, a $111 million impairment charge relating to the sale of the Company’s 50% interest in Kiswire ArcelorMittal Ltd to the joint venture partner Kiswire (South Korea), a $111 million impairment charge for Coal of Africa (South Africa) and a $57 million loss related to the partial disposal of Erdemir. Net interest expense (including interest expense and interest income) in 4Q 2014 was lower at $322 million, as compared to $338 million for 3Q 2014 and $419 million for 4Q 2013. The decrease in 4Q 2014 compared to 3Q 2014 was primarily due to savings incurred following the early redemption on October 30, 2014 of the Company’s 9.0% Notes due February 15, 2015 ($750 million) and its 3.750% Notes due February 25, 2015 ($500 million) and a bond repayment (€360 million) on November 7, 2014. Foreign exchange and other net financing costs were $549 million for 4Q 2014 as compared to $657 million for 3Q 2014 and $384 million for 4Q 2013. Foreign exchange and other net financing costs for 4Q 2014 include foreign exchange losses of $316 million as compared to a $315 million for 3Q 2014. This foreign exchange loss is largely non-cash and relates to the impact of the USD appreciation on Euro denominated deferred tax assets. In addition, 3Q 2014 includes $161 million of expenses related to a federal tax amnesty plan in Brazil linked with the Siderbras case settled during the quarter
5.
ArcelorMittal recorded income tax expense of $258 million for 4Q 2014, as compared to an income tax benefit of $21 million for 3Q 2014 and income tax expense of $24 million for 4Q 2013. The 4Q 2014 income tax expense was impacted by utilization of deferred tax assets in certain jurisdictions. During 3Q 2014, the Company recognized $133 million of deferred tax assets for losses of previous years that were utilized in the payment of the tax amnesty in Brazil
7. The 4Q 2013 income tax expense includes
the settlement of two tax amnesty programs in Brazil.6
Non-controlling interests for 4Q 2014 represented a charge of $15 million, as compared to a charge of $17 million for 3Q 2014 and a gain of $89 million for 4Q 2013. Non-controlling interests charges for 4Q 2014 primarily related to minority shareholders’
Page 8 of 20
share of net income recorded in ArcelorMittal Mines Canada, Belgo Bekaert Arames in Brazil and ArcelorMittal South Africa. Non-controlling interests charges for 3Q 2014 primarily related to minority shareholders’ share of net income recorded in ArcelorMittal Mines Canada and Belgo Bekaert Arames in Brazil, partially offset by losses generated by ArcelorMittal South Africa. ArcelorMittal recorded a net loss for 4Q 2014 of $955 million, or $0.53 loss per share, as compared to net income of $22 million, or $0.01 earnings per share for 3Q 2014, and a net loss of $1.2 billion, or $0.69 loss per share for 4Q 2013.
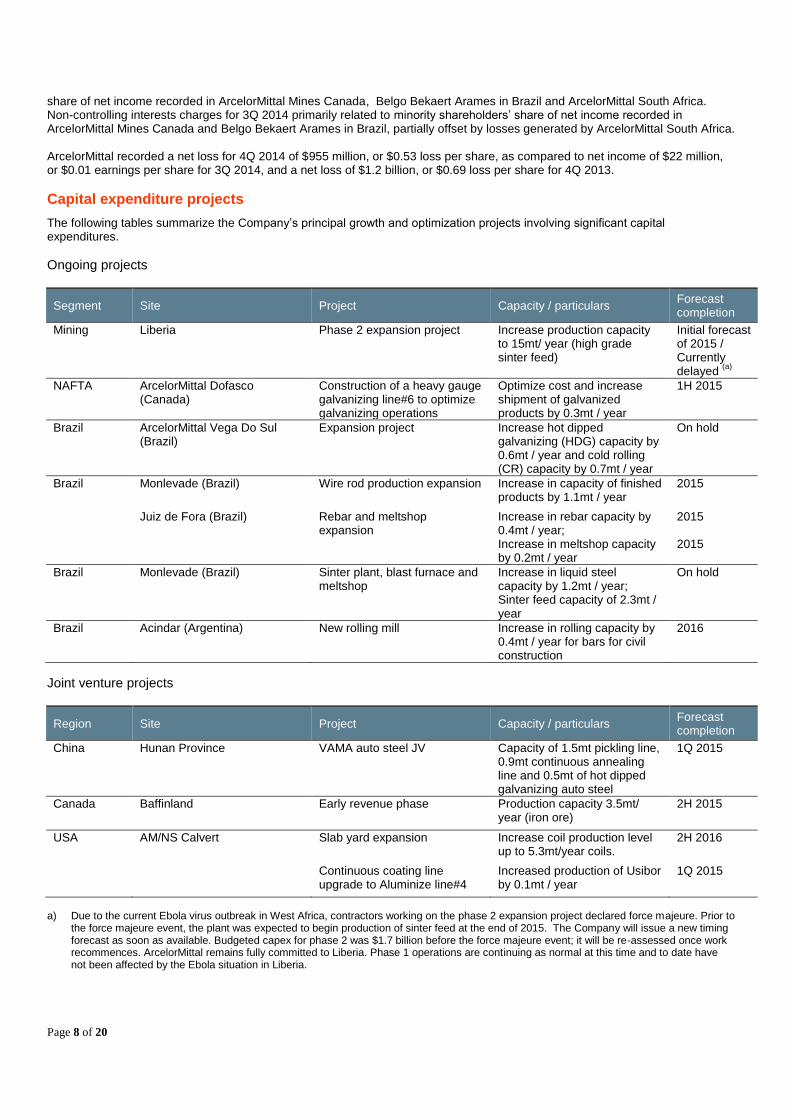
Capital expenditure projects
The following tables summarize the Company’s principal growth and optimization projects involving significant capital expenditures.
Ongoing projects
Segment Site Project Capacity / particulars Forecast completion
Mining Liberia Phase 2 expansion project Increase production capacity to 15mt/ year (high grade sinter feed)
Initial forecast of 2015 / Currently delayed
(a)
NAFTA ArcelorMittal Dofasco (Canada)
Construction of a heavy gauge galvanizing line#6 to optimize galvanizing operations
Optimize cost and increase shipment of galvanized products by 0.3mt / year
1H 2015
Brazil ArcelorMittal Vega Do Sul (Brazil)
Expansion project Increase hot dipped galvanizing (HDG) capacity by 0.6mt / year and cold rolling (CR) capacity by 0.7mt / year
On hold
Brazil Monlevade (Brazil) Wire rod production expansion Increase in capacity of finished products by 1.1mt / year
2015
Juiz de Fora (Brazil) Rebar and meltshop expansion
Increase in rebar capacity by 0.4mt / year; Increase in meltshop capacity by 0.2mt / year
2015 2015
Brazil Monlevade (Brazil) Sinter plant, blast furnace and meltshop
Increase in liquid steel capacity by 1.2mt / year; Sinter feed capacity of 2.3mt / year
On hold
Brazil Acindar (Argentina) New rolling mill Increase in rolling capacity by 0.4mt / year for bars for civil construction
2016
Joint venture projects
Region Site Project Capacity / particulars Forecast completion
China Hunan Province VAMA auto steel JV Capacity of 1.5mt pickling line, 0.9mt continuous annealing line and 0.5mt of hot dipped galvanizing auto steel
1Q 2015
Canada Baffinland Early revenue phase Production capacity 3.5mt/ year (iron ore)
2H 2015
USA AM/NS Calvert Slab yard expansion Increase coil production level up to 5.3mt/year coils.
2H 2016
Continuous coating line upgrade to Aluminize line#4
Increased production of Usibor by 0.1mt / year
1Q 2015
a) Due to the current Ebola virus outbreak in West Africa, contractors working on the phase 2 expansion project declared force majeure. Prior to
the force majeure event, the plant was expected to begin production of sinter feed at the end of 2015. The Company will issue a new timing forecast as soon as available. Budgeted capex for phase 2 was $1.7 billion before the force majeure event; it will be re-assessed once work recommences. ArcelorMittal remains fully committed to Liberia. Phase 1 operations are continuing as normal at this time and to date have not been affected by the Ebola situation in Liberia.
Page 9 of 20
Analysis of segment operations
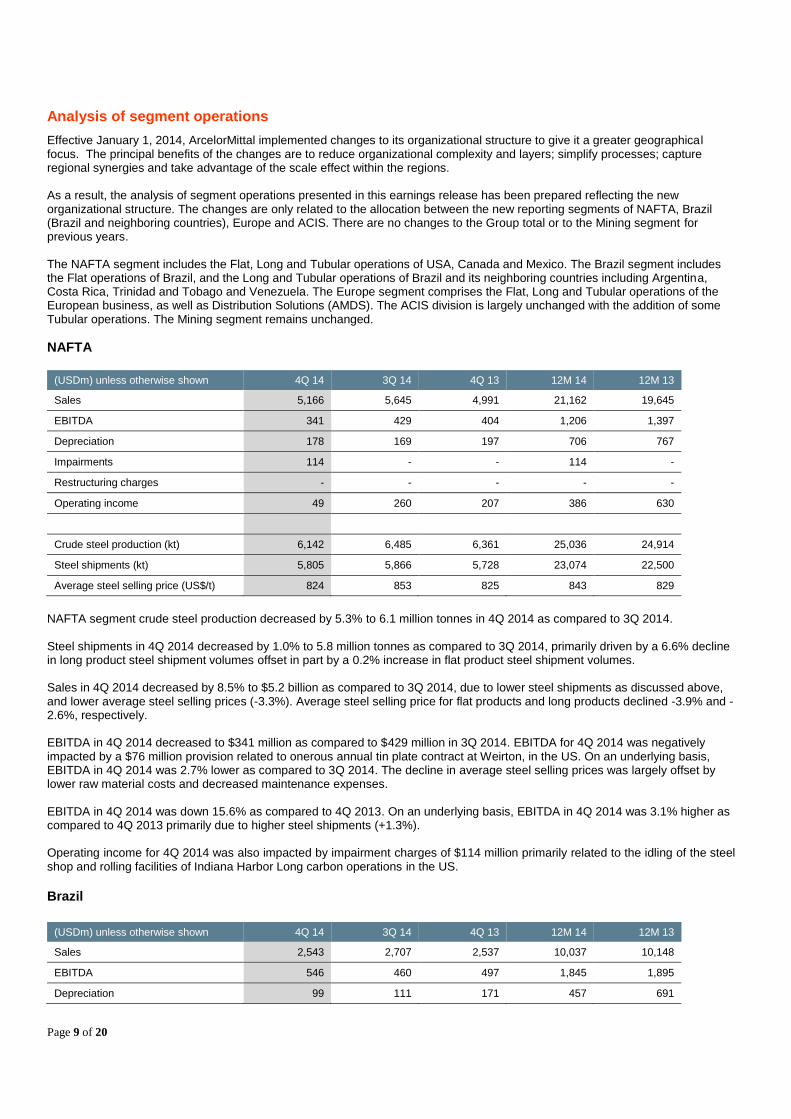
Effective January 1, 2014, ArcelorMittal implemented changes to its organizational structure to give it a greater geographical focus. The principal benefits of the changes are to reduce organizational complexity and layers; simplify processes; capture regional synergies and take advantage of the scale effect within the regions. As a result, the analysis of segment operations presented in this earnings release has been prepared reflecting the new organizational structure. The changes are only related to the allocation between the new reporting segments of NAFTA, Brazil (Brazil and neighboring countries), Europe and ACIS. There are no changes to the Group total or to the Mining segment for previous years. The NAFTA segment includes the Flat, Long and Tubular operations of USA, Canada and Mexico. The Brazil segment includes the Flat operations of Brazil, and the Long and Tubular operations of Brazil and its neighboring countries including Argentina, Costa Rica, Trinidad and Tobago and Venezuela. The Europe segment comprises the Flat, Long and Tubular operations of the European business, as well as Distribution Solutions (AMDS). The ACIS division is largely unchanged with the addition of some Tubular operations. The Mining segment remains unchanged.
NAFTA
(USDm) unless otherwise shown 4Q 14 3Q 14 4Q 13 12M 14 12M 13
Sales 5,166 5,645 4,991 21,162 19,645
EBITDA 341 429 404 1,206 1,397
Depreciation 178 169 197 706 767
Impairments 114 - - 114 -
Restructuring charges - - - - -
Operating income 49 260 207 386 630
Crude steel production (kt) 6,142 6,485 6,361 25,036 24,914
Steel shipments (kt) 5,805 5,866 5,728 23,074 22,500
Average steel selling price (US$/t) 824 853 825 843 829
NAFTA segment crude steel production decreased by 5.3% to 6.1 million tonnes in 4Q 2014 as compared to 3Q 2014. Steel shipments in 4Q 2014 decreased by 1.0% to 5.8 million tonnes as compared to 3Q 2014, primarily driven by a 6.6% decline in long product steel shipment volumes offset in part by a 0.2% increase in flat product steel shipment volumes. Sales in 4Q 2014 decreased by 8.5% to $5.2 billion as compared to 3Q 2014, due to lower steel shipments as discussed above, and lower average steel selling prices (-3.3%). Average steel selling price for flat products and long products declined -3.9% and -2.6%, respectively. EBITDA in 4Q 2014 decreased to $341 million as compared to $429 million in 3Q 2014. EBITDA for 4Q 2014 was negatively impacted by a $76 million provision related to onerous annual tin plate contract at Weirton, in the US. On an underlying basis, EBITDA in 4Q 2014 was 2.7% lower as compared to 3Q 2014. The decline in average steel selling prices was largely offset by lower raw material costs and decreased maintenance expenses. EBITDA in 4Q 2014 was down 15.6% as compared to 4Q 2013. On an underlying basis, EBITDA in 4Q 2014 was 3.1% higher as compared to 4Q 2013 primarily due to higher steel shipments (+1.3%). Operating income for 4Q 2014 was also impacted by impairment charges of $114 million primarily related to the idling of the steel shop and rolling facilities of Indiana Harbor Long carbon operations in the US. Brazil
(USDm) unless otherwise shown 4Q 14 3Q 14 4Q 13 12M 14 12M 13
Sales 2,543 2,707 2,537 10,037 10,148
EBITDA 546 460 497 1,845 1,895
Depreciation 99 111 171 457 691
Page 10 of 20
Impairments - - - - -
Restructuring charges - - - - -
Operating income 447 349 326 1,388 1,204
Crude steel production (kt) 2,758 2,971 2,450 10,524 9,987
Steel shipments (kt) 2,895 2,844 2,344 10,376 9,797
Average steel selling price (US$/t) 792 866 987 867 940
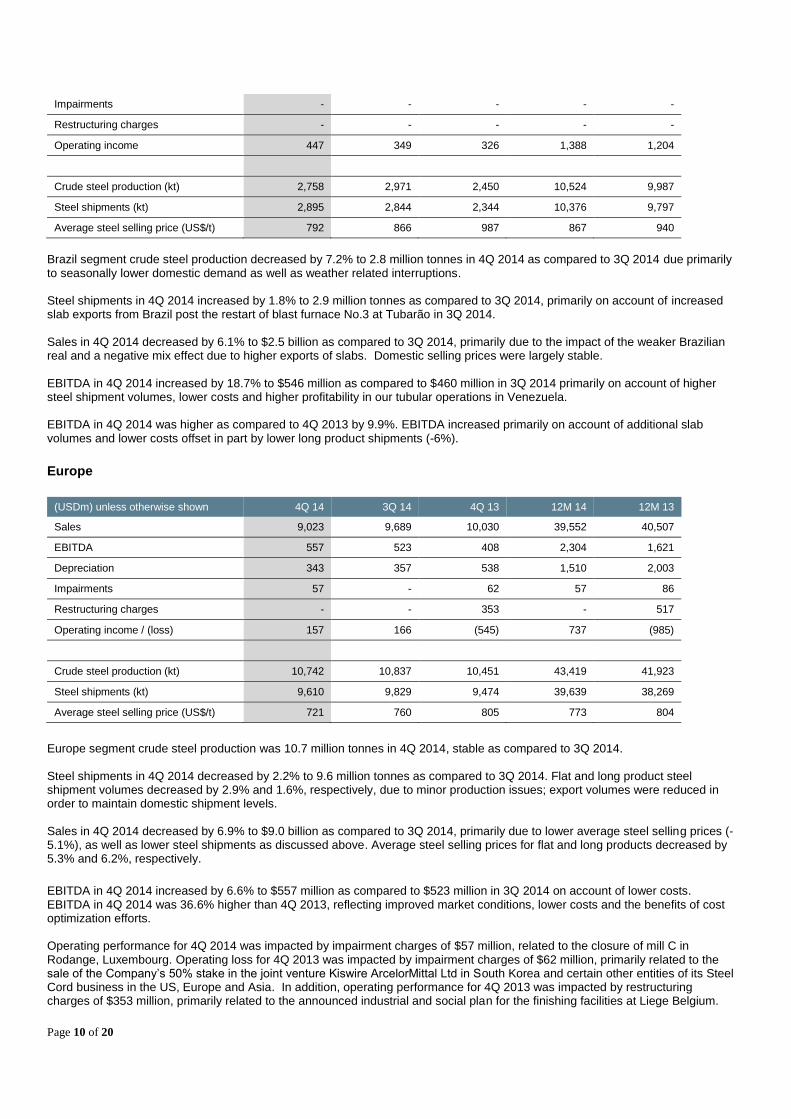
Brazil segment crude steel production decreased by 7.2% to 2.8 million tonnes in 4Q 2014 as compared to 3Q 2014 due primarily to seasonally lower domestic demand as well as weather related interruptions. Steel shipments in 4Q 2014 increased by 1.8% to 2.9 million tonnes as compared to 3Q 2014, primarily on account of increased slab exports from Brazil post the restart of blast furnace No.3 at Tubarão in 3Q 2014. Sales in 4Q 2014 decreased by 6.1% to $2.5 billion as compared to 3Q 2014, primarily due to the impact of the weaker Brazilian real and a negative mix effect due to higher exports of slabs. Domestic selling prices were largely stable. EBITDA in 4Q 2014 increased by 18.7% to $546 million as compared to $460 million in 3Q 2014 primarily on account of higher steel shipment volumes, lower costs and higher profitability in our tubular operations in Venezuela. EBITDA in 4Q 2014 was higher as compared to 4Q 2013 by 9.9%. EBITDA increased primarily on account of additional slab volumes and lower costs offset in part by lower long product shipments (-6%).
Europe
(USDm) unless otherwise shown 4Q 14 3Q 14 4Q 13 12M 14 12M 13
Sales 9,023 9,689 10,030 39,552 40,507
EBITDA 557 523 408 2,304 1,621
Depreciation 343 357 538 1,510 2,003
Impairments 57 - 62 57 86
Restructuring charges - - 353 - 517
Operating income / (loss) 157 166 (545) 737 (985)
Crude steel production (kt) 10,742 10,837 10,451 43,419 41,923
Steel shipments (kt) 9,610 9,829 9,474 39,639 38,269
Average steel selling price (US$/t) 721 760 805 773 804
Europe segment crude steel production was 10.7 million tonnes in 4Q 2014, stable as compared to 3Q 2014. Steel shipments in 4Q 2014 decreased by 2.2% to 9.6 million tonnes as compared to 3Q 2014. Flat and long product steel shipment volumes decreased by 2.9% and 1.6%, respectively, due to minor production issues; export volumes were reduced in order to maintain domestic shipment levels. Sales in 4Q 2014 decreased by 6.9% to $9.0 billion as compared to 3Q 2014, primarily due to lower average steel selling prices (-5.1%), as well as lower steel shipments as discussed above. Average steel selling prices for flat and long products decreased by 5.3% and 6.2%, respectively.
EBITDA in 4Q 2014 increased by 6.6% to $557 million as compared to $523 million in 3Q 2014 on account of lower costs. EBITDA in 4Q 2014 was 36.6% higher than 4Q 2013, reflecting improved market conditions, lower costs and the benefits of cost optimization efforts. Operating performance for 4Q 2014 was impacted by impairment charges of $57 million, related to the closure of mill C in Rodange, Luxembourg. Operating loss for 4Q 2013 was impacted by impairment charges of $62 million, primarily related to the sale of the Company’s 50% stake in the joint venture Kiswire ArcelorMittal Ltd in South Korea and certain other entities of its Steel Cord business in the US, Europe and Asia. In addition, operating performance for 4Q 2013 was impacted by restructuring charges of $353 million, primarily related to the announced industrial and social plan for the finishing facilities at Liege Belgium.
Page 11 of 20
ACIS
(USDm) unless otherwise shown 4Q 14 3Q 14 4Q 13 12M 14 12M 13
Sales 1,967 1,994 1,975 8,268 8,419
EBITDA 147 208 54 620 314
Depreciation 135 130 142 525 542
Impairments - - 181 - 196
Restructuring charges - - 24 - 33
Operating income / (loss) 12 78 (293) 95 (457)
Crude steel production (kt) 3,519 3,616 3,726 14,148 14,362
Steel shipments (kt) 3,111 3,229 3,009 12,833 12,422
Average steel selling price (US$/t) 550 594 593 576 613
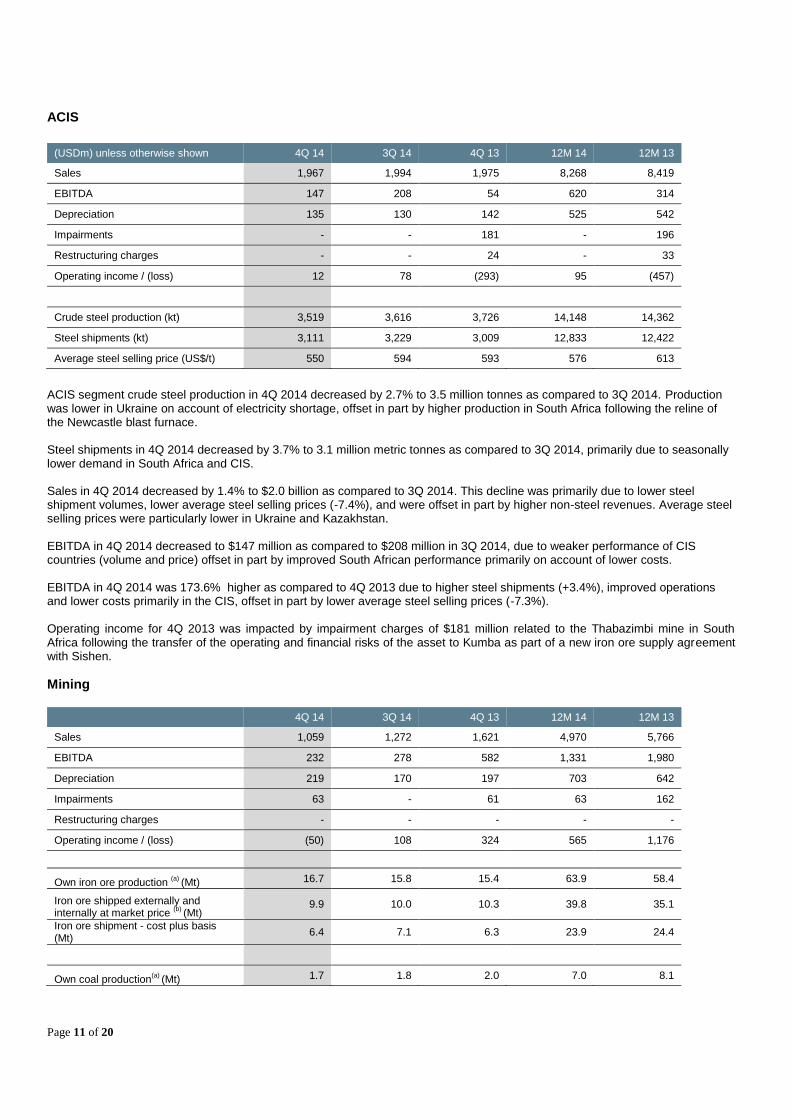
ACIS segment crude steel production in 4Q 2014 decreased by 2.7% to 3.5 million tonnes as compared to 3Q 2014. Production was lower in Ukraine on account of electricity shortage, offset in part by higher production in South Africa following the reline of the Newcastle blast furnace. Steel shipments in 4Q 2014 decreased by 3.7% to 3.1 million metric tonnes as compared to 3Q 2014, primarily due to seasonally lower demand in South Africa and CIS. Sales in 4Q 2014 decreased by 1.4% to $2.0 billion as compared to 3Q 2014. This decline was primarily due to lower steel shipment volumes, lower average steel selling prices (-7.4%), and were offset in part by higher non-steel revenues. Average steel selling prices were particularly lower in Ukraine and Kazakhstan. EBITDA in 4Q 2014 decreased to $147 million as compared to $208 million in 3Q 2014, due to weaker performance of CIS countries (volume and price) offset in part by improved South African performance primarily on account of lower costs. EBITDA in 4Q 2014 was 173.6% higher as compared to 4Q 2013 due to higher steel shipments (+3.4%), improved operations and lower costs primarily in the CIS, offset in part by lower average steel selling prices (-7.3%). Operating income for 4Q 2013 was impacted by impairment charges of $181 million related to the Thabazimbi mine in South Africa following the transfer of the operating and financial risks of the asset to Kumba as part of a new iron ore supply agreement with Sishen.
Mining
4Q 14 3Q 14 4Q 13 12M 14 12M 13
Sales 1,059 1,272 1,621 4,970 5,766
EBITDA 232 278 582 1,331 1,980
Depreciation 219 170 197 703 642
Impairments 63 - 61 63 162
Restructuring charges - - - - -
Operating income / (loss) (50) 108 324 565 1,176
Own iron ore production (a)
(Mt) 16.7 15.8 15.4 63.9 58.4
Iron ore shipped externally and internally at market price
(b) (Mt)
9.9 10.0 10.3 39.8 35.1
Iron ore shipment - cost plus basis (Mt)
6.4 7.1 6.3 23.9 24.4
Own coal production(a)
(Mt) 1.7 1.8 2.0 7.0 8.1
Page 12 of 20
Coal shipped externally and internally at market price
(b) (Mt)
0.8 1.1 1.1 3.9 4.8
Coal shipment - cost plus basis (Mt) 0.9 0.8 0.8 3.3 2.9
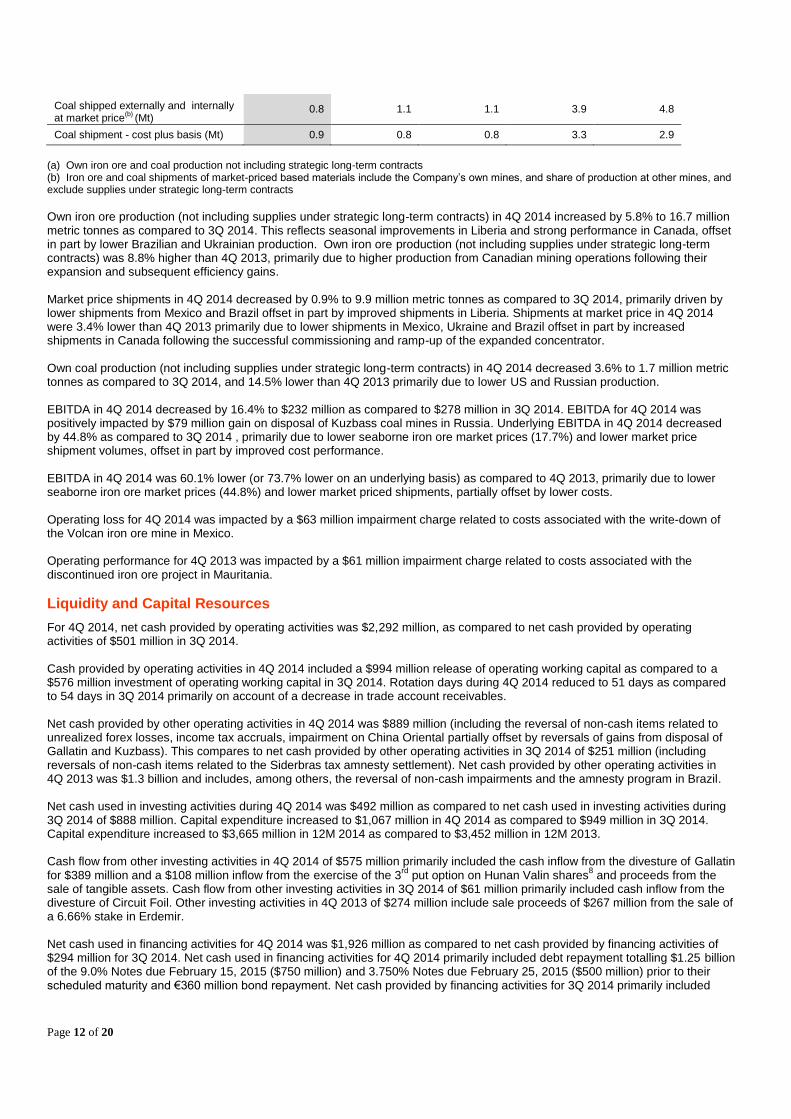
(a) Own iron ore and coal production not including strategic long-term contracts (b) Iron ore and coal shipments of market-priced based materials include the Company’s own mines, and share of production at other mines, and exclude supplies under strategic long-term contracts
Own iron ore production (not including supplies under strategic long-term contracts) in 4Q 2014 increased by 5.8% to 16.7 million metric tonnes as compared to 3Q 2014. This reflects seasonal improvements in Liberia and strong performance in Canada, offset in part by lower Brazilian and Ukrainian production. Own iron ore production (not including supplies under strategic long-term contracts) was 8.8% higher than 4Q 2013, primarily due to higher production from Canadian mining operations following their expansion and subsequent efficiency gains. Market price shipments in 4Q 2014 decreased by 0.9% to 9.9 million metric tonnes as compared to 3Q 2014, primarily driven by lower shipments from Mexico and Brazil offset in part by improved shipments in Liberia. Shipments at market price in 4Q 2014 were 3.4% lower than 4Q 2013 primarily due to lower shipments in Mexico, Ukraine and Brazil offset in part by increased shipments in Canada following the successful commissioning and ramp-up of the expanded concentrator. Own coal production (not including supplies under strategic long-term contracts) in 4Q 2014 decreased 3.6% to 1.7 million metric tonnes as compared to 3Q 2014, and 14.5% lower than 4Q 2013 primarily due to lower US and Russian production. EBITDA in 4Q 2014 decreased by 16.4% to $232 million as compared to $278 million in 3Q 2014. EBITDA for 4Q 2014 was positively impacted by $79 million gain on disposal of Kuzbass coal mines in Russia. Underlying EBITDA in 4Q 2014 decreased by 44.8% as compared to 3Q 2014 , primarily due to lower seaborne iron ore market prices (17.7%) and lower market price shipment volumes, offset in part by improved cost performance. EBITDA in 4Q 2014 was 60.1% lower (or 73.7% lower on an underlying basis) as compared to 4Q 2013, primarily due to lower seaborne iron ore market prices (44.8%) and lower market priced shipments, partially offset by lower costs. Operating loss for 4Q 2014 was impacted by a $63 million impairment charge related to costs associated with the write-down of the Volcan iron ore mine in Mexico. Operating performance for 4Q 2013 was impacted by a $61 million impairment charge related to costs associated with the discontinued iron ore project in Mauritania.
Liquidity and Capital Resources
For 4Q 2014, net cash provided by operating activities was $2,292 million, as compared to net cash provided by operating activities of $501 million in 3Q 2014. Cash provided by operating activities in 4Q 2014 included a $994 million release of operating working capital as compared to a $576 million investment of operating working capital in 3Q 2014. Rotation days during 4Q 2014 reduced to 51 days as compared to 54 days in 3Q 2014 primarily on account of a decrease in trade account receivables. Net cash provided by other operating activities in 4Q 2014 was $889 million (including the reversal of non-cash items related to unrealized forex losses, income tax accruals, impairment on China Oriental partially offset by reversals of gains from disposal of Gallatin and Kuzbass). This compares to net cash provided by other operating activities in 3Q 2014 of $251 million (including reversals of non-cash items related to the Siderbras tax amnesty settlement). Net cash provided by other operating activities in 4Q 2013 was $1.3 billion and includes, among others, the reversal of non-cash impairments and the amnesty program in Brazil. Net cash used in investing activities during 4Q 2014 was $492 million as compared to net cash used in investing activities during 3Q 2014 of $888 million. Capital expenditure increased to $1,067 million in 4Q 2014 as compared to $949 million in 3Q 2014. Capital expenditure increased to $3,665 million in 12M 2014 as compared to $3,452 million in 12M 2013. Cash flow from other investing activities in 4Q 2014 of $575 million primarily included the cash inflow from the divesture of Gallatin for $389 million and a $108 million inflow from the exercise of the 3
rd put option on Hunan Valin shares
8 and proceeds from the
sale of tangible assets. Cash flow from other investing activities in 3Q 2014 of $61 million primarily included cash inflow from the divesture of Circuit Foil. Other investing activities in 4Q 2013 of $274 million include sale proceeds of $267 million from the sale of a 6.66% stake in Erdemir. Net cash used in financing activities for 4Q 2014 was $1,926 million as compared to net cash provided by financing activities of $294 million for 3Q 2014. Net cash used in financing activities for 4Q 2014 primarily included debt repayment totalling $1.25 billion of the 9.0% Notes due February 15, 2015 ($750 million) and 3.750% Notes due February 25, 2015 ($500 million) prior to their scheduled maturity and €360 million bond repayment. Net cash provided by financing activities for 3Q 2014 primarily included
Page 13 of 20
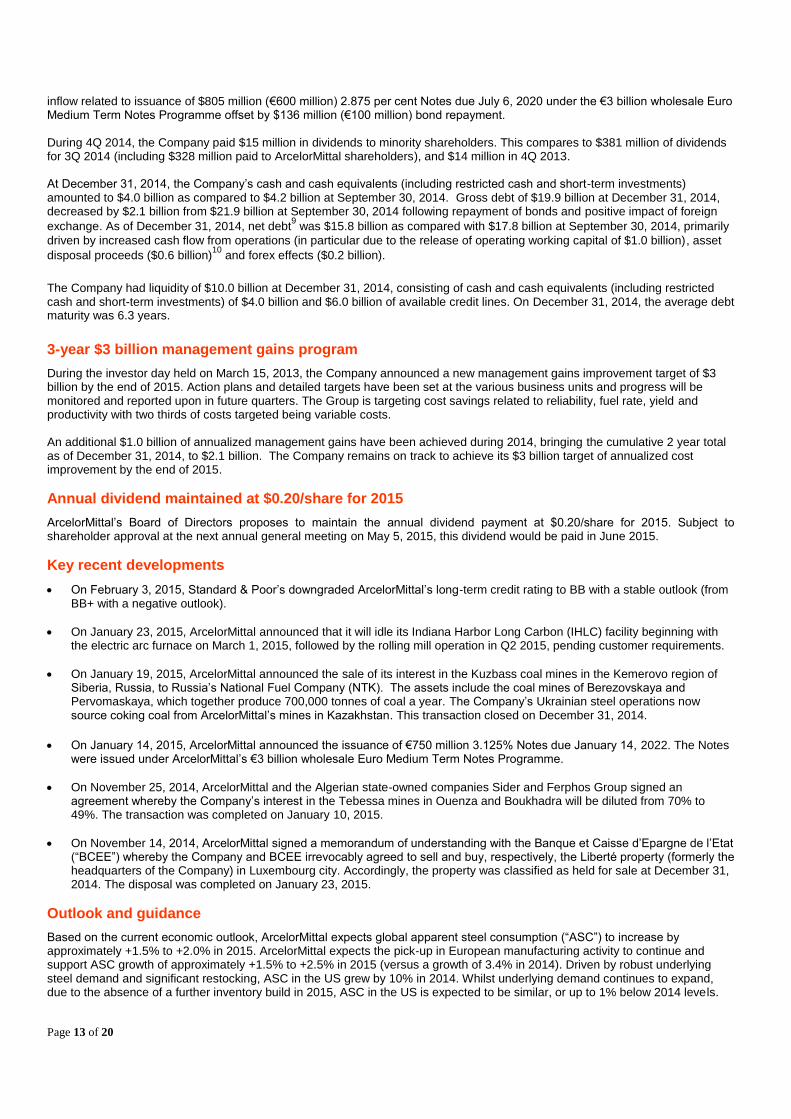
inflow related to issuance of $805 million (€600 million) 2.875 per cent Notes due July 6, 2020 under the €3 billion wholesale Euro Medium Term Notes Programme offset by $136 million (€100 million) bond repayment. During 4Q 2014, the Company paid $15 million in dividends to minority shareholders. This compares to $381 million of dividends for 3Q 2014 (including $328 million paid to ArcelorMittal shareholders), and $14 million in 4Q 2013. At December 31, 2014, the Company’s cash and cash equivalents (including restricted cash and short-term investments) amounted to $4.0 billion as compared to $4.2 billion at September 30, 2014. Gross debt of $19.9 billion at December 31, 2014, decreased by $2.1 billion from $21.9 billion at September 30, 2014 following repayment of bonds and positive impact of foreign
exchange. As of December 31, 2014, net debt9 was $15.8 billion as compared with $17.8 billion at September 30, 2014, primarily
driven by increased cash flow from operations (in particular due to the release of operating working capital of $1.0 billion), asset
disposal proceeds ($0.6 billion)10
and forex effects ($0.2 billion).
The Company had liquidity of $10.0 billion at December 31, 2014, consisting of cash and cash equivalents (including restricted
cash and short-term investments) of $4.0 billion and $6.0 billion of available credit lines. On December 31, 2014, the average debt maturity was 6.3 years.
3-year $3 billion management gains program
During the investor day held on March 15, 2013, the Company announced a new management gains improvement target of $3 billion by the end of 2015. Action plans and detailed targets have been set at the various business units and progress will be monitored and reported upon in future quarters. The Group is targeting cost savings related to reliability, fuel rate, yield and productivity with two thirds of costs targeted being variable costs. An additional $1.0 billion of annualized management gains have been achieved during 2014, bringing the cumulative 2 year total as of December 31, 2014, to $2.1 billion. The Company remains on track to achieve its $3 billion target of annualized cost improvement by the end of 2015.
Annual dividend maintained at $0.20/share for 2015
ArcelorMittal’s Board of Directors proposes to maintain the annual dividend payment at $0.20/share for 2015. Subject to shareholder approval at the next annual general meeting on May 5, 2015, this dividend would be paid in June 2015.
Key recent developments
On February 3, 2015, Standard & Poor’s downgraded ArcelorMittal’s long-term credit rating to BB with a stable outlook (from BB+ with a negative outlook).
On January 23, 2015, ArcelorMittal announced that it will idle its Indiana Harbor Long Carbon (IHLC) facility beginning with the electric arc furnace on March 1, 2015, followed by the rolling mill operation in Q2 2015, pending customer requirements.
On January 19, 2015, ArcelorMittal announced the sale of its interest in the Kuzbass coal mines in the Kemerovo region of Siberia, Russia, to Russia’s National Fuel Company (NTK). The assets include the coal mines of Berezovskaya and Pervomaskaya, which together produce 700,000 tonnes of coal a year. The Company’s Ukrainian steel operations now source coking coal from ArcelorMittal’s mines in Kazakhstan. This transaction closed on December 31, 2014.
On January 14, 2015, ArcelorMittal announced the issuance of €750 million 3.125% Notes due January 14, 2022. The Notes
were issued under ArcelorMittal’s €3 billion wholesale Euro Medium Term Notes Programme.
On November 25, 2014, ArcelorMittal and the Algerian state-owned companies Sider and Ferphos Group signed an agreement whereby the Company’s interest in the Tebessa mines in Ouenza and Boukhadra will be diluted from 70% to 49%. The transaction was completed on January 10, 2015.
On November 14, 2014, ArcelorMittal signed a memorandum of understanding with the Banque et Caisse d’Epargne de l’Etat (“BCEE”) whereby the Company and BCEE irrevocably agreed to sell and buy, respectively, the Liberté property (formerly the headquarters of the Company) in Luxembourg city. Accordingly, the property was classified as held for sale at December 31, 2014. The disposal was completed on January 23, 2015.
Outlook and guidance
Based on the current economic outlook, ArcelorMittal expects global apparent steel consumption (“ASC”) to increase by approximately +1.5% to +2.0% in 2015. ArcelorMittal expects the pick-up in European manufacturing activity to continue and support ASC growth of approximately +1.5% to +2.5% in 2015 (versus a growth of 3.4% in 2014). Driven by robust underlying steel demand and significant restocking, ASC in the US grew by 10% in 2014. Whilst underlying demand continues to expand, due to the absence of a further inventory build in 2015, ASC in the US is expected to be similar, or up to 1% below 2014 levels.

Page 14 of 20
Following a 6% decline in 2014, Brazil ASC is expected to grow by +1 to +2% in 2015. In China, we see signs of stabilization due to the government’s targeted stimulus, and expect steel demand growth in the range of +1.5% to +2.5% for 2015. While there remain risks to the global demand picture, given ArcelorMittal’s specific geographical and end market exposures, the Company expects its steel shipments to increase further in 2015 as compared to 2014. The Company expects Group EBITDA to be within the range of $6.5 billion to $7 billion for 2015. Overall, steel markets continue to grow, in particular for our high value-added products; a forecast 4-5% increase in shipment volumes (approximately half of which follows the Newcastle reline completion and full year impact of the restart of BF#3 in Tubarao, Brazil) together with improved cost performance are expected to offset the impact of lower transaction prices and the impacts of translation. Assuming current market conditions, in excess of one-third of the impact of lower iron ore prices on mining revenues will be offset by improved cost performance including the benefits of foreign exchange, energy and freight as well as higher volumes. Additionally, the Company expects net interest expense to decline to approximately $1.4 billion and Capital expenditure to decline to approximately $3.4 billion in 2015. As a result, at the bottom end of the guidance range the Company would expect to be free cash flow. While net debt is expected to follow a normal seasonal pattern, overall progress towards the medium term net debt target of $15 billion is anticipated during the course of 2015.
Page 15 of 20
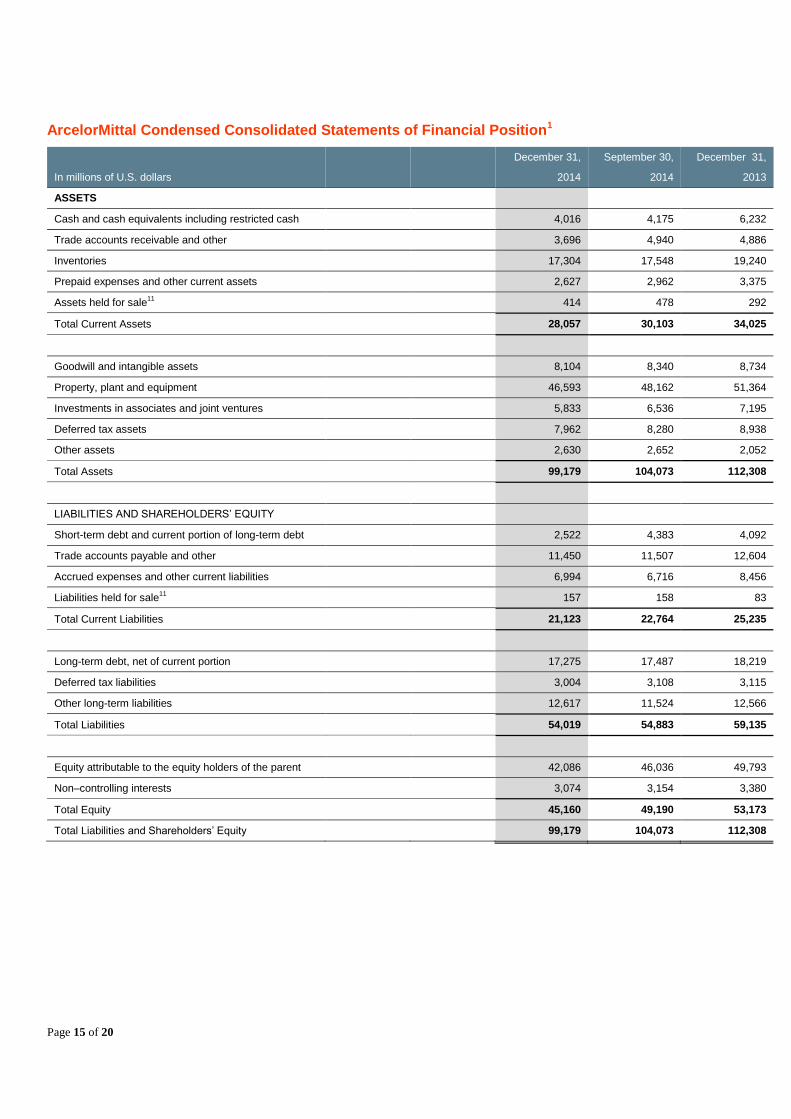
ArcelorMittal Condensed Consolidated Statements of Financial Position1
December 31, September 30, December 31,
In millions of U.S. dollars 2014 2014 2013
ASSETS
Cash and cash equivalents including restricted cash 4,016 4,175 6,232
Trade accounts receivable and other 3,696 4,940 4,886
Inventories 17,304 17,548 19,240
Prepaid expenses and other current assets 2,627 2,962 3,375
Assets held for sale11
414 478 292
Total Current Assets 28,057 30,103 34,025
Goodwill and intangible assets 8,104 8,340 8,734
Property, plant and equipment 46,593 48,162 51,364
Investments in associates and joint ventures 5,833 6,536 7,195
Deferred tax assets 7,962 8,280 8,938
Other assets 2,630 2,652 2,052
Total Assets 99,179 104,073 112,308
LIABILITIES AND SHAREHOLDERS’ EQUITY
Short-term debt and current portion of long-term debt 2,522 4,383 4,092
Trade accounts payable and other 11,450 11,507 12,604
Accrued expenses and other current liabilities 6,994 6,716 8,456
Liabilities held for sale11
157 158 83
Total Current Liabilities 21,123 22,764 25,235
Long-term debt, net of current portion 17,275 17,487 18,219
Deferred tax liabilities 3,004 3,108 3,115
Other long-term liabilities 12,617 11,524 12,566
Total Liabilities 54,019 54,883 59,135
Equity attributable to the equity holders of the parent 42,086 46,036 49,793
Non–controlling interests 3,074 3,154 3,380
Total Equity 45,160 49,190 53,173
Total Liabilities and Shareholders’ Equity 99,179 104,073 112,308
Page 16 of 20
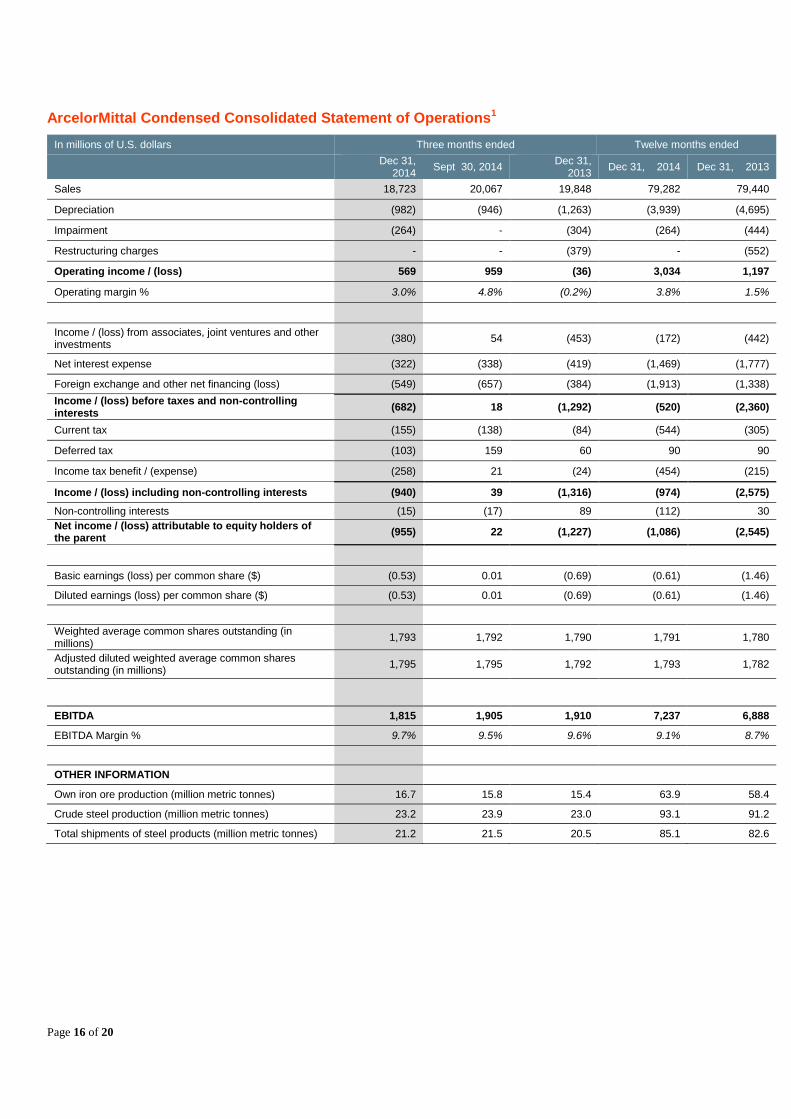
ArcelorMittal Condensed Consolidated Statement of Operations1
In millions of U.S. dollars Three months ended Twelve months ended
Dec 31,
2014 Sept 30, 2014
Dec 31, 2013
Dec 31, 2014 Dec 31, 2013
Sales 18,723 20,067 19,848 79,282 79,440
Depreciation (982) (946) (1,263) (3,939) (4,695)
Impairment (264) - (304) (264) (444)
Restructuring charges - - (379) - (552)
Operating income / (loss) 569 959 (36) 3,034 1,197
Operating margin % 3.0% 4.8% (0.2%) 3.8% 1.5%
Income / (loss) from associates, joint ventures and other investments
(380) 54 (453) (172) (442)
Net interest expense (322) (338) (419) (1,469) (1,777)
Foreign exchange and other net financing (loss) (549) (657) (384) (1,913) (1,338)
Income / (loss) before taxes and non-controlling interests
(682) 18 (1,292) (520) (2,360)
Current tax (155) (138) (84) (544) (305)
Deferred tax (103) 159 60 90 90
Income tax benefit / (expense) (258) 21 (24) (454) (215)
Income / (loss) including non-controlling interests (940) 39 (1,316) (974) (2,575)
Non-controlling interests (15) (17) 89 (112) 30
Net income / (loss) attributable to equity holders of the parent
(955) 22 (1,227) (1,086) (2,545)
Basic earnings (loss) per common share ($) (0.53) 0.01 (0.69) (0.61) (1.46)
Diluted earnings (loss) per common share ($) (0.53) 0.01 (0.69) (0.61) (1.46)
Weighted average common shares outstanding (in millions)
1,793 1,792 1,790 1,791 1,780
Adjusted diluted weighted average common shares outstanding (in millions)
1,795 1,795 1,792 1,793 1,782
EBITDA 1,815 1,905 1,910 7,237 6,888
EBITDA Margin % 9.7% 9.5% 9.6% 9.1% 8.7%
OTHER INFORMATION
Own iron ore production (million metric tonnes) 16.7 15.8 15.4 63.9 58.4
Crude steel production (million metric tonnes) 23.2 23.9 23.0 93.1 91.2
Total shipments of steel products (million metric tonnes) 21.2 21.5 20.5 85.1 82.6
Page 17 of 20
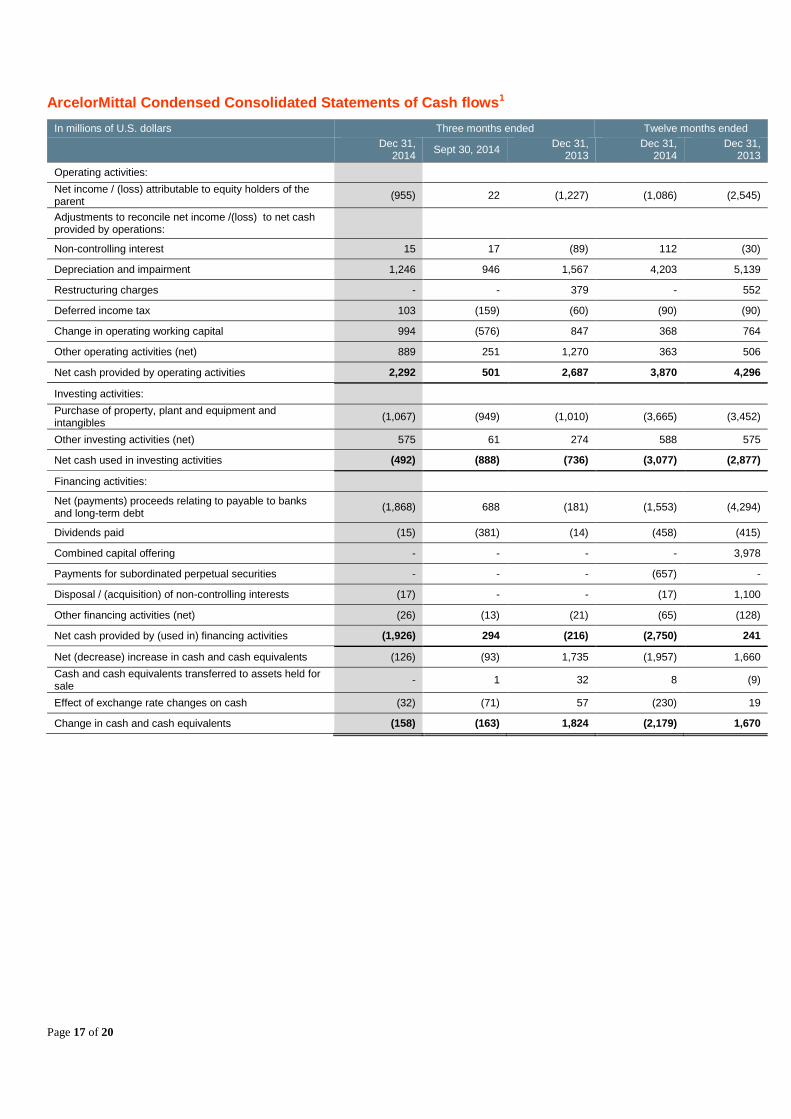
ArcelorMittal Condensed Consolidated Statements of Cash flows1
In millions of U.S. dollars Three months ended Twelve months ended
Dec 31,
2014 Sept 30, 2014
Dec 31, 2013
Dec 31, 2014
Dec 31, 2013
Operating activities:
Net income / (loss) attributable to equity holders of the parent
(955) 22 (1,227) (1,086) (2,545)
Adjustments to reconcile net income /(loss) to net cash provided by operations:
Non-controlling interest 15 17 (89) 112 (30)
Depreciation and impairment 1,246 946 1,567 4,203 5,139
Restructuring charges - - 379 - 552
Deferred income tax 103 (159) (60) (90) (90)
Change in operating working capital 994 (576) 847 368 764
Other operating activities (net) 889 251 1,270 363 506
Net cash provided by operating activities 2,292 501 2,687 3,870 4,296
Investing activities:
Purchase of property, plant and equipment and intangibles
(1,067) (949) (1,010) (3,665) (3,452)
Other investing activities (net) 575 61 274 588 575
Net cash used in investing activities (492) (888) (736) (3,077) (2,877)
Financing activities:
Net (payments) proceeds relating to payable to banks and long-term debt
(1,868) 688 (181) (1,553) (4,294)
Dividends paid (15) (381) (14) (458) (415)
Combined capital offering - - - - 3,978
Payments for subordinated perpetual securities - - - (657) -
Disposal / (acquisition) of non-controlling interests (17) - - (17) 1,100
Other financing activities (net) (26) (13) (21) (65) (128)
Net cash provided by (used in) financing activities (1,926) 294 (216) (2,750) 241
Net (decrease) increase in cash and cash equivalents (126) (93) 1,735 (1,957) 1,660
Cash and cash equivalents transferred to assets held for sale
- 1 32 8 (9)
Effect of exchange rate changes on cash (32) (71) 57 (230) 19
Change in cash and cash equivalents (158) (163) 1,824 (2,179) 1,670
Page 18 of 20
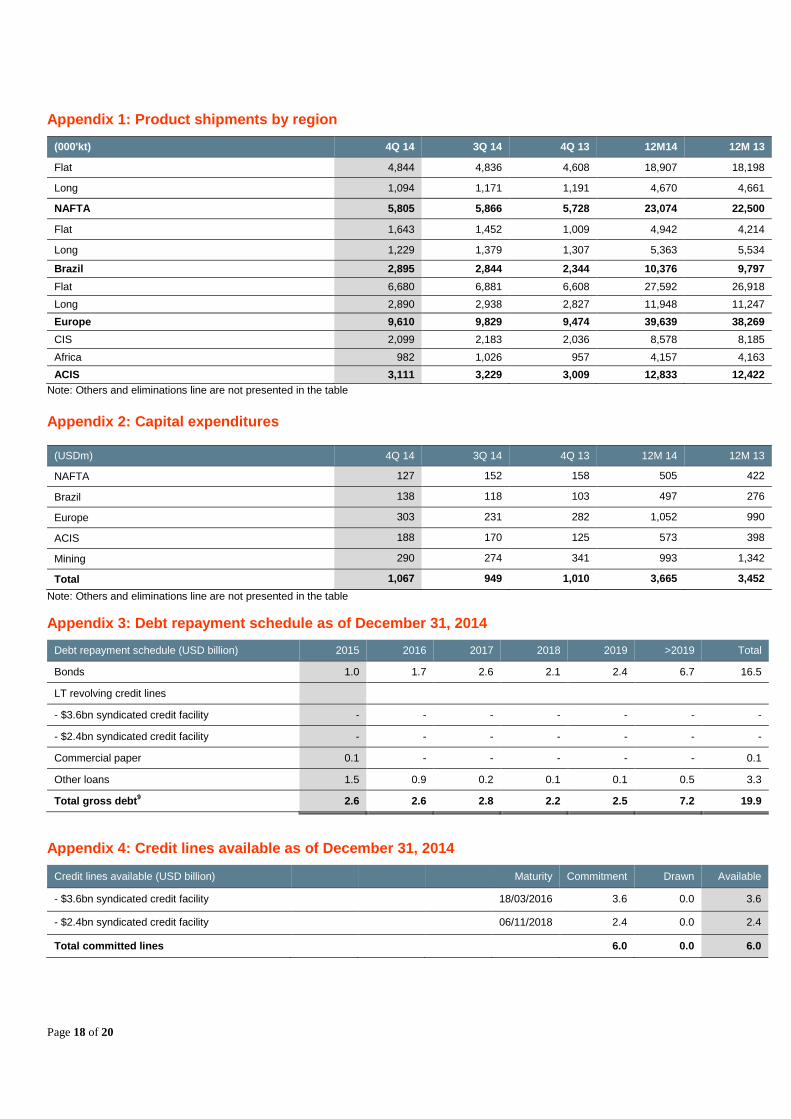
Appendix 1: Product shipments by region
(000'kt) 4Q 14 3Q 14 4Q 13 12M14 12M 13
Flat 4,844 4,836 4,608 18,907 18,198
Long 1,094 1,171 1,191 4,670 4,661
NAFTA 5,805 5,866 5,728 23,074 22,500
Flat 1,643 1,452 1,009 4,942 4,214
Long 1,229 1,379 1,307 5,363 5,534
Brazil 2,895 2,844 2,344 10,376 9,797
Flat 6,680 6,881 6,608 27,592 26,918
Long 2,890 2,938 2,827 11,948 11,247
Europe 9,610 9,829 9,474 39,639 38,269
CIS 2,099 2,183 2,036 8,578 8,185
Africa 982 1,026 957 4,157 4,163
ACIS 3,111 3,229 3,009 12,833 12,422
Note: Others and eliminations line are not presented in the table
Appendix 2: Capital expenditures
(USDm) 4Q 14 3Q 14 4Q 13 12M 14 12M 13
NAFTA 127 152 158 505 422
Brazil 138 118 103 497 276
Europe 303 231 282 1,052 990
ACIS 188 170 125 573 398
Mining 290 274 341 993 1,342
Total 1,067 949 1,010 3,665 3,452
Note: Others and eliminations line are not presented in the table
Appendix 3: Debt repayment schedule as of December 31, 2014
Debt repayment schedule (USD billion) 2015 2016 2017 2018 2019 >2019 Total
Bonds 1.0 1.7 2.6 2.1 2.4 6.7 16.5
LT revolving credit lines
- $3.6bn syndicated credit facility - - - - - - -
- $2.4bn syndicated credit facility - - - - - - -
Commercial paper 0.1 - - - - - 0.1
Other loans 1.5 0.9 0.2 0.1 0.1 0.5 3.3
Total gross debt9 2.6 2.6 2.8 2.2 2.5 7.2 19.9
Appendix 4: Credit lines available as of December 31, 2014
Credit lines available (USD billion) Maturity Commitment Drawn Available
- $3.6bn syndicated credit facility 18/03/2016 3.6 0.0 3.6
- $2.4bn syndicated credit facility 06/11/2018 2.4 0.0 2.4
Total committed lines 6.0 0.0 6.0
Page 19 of 20
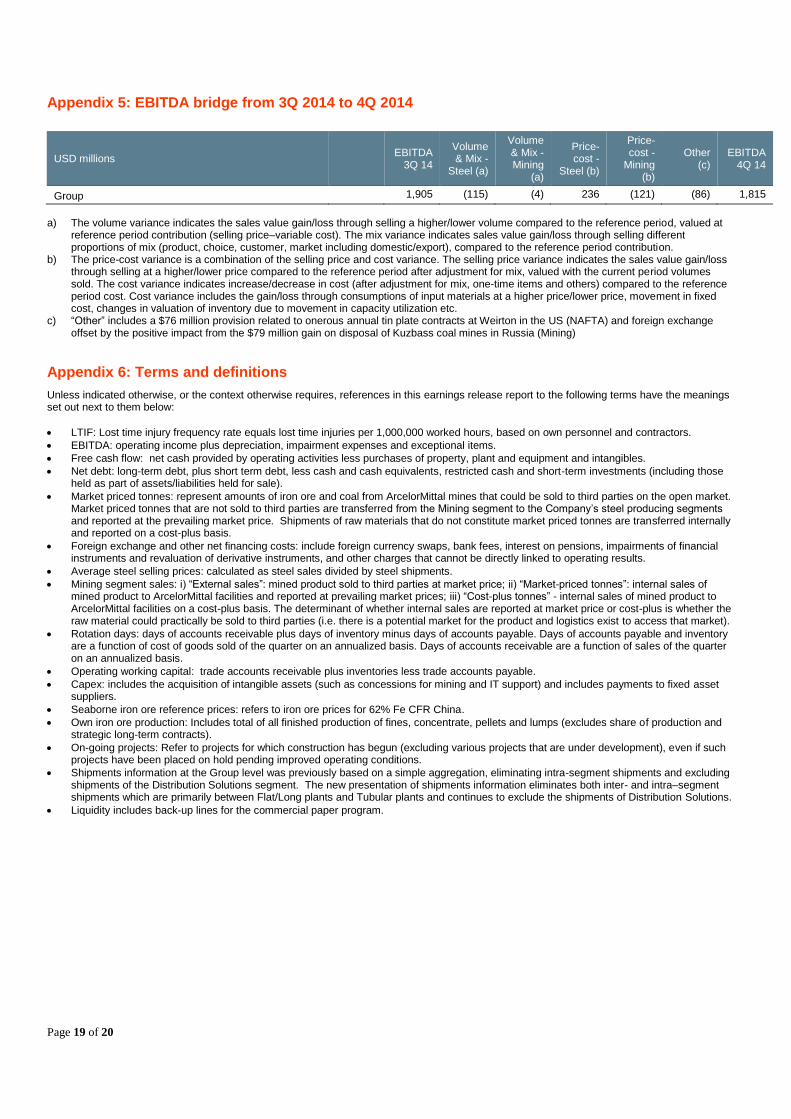
Appendix 5: EBITDA bridge from 3Q 2014 to 4Q 2014
USD millions EBITDA
3Q 14
Volume & Mix -
Steel (a)
Volume & Mix - Mining
(a)
Price-cost -
Steel (b)
Price-cost -
Mining (b)
Other (c)
EBITDA 4Q 14
Group 1,905 (115) (4) 236 (121) (86) 1,815
a) The volume variance indicates the sales value gain/loss through selling a higher/lower volume compared to the reference period, valued at
reference period contribution (selling price–variable cost). The mix variance indicates sales value gain/loss through selling different proportions of mix (product, choice, customer, market including domestic/export), compared to the reference period contribution.
b) The price-cost variance is a combination of the selling price and cost variance. The selling price variance indicates the sales value gain/loss through selling at a higher/lower price compared to the reference period after adjustment for mix, valued with the current period volumes sold. The cost variance indicates increase/decrease in cost (after adjustment for mix, one-time items and others) compared to the reference period cost. Cost variance includes the gain/loss through consumptions of input materials at a higher price/lower price, movement in fixed cost, changes in valuation of inventory due to movement in capacity utilization etc.
c) “Other” includes a $76 million provision related to onerous annual tin plate contracts at Weirton in the US (NAFTA) and foreign exchange offset by the positive impact from the $79 million gain on disposal of Kuzbass coal mines in Russia (Mining)
Appendix 6: Terms and definitions
Unless indicated otherwise, or the context otherwise requires, references in this earnings release report to the following terms have the meanings set out next to them below:
LTIF: Lost time injury frequency rate equals lost time injuries per 1,000,000 worked hours, based on own personnel and contractors.
EBITDA: operating income plus depreciation, impairment expenses and exceptional items.
Free cash flow: net cash provided by operating activities less purchases of property, plant and equipment and intangibles.
Net debt: long-term debt, plus short term debt, less cash and cash equivalents, restricted cash and short-term investments (including those held as part of assets/liabilities held for sale).
Market priced tonnes: represent amounts of iron ore and coal from ArcelorMittal mines that could be sold to third parties on the open market. Market priced tonnes that are not sold to third parties are transferred from the Mining segment to the Company’s steel producing segments and reported at the prevailing market price. Shipments of raw materials that do not constitute market priced tonnes are transferred internally and reported on a cost-plus basis.
Foreign exchange and other net financing costs: include foreign currency swaps, bank fees, interest on pensions, impairments of financial instruments and revaluation of derivative instruments, and other charges that cannot be directly linked to operating results.
Average steel selling prices: calculated as steel sales divided by steel shipments.
Mining segment sales: i) “External sales”: mined product sold to third parties at market price; ii) “Market-priced tonnes”: internal sales of mined product to ArcelorMittal facilities and reported at prevailing market prices; iii) “Cost-plus tonnes” - internal sales of mined product to ArcelorMittal facilities on a cost-plus basis. The determinant of whether internal sales are reported at market price or cost-plus is whether the raw material could practically be sold to third parties (i.e. there is a potential market for the product and logistics exist to access that market).
Rotation days: days of accounts receivable plus days of inventory minus days of accounts payable. Days of accounts payable and inventory are a function of cost of goods sold of the quarter on an annualized basis. Days of accounts receivable are a function of sales of the quarter on an annualized basis.
Operating working capital: trade accounts receivable plus inventories less trade accounts payable.
Capex: includes the acquisition of intangible assets (such as concessions for mining and IT support) and includes payments to fixed asset suppliers.
Seaborne iron ore reference prices: refers to iron ore prices for 62% Fe CFR China.
Own iron ore production: Includes total of all finished production of fines, concentrate, pellets and lumps (excludes share of production and strategic long-term contracts).
On-going projects: Refer to projects for which construction has begun (excluding various projects that are under development), even if such projects have been placed on hold pending improved operating conditions.
Shipments information at the Group level was previously based on a simple aggregation, eliminating intra-segment shipments and excluding shipments of the Distribution Solutions segment. The new presentation of shipments information eliminates both inter- and intra–segment shipments which are primarily between Flat/Long plants and Tubular plants and continues to exclude the shipments of Distribution Solutions.
Liquidity includes back-up lines for the commercial paper program.
Page 20 of 20
1 The financial information in this press release has been prepared consistently with International Financial Reporting Standards (“IFRS”) as issued by the
International Accounting Standards Board (“IASB”). While the interim financial information included in this announcement has been prepared in accordance with IFRS applicable to interim periods, this announcement does not contain sufficient information to constitute an interim financial report as defined in
International Accounting Standards 34, “Interim Financial Reporting”. The numbers in this press release have not been audited. The financial information and
certain other information presented in a number of tables in this press release have been rounded to the nearest whole number or the nearest decimal. Therefore, the sum of the numbers in a column may not conform exactly to the total figure given for that column. In addition, certain percentages presented in the tables in
this press release reflect calculations based upon the underlying information prior to rounding and, accordingly, may not conform exactly to the percentages that
would be derived if the relevant calculations were based upon the rounded numbers. This press release also includes certain non-GAAP financial measures. 2 EBITDA in FY 2014 of $7,237 million includes the negative impact of $90 million from the settlement of US antitrust litigation and a $76 million provision
related to onerous annual tin plate contracts at Weirton in the US, offset by the positive impact from the $79 million gain on disposal of Kuzbass coal mines in
Russia; EBITDA in FY 2013 of $6,888 million included the positive impact of a $47 million fair valuation gain relating to the acquisition of an additional ownership interest in DJ Galvanizing in Canada and $92 million of DDH income. For comparative purposes, underlying EBITDA for FY 2014 is $7,324
million as compared to underlying EBITDA of $6,749 million in FY 2013.
3 EBITDA in 4Q 2014 of $1,815 million was negatively impacted by a $76 million provision related to onerous annual tin plate contracts at Weirton in the US, offset by the positive impact from the $79 million gain on disposal of Kuzbass coal mines in Russia.
4 In 3Q 2013 ArcelorMittal impaired the entire amount of the investment that it had made up to September 30, 2013 in connection with a 2007 agreement with
the State of Senegal regarding a mining and infrastructure project, as it viewed project implementation to be improbable in light of an ongoing arbitration proceeding. The parties have since agreed to settle the dispute and on December 12, 2014, the arbitral tribunal issued a procedural order formally closing the
arbitration. 5 ArcelorMittal Brasil S.A. (as a successor of Companhia Siderurgica Tubarao) was party to a legal dispute against Siderbras (an extinguished holding company
held by the Government of Brazil) related to financial debt issued in 1992. In July 2014, the judge in charge requested to replace the guarantee, which was
securing the litigation, with cash so that an appeal of the case could proceed. ArcelorMittal Brasil S.A. entered into a federal amnesty program with the Brazilian
tax authorities to settle the debt with Siderbras (application made in August 2014). The payment under the program is $161 million (original debt $259 million including interest and penalties) and recorded as a financial expense. Of this amount, $116 million was paid by way of set-off of tax losses and the remaining
balance paid in cash. This tax amnesty program entered into by the Company with the Brazilian tax authorities is only in relation to the Siderbras matter and does not have any effect or otherwise impact the Company’s other outstanding disputes with the Brazilian tax authorities, which have been previously disclosed.
6 During the fourth quarter of 2013, the Company settled two amnesty programs in Brazil, for a total amount of $302 million. Of the total, $222 million was
recorded as income tax expense and $80 million as interest and penalties in other financing charges. Subsequently, the Company paid $240 million by way of tax losses and during the year 2014, the remaining balance was paid in cash. 7 The Company recorded a total of $133 million of deferred tax assets for losses of previous years in the framework of Federal Amnesty programmes in Brazil
(including $82 million from the Siderbras case and $51 million in relation to the existing amnesty debts signed during 4Q 2013 which are now allowed to be partially offset with tax losses).
8 Following the sale of a 5% stake to Valin Group as a result of the exercise of the third put option on February 8, 2014, the Company’s interest in Hunan Valin
decreased from 20% to 15%. The Company exercised the fourth and final instalment on August 6, 2014. The Company received cash from the third installment of $108 million in the fourth quarter of 2014 and expects cash from the fourth installment of $107 million in 1H 2015.
9 As at December 31, 2014 and September 30, 2014 net debt included $0.1 billion relating to distribution centers in Europe held for sale.
10 During the fourth quarter of 2014, the Company generated cash proceeds totalling $0.6 billion from the sale of its 50% interests in Gallatin Steel Company ("Gallatin") to Nucor Corporation for $389 million, proceeds from the exercise of the third put option on February 8, 2014 for the Company’s interest in Hunan
Valin from 20% to 15% to Valin Group for $108 million, and proceeds from the sale of various tangible assets. 11 Gallatin’s carrying amount was classified as held for sale as of September 30, 2014. Assets and liabilities held for sale as of September 30, 2014 and
December 31, 2014 also included assets and liabilities held for sale related to distribution centers in Europe, and the amount as of December 31, 2014 also
included the Liberté building disposal.