Embed Size (px)
Citation preview
ARCC Teacher
Compensation Initiative:
Literature Review
August 2014
Submitted to the
Tennessee State Board of Education
and the
Tennessee Department of Education
300 Summers St., Ste. 1240 • Charleston, WV 25301 • 1-855-355-ARCC (2722) • www.arccta.org
This project has been funded at least in part with Federal funds from the U.S. Department of Education under contract number S283B120023. The content of this document does not necessarily reflect the views or policies of the U.S. Department of Education
nor does mention of trade names, commercial products, or organizations imply endorsement by the U.S. Government.

300 Summers St., Ste. 1240 • Charleston, WV 25301 • 1-855-355-ARCC (2722) • www.arccta.org
i
Acknowledgments
ARCC gratefully acknowledges the Center on Great Teachers and Leaders for their helpful
consultation and review in preparation of this report.

300 Summers St., Ste. 1240 • Charleston, WV 25301 • 1-855-355-ARCC (2722) • www.arccta.org
ii
Table of Contents
Acknowledgments ................................................................................................................................................. i
Table of Contents .................................................................................................................................................. ii
List of Tables and Figures ................................................................................................................................. vi
Executive Summary.............................................................................................................................................. 1
Section I: Introduction ........................................................................................................................................ 8
Preparation of Report ..................................................................................................................................... 8
Purposes of Report .......................................................................................................................................... 9
Organization of Report ................................................................................................................................ 10
Section II: Key Findings and Recommendations from the 2013 BEP Review Committee
Discussions and Decisions .............................................................................................................................. 11
Introduction .................................................................................................................................................... 11
History of the BEP ......................................................................................................................................... 11
BEP Review Committee and Annual Report ....................................................................................... 11
Section III: Tennessee Compensation Reform Context ....................................................................... 14
Introduction .................................................................................................................................................... 14
Current Salary Schedule for Teachers in Tennessee ....................................................................... 14
Percentages of School Spending on Instruction ................................................................................ 15
Overview of the History of Tennessee Teacher Compensation Reform ................................. 16
Comprehensive Education Reform Act and Career Ladder Exploration in Tennessee
(1984-1997) ............................................................................................................................................... 16
Salary Equity Plan (1995-2002) ......................................................................................................... 19
Teacher Salaries Added to BEP (2004) ............................................................................................ 19
Differentiated Pay Plans in Tennessee (2007-2010) ................................................................. 19
Tennessee State Law Revised in 2010 ............................................................................................. 21
Race to the Top Grant and Competitive Compensation Initiatives (2010–Present) ...... 21
Differentiated Pay Plans (2013-Present) ........................................................................................ 28

300 Summers St., Ste. 1240 • Charleston, WV 25301 • 1-855-355-ARCC (2722) • www.arccta.org
iii
Summary ........................................................................................................................................................... 30
Section IV: Evidence on Teacher Supply and Demand in Tennessee ............................................. 31
Introduction .................................................................................................................................................... 31
Teacher Shortages in Tennessee ............................................................................................................. 33
Tennessee Teacher Demand Data ...................................................................................................... 34
Tennessee Teacher Supply Data ......................................................................................................... 34
Tennessee New Teacher Supply Data ............................................................................................... 36
Summary ........................................................................................................................................................... 40
Section V: The Research Base for Market-based Teacher Pay.......................................................... 42
Introduction .................................................................................................................................................... 42
1. Overall, how should we characterize the research literature on the evidence base of
market-based teacher pay? ....................................................................................................................... 42
2. What does the survey research literature suggest about the importance of pay for
teacher retention? ......................................................................................................................................... 44
3. What does the survey research literature suggest about the importance of pay for
teacher recruitment? ................................................................................................................................... 48
4. What does the survey research literature suggest about the importance of pay for
teacher effectiveness? ................................................................................................................................. 49
5. What are the benefits and limitations of relying on survey-based research? ............... 51
6. What does the econometric/observational research literature suggest about the
importance of pay for teacher retention? ............................................................................................ 51
7. What does the econometric/observational research literature suggest about the
importance of pay for teacher recruitment? ...................................................................................... 53
8. What does the econometric/observational research literature suggest about the
importance of pay for teacher effectiveness? ..................................................................................... 53
9. What are the benefits and limitations of relying on econometric/observational
research? .......................................................................................................................................................... 54
10. What is the evidence concerning teacher salaries for specific groups of teachers,
such as math/science teachers or teachers from Generation Y? ................................................ 54
11. What additional research is underway that will address the above questions? ..... 57
300 Summers St., Ste. 1240 • Charleston, WV 25301 • 1-855-355-ARCC (2722) • www.arccta.org
iv
12. What can be learned from internal/external program evaluations of teacher
compensation reform initiatives in other states and districts? .................................................. 58
Summary ........................................................................................................................................................... 58
Section VI: Emerging Practices and Lessons Learned by States and Districts ........................... 59
Introduction .................................................................................................................................................... 59
1. Where has market-based pay been implemented? ................................................................. 59
Douglas County, Colorado ..................................................................................................................... 59
The Equity Project Charter School, New York City ...................................................................... 61
2. What other innovative approaches to increase teacher pay, particularly in shortage
areas, have been implemented? .............................................................................................................. 63
Public Impact’s Opportunity Culture Model .................................................................................. 63
2012 TIF Grantees .................................................................................................................................... 65
District and State Compensation Reforms Addressing STEM Teachers ............................. 67
Georgia Differentiated Compensation for New Math and Science Teachers ..................... 68
Ohio STEM Teacher-Signing Bonuses ............................................................................................... 70
Ohio STEM Teacher Loan-Forgiveness Program ......................................................................... 71
Virginia STEM Teacher Recruitment and Retention Pilot Incentive .................................... 71
3. Have any pay reforms taken place within existing school budgets? ................................ 72
4. Have business community members assisted in supporting teacher pay that is
closer to market-based? ............................................................................................................................. 73
5. What can be learned informally or anecdotally from market-based teacher salary
initiatives in other states and districts? ............................................................................................... 73
Summary ........................................................................................................................................................... 74
Section VII: Practical Questions and Considerations ........................................................................... 75
Introduction .................................................................................................................................................... 75
Approaches for Financing Market-based Teacher Pay ................................................................... 75
Redeploying Current Resources ......................................................................................................... 77
Repackaging Federal and State Categorical Aid Programs ...................................................... 80
Redirecting Future Resources or Expenditures ........................................................................... 83
300 Summers St., Ste. 1240 • Charleston, WV 25301 • 1-855-355-ARCC (2722) • www.arccta.org
v
Seeking Philanthropic and/or Corporate Support ...................................................................... 83
Obtaining Additional Public Funding................................................................................................ 84
Applying for Discretionary Federal Grants .................................................................................... 85
Summary ...................................................................................................................................................... 87
Effective Communication and Stakeholder Engagement in Compensation Reform ........... 88
Strategies for Effective Stakeholder Communication and Engagement.............................. 88
Summary ...................................................................................................................................................... 91
What role might teacher voice groups play in reforming teacher compensation in
Tennessee? ....................................................................................................................................................... 92
Summary ...................................................................................................................................................... 94
References ........................................................................................................................................................ 95
Appendix: Glossary of Terms .................................................................................................................. 111

300 Summers St., Ste. 1240 • Charleston, WV 25301 • 1-855-355-ARCC (2722) • www.arccta.org
vi
List of Tables and Figures
Table 1. ................................................................................................................................................................... 16
Summary of Early Career Ladder Levels, Eligibility Requirements, and Incentives in
Tennessee ............................................................................................................................................................... 16
Table 2. ................................................................................................................................................................... 25
Summary of Tennessee Districts Receiving Grants for Teacher Compensation Reform and
Types of Compensation Models ...................................................................................................................... 25
Table 3. ................................................................................................................................................................... 32
Prevalence of District Compensation Reform Initiatives Over Time ................................................. 32
Table 4. ................................................................................................................................................................... 37
Endorsement Areas Earned by 2012-2012 Tennessee Teacher Training Program
Completers ............................................................................................................................................................. 37
Table 5. ................................................................................................................................................................... 38
Number of STEM Endorsement Areas Earned by 2011-2012 Graduates......................................... 38
Table 6. ................................................................................................................................................................... 39
Tennessee Higher Education Institutions with the Largest Number of STEM Endorsements .. 39
Table 7. ................................................................................................................................................................... 40
Numbers of Completers Continuing to Teach in Tennessee Public Schools .................................... 40
Figure 1. Former Teachers Compare Aspects of Teaching and their New Positions .................... 45
Figure 2. Factors that would Change Teachers’ Minds about Leaving the Profession ................ 47
Figure 3. Teachers’ Top-Rated Changes to Improve the Profession .................................................. 50
Figure 4. Teachers’ Views on Differential Salaries .................................................................................. 56
Figure 5. Teachers’ Views on Strategies that would be “Very Effective” for Improving the
Profession .............................................................................................................................................................. 57
Table 8 .................................................................................................................................................................... 60
Sample Douglas County (Colorado) Salary Bands ................................................................................... 60
Figure 6. Public Impact Opportunity Culture Model ............................................................................... 64
Table 9 .................................................................................................................................................................... 86
Funding Sources for Different Stages of Development and Implementation ................................. 86
Table 10. ................................................................................................................................................................ 92
Characteristics of Teacher Voice Organizations ...................................................................................... 92

300 Summers St., Ste. 1240 • Charleston, WV 25301 • 1-855-355-ARCC (2722) • www.arccta.org
1
Executive Summary
Overview. In February 2014, the Tennessee State Board of Education (SBE) requested
that the Appalachia Regional Comprehensive Center (ARCC) provide assistance to the
SBE’s Basic Education Program (BEP) Review Committee. The request came in response
to the BEP Review Committee’s 2013 Annual Report, which discussed competitive,
market-based teacher pay. The SBE requested additional information on the use and
effectiveness of market-based teacher compensation and market-based incentives by
districts and states to recruit science, technology, engineering, and mathematics (STEM)
teachers. The SBE is interested in using this information to encourage school districts to
align teacher salaries with the salaries offered by competing employers to improve
teacher recruitment and retention in Tennessee, particularly in areas of shortage.
As a federally funded technical assistance center that serves state education agencies
(SEAs) in Tennessee, Kentucky, Virginia, and West Virginia, ARCC’s key objective is to
provide high-quality, relevant, and useful technical assistance that enhances specific SEA
capacities to successfully implement and sustain important education reforms. In
response to the request for information from the SBE, ARCC consulted with the Center on
Great Teachers and Leaders (GTL Center), one of the seven content centers in the
Comprehensive Center network, to supply research and provide feedback on a review of
the report. Identifying a lack of evidence about the impact and costs of such initiatives,
GTL Center staff also conducted informal interviews with leaders of emerging market-
based compensation initiatives to seek additional, unpublished information. Given these
methods, findings in this report should be considered descriptive and limited by the
relatively few market-based incentive programs currently underway; additional studies,
to be published in autumn 2014, should shed further light on this important topic.
The report includes (1) background information on the BEP Review Committee and the
history of teacher compensation reforms in Tennessee, (2) a summary of the literature
and evidence on the effectiveness of market pay, and (3) examples of emerging practices,
challenges, and lessons learned to support the committee’s decision-making.
Tennessee’s teacher compensation policy background. Tennessee has long been a
leader in innovative teacher compensation policy, active in this arena for three decades,
as described below:

300 Summers St., Ste. 1240 • Charleston, WV 25301 • 1-855-355-ARCC (2722) • www.arccta.org
2
Contemporary teacher compensation reform began in Tennessee in 1984, with the
introduction of teacher career ladders under the Tennessee Comprehensive
Education Reform Act.
In 2007, the SBE developed guidelines for local educational agencies (LEAs) to
submit plans that would offer loan forgiveness strategies, fellowships, salary
supplements, and/or signing bonuses to address one of the following areas: (1)
recruiting teachers to hard-to-staff schools, (2) recruiting new teachers, (3) filling
LEA-specific academic shortage areas, and (4) retaining effective teachers. The
specific salary initiatives were to be determined based on teacher supply and
demand data.
Teacher compensation reform accelerated under Tennessee’s First to the Top
legislation and the award of a first round Race to the Top Grant in 2010,
supplemented by 2010 and 2012 Teacher Incentive Fund grants from the U.S.
Department of Education.
Most recently, in 2013, Tennessee asked districts statewide to submit
differentiated pay plans for the 2014-2015 school year, according to SBE
guidelines, and the Tennessee Department of Education will begin to enforce
implementation of those plans in 2014-2015.
Impact of Tennessee’s prior teacher pay reforms and on-going needs. As
demonstrated above, Tennessee has experimented with numerous forms of alternative
compensation, including performance-based differentiated salary initiatives. The extent
to which these programs have improved the quality of education that students have
received in Tennessee is not yet known, due to a lack of systematic evaluation. Moreover,
despite three decades of experimentation with teacher compensation reform, teacher
recruitment, attrition, motivation, and morale continue to present challenges.
For example, the following subject areas were identified by the U.S. Department of
Education (2014) as 2014-2015 areas of teacher shortage in Tennessee:
Mathematics (Grades 7-12),
Science (Grades 7-12),
Special Education (Kindergarten-Grade 12),
World Languages (Grades 7-12),
English as a Second Language (Pre-Kindergarten–Grade 12),
English (Grades 7-12), and
Social Studies (Grades 7-12).

300 Summers St., Ste. 1240 • Charleston, WV 25301 • 1-855-355-ARCC (2722) • www.arccta.org
3
Whether these shortages stem from supply or demand factors is not entirely clear,
because of the limitations of the available data. The data indicate that, of approximately
5,000 individuals who complete teacher preparation programs in Tennessee each year,
about half remain in Tennessee and are teaching in schools within one year; however, the
percentage of teachers who continue in the classroom declines over time (Tennessee
Higher Education Commission and Tennessee State Board of Education (SBE), 2013).
Meanwhile, a recent report found that between the school years of 2011-2012 and 2012-
2013, eight percent of teachers left Tennessee’s public schools and ten percent moved to
another Tennessee school. Teachers from minority backgrounds were considerably more
likely to leave, and teachers new to the profession and teachers with lower evaluation
ratings were slightly more likely to leave, with significant variation in attrition rates
across school districts (Tennessee Department of Education, Office of Policy and
Research, 2014). However, given the limitations of the available supply and demand data,
drawing judgments about the adequacy of teacher supply to meet demand in specific
subjects and specific high-need schools was not possible in this report.
One data point worth considering is that, according to the Alliance for Excellent
Education (Haynes, 2014), teacher attrition from the profession costs Tennessee
somewhere in the range of $23 million to more than $50 million per year, depending on
how it is calculated.
Market-based teacher compensation across the nation. Although an early adopter
and leader, Tennessee is not alone in thinking about how to strategically use teacher
compensation as a vehicle to strengthen the state’s teaching force and schools. Over half
of the states in the nation had mandated or implemented a pilot or full career ladder
program in the 1980s; however, only four states still operated these programs by the
mid-1990s, due to high costs, reduced teacher cooperation in reaction to a more
competitive environment, and difficulty in measuring the success of the programs
(Wesson, 2013).
In recent years, Georgia, Ohio, and Virginia have implemented new teacher compensation
initiatives specifically focused on recruiting and retaining effective teachers in STEM
fields. In Georgia, $9.59 million was allocated in 2009 for a STEM teacher differentiated
salary program. In Ohio, $4 million was allocated in 2007 for a STEM and foreign
language teacher bonus program and $2.5 million for a STEM teacher loan forgiveness
program. In Virginia, $500,000 was allocated in 2013 to 100 teachers in 50 districts
across the state and $708,000 in 2014 for a pilot program of STEM Teacher Recruitment
300 Summers St., Ste. 1240 • Charleston, WV 25301 • 1-855-355-ARCC (2722) • www.arccta.org
4
and Retention Incentive Awards. In these states, the estimated incentives per year per
teacher are in the range of $4,000-$6,500.
By and large, no one has conducted rigorous studies of the impact of these initiatives. The
evaluations that have been conducted are not publicly available. Some states have begun
to commission research to collect more evidence about the effectiveness of these efforts.
For example, the Hawaii Department of Education recently issued a request for proposals
to study the adequacy of their teacher compensation system to meet teacher recruitment
and retention goals, and Oklahoma issued a request for proposals to study teacher supply
and demand, including the implications for teacher pay. In Missouri, the state is
developing a teacher shortage prediction model based on data collected on teacher
recruitment and retention (Center on Great Teachers and Leaders, personal
communication, 2014).
Smaller in scope and still in the early phases of implementation and revision, the most
unique, new approaches to market-based teacher pay include:
1. Douglas County School District (Colorado). Beginning in the 2012-2013 school year,
the Douglas County School District introduced a new, controversial market-based
teacher pay system that groups each subject area and grade into one of five salary
bands, based on the labor market. Specifically, subjects/grades with a surplus of
teachers are assigned to lower salary bands, and subjects/grades with teacher
shortages are assigned to higher salary bands. The placement into bands may
fluctuate from year to year, but at present, for example, special education and
school psychologists are in the highest paying band, with high school science and
math teachers in the second highest band.
2. The Equity Project Charter School (New York City). In 2009, The Equity Project
Charter School was established and adopted three R’s for teachers: rigorous
qualifications, redefined expectations, and revolutionary compensation. To deliver
on the latter, teachers receive salaries of $125,000 and a bonus of up to $25,000,
based on school-wide performance. The school’s website includes information
about student growth, learning environment survey results, the school’s annual
report to the New York City Department of Education, and the school’s audited
financial statements.
3. Opportunity Culture Model. Public Impact’s Opportunity Culture Model, piloted in
Metro Nashville Public Schools’ Innovation Zone, is estimated to increase the pay

300 Summers St., Ste. 1240 • Charleston, WV 25301 • 1-855-355-ARCC (2722) • www.arccta.org
5
for effective teachers by 130 percent within existing budgets. The budget for pay
increases is generated through differentiated roles, including paraprofessionals,
academic resource teachers, and teacher leaders. These roles simultaneously
create restructured professional growth and career opportunities based on
teachers’ strengths, leadership skills, reach, and impact on student achievement.
The staffing models are intended to increase the selectivity of teachers who enter
the profession, create opportunities for advancement, and increase teacher pay to
six figures.
The research. At present, there is little impact evidence for the market-based pay
programs noted above. The research on performance-based teacher pay programs has
produced highly mixed results. Research about teacher salaries more generally, however,
continues to suggest that salaries affect the labor market decisions that teachers make.
Both the survey research (which asks teachers whether and why they chose to join or
leave the teaching profession, or planned to join or leave) and econometric literature
(which reports on observed changes in teacher recruitment or attrition as these relate to
teachers’ salaries) suggest that salaries matter.
When it comes to recruiting talent to the profession, research finds that teachers’ salaries
are “painfully” low in many states, including Tennessee, causing teachers to qualify for
state benefits and work second jobs (Boser & Straus, 2014). Research also finds that
higher salaries would make teaching a more viable career option for math and science
majors in college (Milanowski, 2003) and for high-performing college students from the
top-third of their college classes (Auguste, Kihn, & Miller, 2010). More generally, salaries
emerge as:
one of the primary sources of dissatisfaction that led former teachers to move to
another school or leave the profession (Ingersoll, 2003);
one of the primary factors that teachers found to be more satisfying in subsequent
careers than in teaching (Keigher & Cross, 2010);
among the primary factors that, if improved, could encourage teachers who were
contemplating leaving the profession to remain; and
among the top-rated changes that would improve the quality of the teaching
profession (Coggshall, Ott, Behrstock, & Lasagna, 2009).
Salaries also ranked among the top “dislikes” for top-performing “irreplaceable” teachers
(TNTP, 2013), and as an area where a significant majority of teachers believe
improvements would strengthen teacher retention (Scholastic and the Bill & Melinda

300 Summers St., Ste. 1240 • Charleston, WV 25301 • 1-855-355-ARCC (2722) • www.arccta.org
6
Gates Foundation, 2012). A meta-analysis of econometric studies finds that salaries
appear to have an impact on teacher retention (Borman & Dowling, 2008). The impact of
teacher salaries on the performance of their students, however, is mixed (Hanuschek &
Rivkin, 2004; Figlio, 2002; Loeb & Page, 2000).
Research on how teachers view differentiated salaries suggests that teachers are most
supportive of higher pay for teachers in high-need locations, somewhat supportive of
higher pay for teachers in shortage subject areas and teachers who achieve National
Board certification, with the least support for higher salaries for teachers who perform
well on evaluations (Podgursky, 2011; Coggshall et al., 2009).
Several recent and notable studies include:
1. The Tennessee Consortium on Research, Evaluation, and Development found that
Level 5 (i.e., the most effective) teachers, who received bonuses to work in
Tennessee Priority Schools (i.e., the 5 percent most high-need schools), were 23
percent more likely to remain in a Priority School after receiving a $5,000 bonus
than were Level 4 teachers in those schools. The impact of the bonuses seemed
only to apply to teachers in tested grades and subjects, however (Springer,
Rodriguez, & Swain, 2014).
2. Examining Washington, D.C.’s IMPACT initiative in a similar manner, Dee and
Wyckoff (2013) found that $25,000 bonuses and $27,000 base salary increases did
not have a statistically significant impact on teacher retention (although the
authors note contextual factors that may have contributed to this outcome) but
did, however, have positive and statistically significant effects on teacher
performance.
3. Mathematica examined the impact of $20,000 bonuses paid over two years to
effective teachers who transfer to and stay in low-performing schools. Looking at
such policies in 10 school districts across seven states, Mathematica found that
retention of effective teachers in these schools was significantly higher (93
percent compared to 70 percent for those who did not receive bonuses), but this
effect disappeared after the two-year bonus period ended, and few teachers took
advantage of the bonus offer (Glazerman, Protik, Teh, Bruch, & Max, 2013).

300 Summers St., Ste. 1240 • Charleston, WV 25301 • 1-855-355-ARCC (2722) • www.arccta.org
7
Mathematica will publish two important and relevant studies within several months: (1)
a study of the preliminary impact of Teacher Incentive Fund grants; and (2) a five-year
study of The Equity Project charter school in New York City.
Conclusion. Teacher compensation reform is complex and challenging. But the evidence
suggests, on the whole, that salaries do matter for teacher recruitment and retention and,
thus, it is laudable that Tennessee continues to examine possibilities for improving teacher
pay, particularly for teachers in shortage areas. Lessons learned from past compensation
reforms suggest that such efforts are most successful when they involve a pilot test and are
modified based on the results of the pilot evaluation, are combined with additional
improvements to the human capital management system (e.g., working conditions,
strategic recruitment and hiring), involve all stakeholders, and feature salary
enhancements significant enough to affect teachers’ career choices.

300 Summers St., Ste. 1240 • Charleston, WV 25301 • 1-855-355-ARCC (2722) • www.arccta.org
8
Section I: Introduction
In February 2014, staff from the Tennessee State Board of Education (SBE) requested
that the Appalachia Regional Comprehensive Center (ARCC) provide assistance to its
Basic Education Program (BEP) Review Committee. SBE made its request in response to
the BEP Review Committee’s 2013 Annual Report, which discussed competitive, market-
based teacher pay. SBE staff requested additional information about the use and
effectiveness of market-based teacher compensation and market-based incentives for
science, technology, engineering, and mathematics (STEM) teachers by districts and
states. Market-based pay is defined as the alignment of teachers’ salaries with the salaries
available in other labor markets. It suggests that salaries offered by competing employers
should be a central consideration when setting pay levels for teachers as a population,
and within particular subjects or geographic areas. (Please refer to the glossary for
definitions of additional terms used throughout this report.)
This request is also related to the Tennessee SBE Teacher Compensation Initiative, part of
the ARCC’s Year Two Plan. The ARCC, a federally funded technical assistance center,
serves state education agencies (SEAs) in Tennessee, Kentucky, Virginia, and West
Virginia. ARCC’s key objective is to provide high-quality, relevant, and useful technical
assistance that enhances specific SEA capacities to undertake state education reforms
successfully, support district and school implementation of reforms, and maintain
effectiveness once services are complete.
Preparation of Report
To prepare this report, ARCC staff collaborated with staff from the Center on Great
Teachers and Leaders (GTL Center) (http://www.gtlcenter.org/) to conduct a review of
research and obtain additional information on teacher compensation and market-based
pay at the state and district levels. The GTL Center is a federally funded national content
center dedicated to supporting state education leaders in their efforts to grow, respect,
and retain great teachers and leaders for all students. Specifically, as part of the U.S.
Department of Education’s Comprehensive Centers program, the GTL Center provides
technical assistance and online resources to regional centers and SEAs designed to build
systems that:
support the implementation of college and career standards;
ensure the equitable distribution of effective teachers and leaders;

300 Summers St., Ste. 1240 • Charleston, WV 25301 • 1-855-355-ARCC (2722) • www.arccta.org
9
recruit, retain, reward, and support effective educators;
develop coherent human capital management systems;
create safe academic environments that increase student learning through
positive behavior management and appropriate discipline; and
use data to guide professional development and improve instruction.
Staff based the contents of this report on information collected from the websites of
Tennessee organizations, the research/literature on teacher compensation and market-
based pay, the websites of other states and districts exploring teacher compensation
reform, and from national organizations.
As part of the preparation process, ARCC and GTL Center staff made two presentations to
staff from the Tennessee SBE and the Tennessee Department of Education (TDOE):
a webinar on May 7 to examine the Denver Public Schools Professional
Compensation System, an example of a long-standing and well-researched
alternative compensation system (additional written information was provided in
response to questions on May 16); and
a webinar on June 1 to explore several teacher compensation reforms, featuring
compensation innovations by districts and three states, including recent initiatives
addressing recruitment and retention of STEM teachers through salary
enhancements.
Purposes of Report
The purposes of this report are to:
follow up on the 2013 BEP Review Committee’s discussion and annual report on
teacher compensation and market pay;
provide brief background information on the BEP Committee and the history of
teacher compensation reforms in Tennessee for the 2014 BEP Review Committee
to take into consideration; and
present the literature and evidence on the effectiveness of market pay as well as
examples of emerging practices, challenges, and lessons learned to support the
Committee’s decision-making and build its capacity to make informed decisions
based on the latest information.

300 Summers St., Ste. 1240 • Charleston, WV 25301 • 1-855-355-ARCC (2722) • www.arccta.org
10
Organization of Report
Section II. Key Findings and Recommendations from the 2013 BEP Review
Committee Discussions and Decisions. This section summarizes the history of the Basic
Education Program, the BEP Review Committee and annual report, and the 2013 Annual
Report, in order to provide background for the remainder of the report.
Section III. Tennessee Compensation Reform Context. This section provides an
overview of the history of Tennessee teacher compensation reforms from 1984 to the
present, including career ladders, First to the Top, and differentiated pay plans.
Section IV. Evidence on Teacher Supply and Demand in Tennessee. This section
provides a high-level overview of the evidence on teacher supply and demand in
Tennessee to address the question of whether salary reform is necessary and, if so,
whether these reforms should focus on certain subject or geographic area shortages.
Section V. The Research Base on Market-Based Teacher Pay. This section summarizes
responses to questions about the survey and econometric research related to market-
based teacher pay.
Section VI. Emerging Practices and Lessons Learned By States and Districts. This
section describes the implementation of market-based pay and related salary reforms by
other states and districts, and the lessons learned about the costs, impact, and
characteristics of the new teacher pay policies.
Section VII. Practical Questions and Considerations. This section summarizes key
practical questions that any district or state considering compensation reform should
take into account, elaborating on two considerations: (1) funding teacher compensation
reform, and (2) meaningful stakeholder engagement in compensation reform. It
concludes with a model for engaging teacher voice organizations as one possible way
forward for teacher compensation reform in Tennessee.

300 Summers St., Ste. 1240 • Charleston, WV 25301 • 1-855-355-ARCC (2722) • www.arccta.org
11
Section II: Key Findings and Recommendations from the 2013
BEP Review Committee Discussions and Decisions
Introduction
This section provides a brief history of Tennessee’s BEP, the BEP Review Committee, and
its annual report. It includes a summary from the 2013 BEP Annual Report that focuses on
teacher compensation and market pay.
History of the BEP
In 1992, the Tennessee General Assembly passed the Education Improvement Act, which
increased funding for K-12 education and created the BEP to be a vehicle for equitably
allocating funding to school districts. The act was implemented after the Tennessee
Supreme Court directed the state to develop a better plan to fund education in Tennessee.
The BEP is the funding formula through which state education dollars are generated and
distributed to Tennessee public schools. Phased in over six years beginning in the 1992-
1993 school year, BEP reached full funding during the 1997-1998 school year (see
Tennessee SBE website on BEP).
BEP Review Committee and Annual Report
Tennessee Code Annotated Section 49-1-302(4) (a) specifies that the SBE should establish
a review committee for the BEP. The charge for the committee is as follows:
The BEP review committee shall meet at least four (4) times a year and shall regularly
review the BEP components, as well as identify needed revisions, additions, or deletions
to the formula. The committee shall annually review the BEP instructional positions
component, taking into consideration factors including, but not limited to, total
instructional salary disparity among LEAs, differences in benefits and other
compensation among LEAs, inflation, and instructional salaries in states in the southeast
and other regions. The committee shall prepare an annual report on the BEP and shall
provide the report on or before November 1 of each year, to the governor, the State
Board of Education, the education committee of the Senate and the education committee
of the House of Representatives. This report shall include recommendations on needed
revisions, additions, and deletions to the formula as well as an analysis of instructional

300 Summers St., Ste. 1240 • Charleston, WV 25301 • 1-855-355-ARCC (2722) • www.arccta.org
12
salary disparity among LEAs, including an analysis of disparity in benefits and other
compensation among LEAs.
The BEP Review Committee issued its annual report on November 1, 2013. The report
included recommended revisions, additions, and deletions to the formula, as well as an
analysis of instructional salary disparity among local educational agencies (LEAs). The
report considered total instructional salary disparity among LEAs, differences in benefits
and other compensation among LEAs, inflation, and instructional salaries in the southeast
and other regions.
One report recommendation focused on improving teacher compensation and market pay:
BEP Formula Improvement #2: Recommendation for Improving Teacher
Compensation
In an effort to meet the goal of becoming the fastest improving state in the nation in
terms of student achievement, the BEP Review Committee recognized the need to
create an environment that is attractive to highly effective teachers. Compensation
is an integral component to creating this environment. Therefore, the BEP Review
Committee supports Governor Haslam’s goal of becoming the fastest improving
state in teacher salaries during his time in office and increasing the BEP salary
component accordingly. The BEP Review Committee also suggests that concurrent
with this accelerated rate of teacher salary growth, the state consider conducting a
market compensation analysis of career opportunities that compete for college
student and teacher retention. We believe that to meet the student academic
outcomes necessary to attain our Pre-K to Job goals, recruiting and retaining
teachers into education rather than other occupations is essential for success.
Additionally, market analysis may be helpful to districts as they consider
differentiated compensation models. (Tennessee SBE, BEP Review Committee, 2013,
pp. 5, 17-18).
Over the course of the 2013 meetings, the BEP committee discussed the issue of
competitive teacher compensation and its relationship to recruiting and retaining teachers.
Some committee members expressed the opinion that teacher salaries were too low, but
without consensus about what constitutes “competitive” compensation. The committee
reached a definition of competitive compensation as compensation that would allow the
state to recruit teachers of the quality or caliber that would allow Tennessee to meet
achievement goals, retain great teachers, and reward professionals for high performance
(Tennessee SBE, BEP Review Committee, 2013, p. 37).

300 Summers St., Ste. 1240 • Charleston, WV 25301 • 1-855-355-ARCC (2722) • www.arccta.org
13
The ongoing discussion about adequate teacher compensation was based on three themes
(Tennessee SBE, BEP Review Committee, 2013, pp. 37-38):
1. What should the minimum entry wage be to attract college students with the
problem solving, communications, critical thinking, reading, analytical thinking,
leadership, and other skills necessary to achieve success in virtually any field?
Specifically, what type of entry level salary would be necessary to attract to the
field of teaching those with the skills to enter any career?
2. Given the new and higher standards for K-12, an acute need is anticipated for
those with mastery level skills in the subjects of math and science. What entry
level salaries would be needed to attract college students with specific mastery
in these subjects, considering the higher entry level salaries in specialized fields
such as chemistry and physics?
3. Once the entry level salaries are calculated and a sum total determined, the next
step would be to compare that number to the current total for compensation
(salary and benefits), determine the gap between the current and proposed
compensation, then determine how to close the gap.

300 Summers St., Ste. 1240 • Charleston, WV 25301 • 1-855-355-ARCC (2722) • www.arccta.org
14
Section III: Tennessee Compensation Reform Context
Introduction
The purpose of this section is to provide the BEP Review Committee with background
information on teacher compensation in Tennessee. The first part of this section briefly
describes the current salary schedule for teachers in Tennessee and the percentages of
school expenditures spent on instruction.
The second part of this section provides an overview of teacher compensation reforms
since 1984. It briefly describes the history of Tennessee reforms, beginning with the
career ladder exploration under the Tennessee Comprehensive Education Reform Act.
Next, it explains salary equity plans and the addition of teacher salaries to the purview of
the BEP. Third, it presents an overview of the implementation of differentiated pay plans
from 2007 to the present day, including funding from the Race to the Top grant,
competitive compensation initiatives, and the Tennessee Teacher Incentive Fund (TIF)
grants.
The 2013 BEP Annual Report recommendations build off several decades of teacher
compensation reform in Tennessee that include experimentation with teacher career
ladders (the first in the nation), salary equity, performance-based compensation, and
differentiated pay. Recognizing Tennessee’s leadership in teacher compensation reform,
the U.S. Department of Education awarded several TIF grants to support the state’s
efforts. The current BEP recommendations expand upon these prior efforts, taking
account of past lessons learned from a variety of approaches to improving teacher
compensation.
Current Salary Schedule for Teachers in Tennessee
Tennessee, like approximately half the states in the U.S., sets a minimum salary schedule
for teachers, and sets it annually—one of 10 states that does so (Wesson, 2013). State law
(Tennessee Code Annotated §49-3-306) requires the Commissioner of Education to
formulate a table of training (graduate degrees or credit hours earned) and experience
factors (each year of service) for a state salary schedule that the SBE must approve
(Wesson, 2013). Each school district is required to establish a local salary schedule for all
licensed personnel that meets the state’s minimum; school districts are allowed to
supplement salaries from local funds. Most Tennessee districts have schedules that

300 Summers St., Ste. 1240 • Charleston, WV 25301 • 1-855-355-ARCC (2722) • www.arccta.org
15
exceed the state minimum; approximately 18 districts use schedules equivalent to, or
only slightly above, the state minimum (Brown, 2012, as cited in Wesson, 2013).
Seventeen states (including Tennessee) require districts to pay more to teachers with
advanced degrees, and 19 states (including Tennessee) require districts to reward
teachers for previous years of experience (Wesson, 2013).
In 2013, the average classroom teacher salary in Tennessee was $47,563 (Tennessee SBE,
BEP Review Committee, 2013). This ranks Tennessee 40th in the nation in terms of the
average salaries teachers are paid and 40th in the nation in terms of growth in salaries
over the past decade since 2003-2004 (National Education Association, 2014, p. 94).
According to a recent report on teacher pay by the Center on American Progress, with an
average base pay of $39,100 for a teacher with a bachelor’s degree and 10 years of
experience, mid-career Tennessee teachers who head a family of four or more qualify for
five state benefit programs. The report also indicates that the highest step on the state
salary schedule is $56,900, and that 15 percent of Tennessee’s teachers resort to second
jobs outside of the school system to earn on average an additional $3,700 per year (Boser
& Straus, 2014).
Percentages of School Spending on Instruction
Salaries and benefits for teachers (and other instructional personnel) accounted for 56
percent of Tennessee school spending, totaling $3.02 billion for the 2010-2011 school
year (TDOE Annual Statistical Report 2010-11, as cited in Wesson, 2013). According to
the National Center for Education Statistics (U.S. Department of Education, National
Center for Education Statistics, 2014), the single largest component of public school
expenditures nationwide was instruction, amounting to about 61 percent of the total or
$6,852 per student in 2009-2010. These expenditures included salaries and benefits
received by teachers and teaching assistants, as well as costs for instructional materials
and services provided under contract.
The next section overviews the history of Tennessee’s exploration of teacher
compensation from 1984 to the present, beginning with the Comprehensive Education
Reform Act in 1984.

300 Summers St., Ste. 1240 • Charleston, WV 25301 • 1-855-355-ARCC (2722) • www.arccta.org
16
Overview of the History of Tennessee
Teacher Compensation Reform
This part of section III presents a brief chronological summary of the history of teacher
compensation reform, starting in 1984. Tennessee was one of the first states to explore
teacher compensation and career ladders (Furtwengler, 1987), through its
Comprehensive Education Reform Act.
Comprehensive Education Reform Act and Career Ladder Exploration in
Tennessee (1984-1997)
As part of the Comprehensive Education Reform Act (CERA) (Tennessee Public Acts 20,
Tennessee Annotated Code 49-5-5002(a)), Tennessee began its career ladder program in
1984 (cited in Cour, 2009b). Its purpose was to promote staff development and to reward
teachers and administrators who were evaluated as outstanding. Although initially
established as a mandatory program, the Career Ladder Program was made voluntary in
1987 (Tennessee Comptroller of the Treasury, 1997).
Table 1.
Summary of Early Career Ladder Levels, Eligibility Requirements, and Incentives in
Tennessee
Career Ladder Levels
Eligibility Requirements Incentives
Probationary Teacher
Teacher who received a state certification after a positive evaluation and recommendation from the local school board
None
Apprentice Teacher
Teacher with less than three years of experience who received successful evaluations
$500 stipend
Career Ladder I Teachers with three (3) years of experience who either passed a test or received successful evaluations.
$1,000 stipend
Eligibility for Career Ladder II
Career Ladder II Teachers with six (6) years of experience who received
$2,000 stipend (for 10 month employees)

300 Summers St., Ste. 1240 • Charleston, WV 25301 • 1-855-355-ARCC (2722) • www.arccta.org
17
Career Ladder Levels
Eligibility Requirements Incentives
successful evaluations (including passing a test, developing a portfolio, and evaluations 3/year)
$4,000 stipend (for 11 month employees)
Eligibility for Career Ladder III
Career Ladder III Teachers with ten (10) years of experience who received successful evaluations (including passing a test, developing a portfolio, and evaluations 3/year)
$3,000 stipend
Sources: Cour (2009b); Reddick & Peach (1986); Tennessee Comptroller of the Treasury (1997)
Note: The stipend amounts were reported as of 1997 and may represent much higher values than
seems the case at first.
Implementation and Participation in Career Ladder Program
A 1997 audit of the effectiveness of the Career Ladder Program by the Tennessee
Comptroller of the Treasury reported the following about the program:
Administration. The Career Ladder Program was administered by seven full-time
staff members, 29 contracted evaluators, and four contract staff. The program had
expenditures of nearly $105.6 million in fiscal year 1996.
Teacher participation. As of December 1996, 45,978 teachers were certified on
the Career Ladder: 81 percent at Level I, 7 percent at Level II, and 12 percent at
Level III. Data from the TDOE indicated that a large percentage of Level I teachers
had decided not to climb the Career Ladder, although they were eligible to apply
for certification at Levels II and III. The participation rate (those certified
compared to those eligible to participate) was 77 percent for Level I, 8 percent for
Level II, and 17 percent for Level III. Many teachers began, but did not complete,
the Career Ladder Program evaluation process for Levels II and III. The
completion rate was 52 percent during fiscal year 1995 and 47 percent during
fiscal year 1996 (p. 10).
Extent to which the program reached its goals. Although the Career Ladder
Program appeared to have succeeded in providing pay supplements to educators
evaluated as outstanding, it is unknown the extent to which the program has (1)
300 Summers St., Ste. 1240 • Charleston, WV 25301 • 1-855-355-ARCC (2722) • www.arccta.org
18
reached (and rewarded) the outstanding teachers in Tennessee, (2) improved
teacher performance, or (3) improved student progress and achievement.
Evaluating the effectiveness of the Career Ladder Program is made more difficult
because of legislative changes that may have altered the program’s focus, and
because there are little or no reliable data to link teacher performance to student
achievement.
Issues Identified with the Career Ladder
The audit report identified three key issues with the implementation of the Career
Ladder: the associated evaluation process, conflict with Tennessee’s tenure system, and
the Career Ladder’s impact on stipends for extended contracts.
Evaluation process. Because the evaluation process was lengthy, time
consuming, and costly, and the rewards of certification were somewhat limited,
many truly outstanding teachers may have decided not to participate at the upper
levels. In addition, although Career Ladder Program staff trained the evaluators
and periodically adjusted the evaluation process in an attempt to make it as
objective as possible, the process remained subjective based as it was on very
limited observations of each teacher in the classroom (Tennessee Comptroller of
the Treasury, 1997).
Conflict with tenure system. Under current law, a teacher is awarded tenure at
the end of his or her probationary period (i.e., three years of teaching) if he or she
is reemployed by the same school system. However, that same teacher would not
receive a professional license or Career Level I status until the end of his or her
fourth year of teaching. Therefore, the decision whether or not to award tenure
was made before the teacher was determined sufficiently competent to receive a
professional license or a Career Ladder I certificate. In addition, the decision to
grant Level I certification may have become perfunctory because it was difficult to
deny Level I certification to an already tenured teacher (Tennessee Comptroller of
the Treasury, 1997).
Impact on stipends for extended contracts. Depending on a teacher’s status
with the Career Ladder, s/he became eligible for extended contracts for summer
employment with a stipend of $2,000 per month. Extended contracts became
increasingly difficult for districts to manage (Cour, 2009b).

300 Summers St., Ste. 1240 • Charleston, WV 25301 • 1-855-355-ARCC (2722) • www.arccta.org
19
As a result, in 1997, the Tennessee legislature abolished the Career Ladder for all new
teachers while allowing teachers who had achieved Career Ladder status to continue
receiving stipends (Cour, 2009b).
During the years of the Career Ladder implementation, Tennessee was also addressing
salary equity issues, as described below.
Salary Equity Plan (1995-2002)
In 1995, following the Small Schools II lawsuit and the Tennessee Supreme Court
Decision, the legislature enacted the salary equity plan (Tennessee Code Annotated § 49-
3-366), which was a one-time effort to equalize teacher salaries in those school districts
where the average salary was below $28,094 (as of 1993), but did not include teacher
salaries as a component of the BEP. The plan provided for state and local funds “in
support of teachers’ salary equity” to increase teacher compensation in school districts
averaging less than $28,094 per year per instructional position. The plan required the
state to pay the same percentage of salary equity funds for each school district as it paid
toward the cost of classroom components of the BEP for each district and also required
local governments to appropriate funds sufficient to pay their proportionate share.
However, it did not provide for annual review or cost determination of teacher salaries
under the BEP. In 2002, the Tennessee Supreme Court ruled that the salary equity plan
did not include equalization of teacher salaries (Cour, 2009b).
Teacher Salaries Added to BEP (2004)
In 2004, the Tennessee General Assembly changed the way the BEP calculated teacher
salaries in all districts by providing a set dollar value for each instructional position
(Cour, 2009b). Originally, the BEP formula used a combination of teacher training and
experience to determine teacher salary for each district. Because of this change, the Small
School II lawsuit was officially closed in 2006 since both parties agreed that funding
equity was achieved (Cour, 2009b).
Differentiated Pay Plans in Tennessee (2007-2010)
In 2007, the Tennessee General Assembly passed Public Chapter 376, which required
school districts to develop and adopt differentiated pay plans to “aid in staffing hard-to-
staff subject areas and schools and in hiring and retaining highly qualified teachers.”
(Tennessee Public Acts 2007, Chapter 376):

300 Summers St., Ste. 1240 • Charleston, WV 25301 • 1-855-355-ARCC (2722) • www.arccta.org
20
Develop guidelines for the establishment by LEAs of differentiated pay plans,
including plans which offer bonuses, including performance bonuses, that are
supplemental to the salary schedules required under §49-3-306. Such plans shall
address additional pay for teaching subjects or teaching in schools for which LEAs
have difficulty hiring and retaining highly qualified teachers. The state board of
education shall develop the guidelines by December 31, 2007.
Previously, districts were allowed to have differentiated pay plans but the state did not
require them. The new law required that all school districts “develop, adopt and
implement a differentiated pay plan … to aid in staffing hard to staff subject areas and
schools and in hiring and retaining highly qualified teachers” (Cour, 2009b, p. 4).
SBE Guidelines
The SBE guidelines (2007) stated that submitted plans should address one of the
following areas of need:
recruiting teachers to hard-to-staff schools;
recruiting new teachers;
filling LEA-specific academic shortage areas; or
retaining effective teachers.
The approved plans might include, but were not limited to, loan forgiveness strategies,
fellowships, pay supplements, and/or signing bonuses. Supplements were to be sufficient
to make a difference to teachers (i.e., in the thousands, not hundreds, of dollars). The
plans should make it more likely that LEAs would be able to recruit qualified individuals
into high-need schools and fields, based on data-driven determinations of need as
reviewed by the LEA.
The SBE guidelines required the TDOE to review and approve differentiated district pay
plans only if funds for the plans were “budgeted, continual and approved in advance by
the local board of education” (Cour, 2009, p. 4). Prior to the 2007-2008 school year, the
SBE adopted guidelines for differentiated pay plans, and LEAs submitted the plans to the
Department of Education (Tennessee State Board of Education, June 21, 2013).
Model Differentiated Pay Plans
According to Cour (2009a), 136 districts submitted plans that included some of the
following components:

300 Summers St., Ste. 1240 • Charleston, WV 25301 • 1-855-355-ARCC (2722) • www.arccta.org
21
bonuses for high-need teachers or administrators (82 districts),
tuition reimbursement for endorsements in high-needs areas (48 districts),
bonus for National Board for Professional Teaching Standards certificate (47
districts),
testing fees reimbursed for endorsements in high-need areas (22 districts),
bonus for student achievement gains (9 districts),
class size reductions (8 districts), and
bonus for obtaining additional degrees (5 districts).
Lack of Funding for Implementation
The majority of these plans represent bonus models. According to Cour (2009), since the
legislation did not appropriate additional funds for plans, some districts did not have
adequate funds to pay for the differentiated pay plans. As a result, plans were not
implemented in some districts.
Tennessee State Law Revised in 2010
State law was revised again in 2010 as part of the First to the Top legislation to allow
local school districts to develop alternative salary schedules and submit them to the state
for approval (Public Acts 2010, Chapter 2. Section 12) (cited in Wesson, 2013).
In the alternative option, an LEA may submit to the commissioner its own proposed
salary schedule, subject to collective bargaining where applicable. Implementation of
such a salary schedule must be approved by the commissioner and the SBE. A salary
schedule cannot result in a salary reduction for a teacher employed by the LEA at the
time of the salary schedule’s adoption. Additional expenditures incurred as a result of a
salary schedule are subject to appropriation by the governing body empowered to
appropriate the funds.
Race to the Top Grant and Competitive Compensation Initiatives (2010–
Present)
In 2010, the U.S. Department of Education awarded Tennessee a federal Race to the Top
grant (also known as First to the Top in Tennessee), allocating more than $500 million
toward reforming education across the state. Tennessee was one of two states in the first
round to receive the awards. Developing and retaining great teachers and leaders in
Tennessee’s schools was a cornerstone of the state’s application.

300 Summers St., Ste. 1240 • Charleston, WV 25301 • 1-855-355-ARCC (2722) • www.arccta.org
22
Tennessee’s Race to the Top proposal outlined two competitive compensation initiatives
for LEAs to reward teachers and principals for increasing student achievement:
Competitive Supplemental Fund (CSF) to support the planning of compensation
models by the 28 districts that received the smallest First to the Top local awards
(Total $1.5 million), and
Innovation Acceleration Fund (IAF) to support a district’s adoption and
implementation of alternative compensation systems (Total $12 million).
CSF Grants
The CSF grants were designed to raise student learning by encouraging, guiding, and
rewarding educator effectiveness, while addressing challenges in the recruitment and
retention of highly effective educators (Woods & Clark, 2010). CSF grants were
competitively available to the 28 LEAs with the smallest Race to the Top allocations.
In the 2010-2011 school year, CSF grants were designated for school turnaround
strategies or strategic compensation funding. Six of the eight awarded districts
received $50,000 to plan new compensation systems (Canon, Greenslate, Lewis,
Merchant, & Springer, 2012; Wesson, 2013).
In 2011-2012, CSF grants were targeted to strategic compensation and embedded
professional development (Wesson, 2013). Two districts received funding to
implement plans they had developed the previous year (Wesson, 2013).
In 2012-2013, 13 LEAs implemented projects funded through the third round of
the CSF (Tennessee Department of Education, 2014).
IAF Grants
The IAF grants were four-year grants to support districts in the design and
implementation of sustainable compensation systems based on alternative salary
schedules and rewards for teachers who increase student achievement levels (Wesson,
2013). Compensation programs funded by IAF had to include: (1) an alternative salary
schedule that sets pay for educators on factors other than the state salary schedule; (2)
differentiated performance-based pay for effective teachers and principals (ranging from
$1,500 to $10,000 based on individual and/or group); (3) incentives (financial and/or
working condition improvements) focused on supporting teachers; (4) recruitment and
retention incentives to hire and retain teachers in hard-to-staff subjects and schools; (5)
use of data and evaluation to inform decisions related to professional development,

300 Summers St., Ste. 1240 • Charleston, WV 25301 • 1-855-355-ARCC (2722) • www.arccta.org
23
retention, and tenure; and (6) a sustainability plan evidenced by an increasing reliance on
non-IAF funds by 2012-2013 (Woods & Clark, 2010).
Through two IAF competitions, the state awarded multi-year grants to five grantee LEAs
to design and implement alternative compensation systems that shift away from
compensating educators solely for years of experience and toward compensating them
for raising student achievement (Tennessee Department of Education, 2014).
After initial implementation in school year 2011-2012 of both alternative salary
schedules and a new educator evaluation system, four grantees made payouts based on
performance and analyzed results for continuous improvement (Tennessee Department
of Education, Race to the Top Report, 2014).
In addition to the First to the Top funding for compensation incentives, Tennessee also
received federally funded TIF grants in 2010 and 2012.
Tennessee TIF Grants for Performance-Based Compensation Systems (2010–Present)
The purpose of the TIF grant is to provide financial support to develop and implement
sustainable performance-based compensation systems for teachers, principals, and other
personnel in high-need schools to increase educator effectiveness and student
achievement in those schools (U.S. Department of Education, 2012). In the latest program
priorities, the U.S. Department of Education has encouraged grantees to make their
performance-based educator compensation systems part of a coherent and integrated
approach to strengthening the education workforce. A key feature of a coherent and
integrated approach is alignment of human resource management practices for education
between the state, districts, and schools.
2010 grant. Concurrent with Tennessee’s Race to the Top award, the U.S.
Department of Education awarded the TDOE a $36 million TIF Round 3 grant in
the fall of 2010. TIF grants provide funding over five years to support
development and implementation of performance-based compensation systems
for teachers and principals in high-need schools (i.e., schools with 50 percent or
more of enrolled students from low-income families). Fourteen districts are
participating.
2012 grant. In 2012, the U.S. Department of Education awarded the TDOE an
$18.4 million TIF Round 4 grant to support three rural districts over five years to
develop and implement performance-based compensation systems. The TDOE’s
Recognizing Excellence in Rural Tennessee project builds on recent efforts to

300 Summers St., Ste. 1240 • Charleston, WV 25301 • 1-855-355-ARCC (2722) • www.arccta.org
24
implement a statewide educator evaluation system that ties student outcomes to
educator effectiveness ratings. The three partnering districts will develop
performance-based educator evaluation systems based on state-approved models,
provide leadership opportunities for their most effective teachers, and offer
opportunities for high-quality, targeted job-embedded professional development.
Through these federal grants, a number of Tennessee districts are exploring teacher
compensation reform. In addition, a number of districts have received funding from
private foundations and local businesses.
Private Funders of Tennessee Initiatives that Include Compensation Reform
According to Wesson (2013), some Tennessee districts have received private foundation
funding for initiatives that included teacher compensation. For example, the Memphis
School District received a $90 million grant from the Bill & Melinda Gates Foundation in
2009, supplemented with $20 million from local businesses and foundations, to fund its
multi-year Teacher Effectiveness Initiative (Wesson, 2013).
The Milken Family Foundation is supporting the implementation of the Teacher
Advancement Program (TAP) in Knox County School District. Teachers in the district’s 18
TAP schools receive additional compensation if they assume roles as mentors or mentor
teachers. TAP career path bonuses are paid on top of traditional salary schedules. In
addition, Knox County School District has implemented a strategic compensation system,
APEX (Advance-Perform-Excel), which consists of numerous bonus opportunities (e.g.,
schools with higher student growth, performance incentives for high-performing
teachers, and instructional support incentives) (Wesson, 2013).
Summary of District Funding Sources and Types of Compensation Models
Table 2 presents a summary of districts receiving grants for teacher compensation
reform and the types of compensation models. In total, ARCC was able to locate
information on 27 districts (out of Tennessee’s 140 school districts) that received funding
between 2010-2011 and 2011-2012, several of which received funding from multiple
sources.

300 Summers St., Ste. 1240 • Charleston, WV 25301 • 1-855-355-ARCC (2722) • www.arccta.org
25
Table 2.
Summary of Tennessee Districts Receiving Grants for Teacher Compensation Reform and Types of Compensation Models
District CSF Grants
IAF Grants
2010 TN TIF Grants
2012 TN TIF Grants
2012 NIET TIF Grant
Private Foundations
Compensation Model Type
1. Bradford SSD Bonus
2. Etowah County (1 school)
TAP System
3. Hollow-Rock Bruceton
Bonus
4. Lexington City Salary & Bonus
5. South Carroll Bonus
6. Trousdale Salary & Bonus
7. Davidson County Bonus
8. Hamilton County Bonus
9. Jackson County (1 school)
TAP System
10. Johnson County Salary & Bonus
11. Knox County Bonus & TAP System

300 Summers St., Ste. 1240 • Charleston, WV 25301 • 1-855-355-ARCC (2722) • www.arccta.org
26
District CSF Grants
IAF Grants
2010 TN TIF Grants
2012 TN TIF Grants
2012 NIET TIF Grant
Private Foundations
Compensation Model Type
12. Lebanon SSD Bonus
13. McMinn County Bonus
14. Manchester County
TAP System
15. Metropolitan Nashville Public Schools
Bonus
16. Putnam County Salary & Bonus
17. Scott County Bonus
18. Shelby County Bonus
19. Tipton County Bonus
20. Chester County Salary, Bonus, Teacher-Leadership roles, & hard-to-staff incentives
21. Haywood County Schools
Salary, Bonus, Teacher-

300 Summers St., Ste. 1240 • Charleston, WV 25301 • 1-855-355-ARCC (2722) • www.arccta.org
27
District CSF Grants
IAF Grants
2010 TN TIF Grants
2012 TN TIF Grants
2012 NIET TIF Grant
Private Foundations
Compensation Model Type
Leadership roles, & PD incentives
22. Lincoln County Schools
n/a
23. Polk County Schools
n/a
24. Athens City TAP System
25. Morgan City TAP System
26. Memphis City Schools
Bonus
CSF (Competitive Supplemental Fund) IAF (Innovation Acceleration Fund) TIF (Teacher Incentive Fund) NIET (National Institute for Excellence in Teaching) TAP (The System for Teacher and Student Advancement) is a comprehensive reform that links performance-based compensation to systems and processes such as professional development, evaluation, and career advancement. n/a = not available. Sources: S. Flowers, personal communication, July 8, 2014; Model types identified by Canon et al., (2012) and Tennessee SBE (2014). Note: ARCC staff were not able to identify the districts with the most recent CSF and IAF grants.

300 Summers St., Ste. 1240 • Charleston, WV 25301 • 1-855-355-ARCC (2722) • www.arccta.org
28
Approaches of Fourteen Districts to Strategic Compensation
According to the external evaluator of the CSF, IAF, and TIF programs (Tennessee
Consortium on Research, Evaluation, and Development), as of 2012, 14 districts were
approaching strategic compensation as follows (Canon et al., 2012):
Every district model featured performance-based bonuses for certified employees
and used a mix of individual, school, and district accountability units and flat and
tiered award structures. The percent of awards based on student performance
ranged from 18 to100 percent.
Districts determined bonuses on the basis of the previous year’s performance and
included Tennessee Comprehensive Assessment Program proficiency levels,
Tennessee Value-Added Assessment System scores, summative evaluation scores,
and district- and school-level assessments.
Four districts revamped their entire salary schedules.
District salary schedules differed along three key dimensions:
o starting base salary for the 2011-2012 school year;
o incremental increases based on performance, which ranged from 1 to 3
percent; and
o plans for employees who opt out (for example, three districts allowed
employees to remain on the state salary schedule and receive state raises and
steps up).
For more detailed information on the 14 district compensation plans, refer to the website
of the Tennessee Consortium on Research, Development, and Evaluation.
http://www.tnconsortium.org/projects-publications/compensation-reform/index.aspx
Differentiated Pay Plans (2013-Present)
Since 2013, both the SBE and the TDOE have renewed efforts to address differentiated
pay plans.
SBE guidelines. In 2013, the Tennessee SBE issued differentiated pay plan guidelines,
pursuant to Tennessee Code Annotated §49-3-306(h), which requires districts to create
and implement differentiated pay plans. The differentiated pay plan policy does not
mandate pay for performance. However, the revised differentiated pay plan policy
prevents districts from basing across-the-board pay increases solely on years of
experience or advanced degrees. Districts must differentiate teacher compensation based

300 Summers St., Ste. 1240 • Charleston, WV 25301 • 1-855-355-ARCC (2722) • www.arccta.org
29
on at least one additional criterion. Differentiated pay criteria can include any of the
following: additional roles or responsibilities, hard-to-staff schools or subject areas, and
performance based on SBE-approved teacher evaluation criteria (Tennessee State Board
of Education, 2013).
TDOE resources. To assist districts in the design and implementation of differentiated
pay plans, the TDOE maintains a website with a variety of information and resources
(http://www.tennessee.gov/education/districts/pay.shtml). Resources include:
Tennessee Consolidated Retirement System letter regarding differential pay and
earnable compensation,
2014-2015 Differentiated Pay Plan Submission Template,
two resource guides,
three webinars,
information from the Compensation Accelerated Planning Cohort Sessions, and
frequently asked questions.
2014-2015 district differentiated pay plan submission. TDOE (2013) requires
districts to submit 2014-2015 differentiated pay plans using a template. The template
includes the following information:
I. Description of differentiated elements that includes hard-to-staff school, subject,
or placement; performance; additional instructional roles or responsibilities;
education, experience, and “other” background; compensation type and size,
reach, estimated cost, and estimated salary expenditures;
II. Salary schedule that includes proposed 2014-2015 schedule and description of
how the district would allocate future state funding increases;
III. Eligibility and Stakeholder Engagement (optional section); and
IV. Alternative Salary Schedule (optional section) that includes salary schedule,
eligibility criteria, feasibility analysis, and stakeholder engagement.
Beginning in 2014-2015, the TDOE will begin to enforce the law for district
implementation of differentiated pay plans.
As of this date, ARCC does not have information on how many districts have received
approval for their differentiated pay plans.
300 Summers St., Ste. 1240 • Charleston, WV 25301 • 1-855-355-ARCC (2722) • www.arccta.org
30
Summary
Since 1984, Tennessee has been a leader in addressing teacher compensation and salary
equity among states. Tennessee was one of the first states to explore career ladders, in
1984. Since then, Tennessee has instituted policies and regulations to address salary
equity (in 1995) and to design differentiated pay plans (since 2007). Currently,
Tennessee uses a variety of public and private financial resources, as well as policy
guidance and resources, to assist districts in teacher compensation reforms.

300 Summers St., Ste. 1240 • Charleston, WV 25301 • 1-855-355-ARCC (2722) • www.arccta.org
31
Section IV: Evidence on Teacher Supply and Demand in
Tennessee
Introduction
The concepts informing market-based pay are not new. In 1983, A Nation at Risk called
for teacher salaries that are “professionally competitive, market-sensitive, and
performance-based,” guidelines which were subsequently adopted by various states as a
basis for their teacher compensation reform initiatives (National Commission on
Excellence in Education, 1983). The programs that followed the publication of A Nation at
Risk nearly universally addressed the performance-based element of the guidelines, with
few if any programs focused on salaries that were professionally competitive or market-
based.
As Table 3 shows, over the past decade, the most prevalent teacher salary reform in
school districts has been higher pay for achieving National Board for Professional
Teaching Standards certification, considered an indicator of a teacher’s effectiveness.
Meanwhile, the least prevalent approach has been to pay teachers more for working in
less desirable locations. (No districts have adopted a market-based pay approach.) School
districts reported slight increases in the prevalence of various types of compensation
reform between 2003-2004 and 2011-2012; however, the percentage offering teachers
no financial incentives also increased over that time period.

300 Summers St., Ste. 1240 • Charleston, WV 25301 • 1-855-355-ARCC (2722) • www.arccta.org
32
Table 3.
Prevalence of District Compensation Reform Initiatives Over Time
2003-04 2007-08 2011-12
Types of rewards Percent Percent Percent
National Board for Professional Teaching Standards
18.4 24.5 24.5
Excellence in teaching 7.9 10.2 11.3 In-service professional development 24.2 n/a n/a Teach in less desirable location 4.6 5.7 5.6 Teach in fields of shortage 11.9 15.4 13.5 Number of incentives None 55.5 61.0 61.3 1 incentive 29.8 27.0 27.6 2 incentives 9.7 8.0 7.1 3 incentives 3.9 3.1 2.9 4 incentives 1.0 0.9 1.1 5 incentives 0.2 n/a n/a
Sources: U.S. Department of Education, National Center for Education Statistics, Schools and Staffing
Surveys, Public School District Data Files (2003-2004, 2007-2008, and 2011-2012)
Whereas performance-based teacher salaries serve to address the structure of teacher
salaries to ensure that those who work hardest or are most effective are paid more than
others, market-based teacher salaries serve to address the level of teacher salaries to
ensure that they are sufficiently competitive to attract and retain high-caliber teachers
for every subject and every school. As Tennessee continues to explore effective and cost-
effective approaches for improving teacher recruitment, retention, and performance,
attention has turned to options for teacher salary innovations through market-based pay.
But doing so requires a clear understanding of the market—including the nature of
teacher shortage in Tennessee’s school districts, the non-pecuniary factors affecting
teacher shortage, and the salaries of professionals in industries competing for the same
talent pool as the teaching profession. A complete analysis of these factors is out of the
scope of this report; however, relevant data available are summarized below.
Interpreting teacher supply and demand data is complicated by a lack of consensus about
the most meaningful teacher supply and demand metrics (Behrstock, 2009). Although the

300 Summers St., Ste. 1240 • Charleston, WV 25301 • 1-855-355-ARCC (2722) • www.arccta.org
33
available data for Tennessee do not paint an entirely coherent picture of whether and
where there are teacher shortages in the state of Tennessee, they do provide worthwhile
information. Most notably, the data suggest that teacher shortages continue to challenge
Tennessee’s schools.
Teacher Shortages in Tennessee
Several studies conducted since 2009 address teacher supply and demand in Tennessee.
The investigations analyzed current and projected needs for teachers, teacher retention,
teacher retirement, and teachers graduating from teacher preparation programs in
Tennessee. These studies will be discussed in turn below.
First, the 2012 report of the Tennessee Department of Labor and Workforce
Development found that the teaching profession—including elementary, middle, and
secondary schools, and special education—faced a personnel shortage. Teacher
unemployment data, college completion numbers, and expected demand based on
occupational projections revealed this shortage. In contrast, significant surpluses of
educational administrators, instructional coordinators, English education teachers, and
teacher educators were found (Hedges & Wettemann, 2012).
Teacher shortages identified by the state of Tennessee for 2014-2015 (U.S. Department of
Education, 2014) include:
English (Grades 7-12),
English as a Second Language (Pre-Kindergarten - Grade 12),
Mathematics (Grades 7-12),
Science (Grades 7-12),
Social Studies (Grades 7-12),
Special Education (Kindergarten-Grade 12), and
World Languages (Grades 7-12).
Whether these shortages are due to supply or demand factors is not entirely clear given
data limitations, but supply and demand data are presented below for consideration.

300 Summers St., Ste. 1240 • Charleston, WV 25301 • 1-855-355-ARCC (2722) • www.arccta.org
34
Tennessee Teacher Demand Data
Projected Needs for 2013-2014 School Year
A 2009 Tennessee Supply and Demand study (Bruce, Fox, Douglas, Reynolds, & Yang,
2009) estimated that the total number of teachers needed to staff the state’s public
schools was on the rise and expected to be 73,456 by the 2013-2014 school year. This
demand for teachers was based on a calculation of pupil enrollment projections per grade
divided by the minimum of the statutory pupil-teacher ratios for each grade and the
current (2009) pupil-teacher ratios.
In terms of secondary STEM teachers, the study estimated that the total number of public
secondary school math teachers would be 2,318 and the total number of secondary
science teachers would be 1,736 in 2013-2014.
It is important to note that these numbers do not account for changes in demand related
to teacher quality or effectiveness—for example, teachers rated Effective or Highly
Effective in their evaluations.
Tennessee Teacher Supply Data
Bruce et al. (2009) predicted that in 2014, after accounting for those 2009 teachers who
remained in the teacher supply pool, the new teacher supply from teacher preparation
programs, and teachers who returned to the classroom after time away, the gap between
supply and demand would be 17,553. It also is worth noting that the study modeled
teacher retention and found that teachers with higher base salaries and more salary
supplements were more likely to remain in their current district than were teachers who
were paid less.

300 Summers St., Ste. 1240 • Charleston, WV 25301 • 1-855-355-ARCC (2722) • www.arccta.org
35
Teacher Retention Data
A study of Tennessee teacher retention from 2011-2012 to 2012-2013 by the TDOE
(2014) found that:
Eight percent of Tennessee’s teachers left the state’s public schools entirely, and
about 10 percent of Tennessee’s teachers were employed at a different Tennessee
school in the 2012-2013 school year.
Highly effective minority teachers were considerably more likely to leave
Tennessee public schools than other highly effective teachers.
Teachers who earned higher evaluation scores were retained at slightly higher
rates than teachers who earned lower evaluation scores.
Early career teachers were slightly less likely to be retained than other teachers.
Although teachers at all experience levels sometimes moved to different schools
within the same district, early career teachers were the most likely to move across
districts. Highly effective early career teachers tended to be retained at slightly
higher rates than other early career teachers.
Substantial variation occurred across districts in overall retention rates, retention
rates of teachers earning high evaluation scores, and the degree to which highly
effective teachers were retained at a higher rate than other teachers.
According to a 2014 report by the Alliance for Excellent Education, teacher attrition from
the profession costs Tennessee somewhere in the range of $23 million to more than $50
million per year, depending on the calculation employed (Haynes, 2014).
Teacher Retirement Data
A 2013 TDOE study of recent retirement trends among Tennessee teachers found:
Between 2008 and 2012, the rate of teacher retirement from the workforce
increased from 2.0 percent to 3.5 percent. This means that Tennessee loses about
2,000 teachers a year to retirement.
Retiring teachers consistently rated lower in effectiveness than those teachers
eligible for retirement who chose to remain in the classroom. Retiring teachers
consistently rated lower than all remaining teachers regardless of eligibility for
retirement.

300 Summers St., Ste. 1240 • Charleston, WV 25301 • 1-855-355-ARCC (2722) • www.arccta.org
36
Tennessee New Teacher Supply Data
According to the Tennessee Higher Education Commission and Tennessee SBE (2013), 42
teacher preparation programs are currently reviewed as part of the report card on the
effectiveness of teacher training programs. The findings of the 2013 Report Card on
teacher preparation are presented below.
2011-2012 Teacher Preparation Data
The Tennessee Higher Education Commission and Tennessee SBE (2013) reported the
following information about completers of teacher preparation programs:
Of the 4,900 completers, 86 percent were white, 77 percent female, and 88
percent from Tennessee. The majority of 2011-2012 graduates from teacher
training programs in the state were white females from Tennessee.
The most common endorsement area for program completers continued to be
Elementary K-6 education with 1,975 endorsements, followed by Middle Grades 4-
8 with 571 endorsements.
As part of First to the Top, Tennessee made a commitment to increasing the
number of STEM teachers. Program completers in 2011-2012 earned 557 STEM
endorsements; these account for 10 percent of all endorsements received that
year.
Table 4 provides a summary of the 2011-2012 teacher training program completers and
their endorsement areas.

300 Summers St., Ste. 1240 • Charleston, WV 25301 • 1-855-355-ARCC (2722) • www.arccta.org
37
Table 4.
Endorsement Areas Earned by 2011-2012 Tennessee Teacher Training Program Completers
Endorsement Area Percentage of All Endorsements
Early Childhood Education 7%
Elementary Education (K-6) 34%
Middle Grades 10%
STEM* 10%
Special Education* 11%
Social Studies* 6%
English (7-12)* 5%
Physical Education (K-12) 4%
Fine Arts 5%
English as a Second Language*(PK-12)
3%
Foreign Languages* 2%
Other 3%
*Indicates high need areas
Source: Tennessee Higher Education Commission and Tennessee SBE (2013)
Table 5 provides a summary of the 2011-2012 teacher training program completers and
their STEM endorsement areas while Table 6 identifies the Tennessee institutions of higher
education with the largest number of STEM endorsements.

300 Summers St., Ste. 1240 • Charleston, WV 25301 • 1-855-355-ARCC (2722) • www.arccta.org
38
Table 5.
Number of STEM Endorsement Areas Earned by 2011-2012 Graduates
STEM Subjects Numbers of Endorsements
Percentage of all STEM Endorsements
Mathematics 258 46.3%
Biology 148 26.5%
Chemistry 65 11.6%
Agricultural Education 35 6.2%
Physics 24 4.3%
Agriscience 17 3.0%
Earth Science 10 1.7%
Total 557
Source: Tennessee Higher Education Commission and Tennessee SBE (2013)

300 Summers St., Ste. 1240 • Charleston, WV 25301 • 1-855-355-ARCC (2722) • www.arccta.org
39
Table 6.
Tennessee Higher Education Institutions with the Largest Number of STEM Endorsements
Institution Endorsements Percentage Statewide
Middle Tennessee State University 48 9%
University of Tennessee, Knoxville 47 8%
Teach Tennessee 46 8%
University of Tennessee, Martin 46 8%
Source: Tennessee Higher Education Commission and Tennessee SBE (2013)
The report also included information on the placement and retention of graduates from
Tennessee preparation programs.
Placement and Retention of Tennessee Graduates from Teacher Preparation
Programs
The data in Table 7 are based on the program completers in the Personnel Information
Reporting System (PIRS). The years refer to the number of years since the completers
graduated and became eligible to teach. Therefore, these data help us to estimate the rate
at which an institution’s graduates enter and remain in the teaching field in Tennessee
public schools.
The data show that approximately 5,000 individuals complete teacher preparation
programs in Tennessee each year, about half of whom remain in Tennessee and are
teaching in schools within one year; however, the percentage of teachers who continue in
the classroom declines over time (Tennessee Higher Education Commission and
Tennessee SBE, 2013).

300 Summers St., Ste. 1240 • Charleston, WV 25301 • 1-855-355-ARCC (2722) • www.arccta.org
40
Table 7.
Numbers of Completers Continuing to Teach in Tennessee Public Schools
Cohort Year
Number of Completers
Teaching in Year 1
Teaching in Year 2
Teaching 3 Consecutive Years
Teaching 3 out of 4 Years
2008-2009 4,277 54.8% 62.5% 47.5% 48.7%
2009-2010 5,082 60.3% 63.4% 41.2%
2010-2011 5,109 52.9% 43.7%
2011-2012 4,900 48.1%
Source: Tennessee Higher Education Commission and Tennessee SBE (2013)
It is worth noting that no data are available on teacher recruitment other than these preparation
program data. Such data might include survey data on the views of college or high school
students, particularly those with a STEM interest, toward selecting teaching as a career.
Summary
Since 2009, Tennessee has identified shortages in the overall numbers of K-12 teachers
needed for public schools as well as teachers for specific subjects. There is a critical need
in the state for STEM teachers, as well as shortages in high school English, social studies,
world languages, Pre-K through high school special education, and English as a second
language. The need for STEM teachers, however, is occurring at the same time that
approximately 20 percent of all U.S. jobs require a high level of knowledge in a STEM field
(Rothwell, 2013). The U.S. Bureau of Labor Statistics (2011) estimates that by 2018
Tennessee will have 109,000 STEM jobs (cited in My College Options and STEM
Connector, 2013). Public school districts will have to compete to recruit and retain STEM
teachers in a variety of innovative ways, including via compensation.
A market-based pay strategy would build on the differentiated pay policy that already
exists, encouraging accurate and thoughtful analysis of data from other sectors to ensure
that differentiation does in fact affect the labor market decisions that teachers make.
Essentially, market-based pay would draw more attention to the levels of teacher salaries
as opposed to the present and historical focus on the structure of teacher salaries. It

300 Summers St., Ste. 1240 • Charleston, WV 25301 • 1-855-355-ARCC (2722) • www.arccta.org
41
would enable districts to consider on a subject-by-subject and school-by-school basis
whether salaries were sufficient to attract and retain enough teachers of the right caliber
for all students.

300 Summers St., Ste. 1240 • Charleston, WV 25301 • 1-855-355-ARCC (2722) • www.arccta.org
42
Section V: The Research Base for Market-based Teacher Pay
Introduction
Due to the substantial resources at stake and the unparalleled importance of the work teachers
do, basing teacher effectiveness policies on solid evidence is important. Yet the evidence base
is often lacking or produces mixed results. This section outlines responses to 12 questions
about the nature of the research related to teacher pay, more generally, and market-based
teacher pay, in particular.
1. Overall, how should we characterize the research literature on the
evidence base of market-based teacher pay?
Researchers have evaluated market-based teacher pay, defined as salaries aligned with
the salaries available in other labor markets, only minimally. This may reflect, in part, the
paucity of examples of teacher compensation policies that pay the market rate. There is,
however, a good deal of evidence relating to the impact of pay on teachers, both in terms
of perceptions and observations about the importance of teacher pay for teacher
recruitment, retention, and, possibly, teacher effectiveness.
The research base on teacher pay consists of two bodies of literature: survey literature
emerging from the education and sociology fields (which asks teachers whether and why
they chose to join or leave, or planned to join or leave the teaching profession), and
econometric analyses (which reports on observed changes in teacher recruitment or
attrition as it relates to teacher salaries). There is a dichotomy in the two bodies of
literature, which do not reference or build upon one another; although both suggest on
the whole that salaries matter to teachers, the survey research tends to downplay the
importance of salaries to teachers compared with other policy supports, whereas the
econometric research consistently concludes that teacher salaries have a positive effect
on teacher retention, if not on other outcomes (Behrstock, 2009). Given the challenges
associated with interpreting both bodies of research (described below in items 5 and 9),
the evidence base at this juncture does not support unambiguous conclusions about
teacher pay overall.
Overall, the weight of the evidence suggests that salaries (if not salaries alone) can affect
teacher retention, as concluded by a comprehensive literature review of teacher

300 Summers St., Ste. 1240 • Charleston, WV 25301 • 1-855-355-ARCC (2722) • www.arccta.org
43
recruitment and retention in the United States conducted by Guarino, Santibanez, and
Daley (2006), which states:
Overall, recent empirical literature found that higher salaries were
associated with lower teacher attrition. This finding is directly in line with
the predictions of labor market theory.
Similarly, an international literature review by Dolton (2006) concludes that improving
teacher pay could reduce teacher shortages.
The evidence base on differential pay policies, however, is less promising than the
evidence about the impact of teacher salary on recruitment and retention. There are no
published studies about two programs that introduced narrowly defined market-based
teacher pay: Douglas County Public Schools (Colorado) and The Equity Project (New
York). Likewise, little research examines recent innovations that elevate pay for teachers
in hard-to-staff schools and subjects. As Podgursky (2011) notes, “Given the central role
of teachers in school performance and of compensation in K-12 school spending, we
conclude that educator compensation is a surprisingly undeveloped area of education
policy research.” Experimentation with market-based pay is so new that Kolbe and
Strunk’s (2012) typology of teacher incentive policies does not even include this
approach (although several approaches could be construed as pertaining to market-
based pay). Their typology includes:
salary schedule modifications
o state-mandated minimum salary levels
o across-the-board salary increases
o alternative salary schedules
o “front-loaded” or “back-loaded” salary schedules
salary enhancements
o salary credits
o additional pay for teaching in a subject or location with a shortage
o additional pay for certifications or credentials
o additional pay for extra responsibilities
o tax waivers and credits
o transportation subsidies

300 Summers St., Ste. 1240 • Charleston, WV 25301 • 1-855-355-ARCC (2722) • www.arccta.org
44
limited duration incentives
o signing bonuses
o relocation incentive
o credential or certification bonus
o performance-based rewards
o loan forgiveness
o home ownership assistance
education-and-training-related incentives
o tuition subsidies and remission
o pre-service teacher scholarships and stipends
o alternative routes to teacher certification
o tuition tax credits
in-kind incentives
o housing assistance
o subsidized meals
o access to local amenities
retirement benefit waivers
o return-to-work policies
o deferred retirement
2. What does the survey research literature suggest about the
importance of pay for teacher retention?
Numerous studies have gauged the perceptions of teachers and former teachers about
the importance of salary for retaining teachers. Using nationally representative data from
the largest national dataset on teacher mobility, the Teacher Follow-up Survey (Ingersoll
2003) asked former teachers about the factors that led them to leave, and found poor
salaries at the top of the list of sources of dissatisfaction both for teachers who changed
schools (49 percent) and teachers who left the profession (61 percent). Focusing
specifically on new teachers who left the teaching profession after their first year,
Ingersoll and Smith (2003) found that about two-thirds left either to pursue another job
or due to dissatisfaction with the teaching profession; of those who left due to
dissatisfaction, the percent of respondents who cited poor salaries as one of their top
three reasons (79 percent) was more than double the percent of respondents who cited
the next most common factor as a source of dissatisfaction, student discipline (35
percent).

300 Summers St., Ste. 1240 • Charleston, WV 25301 • 1-855-355-ARCC (2722) • www.arccta.org
45
According to the Teacher Follow-up Survey, nearly half (47 percent) of the teachers who
left teaching reported moving to occupations that paid better (Keigher & Cross, 2010).
However, nearly a quarter of teachers who left actually took a pay cut. Although we do
not know why these teachers left—whether they were let go for poor performance or left
because of dissatisfaction with working conditions or for some other reason—this finding
suggests that salary is one of many reasons that teachers leave the profession.
Interestingly, the only aspects of employment as a teacher that they perceived to be
better than their current profession were benefits, making a difference in the lives of
others, and job security.
Figure 1. Former Teachers Compare Aspects of Teaching and their New Positions
%
%
41
41
4
4
4
%
%
1
1
2
19%
24%
32
32
37%
38%
%
%
3%
5%
6%
47%
47%
50%
53%
56%
28%
30%
34%
22
9%
10
3%
20%
0%
13%
20%
19%
6%
13%
17%
10%
0% 20% 40% 60% 80% 100%
Job security
Benefits
Opportunities for making a difference in the lives of others
Social relationships with colleagues
General work conditions
Safety of environment
Influence over workplace policies and practices
Opportunities for learning from colleagues
Availability of resources and materials/equipment for doing your job
Manageability of workload
Professional prestige
Opportunities for professional advancement or promotion
Salary
Recognition and support from administrators/managers
Autonomy of control over own work
Ability to balance personal life and work
Former public school teachers' ratings of aspects of their work that are better in their current
position than in teaching(Keigher & Cross, 2010)
Better in current position Better in teaching Stayed the same

300 Summers St., Ste. 1240 • Charleston, WV 25301 • 1-855-355-ARCC (2722) • www.arccta.org
46
Various states have also explored teacher perceptions of the importance of salaries to
retention. For example, surveying former Illinois public school teachers, DeAngelis
Peddle, Trott, and Bergeron (2002) found that 11 percent who left their positions
reported salary as the primary reason for their decision. These surveys do not capture
whether more effective or less effective teachers attributed leaving the profession to
inadequate salaries.
Surveying nearly 40,000 current teachers, Scholastic and the Bill & Melinda Gates
Foundation (2012) found that 75 percent of teachers cited higher teacher salaries as an
important or very important factor for improving teacher retention. It is important to
note that the Scholastic Survey and other studies (Rochkind, Immawahr, Ott, & Johnson, ,
2006; Hirsh & Emerick, 2007; Farkas, Johnson, & Foleno, 2000) found that higher
salaries, although rated as highly important, are rated lower than other professional
supports (such as supportive principals, student discipline, and professional learning
opportunities), an issue which warrants further investigation (discussed briefly below in
item 5).
A survey of teachers in Florida by Kersaint, Lewis, Potter, and Meisels (2007) found that
financial benefits were of medium importance to those who left the profession and of low
importance to those who remained in the profession. It may be the case that salaries (and
other conditions of the profession, for that matter) are less problematic for those
remaining in the profession than for those who opted to leave or never entered the
profession at all (the evidence base on the impact of pay on teacher recruitment is
discussed below in item 3).
Few surveys have specifically asked teachers about the importance of pay for working in
hard-to-staff schools. (Surveys have asked hypothetically about the fairness of paying
teachers more for doing so, and these are described below.) DeAngelis et al. (2002)
addressed this question with teachers in Illinois. The authors found that, although half of
the surveyed teachers stated there were certain challenging schools where they would
refuse to teach, nearly one-third believed higher salaries would in fact entice them to
teach in these unattractive schools. Also, the Retaining Teacher Talent survey by Public
Agenda and American Institutes for Research (AIR) asked a nationally representative
sample of 890 public school teachers if they planned to make teaching a lifelong career
and, of those who did not see teaching as a lifelong career, which factors might make
them change their mind. “A significantly higher salary” ranked at the top of the list of
factors that definitely would or might change their mind (63 percent of those who

300 Summers St., Ste. 1240 • Charleston, WV 25301 • 1-855-355-ARCC (2722) • www.arccta.org
47
planned to leave said it would definitely change their mind, and 29 percent said that it
might change their mind) (Coggshall et al., 2009).
Figure 2. Factors that would Change Teachers’ Minds about Leaving the Profession
Only one survey, conducted by TNTP in 2013, asked effective teachers about the
importance of salaries to their retention (this survey is described below in item 10).
%
34%
37%
38%
38%
46%
63
37%
32%
37%
29%
27%
29%
0% 10% 20% 30% 40% 50% 60% 70% 80% 90% 100%
Being able to teach part time and still get benefits
Having less paperwork to fill out
Reducing the number of students in your classes
Working with a principal who really helps youimprove your effectiveness as a teacher
Working with a team of highly motivated teachers
A significantly higher salary
What factors might change your mind about leaving teaching?
Would change my mind Might change my mind

300 Summers St., Ste. 1240 • Charleston, WV 25301 • 1-855-355-ARCC (2722) • www.arccta.org
48
3. What does the survey research literature suggest about the
importance of pay for teacher recruitment?
Only two published studies address the relationship between teacher salaries and
teacher recruitment in the United States. One of these, by Milanowski (2003), focuses
specifically on the recruitment of teachers in science and mathematics (discussed below
in item 10). The other study was conducted by McKinsey & Company (2010), as part of a
series of studies of the world’s best school systems and factors that make them strong
(Auguste, Kihn, & Miller, 2010). McKinsey & Company conducted market research of
1,600 high-performing college students. They asked these college students to compare
teaching to their top alternate profession across a variety of characteristics.
The characteristics that relate to salaries included:
If they did well, would they be paid appropriately?
Could they support a family on their salary?
Does the career pay appropriately for the skills and effort they would bring?
Are starting salaries competitive?
Would salaries increase appropriately over time?
For these characteristics, only 10-17 percent of those surveyed believed that teaching
rated well. In contrast, 65-81 percent of those surveyed believed their chosen (non-
teaching) profession rated well on the above characteristics. Compared with the
characteristics associated with factors other than salaries, these discrepancies between
what teaching offers and what their chosen career offers were the largest. This suggests
that teacher salaries are indeed a key factor at play when academically able college
students are choosing a career.
Also of note is that more than half of the survey respondents underestimated the average
teacher starting salary and the average teacher maximum salary. Still, in a related survey
of students from the top-third of their college class who did enter teaching, only 30
percent believed that they could financially support a family with their teaching career
(Auguste, Kihn, & Miller, 2010).
One very recent study is worth noting. In June 2014, the Organisation for Economic Co-
operation and Development (OECD) completed its Teaching and Learning International
Survey (TALIS) of high school teachers, marking the first year that the United States
300 Summers St., Ste. 1240 • Charleston, WV 25301 • 1-855-355-ARCC (2722) • www.arccta.org
49
participated. A key finding was that, although 89 percent were satisfied with their
profession overall, only 34 percent believed teaching is valued by U.S. society. The report
notes, “The perceived value of the teaching profession by society is important in
attracting, recruiting and retaining high-quality teachers” (Organisation for Economic
Cooperation and Development, 2014). Research has not adequately explored the
relationship between teacher salaries and the sense teachers have that society does not
value their work.
4. What does the survey research literature suggest about the
importance of pay for teacher effectiveness?
The Retaining Teacher Talent survey by Public Agenda and AIR asked the following open-
ended question of a national sample of teachers: What one thing would you change in
order to improve the teaching profession? Salaries were the second most popular
response, although it is worth observing that teachers noted many additional policy and
practice options as optimal ways to improve the teaching profession (Coggshall et al.,
2009).

300 Summers St., Ste. 1240 • Charleston, WV 25301 • 1-855-355-ARCC (2722) • www.arccta.org
50
Figure 3. Teachers’ Top-Rated Changes to Improve the Profession
2%
3%
4%
5%
6%
6%
7%
8%
8%
8%
8%
9%
10%
11%
13%
14%
0% 2% 4% 6% 8% 10% 12% 14% 16%
More instructional time/Different school schedule
Supportive administration/Good leadership
Don't know/Refused
Respect/Better public perception of teachers
Secure/Equal funding for education
More time for planning/collaboration
Reduce non-teaching responsibilties/Less paperwork
Well behaved/Prepared/Motivated students
Less emphasis on standardized testing/Less time spenttesting/Teaching to a test
Smaller class size/Lower teacher to student ratio
Other
Better training/Professional development/Mentoring for teachers
Less politics/Government mandates/Interference
Parental involvement/Accountability/Support/Communication
Higher teacher salaries
Greater Professionalism/Accountability/Empowerment
What one thing would you change to improve the teaching profession?
300 Summers St., Ste. 1240 • Charleston, WV 25301 • 1-855-355-ARCC (2722) • www.arccta.org
51
The survey also provided respondents with a list of 12 policy changes and asked which
they believed would be “very effective” for improving teaching. “Increasing teacher
salaries to levels similar to other professional jobs such as lawyers and doctors” was seen
as a “very effective” approach by about half of the respondents (see Figure 5 under item
10).
5. What are the benefits and limitations of relying on survey-based
research?
Interpreting the survey research presents a set of challenges. First, surveys represent
only perceptions or beliefs; they do not reflect actual behavior (e.g., whether teachers
actually enter or leave the teaching profession at higher rates when salaries are
increased), which is discussed below in items 6-8. In addition, on a sensitive topic like
compensation, survey research may be subject to socially acceptable response bias.
Finally, it can be a challenge to interpret the relative importance of various professional
characteristics that emerge in the survey research. For example, it is not always clear
how to interpret, from a policy perspective, a finding that teacher pay is important to a
large majority of teachers but rated as less important than daily working conditions. This
challenge is further complicated by the fact that survey questions about salaries are
usually not specific; that is, teachers might respond very differently to a question about
the impact on the profession of increasing salaries by a minor amount than a question
about significantly increasing teacher salaries.
6. What does the econometric/observational research literature
suggest about the importance of pay for teacher retention?
The econometric research consistently finds that rather large salary increases might be
required to effect significant improvements in teacher retention. Dozens of econometric
studies have examined the impact of teacher pay in the United States. A “meta-analysis”
of this research by Borman and Dowling (2008) concludes that salaries are an important
factor in the retention of beginning teachers and even more so for experienced teachers.
This body of research goes back many years. Examining North Carolina teachers,
Murnane, Singer and Willett (1989) found that teachers paid $2,000/year less than the
state average were twice as likely to leave teaching as teachers paid $2,000 more than the
state average (note these figures would be higher in 2014 dollars). Of relevance to STEM

300 Summers St., Ste. 1240 • Charleston, WV 25301 • 1-855-355-ARCC (2722) • www.arccta.org
52
teacher retention, Murnane and Olsen (1990), again focusing on North Carolina teachers,
found that salaries as well as “opportunity costs” (the foregone salaries an individual
could have earned elsewhere) influenced how long teachers remained in the profession.
Stinebrickner (1998) found that the length of time teachers remained in the profession
was more responsive to salaries than to improved working conditions, including pupil-
teacher ratios. Focusing on Wisconsin teachers, Imazeki (2005) found that teacher
salaries would have to increase by 15-20 percent for Milwaukee teacher retention rates
to increase to rates similar to other Wisconsin schools. Imazeki also found that higher
salaries for experienced teachers had some effect on the retention of less experienced
teachers, because it was an indicator of future earnings potential. Focusing on schools in
Texas, Hanushek, Kain, and Rivkin (2001) found that increased pay of 20, 30, or even 50
percent might be needed to increase teacher retention in high-need schools to levels
similar to other schools.
A related body of research examined the impact of teacher retention bonuses, rather than
salaries. Most recently, the Tennessee Consortium on Research, Evaluation, and
Development found that Level 5 (i.e., the most effective) teachers who received bonuses
to work in Tennessee Priority Schools (i.e., the 5 percent most high-need schools) were
23 percent more likely to remain in a Priority School after receiving a $5,000 bonus than
were Level 4 teachers in those schools, who did not receive bonuses. The impact of the
bonuses seemed only to apply to teachers in tested grades and subjects, however
(Springer, Rodriguez, & Swain, 2014). Two other recent teacher retention bonus studies
worth mentioning are Dee and Wyckoff’s study of the Washington D.C. IMPACT initiative
and the Mathematica study of the Talent Transfer Initiative.
Like the Tennessee Consortium on Research, Evaluation, and Development study, Dee
and Wyckoff (2013) examined the difference in teacher retention among the most highly
rated teachers and those slightly less highly rated and, therefore, ineligible for the same
financial incentive under the IMPACT initiative. Under IMPACT, the highest rated
teachers qualified for a one-time bonus of up to $25,000 and, after a second consecutive
year achieving that rating, a permanent base salary increase of up to $27,000 per year.
Contrary to the studies noted above, the bonus/salary incentive in D.C. did not have a
statistically significant impact on teacher retention during the year studied (although the
authors noted some contextual factors that might explain this). The financial incentives
did, however, have positive and statistically significant effects on teacher performance.

300 Summers St., Ste. 1240 • Charleston, WV 25301 • 1-855-355-ARCC (2722) • www.arccta.org
53
The Mathematica study (Glazerman et al., 2013) examined the impact of $20,000 bonuses
(paid over two years) for effective teachers who transferred to (and remained in) low-
performing schools. Looking at such policies in 10 school districts across seven states, the
study found that retention of effective teachers in these schools was significantly higher
(93 percent compared to 70 percent for those who did not receive bonuses), but this
effect disappeared after the two-year bonus period ended.
To make a difference to teachers, researchers suggest that financial incentives must be in
the $10,000-$20,000 range (Springer, Rodriguez, & Swain, 2014; Feng, 2009).
7. What does the econometric/observational research literature
suggest about the importance of pay for teacher recruitment?
There are fewer econometric studies in the United States that explore the relationship
between teacher salaries and teacher recruitment. Hanushek and Pace (1995) estimated
that a 10 percent salary increase would result in a 0.7 percentage point increase in the
number of university graduates choosing teaching as a career. Manski (1987) estimated
that a 1 percent wage increase would result in a 2-3 percent increase in teacher supply.
8. What does the econometric/observational research literature
suggest about the importance of pay for teacher effectiveness?
It is often the case that econometric studies cannot detect any statistically significant
impact of various policies on student achievement, and this is true for studies that have
attempted to identify a link between higher teacher pay and student achievement. A
review of research by Hanushek and Rivkin (2004), as described by Podgursky (2011),
found little evidence of a strong positive effect of teacher pay on student achievement. Of
118 estimates of this relationship reviewed, 73 percent were statistically insignificant, 20
percent were positive and statistically significant, and 7 percent were negative and
statistically significant. Looking at studies of states with value-added measures, of the 17
estimates reviewed, 82 percent were statistically insignificant and 18 percent were
positive and statistically significant. In studying a single district’s data, Jacob and Lefgren
(2004) did not find a statistically significant relationship between teacher pay and
teacher performance.

300 Summers St., Ste. 1240 • Charleston, WV 25301 • 1-855-355-ARCC (2722) • www.arccta.org
54
In contrast, as noted above, Dee and Wyckoff’s (2013) study of D.C. IMPACT did find that
the possibility of a $25,000 bonus and $27,000 base salary increase had a positive effect
on teacher performance. Figlio (2002) also identified a positive impact of teacher salaries
on teacher quality. Likewise, looking at U.S. Census data, Loeb and Page (2000) found that
higher teacher salary levels had a statistically significant positive effect on lowering
student dropout rates and increasing college attendance.
9. What are the benefits and limitations of relying on
econometric/observational research?
Although the econometric research examines what actually results when teacher salaries
change, they are limited in two key ways. First, these studies cannot ascertain the
potential impact of states and districts actually paying teachers market-level wages,
because we do not yet have examples of large-scale experimentation of this policy.
Second, the econometric research is limited by available data sets, which only capture
easily measurable, quantifiable data. As a result, they can be used to analyze the impact
(or lack thereof) of teacher salaries on student test scores, but not on social, emotional, or
other educational outcomes.
10. What is the evidence concerning teacher salaries for specific
groups of teachers, such as math/science teachers or teachers
from Generation Y?
The views of effective teachers. To date two surveys have examined the views of
effective teachers on the teaching profession, one of which addressed the question of
teacher pay. This survey, conducted by TNTP (2013), asked “irreplaceables” (teachers
recognized for their effectiveness by various awards and accolades) the top three aspects
of the teaching profession that served to retain them. Only six percent of these effective
teachers cited compensation as one of the top three reasons they stay. In contrast, when
asked what they most disliked about their job, low pay was the third most commonly
cited factor, with 10 percent of “irreplaceable” teachers mentioning this drawback. The
highest ranked drawbacks for these teachers were insufficient classroom resources (16
percent) and bureaucracy/paperwork (15 percent). Responding to a separate question,
29 percent of the surveyed teachers reported that a higher salary would make them feel
more appreciated (TNTP, 2013).

300 Summers St., Ste. 1240 • Charleston, WV 25301 • 1-855-355-ARCC (2722) • www.arccta.org
55
The impact of salaries on STEM teacher recruitment and retention. Many of the
econometric studies described above find that salaries have a greater impact on teachers
of math and science than other teachers, probably reflecting the opportunities, including
opportunities for higher pay, open to them outside the teaching profession. Rumberger
(1987) examined the effect of salaries on math and science teacher shortages, as
measured by the percentage without a standard certification. The finding was that
salaries influence teacher shortages. Specifically, a $1,000 increase in the discrepancy
between 1979 salaries for teachers and for engineers was associated with a 0.19
percentage point worsening of teacher shortages.
Milanowski (2003) explored the amount by which starting teacher salaries would have to
increase in order to convince undergraduates without ambitions to teach to change their
minds. Focusing on students with academic backgrounds in mathematics and science, he
found a somewhat linear relationship between the amount that starting teacher salaries
would have to improve and the percent of undergraduates who would teach (e.g., a 23
percent increase in starting salary would attract about 18 to 23 percent of the
participants and a 45 percent increase would attract 37 to 48 percent of the participants).
Goldhaber, DeArmond, Liu, and Player (2007) examined data from the 1993 class of
college graduates in the national Baccalaureate and Beyond Longitudinal Study to
estimate the salaries that individuals with different educational backgrounds could earn
as teachers or in other professions. They found that, despite relatively attractive starting
teacher salaries, the salaries offered by the private sector surpassed salaries for public
school mathematics and science teachers within a few years, and the earnings gap
continued to widen as teachers progressed in their careers, reaching a $24,000
differential 10 years after college.
Views on differential pay. According to data from the 2003-2004 Schools and Staffing
Survey, as reported in Podgursky (2011), teachers were less favorable toward providing
bonuses to teachers in shortage subject areas (favored by 12 percent of respondents),
than to teachers in high-need locations (favored by 63 percent of respondents), or
teachers who achieved National Board certification (favored by 20 percent of
respondents). Only 6 percent favored bonuses for teachers who performed well on
evaluations. These results roughly mirror the 2009 nationally representative Retaining
Teacher Talent survey by Public Agenda and AIR, which showed the percentages of
teachers who strongly favored or somewhat favored financial incentives for different types
of teachers. The Retaining Teacher Talent survey included an oversampling of teachers

300 Summers St., Ste. 1240 • Charleston, WV 25301 • 1-855-355-ARCC (2722) • www.arccta.org
56
from Generation Y (born between 1977-1995) and showed that, although this incoming
cohort of teachers exhibited greater support for certain types of differential teacher pay,
the differences between Generation Y and older teachers were not statistically significant
(Coggshall et al., 2009).
* These differences are not statistically significant.
Figure 4. Teachers’ Views on Differential Salaries
The Retaining Teacher Talent survey asked teachers to provide their assessment of 12
different policy options that covered a wide range of proposed strategies to improve
teaching. Despite their relative openness to differential pay (presented above in Figure
4), basing pay on student performance emerged as the lowest-rated policy option to
increase the effectiveness of teachers, with only 10 percent of Generation Y teachers and
8 percent of older teachers believing that “tying teacher rewards to their students’
performance” is a “very effective” way to improve teaching. Interestingly, the overall
rankings among all of these options are strikingly similar for teachers of all generations.

300 Summers St., Ste. 1240 • Charleston, WV 25301 • 1-855-355-ARCC (2722) • www.arccta.org
57
Figure 5. Teachers’ Views on Strategies that would be “Very Effective” for Improving the
Profession
11. What additional research is underway that will address the above
questions?
In autumn 2014, Mathematica will release two noteworthy studies. The first is a study of
the impact of paying teachers the market-rate of $125,000, with an annual bonus
available up to $25,000, in New York City’s The Equity Project charter school (see
description below). Mathematica is also conducting the second forthcoming study, which
will assess the impact of the 2010 five-year federal TIF initiative. Specifically, the study
will evaluate the impact of the country’s most innovative performance-based teacher pay
programs on student achievement and teacher turnover and recruitment in 250 schools
in 15 school districts. The grantees were required to implement higher pay for teachers
based on performance, additional roles and responsibilities, and targeted professional
development, but an optional element of the grant—which was encouraged—was higher
pay to recruit and retain effective teachers in high-need schools and hard-to-staff
subjects.

300 Summers St., Ste. 1240 • Charleston, WV 25301 • 1-855-355-ARCC (2722) • www.arccta.org
58
12. What can be learned from internal/external program evaluations
of teacher compensation reform initiatives in other states and
districts?
There have been numerous evaluations of experiments with compensation reform.
Although most of these are not “market-based compensation,” narrowly defined, there
are many that include an element of this approach. For instance, the fourth cohort of TIF
grantees (awarded in 2012) included six grantees with a STEM focus: Washoe County
School District (Nevada), School Board of Orange County (Florida), Houston Independent
School District (Texas), Calcasieu Parish School System (Louisiana), South Carolina
Department of Education, and the National Institute for Excellence in Teaching (Iowa).
Each of these six grantees offered salary augmentations for effective STEM teachers in
high-need schools, with the goal of improved recruitment and retention. In some cases,
the grantees made explicit comparisons between local salaries for teachers and salaries
for other professionals. Although these grantees are in the early stages of
implementation, and impact evaluations are not publicly available, these grantees may be
able to provide preliminary evidence of impact upon request. Additional promising
programs described in the next section may also be able to provide unpublished impact
data.
Summary
Overall, the evidence suggests that salaries matter for teacher recruitment and retention,
and possibly for teacher effectiveness. However, salaries are by no means the only factor
that matters, and salary increases must be significant to make a difference. No program
evaluations were found that would offer the type of impact data that could be used to
guide salary reform policies with confidence, but several examples are adequate to guide
further experimentation, dialogue, and reflection, as described in the next section.

300 Summers St., Ste. 1240 • Charleston, WV 25301 • 1-855-355-ARCC (2722) • www.arccta.org
59
Section VI: Emerging Practices and Lessons Learned by States
and Districts
Introduction
As noted earlier, experiments with alternative teacher compensation to date have had
mixed or unclear impact in Tennessee and across the nation. Although more than half of
the states mandated or implemented a pilot or full career ladder program in the 1980s,
all but four states discontinued their programs by the mid-1990s, due to high costs,
reduced teacher cooperation in reaction to a more competitive environment, and
difficulty in measuring the success of the programs (Wesson, 2013). (See Section V for a
discussion of the research.) As described in Section III, since 1984, Tennessee has focused
on salaries as a lever to alleviate teacher shortage problems. Yet, as described in Section
IV, despite these efforts, teacher recruitment, attrition, motivation, and morale continue
to present challenges. This section addresses five questions relating to approaches taken
by other states and districts. Specifically, it offers examples of market-based and related
efforts to increase salaries within existing budgets, as well as efforts to increase teacher
pay, particularly for STEM teachers, by extending existing budgets.
1. Where has market-based pay been implemented?
Leaders in education often look to successful strategies in the private sector for guidance,
and according to a 2012 survey of human resources managers, primarily in the U.S., one
business trend is increased focus on market-based pay, with 64 percent of respondents
claiming that their organizations now use a market-based approach (WorldAtWork and
Deloitte Consulting, LLP, 2012). In education, however, there are only two instances of
market-based pay, as narrowly defined: Douglas County, Colorado, and The Equity
Project charter school in New York City. Neither initiative has yet been evaluated for its
impact, but The Equity Project has achieved strong student learning results and its five-
year impact evaluation will be released in autumn 2014.
Douglas County, Colorado
Beginning in the 2012-2013 school year, the Douglas County School District introduced a
market-based pay system for new hires in the school district. Returning teachers received
raises plus retention bonuses, depending on their date of hire and contract renewal. By
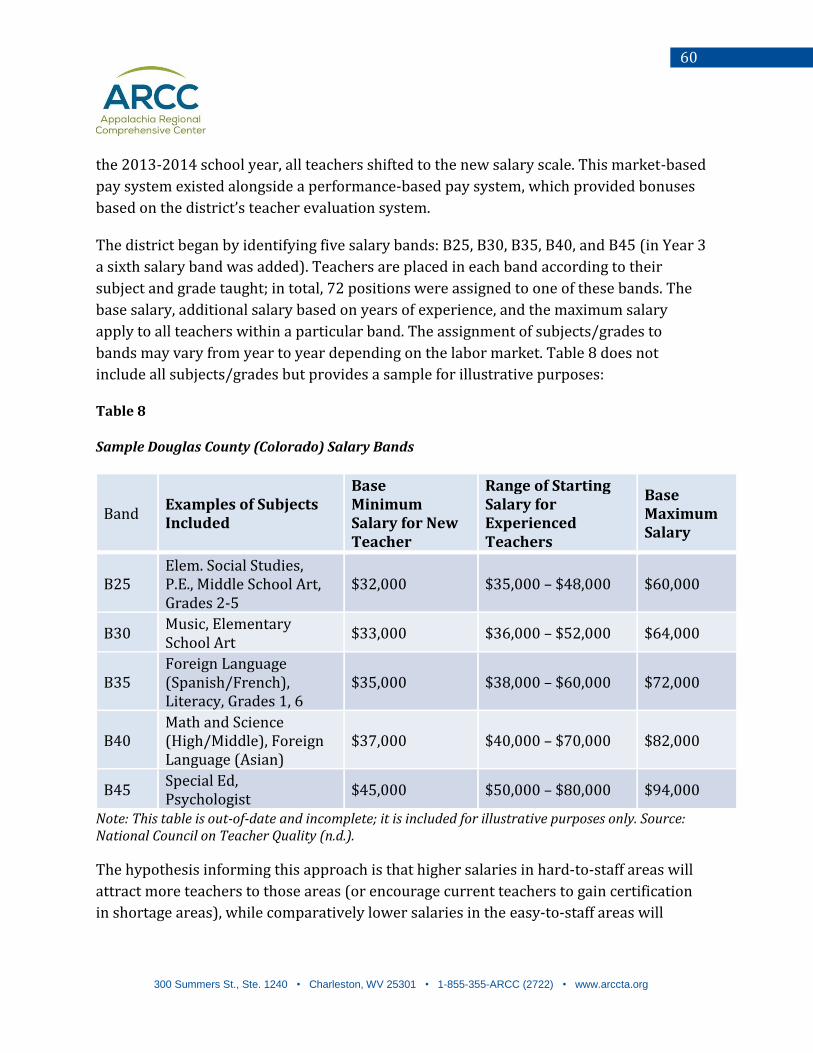
300 Summers St., Ste. 1240 • Charleston, WV 25301 • 1-855-355-ARCC (2722) • www.arccta.org
60
the 2013-2014 school year, all teachers shifted to the new salary scale. This market-based
pay system existed alongside a performance-based pay system, which provided bonuses
based on the district’s teacher evaluation system.
The district began by identifying five salary bands: B25, B30, B35, B40, and B45 (in Year 3
a sixth salary band was added). Teachers are placed in each band according to their
subject and grade taught; in total, 72 positions were assigned to one of these bands. The
base salary, additional salary based on years of experience, and the maximum salary
apply to all teachers within a particular band. The assignment of subjects/grades to
bands may vary from year to year depending on the labor market. Table 8 does not
include all subjects/grades but provides a sample for illustrative purposes:
Table 8
Sample Douglas County (Colorado) Salary Bands
Band Examples of Subjects Included
Base Minimum Salary for New Teacher
Range of Starting Salary for Experienced Teachers
Base Maximum Salary
B25 Elem. Social Studies, P.E., Middle School Art, Grades 2-5
$32,000 $35,000 – $48,000 $60,000
B30 Music, Elementary School Art
$33,000 $36,000 – $52,000 $64,000
B35 Foreign Language (Spanish/French), Literacy, Grades 1, 6
$35,000 $38,000 – $60,000 $72,000
B40 Math and Science (High/Middle), Foreign Language (Asian)
$37,000 $40,000 – $70,000 $82,000
B45 Special Ed, Psychologist
$45,000 $50,000 – $80,000 $94,000
Note: This table is out-of-date and incomplete; it is included for illustrative purposes only. Source: National Council on Teacher Quality (n.d.).
The hypothesis informing this approach is that higher salaries in hard-to-staff areas will
attract more teachers to those areas (or encourage current teachers to gain certification
in shortage areas), while comparatively lower salaries in the easy-to-staff areas will

300 Summers St., Ste. 1240 • Charleston, WV 25301 • 1-855-355-ARCC (2722) • www.arccta.org
61
signal the market reality to teachers and aspiring teachers, and free up resources to
address the shortage areas.
Evaluation of outcomes. No studies have yet been conducted on the initiative. But in an
informal discussion on July 22 with Brian Cesare, Chief Human Resources Officer, and
Mary Chesla, Compensation Director, they reported increases in the number of applicants
per vacancy and anecdotal reports of higher quality applicants and interest among
current teaching staff in career pathways to higher-paying positions. Communications
and messaging around the market-based pay approach, however, was identified as a
challenge.
For more information on Douglas County Schools, visit
https://www.dcsdk12.org/district/about-douglas-county-school-district
The Equity Project Charter School, New York City
In 2009, The Equity Project (TEP) Charter School was established in the Washington
Heights neighborhood of New York City. The school, serving students from Grades 5 to 8,
pays each teacher a salary of $125,000, with an annual bonus available up to $25,000.
The Equity Project has adopted three strategies—the three R’s for teachers—to attract
and retain high-quality teachers.
Rigorous qualifications. Teachers are experts in subject matter, teaching,
curriculum development, and verbal skills.
Redefined expectations. Student achievement is improved through daily peer
observations and co-teaching, a six-week summer development institute, and a
mandatory sabbatical once every five or six years.
Revolutionary compensation. Teachers receive salaries of $125,000 and a bonus
of up to $25,000 based on school-wide performance.
The theory behind this type of approach to market-based pay is that recruiting excellent
teachers for every student becomes more feasible if salaries (and other working
conditions) more closely reflect the labor market pay for professionals with the right mix
of talent, skill, and dedication. Not only will excellent teachers be drawn to the higher
salaries, according to this view, they will also be drawn to the high-caliber colleagues who
will also be recruited through such competitive salaries. The high salaries are funded
within the regular New York City school budget primarily through cuts in administration

300 Summers St., Ste. 1240 • Charleston, WV 25301 • 1-855-355-ARCC (2722) • www.arccta.org
62
(e.g., the vice-principal is also a full-time teacher and teachers assume most other tasks
typically under the purview of administrators), class sizes of 30, and fixed electives.
Evaluation of outcomes. No research has yet been published but the five-year impact
study will be released in autumn 2014. Nonetheless, preliminary data (The Equity Project
Charter School, 2014) show that in 2012-2013, the school:
received an overall grade of “A”,
received a percentile rank of 90 (this means that TEP placed within the top 10
percent of all middle schools in New York City based on data from 2012-2013,
TEP's fourth year of operation),
ranked in the top 5 of all charter middle schools in New York City, and
was one of only four charter middle schools in New York City to achieve a top 10
percent ranking in each of the past two years.
Moreover, in an informal meeting on July 17, Zeke Vanderhoek, Founder and Principal of
Equity Project Charter School, noted that the school’s long-term growth percentile for
mathematics is the second highest among the 330 middle schools in New York City and
the growth percentile for reading is significantly above the New York City state average.
In addition, Vanderhoek noted that student attendance is in the top one percent for New
York City; the teacher applicant pool is very capable with more experience than typical
for hiring in New York, and the teacher retention rate is 90 percent (among the 75
percent of teachers invited to return each year). Vanderhoek also reported the school has
seen annual surpluses of $700,000 to $1 million.
For more information on the Equity Project Charter School, visit
http://www.tepcharter.org

300 Summers St., Ste. 1240 • Charleston, WV 25301 • 1-855-355-ARCC (2722) • www.arccta.org
63
2. What other innovative approaches to increase teacher pay,
particularly in shortage areas, have been implemented?
Numerous initiatives by both states and districts have sought to increase teacher pay,
particularly to recruit and retain teachers in shortage areas. Metro Nashville Public
Schools is currently piloting Public Impact’s Opportunity Culture Model, one promising
initiative. Other innovative pay reforms include TIF grants focused on STEM subjects in
high-need schools, Mission Possible in Guilford County (North Carolina), and statewide
STEM teacher recruitment and retention initiatives in Georgia, Ohio, and Virginia.
Public Impact’s Opportunity Culture Model
The Opportunity Culture Model, introduced by Public Impact, provides teachers with
restructured professional growth and career opportunities, based on their strengths,
leadership skills, and impact on student achievement. The goal of an Opportunity Culture
is to extend the reach of excellent teachers and their teams to more students, for more
pay within available budgets. The new job models and age-appropriate use of technology
in an Opportunity Culture allow teachers to focus on their strengths and interests and
advance in their careers without being forced out of the classroom. When properly
planned, an Opportunity Culture can pay all teachers more—and excellent teachers much
more.
Participating schools must follow the Opportunity Culture Principles, which require
extending the reach of excellent teachers, often through teacher-led teams; paying
teachers more within budget; providing in-school time for planning, collaboration, and
development; and matching accountability to each person’s responsibilities.
The Opportunity Culture hinges on a cycle of:
teacher selectivity in terms of who enters the profession, by ensuring financially
rewarding and developmentally engaging careers that provide supportive,
collaborative working environments;
opportunity for advancement that retains impact in the classroom through
differentiated teacher leadership roles, collaboration with peer teams, and co-
teaching, all designed to provide on-the-job learning and to play to individual
teacher strengths in instruction;

300 Summers St., Ste. 1240 • Charleston, WV 25301 • 1-855-355-ARCC (2722) • www.arccta.org
64
higher pay that reaches six figures without increasing class size by re-allocating
funds through differentiated roles, including paraprofessionals, academic resource
teachers, and teacher leaders.
Figure 6 illustrates this cycle:
Figure 6. Public Impact Opportunity Culture Model
Public Impact estimates that the Opportunity Culture model can increase the pay of
excellent teachers by 130 percent, within existing budgets.
Implementation Partner Sites
Since 2012, Public Impact has worked to identify and partner with several school districts
to implement the Opportunity Culture Model. Partnership sites include:
Metro Nashville Public Schools’ Innovation Zone (see description below);
Charlotte-Mecklenburg Schools in North Carolina (Project L.I.F.T.);
Syracuse City School District (four of the highest-need schools in New York’s fifth-
largest district are using teacher-led teams to design new staffing models); and
Cabarrus County, North Carolina.
In addition, several charter school networks have adopted models related to the
Opportunity Culture Principles.

300 Summers St., Ste. 1240 • Charleston, WV 25301 • 1-855-355-ARCC (2722) • www.arccta.org
65
Opportunity Culture in Metro Nashville Public Schools
With funding from the federal School Improvement Grant program, Metro Nashville Public
Schools (MNPS) created the Innovation Zone in summer 2011 to provide greater resources,
flexibility and autonomy to its high-priority schools (Public Impact, 2013). Three schools—
Buena Vista Elementary, Robert Churchwell Museum Magnet Elementary, and Bailey STEM
Magnet Middle School—will begin their second year of implementing a Multi-Classroom
Leadership model under Opportunity Culture in fall 2014. Funding for Public Impact’s
work with MNPS comes from federal School Improvement Grant funds provided to MNPS.
The Opportunity Culture initiative is made possible in part by funding from Carnegie
Corporation of New York, the Bill & Melinda Gates Foundation, and The Joyce Foundation.
Evaluation of outcomes. No studies have yet been conducted on the impact of
Opportunity Culture in MNPS or the other pilot sites. However, the Gates Foundation
recently funded data-collection that will enable Opportunity Culture site leaders and
external audiences to view rich information about the progress of implementation and
the effect on teachers and students.
2012 TIF Grantees
Authorized in 2006 by P.L. 109-149, TIF grants provide financial support to develop and
implement sustainable performance-based compensation systems for teachers,
principals, and other personnel in high-need schools in order to increase educator
effectiveness and student achievement in those schools (U.S. Department of Education,
2012).
The TDOE was among the 2012 TIF grantees. In addition to implementing performance-
based compensation systems tied to rigorous teacher and principal evaluation systems,
2012 TIF grantees are expected to implement comprehensive human capital
management systems. Six 2012 grantees were selected to implement programs with a
specific focus on STEM teachers. The South Carolina and Houston Independent School
District programs are described below.
South Carolina Department of Education
The South Carolina Department of Education (SCDOE) will build on previous TIF efforts
to expand its human capital management system in high-need LEAs across South
Carolina, with an emphasis on recruiting and retaining teachers to strengthen science,

300 Summers St., Ste. 1240 • Charleston, WV 25301 • 1-855-355-ARCC (2722) • www.arccta.org
66
technology, and mathematics. SCDOE partnered with the National Institute for Excellence
in Teaching’s TAP program and seven LEAs. At the time the TIF application was
submitted the school districts and numbers of schools served included: Barnwell 19
(three schools); Beaufort 01 (eight schools); Florence 3 (four schools); Jasper 1 (one
school); Laurens 56 (one school); Lee 1 (four schools); and Orangeburg 4 (three schools)
(South Carolina Department of Education, 2012).
Funding. 2012 TIF initial funding amount (two years): $5,272,237; total (five-
year) project cost: $24,672,570
Amount of incentives for STEM teachers. $7,500 for hard-to-staff subjects in
high-need schools if teachers received a successful effectiveness rating the first
year; $3,750 if they received a successful effectiveness rating the second year, and
$3,750 if they received a successful effectiveness rating the third year; total
$15,000 (South Carolina Department of Education, 2012)
Type of incentive. Limited duration incentive
Evaluation of outcomes. ARCC was unable to find any information on an evaluation.
Houston Independent School District
The Houston Independent School District (HISD) human capital management system and
performance-based compensation system will focus on teacher effectiveness and growth
in student learning both across the campus and for individual teachers. Teachers at 24
high-need schools will be eligible for incentives. This project will allow HISD to increase
and retain the number of effective teachers teaching poor, minority, and disadvantaged
students in hard-to-staff subjects, increase principal effectiveness, and increase student
achievement. The project will increase the number of high-quality STEM teachers,
especially in the earlier grades, so that students are prepared for college and careers
(Houston Independent School District, 2012).
In its grant application (2012), HISD proposed a $10,000 sign-on bonus for STEM
teachers who transferred from non-participating TIF schools to participating TIF schools,
or teachers outside of HISD with student growth data who made a five-year commitment.
Retention bonuses of $5,000 would be available to STEM teachers who received effective
or highly effective ratings and met criteria for student growth scores.

300 Summers St., Ste. 1240 • Charleston, WV 25301 • 1-855-355-ARCC (2722) • www.arccta.org
67
Funding. 2012 TIF Funding Amount (two years): $7,714,032; total (five-year)
project cost: $15,938,747
Amount of incentives for STEM teachers. $10,000 sign-on bonus and $5,000
retention bonus
Type of incentive. Limited duration incentive
Evaluation of outcomes. ARCC was unable to find any information on an evaluation.
District and State Compensation Reforms Addressing STEM Teachers
Numerous initiatives around the country are aimed at improving STEM teaching through
salaries, career ladders, and other approaches. This section highlights several recent
efforts by a school district and three states to include STEM teachers in compensation
reform: Guilford County Schools (NC) and the states of Georgia, Ohio, and Virginia.
Guilford County, North Carolina
In 2006, Guilford County Schools launched Mission Possible, a comprehensive teacher
incentive program. The district selected twenty schools in its first year of implementation
based on socioeconomic factors, teacher turnover rates, state accountability, and
Adequate Yearly Progress goals.
Funding. Initially, the superintendent and the district financed the program by (1)
increasing average fifth-grade class size by 0.5 students, thus reducing the total
number of fifth-grade teachers across the district and (2) leaving 30 teaching
assistant positions vacant. The district allocated $2,073,624 in local funding for
the Mission Possible program for the 2006-2007 school year (Rowland, 2008). In
addition to local funding, the district has received two TIF grants.
2006 TIF grant. In 2006, Guilford County Schools received $8 million through a
TIF grant to expand Mission Possible to eight additional schools. Recruiting
incentives ranged from $2,500 to $10,000 and performance incentives ranged
from $2,500 to $5,000. To receive the individual performance incentive, teachers
had to complete 100 percent of the yearly prescribed professional development
activities and earn value-added scores at least one standard error above the
district mean (Rowland, 2008).

300 Summers St., Ste. 1240 • Charleston, WV 25301 • 1-855-355-ARCC (2722) • www.arccta.org
68
Amount of incentives for STEM teachers in 2006. Grade 6-12 math teachers
with a degree in mathematics or 24 hours of training in a STEM area received
$9,000, and Algebra I teachers received $10,000 (Rowland, 2008).
2010 TIF grant. Later, the district expanded Mission Possible through a $23
million 2010 TIF grant to an additional 20 schools. Recruitment incentives were
added beyond math to include biology and chemistry teachers and teachers of
exceptional children.
Amount of incentives for STEM teachers in 2010. By the 2010 TIF grant, the
recruitment bonuses were $5,000.
Type of incentive. Limited duration incentive
Evaluation of outcomes. According to the 2010 external evaluation report, the district
received 591 math applications in 2007 and 412 applications in 2008, with the result that
all vacancies were filled in 2008 (SERVE at UNCG, 2010).
Eighty-seven percent of the Mission Possible teachers from the 2006-2007 school year
returned for the 2007-2008 school year (Rowland, 2008).
For all personnel receiving incentives, the Mission Possible personnel turnover rate
dropped from 29.4 percent in 2007-2008 to 13.3 percent in 2008-2009 (SERVE, 2010).
Unfortunately, the 2010 external evaluation report did not analyze the retention rates of
mathematics teachers.
For more information on Guilford County Public Schools, Mission Possible, visit
http://www1.gcsnc.com/depts/mission_possible/background.htm
Georgia Differentiated Compensation for New Math and Science
Teachers
In 2009, the Georgia General Assembly approved House Bill 280, which created
differentiated compensation for math and science teachers. The bill included a
compensation determining process for secondary (grades 6-12) teachers linked to
certification and a compensation determining process for K-5 teachers linked to a
certificate endorsement.
A secondary school teacher in a local school system who is or becomes certified
in math or science by the Professional Standards Commission shall be moved to
the salary step on the state salary schedule that is applicable to six years of

300 Summers St., Ste. 1240 • Charleston, WV 25301 • 1-855-355-ARCC (2722) • www.arccta.org
69
credible service (which equates to salary step four) unless he/she is already on
or above the salary step.
A kindergarten or elementary school teacher who receives an endorsement in
math, science, or both from the Professional Standards Commission, shall
receive a stipend of $1,000 per endorsement for each year such endorsement is
in effect, up to a maximum of five years. (Georgia House Bill 280, 2009).
The program was to begin on July 1, 2010.
Funding. The governor and legislature approved funding for the program under
the Quality Basic Education Program in its first year at $9.59 million (Georgia
Department of Education, 2011). Georgia’s Alliance of Education Agency Heads
Math/Science Task Force proposal for differentiated compensation (2008)
estimated that entry level math and science teachers, new hires, would obtain
substantial salary raises: $4,560 at the T4 Level, $5,245 at T5, $5,926 at T6, and
$6,577 at T7. Teachers already working at steps 1, 2, and 3 would also receive
salary increases, if they held a clear renewable certificate. In the proposal, about
2,862 teachers would be affected the first year, with an average salary increase of
$3,350 per teacher. The beginning pay for new math and science teacher hires
would rise to more than $40,000 for the overwhelming majority of school systems.
The only cost to local systems associated with elevated salaries would be an
increase in certain benefits: social security (if a system paid it), teacher
retirement, and Medicare (Georgia Alliance of Education Agency Heads
Math/Science Task Force, 2008). For fiscal year 2013, the governor proposed
funding the program at $3 million.
Amount of incentives for STEM Teachers. Estimated range from $3,350 to
$6,577 and subject to general assembly appropriations (Georgia Alliance of
Education Agency Heads, Math/Science Task Force, 2008)
Type of incentive. Salary schedule modification
Evaluation of outcomes. ARCC was unable to find any information on an evaluation.

300 Summers St., Ste. 1240 • Charleston, WV 25301 • 1-855-355-ARCC (2722) • www.arccta.org
70
Ohio STEM Teacher-Signing Bonuses
Adopted on June 27, 2007 by a near-unanimous vote of the Ohio General Assembly and
signed into law on June 30, 2007 by the governor, Ohio’s biennial budget (Am. Sub. H.B.
119), promoted a variety of statewide STEM initiatives. The biennial budget contained
$26,900,000 to support programs that work to increase the supply of STEM and foreign
language secondary teachers—areas in which the state currently suffers a severe
shortage (Ohio Business Alliance Higher Education and the Economy, 2007).
In 2009, Ohio created the STEM Teacher-Signing Bonus Program which provided signing
bonuses of up to $20,000 to STEM or foreign language teachers who teach in a public
school district or a school district building designated as a hard-to-staff school by the
Ohio Department of Education. Qualifying candidates must be licensed to teach, teach
STEM or foreign language, and teach in a hard-to-staff school for five years. The program
was designed to attract and retain highly qualified STEM and foreign language teachers
into public schools.
To attract and retain high-quality teacher candidates to high-need areas, the plan
provided the choice of a $4,000 signing bonus or loan forgiveness per year for each year a
new STEM or foreign language teacher (or a retrained mid-career professional/teacher)
teaches in a public school district. The signing bonus or loan repayment program can be
up to $20,000 per qualifying teacher.
Funding. In 2009, Ohio budgeted $4 million for the STEM Teacher-Signing Bonus
program.
Amount of incentives for STEM teachers. $4,000 signing bonus or loan
forgiveness each year
Type of incentive. Limited duration incentive
Evaluation of outcomes. ARCC was unable to find any information on an
evaluation.

300 Summers St., Ste. 1240 • Charleston, WV 25301 • 1-855-355-ARCC (2722) • www.arccta.org
71
Ohio STEM Teacher Loan-Forgiveness Program
Also funded at $2.5 million, the STEM Teacher Loan-Forgiveness program was designed to
attract licensed teachers into STEM and foreign language secondary classrooms. The
program functions like the STEM Teacher-Signing Bonus program, but enables qualified
candidates to receive college loan forgiveness rather than a cash signing bonus.
Amount of incentives for STEM teachers. $4,000 loan forgiveness each year for
up to $20,000
Type of incentive. Limited duration incentive
Evaluation of outcomes. ARCC was not able to find any information on an evaluation.
Virginia STEM Teacher Recruitment and Retention Pilot Incentive
In 2012, the Virginia governor proposed a new program to attract and retain STEM
teachers as part of his “Opportunity to Learn” education agenda. The program would be a
pilot to attract, recruit, and retain new teachers of mathematics, physics, and technology
education. The STEM teachers had to have a satisfactory performance evaluation after the
first year of teaching to earn a $5,000 award and could receive an additional $1,000
award for each of the following three years (Virginia Department of Education, 2012).
In 2013, STEM teachers had to apply to the Virginia Department of Education for
consideration. Funding was to be awarded on a first-come, first-served basis with
preference to teachers assigned to teach in hard-to-staff schools or low-performing
schools not fully accredited (Virginia Department of Education, 2013).
The governor’s executive amendment for fiscal year 2014 expanded the pool of teachers
eligible to receive incentives under the STEM Teacher Recruitment and Retention Pilot
Initiative. The expansion included teachers with up to three years of experience in grade-
and subject-specific STEM education. Specifically, this included teachers with an
endorsement in Middle Education 6-8: Mathematics; Mathematics: Algebra I;
Mathematics; Middle Education 6-8: Science; Biology; Chemistry; Earth and Space
Science; Physics; or Technology Education. The amendment also included qualified
teachers in these endorsement areas assigned to a teaching position in a corresponding
STEM subject area, regardless of teaching experience, who were reassigned from a fully

300 Summers St., Ste. 1240 • Charleston, WV 25301 • 1-855-355-ARCC (2722) • www.arccta.org
72
accredited school in a school division to a hard-to-staff school or a school that is not fully
accredited (Virginia Department of Education, 2013).
Funding. In 2013 the Virginia General Assembly passed an amended budget for
2012-2014, known as Chapter 806, which included funding for the STEM teacher
bonus pilot program. The state budgeted $500,000 to give $5,000 incentive
awards to new teachers with licensing in secondary mathematics and science
subjects who sign agreements to teach STEM subjects. For fiscal year 2014, the
governor’s amended budget provided $708,000 for the Math and Science Teacher
Recruitment and Retention Pilot Initiative. This increase was supported by the
transfer of state funding from the existing Virginia Teaching Scholarship Loan
Program and eliminating that program effective with fiscal year 2014.
Amount of incentives for STEM teachers. $5,000 for first year, and $1,000 per
year up to three additional years
Type of incentive. Limited duration incentive
Evaluation of outcomes. In fiscal year 2013, 100 teachers in 50 school divisions
participated in anticipation of $5,000 for an initial incentive award after the completion
of the first year with a satisfactory performance evaluation and a contract for the
following year (Virginia Department of Education, 2013). No other outcome information
is yet available.
3. Have any pay reforms taken place within existing school budgets?
Increasing teacher pay to market levels without also increasing resources is not a simple
or straightforward endeavor. The Douglas County, TEP, and Opportunity Culture
initiatives have managed to significantly increase the salaries of some teachers within the
existing school budget by cutting other staffing costs in several different ways. Douglas
County funds hard-to-staff teacher pay with money that otherwise went to salaries for
easy-to-staff subject area and grade level teachers. The Equity Project charter school
relies on the teachers to assume many administrative functions, including discipline; does
not have small classes; and has fixed electives. Public Impact relies on creative staffing
solutions (multi-classroom leadership, teacher specialization, voluntary class size
increases, and time-technology swaps) to free up resources that cover higher pay for all
teachers or for excellent teachers.

300 Summers St., Ste. 1240 • Charleston, WV 25301 • 1-855-355-ARCC (2722) • www.arccta.org
73
Most other teacher salary initiatives have not been sustained within existing budgets;
many have been supported by multi-million dollar TIF grants, others by foundation or
state programs. (See Section VII for details on other state and district approaches to
funding teacher salary reform initiatives.)
4. Have business community members assisted in supporting teacher
pay that is closer to market-based?
In Austin, Texas, the Chamber of Commerce has supported comprehensive human
capital management reforms, including performance-based compensation in high-need
schools. The collaboration between the district, the teachers’ association, and the
Chamber began in 2006 when the district approached the Chamber to request increased
funding to improve teacher salaries, both across the board and as part of a performance-
based compensation program pilot in several high-need schools in the district. In
addition to supporting the district financially, the Chamber created a task force to engage
in monthly collaboration with the district and to bring other local public and private
sector organizations who had experimented with salary reform to share their successes
and challenges with the Austin Independent School District leadership team.
A more recent example is Jacksonville, Florida. In February 2014, several wealthy
business leaders pooled roughly $5 million each (for a total of $40 million) to provide
bonuses of $20,000 to teachers who were performing well in Jacksonville’s 36 most
troubled schools. One leader of the initiative, former Jacksonville Jaguars owner Wayne
Weaver, explained the purpose of investing in these “lifestyle-changing” financial
incentives: “We think that human capital is the best investment—having the best and
brightest teach and be principals in our lowest-performing schools” (Smith Amos, 2014).
5. What can be learned informally or anecdotally from market-based
teacher salary initiatives in other states and districts?
Springer, Rodriguez, and Swain (2014) note that teacher retention bonuses have ranged
from $250 to more than $20,000 per year, and our observation is that most teacher salary
initiatives to-date have provided incentives of up to several thousand dollars with
effective teachers actually receiving closer to $1,000-$2,000 bonuses per year. This
amount is far below the recommended levels. Douglas County, The Equity Project charter
school, and Public Impact’s Opportunity Culture model do augment salaries significantly

300 Summers St., Ste. 1240 • Charleston, WV 25301 • 1-855-355-ARCC (2722) • www.arccta.org
74
(at least for some teachers), within existing budgets. The Equity Project has even
documented a significant budget surplus. In informal discussions with leaders of each of
these three programs—Emily Hassel (Public Impact), Zeke Vanderhoek (TEP), and Brian
Cesare and Mary Chesla (Douglas County)—they suggested that emulating their approach
was absolutely achievable. Vanderhoek added the qualifier that the TEP model was
eminently feasible provided that per pupil funding was reasonable. Each of the three
models also strives to play a role in attracting a higher-caliber pool of talent to the
teaching profession. Although these approaches at present are small scale, advertising the
possibility of very attractive salaries to young people may go some way toward achieving
that shared goal.
Summary
Narrowly defined, school and districts in the United States have implemented very few
experiments with market-based teacher pay, and those that exist have not been studied.
However, a five-year study of one New York City initiative to pay salaries of $125,000 to
teachers will be published in autumn 2014. On the other hand, considering market-based
pay more broadly, numerous initiatives have provided bonuses, tuition reimbursement,
and other financial and non-financial incentives for STEM teachers. And, Public Impact
has developed promising approaches to extending the reach of effective shortage area
teachers and restructuring staffing to increase teacher pay within existing budgets. The
impact of these initiatives, however, is not yet known or is mixed. One lesson learned is
that most salary reforms have provided relatively small incentives to teachers, but the
reforms are more likely to have an impact if the size of the financial incentive is
significant, a goal which must be balanced by the resources available to support higher
pay. Some school districts have partnered with local business communities to support
their teacher recruitment, retention, and remuneration efforts.

300 Summers St., Ste. 1240 • Charleston, WV 25301 • 1-855-355-ARCC (2722) • www.arccta.org
75
Section VII: Practical Questions and Considerations
Introduction
This section addresses practical questions and considerations relating to funding for
teacher compensation reform and stakeholder communication and engagement. The first
section provides examples of how states and districts have financed market-based pay.
The second section provides lessons learned about and recommendations for effective
communication and stakeholder engagement in compensation reform. The third section
describes potential avenues for further teacher engagement, voice, and leadership in
teacher compensation reform.
Approaches for Financing Market-based Teacher Pay
Before introducing a new approach to teacher compensation, it is recommended that the
BEP Review Committee consider the full costs of any reforms. Doing so will help secure
buy-in that the reforms are in fact affordable and sustainable. Palumbo (2007) suggests
key questions to consider in forecasting these costs:
What are the new costs, or “cost areas,” that Tennessee districts or the state will
have to fund?
What cost areas will likely grow over time? Will any costs decline over time?
What is the projection for the number of employees who will be eligible for higher
pay? Will certain groups of employees see their pay decline?
What will be the maximum cost?
Which cost areas are only temporary?
What are the start-up costs associated with changing internal practices and
requirements?
What will be the sources of funds?
Are the funding sources adequate for the size and duration of costs?

300 Summers St., Ste. 1240 • Charleston, WV 25301 • 1-855-355-ARCC (2722) • www.arccta.org
76
Once cost-forecasting is completed, Palumbo (2007) recommends:
Develop short- and long-term financial planning based on the evaluation of both
general and unique needs and costs.
Consider the intensity of reforms, the level of participation, the initial start-up
costs, and the ongoing operational costs.
After identifying potential funding sources and strategies, and considering the short-,
medium-, and long-term, the BEP Review Committee or implementing districts could
align the funding sources according to the nature and duration of costs, consider the
possible limitations of each source of funding, and determine how each source can be
coordinated to provide adequate support through various stages of implementation
(Palumbo, 2007).
Guthrie and Prince (2008) and Palumbo (2007) note that other states and districts have
incorporated a variety of funding strategies for differentiated teacher compensation,
including:
redeploying current state, district, or school resources,
repackaging federal and state categorical aid programs,
redirecting future resources or expenditures,
seeking philanthropic grants or corporate support,
obtaining additional public funding (e.g., taxes) or additional state aid through
appropriations, and
applying for discretionary federal grants (e.g., TIF grants).
Each of these strategies will be briefly described. It is important to note that the
strategies below are not all supported by research; rather they are intended to
generate discussion and reflection about the appropriate course of action in
Tennessee.

300 Summers St., Ste. 1240 • Charleston, WV 25301 • 1-855-355-ARCC (2722) • www.arccta.org
77
Redeploying Current Resources
There are several options to consider when redeploying current resources. Five
strategies are provided for consideration. This section also describes how Douglas
County School District funded its market-based pay reform.
Consider Providing More Flexible Options for Teachers
Education Resource Strategies (ERS) (2010) suggests that districts consider providing
teachers with more flexible options throughout their careers. Flexible work options can
help attract higher quality candidates and candidates for hard-to-fill subjects and
positions, such as technology and engineering. These options may include part-time
assignments for those who desire a reduced load as well as opportunities—for those who
want to increase their compensation or develop new skills—to add responsibilities,
hours, or days beyond the standard full-time teaching position. But, if considering front-
loading teacher pay, it is important to note that new teachers may be interested in both
immediate and longer-term earnings potential.
Consider Having Teachers Reach the Top Salary Step Earlier in Their Careers
In the districts ERS studied, there were between 12 and 30 steps in the salary ladder.
According to ERS (2010), districts can free more dollars to invest in incremental
compensation for contribution and leadership when they allow the salary scale to top out
earlier in a teacher’s career.
Consider Changing Salary Increments for Additional Credits or Years
ERS (2010) suggests considering a reduction, phase-out, or complete removal of salary
increments for additional credits or degrees. This recommendation is based on the
demonstrated tenuous correlation between teaching effectiveness and educational
attainment beyond a bachelor’s degree.
Districts can also consider reallocating funds by not increasing salaries based upon
experience alone, by limiting or eliminating experience-based steps on the salary
schedule, or even freezing progress up the steps. For example, the Cincinnati Public
Schools system freezes increases between the 17-year step and the 21-year step. A
teacher remains at the 17-year step for five years, and then receives a larger salary
increase of $2,577.62 at the 22-year step to reach the $65,456.62 maximum salary level.

300 Summers St., Ste. 1240 • Charleston, WV 25301 • 1-855-355-ARCC (2722) • www.arccta.org
78
Hassel and Hassel (2009) provide further examples of redeploying existing resources to
fund teacher pay reforms, including:
Small changes. If a system wanted to pay the top 50 percent of teachers an
average of $3,000 more, with the very top teachers earning $6,000 more, then a
system could fund this initiative by reducing the post-five-year experience
premiums by 10 percent and the advanced degree premiums by 20 percent.
Larger changes. If a system wanted to pay the top 50 percent of teachers an
average of $13,000 more, with the very top teachers earning $20,000 more, then a
system could reduce the post-five-year experience premiums by 50 percent and
the advanced degree premiums by 80 percent.
According to DeGrow (2013) and the Douglas County Public Schools website, the Douglas
County School District was able to fund its market-based pay plan by taking money from
easy-to-staff areas and giving it to hard-to-staff areas to provide pay supplements. Prior
reforms in the district were supported by such efforts as:
reducing administrative costs by $12 million from 2009 to 2013;
ending the traditional salary schedule in 2012-2013;
reducing the costs associated with the collective bargaining agreement (which
ended in June 2012), totaling $1.3 million over a five-year period;
phasing out the extended service severance benefits for departing teachers with
15+ years of service, which resulted in savings of an estimated $2 million; and
phasing out automatic longevity pay.
According to DeGrow (2013), the Douglas County Board of Education takes a fiscally
conservative approach by saving an additional four percent of annual general fund
spending beyond the constitutional requirement. This four percent reserve translated
into $17million in FY 2012. This policy has earned the district an AA+ bond rating, which
has yielded considerable savings through lower debt financing. In the 2011-2012 school
year, the district collected $8,582 in tax revenue for each full-time student, with about
$6,215 of that coming in as per pupil revenue through the state’s School Finance Act. In
2012-2013, per pupil spending was $6,218. Two years later (2013-2014), the district’s
per pupil revenue was $6,386 (DeGrow, 2013).

300 Summers St., Ste. 1240 • Charleston, WV 25301 • 1-855-355-ARCC (2722) • www.arccta.org
79
Consider Incremental Increases in Class Sizes
A fourth strategy for redeploying resources that some policy organizations have
recommended involves incremental increases in class sizes or targeting smaller class
sizes to the grades where class sizes seem to matter most (K-3) or to at-risk students.
Limiting staffing levels enables a school district to reallocate resources to staff salaries;
however, this should be done with consideration of how important class size is to teacher
retention and teacher effectiveness in the district. As one example, the Guilford County,
North Carolina district generated $2 million for its performance pay plan by increasing
class sizes by one student in certain mathematics classes (Schuermann, Archibald,
Kluender, & Ptak, 2011). The Equity Project charter school in New York City manages to
pay teacher salaries of $125,000-$140,000, plus bonuses, and achieve budget surpluses of
$700,000-$1,000,000 per year.
Consider Suggestions from Public Impact’s Opportunity Culture
The fifth resource redeployment strategy emerges from Public Impact’s Opportunity
Culture. In an Opportunity Culture, schools redesign traditional classrooms and teaching
roles to extend the reach of excellent teachers, directly and through their leadership of
teaching teams, for more pay, within budget. The career opportunities of teachers depend
upon their excellence, leadership, and student impact. Advancement allows more pay and
greater reach, which can help attract and retain excellent teachers over time. Public
Impact (2013) suggests that there are six ways to increase teacher pay using an
Opportunity Culture strategy. These include:
Replace a team-teaching position with a paraprofessional. The replacement
saves teachers time and enables them to collaborate during school hours.
Paraprofessionals can do the team’s administrative paperwork and routine
instructional tasks, such as grading. They can supervise digital learning and off-
line practice of skills by students. This reduces the numbers of needed teachers
without decreasing the instructional time students have with teachers. The
difference between paraprofessional and teacher pay allows teachers to extend
their reach to more students for more pay.
Offer some team-teaching roles with shorter work hours and proportionally
lower pay. Opportunity Culture suggests constructing teams with roles that allow
part-time or limited hours. For example, multi-classroom leadership allows some

300 Summers St., Ste. 1240 • Charleston, WV 25301 • 1-855-355-ARCC (2722) • www.arccta.org
80
team teachers to focus on work, such as teaching small groups of students,
grading, etc., that can be done in a shorter work week.
Increase class sizes slightly (within limits) but maintain instructional group
sizes smaller or on par. When some or all of a school’s teachers teach even
slightly larger classes, it requires fewer teachers overall and frees up funds.
Shift non-classroom instructional specialists back into classes in higher-paid
“reach” roles. When excellent teachers and their teams reach more students
successfully, fewer students may need specialists to supplement in-class
differentiation. Public Impact suggests that shifting specialists to formal team
leadership roles enhances their authority, accountability for student outcomes,
pay, and impact on their teaching teammates’ work.
Reallocate other spending better used to raise teacher pay. For example,
many districts spend large sums on professional development that could be used
to enhance the pay of teachers who take full responsibility for the student
outcomes and development of whole teams of teachers (i.e., multi-classroom
leaders).
Reduce new facilities costs by constructing fewer walls for fewer, larger
rooms. For example, digital labs and combined digital/face-to-face classrooms can
be larger.
Repackaging Federal and State Categorical Aid Programs
Many TIF grantees accessed federal programs to fund portions of their teacher
compensation reforms (Schuermann et al., 2011). For example, under the No Child Left
Behind Act (the reauthorization of the Elementary and Secondary Education Act), there
are several possibilities for using federal funding programs to address teacher
compensation, particularly under Title II.

300 Summers St., Ste. 1240 • Charleston, WV 25301 • 1-855-355-ARCC (2722) • www.arccta.org
81
Title II. Preparing, Training, and Recruiting High Quality Teachers and Principals
Parts A and B of Title II identify authorized uses of federal funds for the compensation of teachers and principals.
Part A. Teacher and Principal Training and Recruitment Fund
According to the U.S. Department of Education’s (2006) non-regulatory guidance, two of
the 18 ways in which states may use their state-level activity funds from Part A
specifically mention the development of new forms of teacher compensation (Guthrie &
Prince, 2008). The non-regulatory guidance identifies the following:
“Developing, or assisting LEAs in developing merit-based performance systems
and strategies that provide differential and bonus pay for teachers in high-need
academic subjects and for teachers in high-poverty areas” (p. 12).
“Developing, or assisting LEAs in developing, teacher advancement initiatives that
promote professional growth and that emphasize multiple career paths and pay
differentiation” (p. 12).
However, it should be noted that these funds total less than 2.5 percent of the state’s total
allocation under Title II, Part A. The vast majority of Title II-A funds goes to LEAs, rather
than states, and four of the nine ways in which LEAs may use these funds specifically
mention educator compensation reforms (Guthrie & Prince, 2008). The non-regulatory
guidance identifies the following:
1. “Developing and implementing strategies and activities to recruit, hire, and retain
highly qualified teachers and principals. These strategies may include (a)
providing monetary incentives such as scholarships, signing bonuses, or
differential pay for teachers in academic subjects or schools in which the LEA has
shortages; (b) reducing class size; (c) recruiting teachers to teach special needs
children, including students with disabilities; and (d) recruiting qualified
paraprofessionals and teachers from populations underrepresented in the
teaching profession, and providing those paraprofessionals with alternate routes
to obtaining teacher certification.” (pp. 27-28)
2. “Developing and implementing initiatives to promote retention of highly qualified
teachers and principals, particularly in schools with a high percentage of low-
300 Summers St., Ste. 1240 • Charleston, WV 25301 • 1-855-355-ARCC (2722) • www.arccta.org
82
achieving students, including…financial incentives to retain teachers and
principals with a record of helping students to achieve academic success.” (p. 29)
3. “Carrying out programs and activities that are designed to improve the quality of
the teaching force, such as…merit pay programs.” (pp. 29-30)
4. “Carrying out teacher advancement initiatives that promote professional growth
and emphasize multiple career paths (such as paths to becoming a mentor
teacher, career teacher, or exemplary teacher) and pay differentiation.” (p. 30)
Part B: Mathematics and Science Partnerships
Title II Part B funds may be used for the following authorized activities to recruit STEM
teachers: Section 2202 (c) (4)—Recruiting mathematics, engineering, and science majors
to teaching through the use of:
(A) signing and performance incentives that are linked to activities proven
effective in retaining teachers, for individuals with demonstrated professional
experience in mathematics, engineering, or science;
(B) stipends provided to mathematics and science teachers for certification
through alternative routes;
(C) scholarships for teachers to pursue advanced course work in mathematics,
engineering, or science; and
(D) other programs that the state educational agency determines to be effective in
recruiting and retaining individuals with strong mathematics, engineering, or
science backgrounds.
Title VI. Part B Rural Education Initiative
Program funds may be used for many of same purposes as Title I-A and Title II-A.

300 Summers St., Ste. 1240 • Charleston, WV 25301 • 1-855-355-ARCC (2722) • www.arccta.org
83
Redirecting Future Resources or Expenditures
The TDOE’s Differentiated Pay Resource Guide (2013) suggests that districts may want to
determine how to allocate any future state or local increase. The options include:
Apply 100 percent of future increases to fund the district’s salary schedule.
Apply a particular percentage of future increases to the salary schedule and
reinvest the remaining percentage in other investments.
Apply 100 percent of future increase to other compensation investments.
Fermanich (2013) recommends that districts target an increasing proportion of new
revenues toward performance-based compensation rather than toward increasing
educator salary and benefits on the single salary schedule. He suggests that this could be
accomplished by targeting an amount to be redirected and adjusting the percentage
increases for additional experience steps or educational attainment lanes until the
savings target is reached. Another possibility is that districts set a goal of reducing
teacher turnover rates by half, which could produce annual savings.
Seeking Philanthropic and/or Corporate Support
Across the country, districts have sought and obtained philanthropic and corporate
support for teacher compensation reform. There are a number of national foundations
that have declared teacher compensation reform as a funding priority. Among these are:
the Bill & Melinda Gates Foundation,
the Broad Foundation,
the Joyce Foundation,
the Milken Family Foundation, and
the Walton Family Foundation.
The grants may be targeted to certain geographic areas, states, and/or districts (Guthrie
& Prince, 2008).
Tennessee Examples
For example, in Tennessee, Memphis School District received a $20 million grant from the
Bill & Melinda Gates Foundation in 2009 (Wesson, 2013). In addition, Memphis received

300 Summers St., Ste. 1240 • Charleston, WV 25301 • 1-855-355-ARCC (2722) • www.arccta.org
84
a supplemental grant of $20 million from local businesses and foundations to fund its
multi-year Teacher Effectiveness Initiative (Wesson, 2013). The Milken Family
Foundation is supporting the implementation of the Teacher Advancement Program in
Knox County. In 2002, the mayor of Chattanooga developed the support of local
businesses by engaging 13 business leaders on a committee that designed pay incentives
for selected high-need schools (City of Chattanooga, 2002).
Other Examples of Corporate Support for Teacher Compensation Reform
Guilford County in North Carolina formed a business-education partnership with the
University of North Carolina at Greensboro and Action Greensboro, a coalition of local
foundations and businesses, to pay for its bonus compensation program (Guthrie &
Prince, 2008). The partners provided a $2 million grant to the district (Guthrie & Prince,
2008).
The New York City Board of Education, the New York Partnership, and the Chamber of
Commerce organized to create a performance-based bonus compensation program,
Breakthrough for Learning, in the late 1990s (Guthrie & Prince, 2008).
Examples of business support for higher teacher compensation in Jacksonville, Florida,
are noted above in Section VI.
Obtaining Additional Public Funding
A number of states and districts have sought to fund teacher compensation reform by
increasing general fund revenues through increases in taxes or a locally generated
categorical aid revenue increase. For example, Arizona approved a half penny sales
increase, mandating that a major portion could only be used if local districts designed
new performance pay structures (Odden & Wallace, 2007).
The best example of the use of a tax levy to support a compensation system comes from
Denver Public Schools (Schuermann et al., 2011). This was the result of a multi-year
intense public relations and media campaign to persuade taxpayers (Guthrie & Prince,
2008). In November 2005, Denver voters approved an increase in the annual mill levy,
which raises an estimated $25 million, adjusted for inflation, to fund its compensation
system, ProComp. The money raised is placed in a trust fund to pay ProComp incentives
and related expenses. The system’s oversight committee, the teachers union, and
community representatives are charged with ensuring its long-term financial viability

300 Summers St., Ste. 1240 • Charleston, WV 25301 • 1-855-355-ARCC (2722) • www.arccta.org
85
(Denver Public Schools, 2013). Guthrie and Prince (2008) suggest that states and districts
plan early if they pursue this strategy, because it may require multiple attempts.
The example of collaboration between the district and local Chamber of Commerce in
Austin, Texas, noted in Section VI, also was generated by the district’s request for a tax
levy to support more competitive teacher compensation.
Applying for Discretionary Federal Grants
Two major discretionary federal grants that have provided funds for teacher
compensation reform are Race to The Top and TIF grants. Tennessee is currently a
recipient of both grants.
Tennessee was one of the first states to receive the Race to the Top grant in 2010.
Through the grant, Tennessee created (1) the Competitive Supplemental Fund, to support
the planning of compensation models by districts receiving small First to the Top local
funding awards, and (2) the Innovation Acceleration Fund, to support the adoption and
implementation of alternative compensation structures by districts. (See Section III for
more details.)
TDOE received a five-year TIF grant in 2010 to support performance-based
compensation systems for teachers and principals in high-needs schools in fourteen
districts. In 2012, TDOE received another TIF grant to support a performance educator
evaluation system in three rural districts. In addition, the National Institute for Excellence
in Teaching (NIET) received a 2012 TIF grant which is currently funding the
implementation of the Teacher Advancement Program in Athens City and Morgan City.
Example of Coordination of Funding Sources
The Denver Public Schools Professional Compensation System included the following
funding sources for different stages of development and implementation:

300 Summers St., Ste. 1240 • Charleston, WV 25301 • 1-855-355-ARCC (2722) • www.arccta.org
86
Table 9.
Funding Sources for Different Stages of Development and Implementation
Stage Funding Source Amount of Funds
Research & Development
Rose Community Foundation $2.5 million
Broad Foundation $1.2 million
Daniels Fund $500,000
Transition & Implementation
Rose Community Foundation $1 million
Broad Foundation $620,000
Daniels Fund $500,000
Long-term Sustainability
Denver Mill Tax Levy $25 million annually
Source: Palumbo (2007). Note: Denver Public Schools also received funding from the Denver
Foundation, the Donnell-Kay Foundation, the Strum Family Foundation, the Phillips Family
Foundation, and the Piton Foundation (Palumbo, 2007).
In addition, Denver Public Schools received two federally funded TIF grants, the first in
2006 for $22.6 million for five years, and the second in 2012 for $28.5 million.
Planning for Financially Sustainable Teacher Compensation Reforms
As noted above in Section VI, many teacher compensation reform programs have not lasted,
in part due to their high costs. It is therefore critically important to think through the
immediate and long-term financial implications, and how they will be addressed, at the start
of a compensation reform initiative. One example of a state’s approach to creating a
financially sustainable teacher compensation reform is Ohio’s TIF grant (Ohio Department of
Education, 2010).
The U.S. Department of Education awarded Ohio Department of Education and its partner,
Battelle for Kids, a second TIF grant in 2010. The grant required districts to meet matching
funds goals starting in Year 3 of the grant, meaning that the district must cover an increasing

300 Summers St., Ste. 1240 • Charleston, WV 25301 • 1-855-355-ARCC (2722) • www.arccta.org
87
share of the award program, either with local funds, other non-TIF funding sources, or in-
kind matches. The tenets of Ohio’s TIF sustainability plan include:
Compile financial information on funds available to LEAs through current state
and federal programs and then consider creative and optional ways to re-allocate
resources.
Create a group of knowledgeable and interested business executives who will
provide counsel on entrepreneurial approaches to LEA operations.
Seek foundation and corporate support for the LEAs.
Expand the capacities of the regional Educational Service Centers to help embed
knowledge and skills related to performance-based compensation systems into
the ongoing LEA operating procedures.
Each participating Ohio district formed a local sustainability workgroup and developed a
sustainability plan as well (refer to Ohio TIF grant website
http://portal.battelleforkids.org/OAC/tif/ohio-tif-home ).
Other TIF grantees also have developed sustainability plans that could be used as models.
Summary
This section first identified key questions to consider when forecasting costs and financial
planning for differentiated compensation. Then it briefly described six strategies used in
Tennessee and other states and districts to fund differentiated teacher compensation
reform. Finally, it summarized one state’s plans for financially sustaining teacher
compensation reform.
Again, these approaches are not supported by research at present. It may be too early to
see which plans are sustainable and effective in achieving teacher supply and demand
goals. But it is important to reflect on historical efforts and present-day innovators, their
advantages and disadvantages, and to consider sustainability, unintended consequences,
and ways to ensure success before launching a new compensation initiative. Stakeholder
engagement can be useful in doing so.

300 Summers St., Ste. 1240 • Charleston, WV 25301 • 1-855-355-ARCC (2722) • www.arccta.org
88
Effective Communication and Stakeholder Engagement in
Compensation Reform
Engaging stakeholders serves two purposes. First, the successful implementation of any
changes in teacher compensation requires that stakeholders have an accurate
understanding of how the changes work (Max & Koppich, 2007). Stakeholders are more
likely to support changes that are transparent and understandable, particularly to
teachers (Max & Koppich, 2007). Second, stakeholder engagement can uncover potential
unintended consequences and implementation challenges before they become serious
and can provide insights about how to strengthen the new initiative (Behrstock-Sherratt,
Rizzolo, Laine, & Friedman, 2013).
Strategies for Effective Stakeholder Communication and Engagement
One of the key challenges faced by the TIF grantees is securing and maintaining public
and educator engagement and support in reforming teacher compensation. Several
studies/reports by TIF grantees have identified key strategies and/or lessons learned in
addressing challenges (e.g., Koppich, 2010; Raue, MacAullum, & Ristow, 2008). Some of
the lessons learned follow.
Develop a comprehensive communication plan.
Any educator effectiveness reform should be accompanied by a comprehensive
communication plan. The communication plan includes purposes, timelines, targeted,
multiple strategies for stakeholder engagement and understanding, detailing the content,
methods, responsibilities, and feedback mechanisms for the compensation program
(Milanowski, Heneman, & Graham, 2012). The plan should include communication about:
the reasons for changes in teacher compensation;
the rationale for major new features;
the mechanics of how the changes will determine pay increases;
how current educators will transition to the changes; and
what will happen to each individual teacher’s pay, and how can each individual
progress under the changes.

300 Summers St., Ste. 1240 • Charleston, WV 25301 • 1-855-355-ARCC (2722) • www.arccta.org
89
Communication plans should include different forms of communication with different
levels of detail required for buy-in and support from multiple audiences (Koppich, 2010).
These may include:
monthly newsletters;
standing agenda items for program updates at relevant meetings;
a dedicated website to provide consistent, ongoing compensation information; and
establishing good working relationships with local media to ensure that coverage
is accurate and appropriate.
Reforms at the state level (Raue et al., 2008) should also require participating LEAs to
develop and implement communication plans that:
inform and engage classroom teachers with program features and opportunities to
be involved in and benefit from the compensation program, and
inform the public of the compensation program’s highlights and successes.
Austin (Texas), South Carolina, and other TIF grantees have created comprehensive
communication plans.
Other communication strategies may include employing a communications consultant
and establishing school-level steering committees that develop communication plans
with specific activities and timelines (Witham, McKithen, & Scott, 2012).
Identify internal and external stakeholders for communication and engagement
efforts.
Communication efforts should be two-way; in other words, they should involve authentic
engagement of key stakeholder groups. This may include:
engaging internal stakeholders from Day 1 for feedback on the design of teacher
compensation changes (Max & Koppich, 2007);
using broad-based steering committees and advisory boards with task forces that
meaningfully involve key stakeholders; and
conducting surveys of educators to ascertain their views of the compensation
program, especially what they understand about it, where they lack sufficient
understanding, and how to enhance buy-in as well as inform program decisions
(Witham et al., 2012).

300 Summers St., Ste. 1240 • Charleston, WV 25301 • 1-855-355-ARCC (2722) • www.arccta.org
90
To provide a snapshot of state-level efforts to reach out and communicate with
stakeholders, the National Comprehensive Center for Teacher Quality (the predecessor of
the Center on Great Teachers and Leaders) reviewed the communication and engagement
efforts by 24 states concerning educator evaluation, and found the following strategies in
place:
Websites. All the states reviewed maintain a website related to the evaluation
reforms.
Advisory committees. Most states (92 percent) have a state-level advisory
committee that includes stakeholders as members.
News or social media. Only a handful of states have focused on news media
(press conferences and news articles) or social media (13 percent); however,
slightly fewer than half (42 percent) produce press releases highlighting their
reforms.
Surveys. Fewer than half of the states reviewed (42 percent) used surveys
(usually online) to collect stakeholder views.
Guidance and training material. Less than half of the states reviewed (42
percent) provided guidance, training materials, and FAQ documents online.
Forums. Less than half (42 percent) hosted a series of regional forums to
introduce reforms and/or hear stakeholders’ perspectives.
Presentations. SEAs and state-level committees used webinars or in-person
presentations to LEAs, professional associations, teachers unions, or other
stakeholder groups slightly less frequently (38 percent).
Online video or communication. One third of states used additional online
communication methods such as video or periodic e-newsletters to communicate
information to stakeholders.
Focus groups. Focus groups are the least utilized in-person form of engagement,
with 33 percent of states selecting this option as one means of gathering
stakeholder views (Behrstock-Sherratt, Biggers, & Fetters, 2012).
Consideration of these types of communication and engagement strategies are a useful
starting point for teacher compensation reform as well. Additional strategies are
provided for states and districts in the Reform Support Network resource entitled
Engaging Educators: A Reform Support Network Guide:
http://www2.ed.gov/about/inits/ed/implementation-support-unit/tech-
assist/engaging-educators.pdf

300 Summers St., Ste. 1240 • Charleston, WV 25301 • 1-855-355-ARCC (2722) • www.arccta.org
91
Summary
This section outlined elements of stakeholder communication and engagement that states
and districts have learned are important in implementing new teacher compensation
policies. It also outlined some common state communication and engagement approaches
to teacher evaluation reform, which may be extended in the development and
implementation of teacher compensation reform. However, no communication or
engagement strategy will fully succeed if a policy is not thoughtfully designed. The
following section outlines an approach to engaging teachers more widely across
Tennessee or across specific districts to think through a meaningful and effective design
for market-based teacher pay that will be supported by (most) teachers, will address
teacher shortage problems without creating unintended new problems, and will be
financially sustainable for the long-term.

300 Summers St., Ste. 1240 • Charleston, WV 25301 • 1-855-355-ARCC (2722) • www.arccta.org
92
What role might teacher voice groups play in reforming teacher
compensation in Tennessee?
Over the past several years, current and former teachers in collaboration with nonprofit
leaders have established “teacher voice groups,” nonprofit organizations devoted to
helping teachers inform public policy. Among these groups are: Hope Street Group,
America Achieves, Teach Plus, the National Network of State Teachers of the Year, and
VIVA Teachers, all of which have members in Tennessee. These teacher voice groups have
been helpful to states and districts in gathering feedback about the design and
implementation of teacher evaluations (Reform Support Network, n.d.). They also have
sought to elevate teaching to a more dynamic, influential profession by creating an
authentic voice for teachers as leaders of new education policies, thereby aiming to
improve teacher recruitment, retention, and morale.
The Center on American Progress has profiled these teacher voice organizations:
Table 10.
Characteristics of Teacher Voice Organizations
Teacher Voice Organization
Members and Location Unique Approach
Teach Plus 12,000+ in Boston, Chicago, Indianapolis, Los Angeles, Memphis, and Washington, D.C.
(Note: Teach Plus began in Memphis)
Focuses on second stage (years 3–10) teachers who want to continue classroom teaching while also expanding their impact as leaders in their schools and in national, state, and district policy
VIVA Teachers (Voices, Ideas, Vision, Action)
3,500 in Arizona, Colorado, Florida, Iowa, Illinois, Massachusetts, North Carolina, New Jersey, New York, Tennessee, and Texas
Online organization that uses technology as an organizing tool for teachers to participate in a virtual “Ideas Exchange”

300 Summers St., Ste. 1240 • Charleston, WV 25301 • 1-855-355-ARCC (2722) • www.arccta.org
93
Teacher Voice Organization
Members and Location Unique Approach
Center for Teaching Quality
2,000 in Colorado, Florida, Illinois, Washington, Kentucky, and virtually
A virtual “Collaboratory” provides space for conversation between educators and non-educators
National Network of State Teachers of the Year
700+ in every state Provides a hub for State Teachers of the Year to remain involved in policy after their year of recognition
Source: Pennington (2013)
America Achieves is a newer teacher voice group with a presence in Tennessee. America
Achieves helps communities and states leverage policy, practice, and leadership to build
high-quality educational systems and prepare each young person for success in careers,
college, and citizenship. They convene parents, state education leaders, and teacher
fellows. Their teacher fellows engage in various skills and leadership development
trainings to enable them to effectively partake in and lead policy design and
implementation.
The longest-standing “teacher voice” group, the teachers’ unions, of course are key
stakeholders for engagement in new policy. The Tennessee Education Agency (TEA)
recently created a bill that reinstates a minimum salary schedule based on experience
and advanced degrees (HB1381/SB1856) that passed in both the Tennessee Senate and
House with unanimous votes (http://www.teateachers.org/about-tea).
To promote participation of teachers in reform efforts, the Reform Support Network
(n.d.) recommends that SEAs, LEAs, and unions identify a cadre of teachers who want to
be more involved in the development and implementation of new systems. Listening to
teachers when it comes to teacher policy has received growing support, including from
Kentucky’s Commissioner of Education (Holliday, 2014). One model for broad
engagement of these teacher voice groups is Everyone at the Table, which offers an
approach for facilitating ongoing productive and solutions-oriented dialogue among
larger groups of teachers’ complex and challenging policy topics, such as teacher
compensation.

300 Summers St., Ste. 1240 • Charleston, WV 25301 • 1-855-355-ARCC (2722) • www.arccta.org
94
Specifically, the Everyone at the Table model relies on dialogues, led by trained teacher
leader moderators, using an approach called choicework. Choicework presents key
tradeoffs inherent in policy options—typically depicted in three or four practical realistic
scenarios that are discussed in a focus group style context. Considering these choices
moves the conversation away from magic bullet or “either/or” thinking and toward
creative solutions and compromises while helping all participants understand each
other’s underlying values and rationales.
If skillfully moderated, this model can engender productive, solutions-oriented dialogue
that engages teachers even in controversial policy, to lead to stronger policy design,
implementation, and sustainability that is worth the extra time and effort required
(Behrstock-Sherratt et al., 2013). For more details, see www.EveryoneAtTheTable.org.
Summary
There are several active teacher groups in Tennessee with a specific interest in engaging
in policy dialogue, policy design, and policy implementation, which have a track record of
developing thoughtful approaches to challenging problems. Partnering with one, several,
or all of these organizations may hold potential for identifying viable, sustainable teacher
compensation policies. This section provided a brief summary of teacher voice
organizations in the state and introduced a model for effective teacher engagement in
policy.

300 Summers St., Ste. 1240 • Charleston, WV 25301 • 1-855-355-ARCC (2722) • www.arccta.org
95
References
Appalachia Regional Comprehensive Center (ARCC). (2013). 2013-2014 ARCC Tennessee
annual work plan. Charleston, WV: Author.
Auguste, B., Kihn, P., & Miller, M. (2010). Closing the talent gap: Attracting and retaining
top-third graduates to careers in teaching. An internal market research-based
perspective. Washington, DC: McKinsey & Company. Retrieved from
http://mckinseyonsociety.com/closing-the-talent-gap/
Behrstock, E. (2009). Teacher shortage in England and Illinois: A comparative history.
Unpublished dissertation. Oxford University.
Behrstock-Sherratt, E., Biggers, K., & Fetters, J. (2012). Lessons learned on communication
and engagement for educator evaluation: Colorado case study. Washington, DC:
National Comprehensive Center for Teacher Quality. Retrieved from
http://files.eric.ed.gov/fulltext/ED543667.pdf
Behrstock-Sherratt, E., Rizzolo, A., Laine, S., & Friedman, W. (2013). Everyone at the table:
Engaging teachers in evaluation reform. San Francisco: Jossey-Bass.
Borman, G., & Dowling, M. (2008). Teacher attrition and retention: A meta-analytic and
narrative review of the research. Review of Educational Research, 78(3), 367-409.
Boser, U., & Straus, C. (2014). Mid- and late-career teachers struggle with paltry incomes.
Washington, DC: Center on American Progress. Retrieved from:
http://cdn.americanprogress.org/wp-content/uploads/2014/07/teachersalaries-
brief.pdf
Brown, M. (2012). Email of TEA analyses of salary schedules conducted January, 2012.
Cited in Wesson (2013).
Bruce, D., Fox, W., Douglas, B., Reynolds, M., & Yang, Z. (2009, December). Supply and
demand for teachers in Tennessee. A joint project of the University of Tennessee
Center for Business and Economic Research, the Tennessee Department of
Education, and the Tennessee Higher Education Commission. Knoxville, TN: The
University of Tennessee, Center for Business and Economic Research. Nashville,
TN: Tennessee Department of Education and Tennessee Higher Education
Commission. Retrieved from

300 Summers St., Ste. 1240 • Charleston, WV 25301 • 1-855-355-ARCC (2722) • www.arccta.org
96
http://thec.ppr.tn.gov/THECSIS/CBERTHECReports/PDFS/Teacher%20Supply-
Demand%2012-2009.pdf
Canon, K., Greenslate, C., Lewis, J., Merchant, K., & Springer, M. (2012). Evaluation of
Tennessee’s strategic compensation programs: Interim findings on development,
design, and implementation. Nashville, TN: Tennessee Consortium on Research
Evaluation, and Development, Peabody College, Vanderbilt University. Retrieved
from http://www.tnconsortium.org/projects-publications/compensation/
City of Chattanooga. (2002). Community Education Alliance proposal: Fact sheet.
Chattanooga, TN: Author.
Coggshall, J. G., Ott, A., Behrstock, E., & Lasagna, M. (2009). Retaining teacher talent: The
view from Generation Y. Naperville, IL: Learning Point Associates. New York, NY:
Public Agenda. Retrieved from
http://www.learningpt.org/expertise/educatorquality/genY/Gen%20Y%20repor
t.pdf
Cour, K. (2009a, March). Teacher compensation. Legislative Brief. Nashville, TN: Office of
Research and Education Accountability, Tennessee Comptroller of the Treasury.
Retrieved from
http://www.comptroller.tn.gov/OREA/PublicationDetails.aspx?ReportKey=0586f
501-2751-4a0b-9899-5e93a6494740
Cour, K. (2009b, March). Teacher compensation in Tennessee. Policy History. Nashville, TN:
Office of Research and Education Accountability, Tennessee Comptroller of the
Treasury. Retrieved from
http://www.comptroller.tn.gov/OREA/PublicationDetails.aspx?ReportKey=cc1de
9e4-c7af-46b5-a70d-0503ebe9e3a6
DeAngelis, K., Peddle, M., Trott, C., & Bergeron, L. (2002). Teacher supply in Illinois:
Evidence from the Illinois teacher study. Edwardsville, IL: Illinois Education
Research Council.
Dee, T., & Wyckoff, J. (2013). Incentives, selection, and teacher performance: Evidence from
IMPACT. National Bureau of Economic Research Working Paper No. 19529.
Cambridge, MA: National Bureau of Economic Research. Retrieved from
http://curry.virginia.edu/uploads/resourceLibrary/16_Dee-Impact.pdf

300 Summers St., Ste. 1240 • Charleston, WV 25301 • 1-855-355-ARCC (2722) • www.arccta.org
97
DeGrow, B. (2013, September). Douglas County: Building a better education model.
Denver, CO: Independence Institute. Retrieved from
http://education.i2i.org/2013/09/douglas-county-building-a-better-education-
model/
Denver Public Schools. (2013). ProComp handbook. Denver, CO: Author.
Dolton, P. J. (2006). Teacher supply. In E. Hanushek & F. Welch (Eds.), Handbook of the
economics of education–Volume 2 (pp. 1079-1161). London: Elsevier.
Douglas, E. (2012, January). Understanding educator compensation systems. Edweek
Blog. Retrieved from http://blogs.edweek.org/topschooljobs/k-
12_talent_manager/2012/01/understanding_educator_compensation.html
Education Resource Strategies (ERS). (2010, December). The teaching job: Restructuring
for effectiveness. Practical tools for district transformation. Section 5: Compensation
and career path. Watertown, MA: Author. Retrieved from
https://s3.amazonaws.com/ers-
cms/system/attachments/1750/original/Teaching_Guide_updated_5_6_13.pdf?13
67860338
Farkas, S., Johnson, J., Foleno, T. (2000). A sense of calling: Who teaches and why. New
York: Public Agenda.
Feng, L. (2009). Opportunity wages, classroom characteristics, and teacher mobility.
Southern Economic Journal, 75(4), 1165–1190.
Fermanich, M. (2013, May). The fiscal sustainability of strategic human capital
management systems. Presentation at the annual conference of the Association for
Education Finance and Policy, New Orleans, LA. Retrieved from
http://www.aefpweb.org/sites/default/files/webform/VARC%20SHCMS%20%2
0AEFP%20Paper%204%20Fermanich%20v1.pdf
Figlio, D. (2002). Can public schools buy better-qualified teachers? Industrial and Labor
Relations Review, 55(4), 686–697.
Furtwengler, C. B. (1987). Lessons from Tennessee’s career ladder program. Educational
Leadership, 44 (7), 66-69.

300 Summers St., Ste. 1240 • Charleston, WV 25301 • 1-855-355-ARCC (2722) • www.arccta.org
98
Georgia Alliance of Education Agency Heads, Math/Science Task Force. (2008). Proposal
for differentiated pay. Atlanta, GA: Author. Retrieved from
http://www.usg.edu/educational_access/documents/item2_pay.pdf
Georgia Department of Education. (2011). Guidance for O.C.G.A. §20-2-212.5.
Differentiated compensation for math and science teachers. In reference to the
adoption of House Bill 280 during the 2009 Session of the Georgia General Assembly.
Revision 3. Atlanta, GA: Author. Retrieved from
http://archives.gadoe.org/DMGetDocument.aspx/HB%20280%20Guidance%20R
EV%203%20FINAL%20060311.pdf?p=6CC6799F8C1371F614D7DC565EEE708D
B000AE4EBF6054449EE211280B25A507&Type=D
Georgia House Bill 280, O.C.G.A. §20-2-212.5 Quality Basic Education Act; mathematics or
science teachers; additional compensation. (2009).
Glazerman, S., Protik, A., Teh, B., Bruch, J., Max, J. (2013, November). Transfer incentives for
high-performing teachers: Final results from a multisite experiment (NCEE 2014-4003).
Washington, DC: National Center for Education Evaluation and Regional Assistance,
Institute of Education Sciences, U.S. Department of Education.
Goldhaber, D., DeArmond, M., Liu, A., & Player, D. (2007, March). Returns to skill and
teacher wage premiums: What can we learn by comparing the teacher and private
sector labor markets? Working Paper 8. Seattle, WA: Center on Reinventing Public
Education, University of Washington. Retrieved from
http://www.crpe.org/sites/default/files/wp_sfrp8_goldhaberetal_aug08_0.pdf
Guarino, C., Santibanez, L., & Daley, G. (2006). Teacher recruitment and retention: A
review of the recent empirical literature. Review of Educational Research, 76(2),
173-208.
Guthrie, J., & Prince, C. (2008). Paying for and sustaining a performance-based
compensation system. Center for Educator Compensation Reform. Washington, DC:
U.S. Department of Education, Office of Elementary and Secondary Education.
Retrieved from http://www.cecr.ed.gov/guides/payingFor.pdf
Hanushek, E. A., & Pace, R. R. (1995). Who chooses to teach (and why)? Economics of
Education Review, 14(2), 101-117.

300 Summers St., Ste. 1240 • Charleston, WV 25301 • 1-855-355-ARCC (2722) • www.arccta.org
99
Hanushek, E. A., Kain, J. F., & Rivkin, S. G. (2001). Why public schools lose teachers. (NBER
Working Paper 8599). Cambridge, MA: National Bureau of Economic Research.
Hanushek, E. A., & Rivkin, S. G. (2004). How to improve the supply of high quality teachers.
Brookings. Papers in Education Policy 2004. Washington, DC: Brookings
Institution Press.
Hassel, B., & Hassel, E. (2010, May). Re-slicing the teacher compensation pie: How to
permanently fund teacher contributions to student learning. Presentation at the
NGA Policy Academy, New Orleans, LA. Retrieved from
http://publicimpact.com/~publici1/publications/Public_ImpactRe-
SlicingtheTeacherCompensationPie.pdf
Haynes, M. (2014). On the path to equity: Improving the effectiveness of beginning teachers.
Washington, DC: Alliance for Excellent Education. America Achieves. Washington,
DC: Author. Retrieved from http://all4ed.org/reports-factsheets/path-to-equity/
Hedges, K., & Wettemann, M. (2012). Tennessee statewide supply and demand analysis for the
16 education cluster areas. Nashville, TN: Tennessee Department of Labor and
Workforce Development, Employment Security Division. Retrieved from
https://www.jobs4tn.gov/admin/gsipub/htmlarea/uploads/TN%20Supply%20and%20D
emand%20Analysis%20Nov%202012.pdf
Hirsch, E., & Emerick, S. (2007). Teacher working conditions are student learning conditions:
A report on the 2006 North Carolina Teacher Working Conditions Survey.
Hillsborough, NC: Center for Teaching Quality.
Holliday, T. (2014). Listen to what teachers can tell us about our schools. The Courier
Journal. May 6, 2014. Retrieved from: http://www.courier-
journal.com/story/opinion/contributors/2014/05/04/op-ed-listen-teachers-can-
tell-us-schools/8701761/
Houston Independent School District. (2012). Application for grants under the Teacher
Incentive Fund Program with a focus on STEM. CFDA #84.38B. PR/Award
#S374B12011. Houston, TX: Author. Retrieved from U.S. Department of Education
https://www2.ed.gov/programs/teacherincentive/apps2012stem/s374b120011.p
df
300 Summers St., Ste. 1240 • Charleston, WV 25301 • 1-855-355-ARCC (2722) • www.arccta.org
100
Imazeki, J. (2005). Teacher salaries and teacher attrition. Economics of Education Review,
24(4), 431-449.
Ingersoll, R. (2003). Is there really a teacher shortage? Seattle, WA: Center for the Study of
Teaching and Policy. Philadelphia, PA: Consortium for Policy Research in
Education. Retrieved from
https://depts.washington.edu/ctpmail/PDFs/Shortage-RI-09-2003.pdf
Ingersoll, R., & Smith, T. (2003). The wrong solution to the teacher shortage. Educational
Leadership, 60(8), 30-33. Retrieved from
http://www.gse.upenn.edu/pdf/rmi/EL_TheWrongSolution_to_theTeacherShorta
ge.pdf
Jacob, B. A., & Lefgren, L. (2004). The impact of teacher training on student achievement:
Quasi-experimental evidence from school reform efforts in Chicago. Journal of
Human Resources, 39, 50–79.
Keigher, A., & Cross, F. (2010). Teacher attrition and mobility: Results from the 2008-2009
Teacher Follow-up Survey. Washington, DC: National Center for Education
Statistics at the Institute for Education Sciences. Retrieved from
http://nces.ed.gov/pubsearch/pubsinfo.asp?pubid=2010353.
Kersaint, G., Lewis, J., Potter, R., & Meisels, G. (2007). Why teachers leave: Factors that
influence retention and resignation. Teaching and Teacher Education, 23, 775-794.
Kolbe, T. & Strunk, K. (2012). Economic incentives as a strategy for responding to teacher
staffing problems: A typology of policies and practices. Educational Administration
Quarterly, 48(5). Retrieved from http://www.uscrossier.org/ceg/wp-
content/uploads/2011/08/Kolbe_Strunk_Economic-Incentives_EAQ_2012.pdf
Koppich, J. (2010). Meeting the challenge of stakeholder engagement and communication:
Lessons from TIF grantees. Center for Educator Compensation Reform (CECR).
Washington, DC: U.S. Department of Education, Office of Elementary and
Secondary Education. Retrieved from
http://www.eric.ed.gov/PDFS/ED533049.pdf

300 Summers St., Ste. 1240 • Charleston, WV 25301 • 1-855-355-ARCC (2722) • www.arccta.org
101
Loeb, S., & Page, M. E. (2000). Examining the link between teacher wages and student
outcomes: The importance of alternative labor market opportunities and non-
pecuniary variation. Review of Economics and Statistics, 82, 393-408.
Manski, C. F. (1987). Academic ability, earnings, and the decision to become a teacher:
Evidence from the National Longitudinal Study of the High School Class of 1972.
Washington, DC: National Bureau of Economic Research.
Max, J., & Koppich, J. (2007, December). Engaging stakeholders in teacher pay reform.
Center for Educator Compensation Reform. Washington, DC: U.S. Department of
Education, Office of Elementary and Secondary Education. Retrieved from
http://cecr.ed.gov/guides/EmergingIssuesReport1.pdf
Milanowski, A. (2003). An exploration of the pay levels needed to attract students with
mathematics, science, and technology skills to a career in K–12 teaching.
Education Policy Analysis Archives, 11, 50-75. Retrieved from
http://epaa.asu.edu/ojs/article/view/278/404
Milanowski, A., Heneman, H., & Graham, M. (2012, March). Institutionalizing performance-
based compensation by revising the salary schedule: Introductory overview and
design principles for revising the single-salary schedule. Center for Educator Reform
Compensation. Washington, DC: U.S. Department of Education, Office of
Elementary and Secondary Education. Retrieved from
http://www.tifcommunity.org/sites/default/files/35202_TIF_SalSched-
for508.pdf
Murnane, R. J., & Olsen, R. J. (1990). The effects of salaries and opportunity costs on length
of stay in teaching: Evidence from North Carolina. The Journal of Human Resources,
25(1), 106-124.
Murnane, R. J., Singer, J. D., & Willett, J. (1989). Changes in teacher salaries during the
1970s: The role of school district demographics. Economics of Education Review,
6(4), 379-388.
My College Options and STEM Connector (2013). Where are the STEM students? What are
their career interests? Where are the STEM jobs? Washington, DC and Lee’s Summit,
MO: Author.

300 Summers St., Ste. 1240 • Charleston, WV 25301 • 1-855-355-ARCC (2722) • www.arccta.org
102
National Council on Teacher Quality. (n.d.). Douglas County teacher pay system.
Washington, DC: Author. Retrieved from
http://www.nctq.org/docs/Douglas_County_Documents.pdf
National Commission on Excellence in Education. (1983, April). A nation at risk: The
imperative for educational reform. A report to the nation and the Secretary of
Education United States Department of Education by The National Commission on
Excellence in Education. Washington, DC: Author.
National Education Association. (2008, March). Teacher compensation glossary.
Washington, DC: NEA Department of Collective Bargaining and Member Advocacy.
National Education Association. (2014, March). Rankings of the states 2013 and estimates of school statistics 2014. Washington, DC: Author. Retrieved from http://www.nea.org/assets/docs/NEA-Rankings-and-Estimates-2013-2014.pdf
National Institute for Excellence in Teaching (2014). TAP. The system for teacher and
student advancement. Santa Monica, CA: Author. Retrieved from http://www.tapsystem.org/action/action.taf?page=elements
No Child Left Behind (NCLB) Act of 2001, Pub. L. No. 107-110, §115, Stat. 1425 (2002). Odden, A., & Wallace, M. (2007, February). Rewarding teacher excellence: A teacher
compensation handbook for state and local policy makers. Madison, WI: Consortium for Policy Research in Education, Wisconsin Center for Education Research, University of Wisconsin. Retrieved from http://cpre.wceruw.org/publications/TComp%20Handbook%20Feb%2028%2007%20Final%20(3.05.07).pdf
Ohio Business Alliance for Higher Education & the Economy. (2007, July). Ohio’s commitment to STEM education as contained in the FY 008-09 Biennial Budget: AM. SUB. H.B. 119. Retrieved from http://www.kidsohio.org/wp-content/uploads/2008/02/7-12-07-stem-analysis-h-b-119-doc-sy-_3_-3.pdf
Ohio Department of Education. (2010). Application for grants under the Teacher Incentive
Fund Program. CFDA #84.385A. PR/Award #S385A100100. Columbus, OH:
Author. Retrieved from U.S. Department of Education
http://www2.ed.gov/programs/teacherincentive/apps/index.html

300 Summers St., Ste. 1240 • Charleston, WV 25301 • 1-855-355-ARCC (2722) • www.arccta.org
103
Organisation for Economic Cooperation and Development (OECD). (2014). TALIS 2013
results: An international perspective on teaching and learning. Paris: Author.
Palumbo, C. (2007, June). Funding diversified teacher compensation systems. ECS Issue
Paper. Funded by the Joyce Foundation. Denver, CO: Education Commission of the
States. Retrieved from http://www.ecs.org/html/Document.asp?chouseid=7475
Pennington, K. (2013). New organizations, new voices: The landscape of today’s teachers
shaping policy. Washington, DC: Center for American Progress. Retrieved from
http://www.americanprogress.org/wp-
content/uploads/2013/06/TeacherVoice.pdf
Podgursky, M. (2011). Teacher compensation and collective bargaining. In E. A.
Hanushek, S. Machin, & L. Woessmann (Eds.) Handbooks in economics, Vol. 3. (pp.
279-313). The Netherlands: North-Holland.
Public Impact. (2013). Six ways to pay all teachers more within budget. Chapel Hill, NC:
Public Impact. Retrieved from http://opportunityculture.org/wp-
content/uploads/2013/10/Six_Ways_to_Pay_All_Teachers_More_Within_Budget-
Public_Impact.pdf
Public Impact. (2013, March). News release: Public Impact announces three Nashville
schools implementing an Opportunity Culture to extend the reach of excellent
teachers. Chapel Hill, NC: Author. Retrieved from
http://opportunityculture.org/wp-
content/uploads/2013/03/Public_Impact_Press_Release-
Nashville_iZone_Opportunity_Culture_Schools.pdf
Raue, K., MacAullum, K., & Ristow, L. (2008, October). Building systems to recognize
teachers of excellence: Lessons from the Ohio Teacher Incentive Fund. Issue Paper
#2. Rockville, MD: Westat Education Studies Group.
Reddick, T. L., & Peach, L. E. (1986). Career ladder level II and level III teachers’ perceptions
of the effectiveness of the Tennessee career ladder program. Paper presented at the
15th Annual Meeting of the Mid-South Educational Research Association, Memphis,
TN. Retrieved from ERIC database. (ED275652)

300 Summers St., Ste. 1240 • Charleston, WV 25301 • 1-855-355-ARCC (2722) • www.arccta.org
104
Reform Support Network. (n.d.). Engaging educators: A Reform Support Network guide for
states and districts. Prepared for U.S. Department of Education. Fairfax, VA: Reform
Support Network, ICF International. Retrieved from
http://www2.ed.gov/about/inits/ed/implementation-support-unit/tech-
assist/engaging-educators.pdf
Rochkind, J., Immerwahr, J., Ott, A., & Johnson, J. (2007). Getting started: A survey of new
public school teachers on their training and first months on the job. In C. A. Dwyer
(Ed.), America's challenge: Effective teachers for at-risk schools and students. (pp.
89-104).Washington, DC: National Comprehensive Center for Teacher Quality.
Rothwell, J. (2013, June). The hidden STEM economy. Washington, DC: Metropolitan Policy
Program at Brookings Institution.
Rowland, C. (2008, April). Mission Possible: A comprehensive teacher incentive program in
Guilford County, North Carolina. Center for Educator Compensation Reform.
Washington, DC: U.S. Department of Education, Office of Elementary and
Secondary Education. Retrieved from
http://cecr.ed.gov/guides/summaries/GuilfordCountyCaseSummary.pdf.
Rowland, C., & Potemski, A. (2009, August). Alternative compensation terminology:
Considerations for education stakeholders, policymakers, and the media: Center for
Educator Compensation Reform. Washington, DC: U.S. Department of Education,
Office of Elementary and Secondary Education. Retrieved from
http://cecr.ed.gov/pdfs/EmergingIssuesReport2_8-21-09.pdf
Rumberger, R. W. (1987). The impact of salary differentials on teacher shortages and
turnover: The case of mathematics and science teachers. Economics of Education
Review, 6(4), 389-399.
Scholastic and the Bill & Melinda Gates Foundation. (2012). Primary sources 2012:
America’s teachers on the teaching profession. New York: Scholastic. Seattle, WA:
Gates Foundation. Retrieved from
http://www.scholastic.com/primarysources/pdfs/Gates2012_full.pdf
Schuermann, P., Archibald, S., Kluender, R., & Ptak, K. (2011). Meeting the challenges of
fiscal and programmatic sustainability: Lessons from Teacher Incentive Fund
grantees (The Harvesting Project). Center for Educator Compensation Reform.

300 Summers St., Ste. 1240 • Charleston, WV 25301 • 1-855-355-ARCC (2722) • www.arccta.org
105
Washington, DC: U. S. Department of Education, Office of Elementary and
Secondary Education. Retrieved from
http://www.eric.ed.gov/PDFS/ED533042.pdf
SERVE Center at UNCG. (2010). Guilford County Schools Mission Possible Program: Year 3
(2008-09) external evaluation report. Prepared by Holli Bayonas. Greensboro, NC:
SERVE Center at University of North Carolina at Greensboro. Retrieved from
http://www1.gcsnc.com/depts/mission_possible/pdf/District%20MP%20Year%
203%20Report.pdf
Smith Amos, D. (2014, February 11). Private donors offer $40 million in incentive pay for
teachers at struggling Jacksonville schools. The Florida Times Union. Retrieved
from http://members.jacksonville.com/news/metro/2014-02-11/story/40-
million-incentive-pay-teachers-struggling-schools-jacksonville
South Carolina Department of Education. (2012). Application for grants under the Teacher
Incentive Fund Program with a focus on STEM. CFDA #84.35B. PR/Award
#S374B120016. Columbia, SC: Author. Retrieved from U.S. Department of
Education
http://www2.ed.gov/programs/teacherincentive/apps2012stem/s374b120016.p
df
Springer, M., Rodriguez, L., & Swain, W. (2014). Effective teacher retention bonuses:
Evidence from Tennessee. Nashville, TN: Tennessee Consortium on Research,
Evaluation, and Development. Retrieved from
http://www.tnconsortium.org/data/files/gallery/ContentGallery/Effective_Teach
er_Retention_Bonuses_Evidence_from_TN.pdf
Stinebrickner, T. R. (1998). An empirical investigation of teacher attrition. Economics of
Education Review, 17(2), 127-136.
Tennessee Code. Annotated §49-1-302(4)(a). State Board of Education. Review
Committee for Basic Education Program.
Tennessee Code. Annotated §49-3-306. Computation–Pay Supplement–Licensed
Personnel Salaries.
Tennessee Code. Annotated §49-3-366. Funds for Teachers Salary.

300 Summers St., Ste. 1240 • Charleston, WV 25301 • 1-855-355-ARCC (2722) • www.arccta.org
106
Tennessee Code. Annotated §49-5-5002 Part 5. Teacher Tenure Law. Construction with
other Statutes.
Tennessee Comprehensive Education Reform Act, Public Acts 20. Tennessee Code.
Annotated §49-5-5002(a). (1984)
Tennessee Comptroller of the Treasury. (1997, May). Performance audit for the state
certification commission. Observations and comments–effectiveness of the career
ladder program. Nashville, TN: Author. Retrieved from
http://www.comptroller.tn.gov/repository/SA/pa96131.pdf
Tennessee Department of Education. (2010, November). Planning for teacher incentives:
Guidance for Competitive Supplemental Fund, Teacher Incentive Fund and
Innovation Acceleration Fund. PowerPoint presentation. Nashville, TN: Author.
Retrieved from
https://www.tn.gov/firsttothetop/WebinarPlanningforTeacherIncentivesTIFCSFI
AF11510_000.pdf
Tennessee Department of Education. (2013). Differentiated pay resource guide. Part II:
Design options and considerations. Nashville, TN: Author. Retrieved from
http://tn.gov/education/districts/pay.shtml
Tennessee Department of Education. (2013). 2014-2015. Differentiated pay plan
submission template. Nashville, TN: Author. Retrieved from
https://www.tn.gov/education/ds/diff_pay.shtml
Tennessee Department of Education. (2014, March). Race to the Top: Tennessee report
school year 3: 2012-2013. Submitted to the U.S. Department of Education.
Nashville, TN: Author. Retrieved from https://www.rtt-
apr.us/sites/default/files/state_year_pdfs/tennessee/2012-2013/state-specific-
summary-report__tennessee__2012-2013.pdf
Tennessee Department of Education. (2014, May). State of Tennessee annual statistical
report of the Department of Education for the scholastic year ending June 30, 2013.
Nashville, TN: Author.
Tennessee Department of Education, Office of Research and Policy. (2013, February).
Recent retirement trends of Tennessee teachers. Policy Brief. Nashville, TN: Author.

300 Summers St., Ste. 1240 • Charleston, WV 25301 • 1-855-355-ARCC (2722) • www.arccta.org
107
Retrieved from
http://www.tn.gov/education/data/doc/RecentRetirementTrendsofTennesseeTe
achers_FINAL.pdf
Tennessee Department of Education, Office of Research and Policy. (2014, May). Teacher
retention in Tennessee: Are we keeping our best teachers? Policy Brief. Nashville,
Author. Retrieved from http://www.tn.gov/education/data/research.shtml
Tennessee Higher Education Commission and Tennessee State Board of Education.
(2013, November). 2013 report card on the effectiveness of teacher training
programs. Nashville, TN: Author. Retrieved from
http://www.tn.gov/thec/Divisions/fttt/13report_card/1_Report%20Card%20on
%20the%20Effectiveness%20of%20Teacher%20Training%20Programs.pdf
Tennessee Office of the Governor. (2010, January). Tennessee Race to the Top application
for initial funding. Retrieved from U.S. Department of Education.
https://www2.ed.gov/programs/racetothetop/phase1-
applications/tennessee.pdf
Tennessee Public Acts. 2007. Chapter 376. Accountability–Schools/Systems on Probation.
Retrieved from http://www.state.tn.us/sos/acts/105/pub/pc0376.pdf
Tennessee Public Acts. 2010. Chapter 2. Section 12.
Tennessee State Board of Education. (2007, November). Agenda: Guidelines for
differentiated pay plans public chapter 376. Nashville, TN: Author.
Tennessee State Board of Education. (2011, July). Agenda: Tennessee alternative salary
schedules. Nashville, TN: Author
Tennessee State Board of Education. (2013, June). Differentiated pay plan guidelines.
Nashville, TN: Author.
Tennessee State Board of Education, Basic Education Program Review Committee. (2013,
November). Basic Education Program Review Committee annual report. Nashville,
TN: Author. Retrieved from
http://www.tn.gov/sbe/BEP/2013%20BEP/BEP_November_1_2013_Report_FIN
AL.pdf

300 Summers St., Ste. 1240 • Charleston, WV 25301 • 1-855-355-ARCC (2722) • www.arccta.org
108
Tennessee State Board of Education. (2014). Basic Education Program (BEP). Nashville,
TN: Author. Retrieved from http://www.tn.gov/sbe/bep.shtml
Tennessee State Board of Education. (2014a, January). Agenda: Chester County alternative
salary schedule. Nashville, TN: Author.
Tennessee State Board of Education. (2014b, January). Agenda: Haywood County
alternative salary schedule. Nashville, TN: Author.
TNTP. (2013, August). Perspectives of irreplaceable teachers. Washington, DC: Author.
Retrieved from http://tntp.org/ideas-and-innovations/view/perspectives-of-
irreplaceable-teachers
U.S. Department of Education. (2012). 2012 General Teacher Incentive Fund grant
competition. Webinar PowerPoint presentation. Washington, DC: U.S. Department
of Education. Retrieved from
http://www2.ed.gov/programs/teacherincentive/applicant.html
U.S. Department of Education, National Center for Education Statistics. (2004). Schools
and Staffing Survey (SASS). Public school district data file. 2003-2004 Washington,
DC: Author. Retrieved from
http://nces.ed.gov/surveys/sass/tables/state_2004_35.asp
U.S. Department of Education, National Center for Education Statistics. (2008). Schools
and Staffing Survey (SASS). Public school district data file. 2007-2008 Washington,
DC: Author. Retrieved from
http://nces.ed.gov/pubs2009/2009320/tables/sass0708_2009320_d1n_05.asp
U.S. Department of Education, National Center for Education Statistics. (2012). Schools and
Staffing Survey (SASS). Public school district data file. 2011-2012. Washington, DC:
Author. Retrieved from http://nces.ed.gov/surveys/sass/tables_list.asp#2012
U.S. Department of Education, National Center for Education Statistics (2014). The
condition of education 2014. Chapter 3. Public school expenditures. Washington, DC:
Author. Retrieved from
http://nces.ed.gov/programs/coe/pdf/Indicator_CMB/COE_CMB_2013_05.pdf
U.S. Department of Education, Office of Elementary and Secondary Education. (2006,
October). Improving teacher quality state grants, ESEA Title II, Part A: Non-

300 Summers St., Ste. 1240 • Charleston, WV 25301 • 1-855-355-ARCC (2722) • www.arccta.org
109
regulatory guidance. Washington, DC: Author. Retrieved from
http://www2.ed.gov/programs/teacherqual/legislation.html
U.S. Department of Education, Office of Postsecondary Education. (2014, March). Teacher
shortage areas nationwide listing 1990-1991 through 2014-2015. Washington, DC:
Author. Retrieved from http://www2.ed.gov/about/offices/list/ope/pol/tsa.pdf
Virginia Department of Education (2012, January). Governor McDonnell advances
“Opportunity to Learn” education agenda. Richmond, VA: Author. Retrieved from
http://www.doe.virginia.gov/news/news_releases/2012/jan09_gov.shtml
Virginia Department of Education. (2013a, January). Overview of new teacher
compensation, recruitment, and retention funding in SB 800 and program updates
Presentation to the Senate Finance Committee on Education. Richmond, VA:
Author. Retrieved from
http://sfc.virginia.gov/pdf/education/2013_Meetings/DOE.pdf
Virginia Department of Education. (2013b, June). Superintendent’s memo #169-13.
Science, technology, engineering, and mathematics (STEM) teacher recruitment and
retention incentive awards. Richmond, VA: Author. Retrieved from
http://www.doe.virginia.gov/administrators/superintendents_memos/2013/169
-13.shtml
Wesson, L. (2013, January). Trends in teacher compensation: Focus on alternative salary
schedules. Legislative Brief. Nashville, TN: Office of Research and Education
Accountability, Tennessee Comptroller of the Treasury. Retrieved from
http://www.comptroller.tn.gov/Repository/RE/Alternative%20Salary%20Sched
ules.pdf
Witham, P., McKithen, C., & Scott, J. (2012, March). The role of program evaluation on
communication strategies: Examples from three Teacher Incentive Fund districts.
Center for Educator Compensation Reform. Washington, DC: U.S. Department of
Education, Office of Elementary and Secondary Education. Retrieved from
http://www.cecr.ed.gov/pdfs/CECR_RoleProgram.pdf
Woods, R., & Clark, M. (2010, November). Planning for teacher incentives: Guidance for
Competitive Supplemental Fund, Teacher Incentive Fund, and Innovation
Acceleration Fund. Webinar. Nashville, TN: Tennessee Department of Education.

300 Summers St., Ste. 1240 • Charleston, WV 25301 • 1-855-355-ARCC (2722) • www.arccta.org
110
WorldatWork and Deloitte Consulting LLP. (2012, May). Salary structure policies and
practices. Scottsdale, AZ: WorldatWork. New York: Deloitte Consulting LLP.

300 Summers St., Ste. 1240 • Charleston, WV 25301 • 1-855-355-ARCC (2722) • www.arccta.org
111
Appendix: Glossary of Terms
The glossary of terms below is taken directly from literature on teacher compensation
reform. One important exception, however, is “market-based pay”; because the term is
new to the education field, the definition was developed based on definitions used in the
business sector.
Alternative compensation. A salary system in which employee base pay increases are
determined by factors other than educational attainment and years of service. Such
factors differ from district to district but could include such components as evaluation
scores, value-added, peer evaluation, additional duties, parent/student surveys, working
in a hard-to-staff subject/building, or skill attainment (Douglas, 2012).
Alternative salary schedule. A salary schedule that uses a component, often a
performance measure, in addition to or in place of education and experience to determine
base pay. For example, a schedule that determines the amount of an educator’s yearly
base pay increase on the basis of his or her evaluation score is an alternative salary
schedule. Alternative salary schedules are subject to State Board of Education approval
(Tennessee Department of Education, 2013, p. 6).
Base pay (base salary). An individual’s salary, excluding any additional compensation in
the form of bonuses, stipends, or supplements for additional work or responsibilities
(Tennessee Department of Education, 2013).
Basic Education Program (BEP). A Tennessee funding formula through which state
education dollars are generated and distributed to Tennessee public schools (Tennessee
State Board of Education, 2014).
Bonus/stipend. Additional compensation for a pre-defined set of criteria. Bonus and
stipend pay are awarded in addition to or “on top of” an individual’s base
pay. Bonuses/stipends are one-time payments awarded for a specific role, additional
responsibility, or achievement of particular criteria. Bonuses and stipends are not part of
base salary and do not become a reoccurring part of an individual’s compensation.
(Tennessee Department of Education, 2013, p. 6).
Career ladder. A system of formal teacher leadership (e.g., mentor, instructional
specialist) and pay through which teachers achieve more highly compensated positions
as they progress from “novice” to “advanced” practitioner. Teachers “climb” the rungs of a
300 Summers St., Ste. 1240 • Charleston, WV 25301 • 1-855-355-ARCC (2722) • www.arccta.org
112
career ladder as they grow in experience and take on additional duties and
responsibilities (National Education Association, 2008).
Competitive Supplemental Funds (CSF grants). Tennessee Department of Education’s
discretionary grants to districts receiving small First to the Top awards to support the
planning of compensation models (Woods & Clark, 2010).
Differential or differentiated pay. A general term used to describe a form of pay that
differs from the single-salary schedule, designated for teachers who accept assignments
in hard-to-staff schools and/or subject areas (Rowland & Potemski, 2009).
Innovation Acceleration Fund (IAF grants). Tennessee Department of Education’s
discretionary grants to support a district’s adoption and implementation of alternative
compensation systems. The IAF grants were four-year grants to support districts in the
design and implementation of sustainable compensation systems based on alternative
salary schedules and rewards for teachers who increase student achievement levels
(Wesson, 2013).
Market-based pay. The alignment of teacher salaries with the salaries available in other
labor markets. It suggests that the salaries offered by competing employers should be a
central consideration when setting pay levels for teachers as a profession or within
particular subject or geographic areas.
Merit-based models. Models that provide bonuses or pay increases to teachers based on
their impact on student achievement and their records of success (Cour, 2009).
Opt-in/opt-out provision. Individuals may choose whether to participate in a
program. This provision is most often associated with alternative salary schedules and is
not required (Tennessee Department of Education, 2013, p. 6).
Performance pay, pay for performance, or performance-based compensation.
Programs that base pay on either teacher performance (evaluation or professional
development) or student performance indicators (value-added or gains scores on
standardized tests, objective evaluations of student performance, or other valid and
reliable assessments of student performance) (Roland & Potemski, 2009).
Single salary schedule. See traditional salary schedule below.
STEM. Science, technology, engineering, and mathematics.

300 Summers St., Ste. 1240 • Charleston, WV 25301 • 1-855-355-ARCC (2722) • www.arccta.org
113
Teacher Advancement Program (TAP). The Teacher Advancement Program of the
National Institute for Excellence in Teaching is a system designed to provide teachers
with a career pathway. In most TAP schools, the basic salary schedule remains in place.
Salary augmentations are given to master and mentor teachers for their increased levels
of responsibility and work. TAP recommends augmentations of $5,000-$12,000 for
mentor teachers and $10,000-$20,000 for master teachers, depending on school and
district budgets. All TAP teachers are eligible for performance bonuses based upon their
professional practices—as assessed by multiple, certified TAP evaluators—as well as
their students' academic achievements and the school's overall academic progress during
the school year (National Institute for Excellence in Teaching, 2014).
Teacher Incentive Fund (TIF) grants. The purpose of the federally funded Teacher
Incentive Funds grant is to provide financial support to develop and implement
sustainable performance-based compensation systems for teachers, principals, and other
personnel in high-need schools to increase educator effectiveness and student
achievement in those schools (U.S. Department of Education, 2012).
Teacher incentives or incentive pay. A general term for providing teachers with
additional compensation beyond the traditional single-salary schedule. Incentive pay can
be based on a variety of indicators and is often used as a tool to recruit teachers for
particular schools or subject areas (Rowland & Potemski, 2009).
Traditional salary schedule (or step and lane schedule). A salary schedule that uses
years of experience and education exclusively to determine an educator’s increases in
base pay. Traditional schedules may follow the same structure as the state minimum
salary schedule. Salary schedules that modify the amount of the step increases given for
experience or change the structure of the education lanes may still be considered a
traditional schedule as long as they meet or exceed the relevant state minimums
(Tennessee Department of Education, 2013, p. 6).