Embed Size (px)
Citation preview

CHARACTERIZATION OF THE RELATIONSHIP BETWEEN LEAF SPOT SEVERITY
AND YIELD IN NEW PEANUT RUNNER-TYPE CULTIVARS AND EFFECTS OF NEW
PEANUT GENOTYPES ON LEAF SPOT EPIDEMICS
by
PABLO ALEJANDRO NAVIA GINE
(Under the Direction of Albert K. Culbreath)
ABSTRACT
New peanut (Arachis hypogaea) cultivars ‘Florida-07’, ‘Georgia-06G’, ‘Georgia-07W’,
and ‘Tifguard’ were combined with four different fungicide treatments in multiple field trials in
2010 and 2011 to examine the relationship between percent defoliation, caused by Cercospora
arachidicola or Cercosporidium personatum, and pod yield. Decline in yield was no more than
14.4 kg per % increase in defoliation in all cultivars and trials, which was lower than previously
reported. Canopy reflectance was correlated with percent defoliation in most cases. Field trials
were conducted in Tifton, GA and Marianna, FL to evaluate field reactions of new peanut
genotypes developed as part of the USAID Peanut CRSP program. Four genotypes (97x45-HO1-
2-B2G-1-2-1-2, 98x64-2-2-1-2b4-B, 96x72-HO1-10-2-1-b4-B, and CRSP 1048-192T) showed
moderate levels of field resistance to C. personatum. Incidence of stem lesions caused by C.
personatum was higher for Florida-07 than for Georgia-07W or Tifguard.
INDEX WORDS: Cercosporidium personatum, late leaf spot, yield losses, cankers,
resistance.

CHARACTERIZATION OF THE RELATIONSHIP BETWEEN LEAF SPOT SEVERITY
AND YIELD IN NEW PEANUT RUNNER-TYPE CULTIVARS AND EFFECTS OF NEW
PEANUT GENOTYPES ON LEAF SPOT EPIDEMICS
by
PABLO ALEJANDRO NAVIA GINE
FORB, Universidad NUR, Bolivia, 1999
A Thesis Submitted to the Graduate Faculty of The University of Georgia in Partial Fulfillment
of the Requirements for the Degree
MASTER OF SCIENCE
ATHENS, GEORGIA
2012
© 2012
Pablo Alejandro Navia Gine
All Rights Reserved

CHARACTERIZATION OF THE RELATIONSHIP BETWEEN LEAF SPOT SEVERITY
AND YIELD IN NEW PEANUT RUNNER-TYPE CULTIVARS AND EFFECTS OF NEW
PEANUT GENOTYPES ON LEAF SPOT EPIDEMICS
by
PABLO ALEJANDRO NAVIA GINE
Major Professor: Albert K. Culbreath
Committee: Barry L. Tillman
Robert C. Kemerait Jr.
Nathan B. Smith
Electronic Version Approved:
Maureen Grasso
Dean of the Graduate School
The University of Georgia
August 2012

iv
DEDICATION
This work is dedicated to my family (Alejandra, Luna, Mile, and Nahir) for giving me the
pathway to follow, for brightening my way, and for keeping me going.
v
ACKNOWLEDGEMENTS
I would like to thank Dr. Albert K. Culbreath for giving me the opportunity to build my
career as a plant pathologist, for giving me the example of how to be a good scientist, for
supporting and understanding me all this times. His patience and contribution are invaluable. I
would also like to thank Dr. Harald Scherm for guiding me since the first time we met by phone,
and for giving me the right answers and advice to all my questions and doubts. In addition I
would like to acknowledge my committee members Dr. Nathan Smith, Dr. Robert Kemerait, and
Dr. Barry Tillman for their excellent guidance and research advice. Finally I would like to thank
my coworkers at the head lab in Tifton for their friendship and support.

vi
TABLE OF CONTENTS
Page
ACKNOWLEDGEMENTS......................................................................................................... v
LIST OF TABLES ....................................................................................................................vii
LIST OF FIGURES ................................................................................................................... ix
CHAPTER
1 INTRODUCTION AND LITERATURE REVIEW ................................................... 1
2 RELATIONSHIPS AMONG DEFOLIATION CAUSED BY LEAF SPOT,
CANOPY REFLECTANCE, POD YIELD, AND GRADE IN NEW RUNNER-
TYPE PEANUT CULTIVARS ................................................................................ 27
3 EFFECT OF RUNNER-TYPE PEANUT CULTIVARS AND ADVANCED
BREEDING LINES ON SEVERITY OF LATE LEAF SPOT AND POD YIELD ... 63
4 INCIDENCE OF STEM LESIONS CAUSED BY CERCOSPORIDIUM
PERSONATUM IN NEW RUNNER-TYPE CULTIVARS ...................................... 81
5 CONCLUSIONS ..................................................................................................... 93

vii
LIST OF TABLES
Page
Table 1.1: Area planted in Georgia in 2010 to produce foundation, registered and certified
seed ............................................................................................................................... 22
Table 1.2: Florida leaf spot disease rating scale ......................................................................... 23
Table 2.1: Pearson’s correlation coefficients of the relationship among percent defoliation, yield,
TSMK, and dollar value tests A and B. Tifton, GA 2010. .............................................. 46
Table 2.2: Pearson’s correlation coefficients of relationship among percent defoliation, NDVI,
NIR, VIS, yield, TSMK, and dollar value. Test C Tifton, GA 2011................................ 47
Table 2.3: Pearson’s correlation coefficients of relationship among percent defoliation, NDVI,
NIR, VIS, yield, TSMK, and dollar value. Test D Attapulgus, GA, 2011. ...................... 49
Table 2.4: Pearson’s correlation coefficients of relationship among percent defoliation, NDVI,
NIR, VIS, yield, TSMK, and dollar value. Test E. Plains, GA, 2011. ............................. 51
Table 3.1: Pedigree, relative maturity, and oleic acid content of peanut genotypes evaluated for
yield and leaf spot resistance in 2010 and 2011 ............................................................. 77
Table 3.2: Effect on peanut genotypes and fungicide treatments on severity of late leaf spot and
pod yield, Tifton, GA 2010 ............................................................................................ 78
Table 3.3: Effect on peanut genotypes and fungicide treatments on severity of late leaf spot and
pod yield, Tifton, GA 2011 ............................................................................................ 79
Table 3.4: Effect on peanut genotypes on severity of late leaf spot, percent defoliation, and pod
yield, Marianna, FL 2010 and 2011 .............................................................................. 80
viii
Table 4.1: Effect of cultivar on incidence of stem lesions, defoliation, and pod yield ................. 92

ix
LIST OF FIGURES
Page
Figure 1.1: Cercospora arachidicola (A) and Cercosporidium personatum (B) lesions. ............ 24
Figure 1.2: Cercospora arachidicola conidiophores (A) and conidia (B) ................................... 25
Figure 1.3: Cercosporidium personatum conidiophores (A) and conidia (B).............................. 26
Figure 2.1: Disease progress curves for defoliation caused by late leaf spot (Cercosporidium
personatum) in the non-treated plots of the cultivar Georgia-06G in 2010 and 2011 ..... 53
Figure 2.2: Relationships of yield (kg/ha) (A) and crop value ($/ha) (B) in function of final
percent defoliation in Trial A, Tifton, GA 2010 ............................................................. 54
Figure 2.3: Relationships of yield (kg/ha) (A) and crop value ($/ha) (B) in function of final
percent defoliation in Trial B, Tifton, GA 2010 ............................................................. 55
Figure 2.4: Relationships of yield (kg/ha) (A) and crop value ($/ha) (B) in function of final
percent defoliation in Trial D, Attapulgus, GA 2011 ...................................................... 57
Figure 2.5: Relationships of yield (kg/ha) (A) and crop value ($/ha) (B) in function of final
percent defoliation in Trial C, Tifton, GA 2011 ............................................................. 59
Figure 2.6: Relationships of yield (kg/ha) (A) and crop value ($/ha) (B) in function of final
percent defoliation in Trial E, Plains, GA 2011 .............................................................. 60
Figure 2.7: Yield (kg/ha) increased linearly with increasing levels of NDVI for Florida-07 and
Georgia-06G in Tifton, GA 2011. Yield (kg/ha) increased linearly with increasing levels
of NDVI for Florida-07, Georgia-06G, and Georgia-07W in Attapulgus, GA 2011 ........ 62

1
CHAPTER 1
INTRODUCTION - LITERATURE REVIEW
Peanut, Arachis hypogaea L., is a very important crop worldwide. It is important to the
global diet, and is used for food for people from poor countries as well as developed countries.
Peanuts can be eaten raw, used in recipes or consumed as peanut butter. Peanut also has other
uses. It can be crushed for oil, solvents and medicines; it can also be used for animal feed, to
make textile materials, and many other uses. The cultivated peanut is a native South American
legume (Hammons, 1982). After the discovery of America, peanut was disseminated to Europe,
Africa, Asia, and to the Pacific Islands. Eventually it traveled to the colonial seaboard of the
present southeastern United States (Hammons, 1982) where it has been grown since. The United
States is the third largest producer of peanut in the world with 444,182 ha harvested in 2011
(USDA, 2012). Major production areas in the United States are located in Georgia, Florida,
Alabama, Texas, Mississippi, North Carolina, South Carolina, Virginia and Oklahoma. Georgia
has the largest peanut production, accounting for 41.6% of the peanut production in the U.S. for
2011 (USDA, 2012). There are approximately 25,000 peanut farmers in the major producing
areas (Anonymous, 2012), and they produced an estimated 1.81 million tons of peanuts on
approximately 1.14 million acres in 2011 (USDA-NASS, 2012). Most of the peanut crop
produced in the United States is shelled and is processed as peanut butter, salted peanuts, and
confections (Porter, 1997a).
The peanut plant exhibits a range of growth habits, from erect to prostrate. Typically it is
sparsely hairy, and it may grow to a height of 15-60 cm or higher. It has a prominent well-

2
developed taproot with many lateral roots (Porter, 1997a). Peanut leaves are alternately arranged
on the stems. Each leaf has four leaflets, approximately 2-10 cm long, in opposing pairs. The
flowers are typically yellow and located in the axils of leaves at nodes not occupied by branches
(Shokes and Melouk, 1995). Flowers are self-pollinated around sunrise and within one week of
fertilization a pointed gynophore, also known as a geocarpophore but most commonly referred to
as a “peg”, develops and elongates. The fertilized ovaries are located behind the tip of the peg.
The peg grows into the soil to a depth of 2-7 cm. The tip orients itself horizontally, the ovary
enlarges rapidly, and the pod begins to grow (Porter, 1997a). Mature pods may contain one to
five seeds or kernels. The testae, or seed coats, vary in color depending on the cultivar but are
typically tan, pink, or red (Shokes and Melouk, 1995).
In the U.S. peanuts are typically grown in sandy, loamy soils from April to October,
depending on the variety. Peanuts require 120-160 frost free days. They need an abundance of
sunlight and temperatures that range from 21-30 °C with night temperatures not falling below 10
°C (Ketring and Reid, 1995). Peanut plants need approximately 83 cm of rainfall, depending on
dispersion through the season, to reach optimum growth. Adequate soil moisture is needed the
entire season, but adequate moisture is most critical during fruiting and pod fill (Henning et al.,
1982). Optimal soil pH is between 6.0 and 7.0 (Ketring and Reid, 1995). The peanut plant fixes
its own nitrogen and grows well and produces good yields by using residual phosphorus and
potassium applied to other crops in the rotation. The plant needs boron to ensure kernel quality
(Ketring and Reid, 1995), and it has a unique need for calcium, which seems to increase with the
kernel size of the type grown (Cox and Sholar, 1995).
There are four market types accepted in the market. The most common type grown in the
U.S is the runner type which is used primarily for the manufacture of peanut butter. The large

3
kerneled virginia type is marketed mainly as snack peanuts and in-shell peanut products. The
spanish type, with rounder and smaller kernels, is used for snack peanuts, peanut butter and
confections. The longer podded valencia type, containing three to five kernels in each shell, is
marketed mostly in the shell for roasting or boiling. Certain spanish and valencia types may
require only 95 to 100 days to reach optimum maturity while some runner and virginia types may
require 140 days or more (Henning et al., 1982).
As with any other row crop, peanuts need special management to ensure that conditions
are optimal for the health of the plant. The most important factors to take into account are
physiological and environmental disorders, weeds, pre-harvest and post-harvest insects, viral
diseases, foliar pathogens, soil borne fungal pathogens, nematodes and mycotoxin-producing
fungi. Because of the increasing importance of the peanut as a food, feed and oil crop, more
attention has been given to improved crop management practices, especially in the areas of pest
control, tillage, crop rotation, irrigation, and new cultivars.
Peanut foliar diseases. The most important foliar diseases of peanut in the southeastern
U.S. are early leaf spot, caused by Cercospora arachidicola Hori (teleomorph = Mycosphaerella
arachidis Deighton), and late leaf spot, caused by Cercosporidium personatum (Berk. & M. A.
Curtis.) Deighton (teleomorph = Mycosphaerella berkeleyi Jenk.), respectively. These two
diseases and peanut rust, caused by Puccinia arachidis Speg. are widely distributed throughout
the world. Although peanut rust causes severe problems in some fields and intermittently across
wider areas, problems with the leaf spot diseases are much more prevalent. Early and late leaf
spot can be very destructive on susceptible cultivars if effective fungicides are not applied
(Porter et al., 1982). In the U.S., use of fungicides is the primary management practice used to
control these diseases. Without fungicidal control on susceptible cultivars, yield losses from

4
these diseases may approach 70% (Nutter and Shokes, 1995). Symptoms of early and late leaf
spots are small necrotic flecks that enlarge and become light-brown to black circular spots
ranging from 1-10 mm or more in diameter (Porter et al., 1982). However, all above-ground
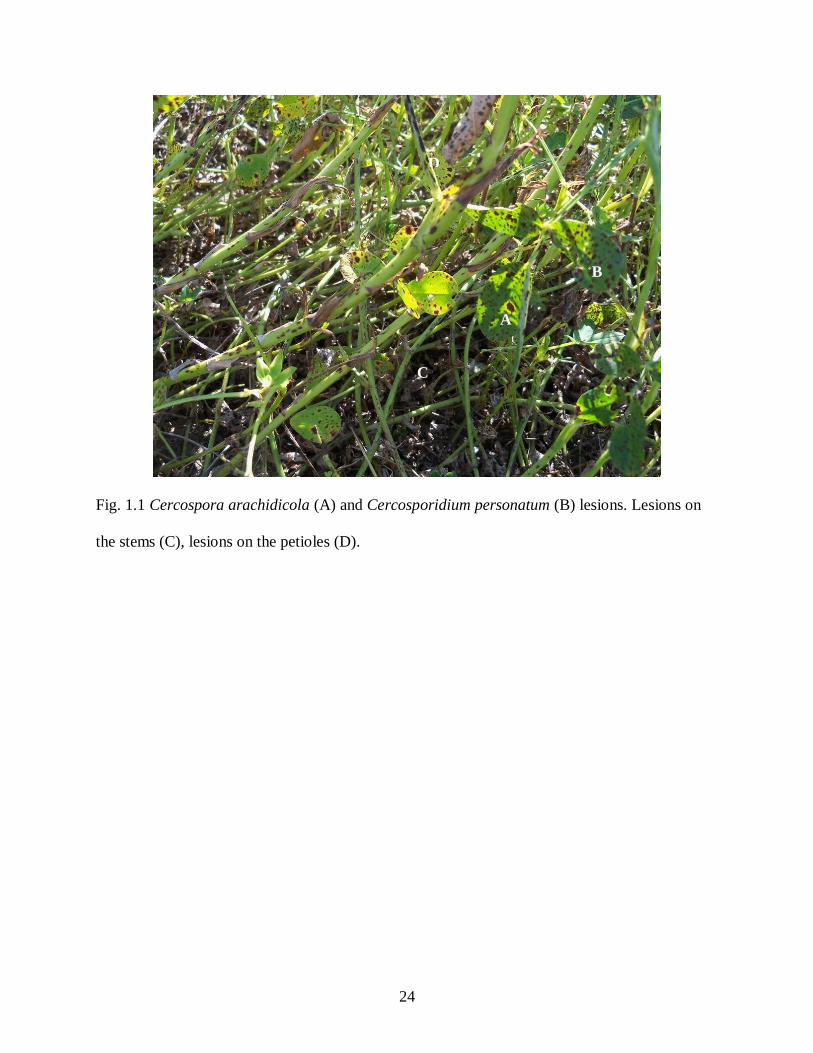
plant parts are subject to infection and late in the season during severe epidemics, lesions occur
on leaf petioles, gynophores, central stems, and lateral branches (Nutter and Shokes, 1995)
(Fig.1.1). Lesions for early and late leaf spot often are very similar on the upper (adaxial) side of
the leaf. Early leaf spot lesions are usually light tan to reddish brown on the underside (abaxial
surfaces) of leaflets (Shokes and Culbreath, 1997) and are typically surrounded by conspicuous
yellow halo (Porter et al., 1982). Lesions of late leaf spot are usually dark brown to black on the
underside, but the presence of a halo is not consistent. The early leaf spot fungus sporulates
primarily on the adaxial surface, and the late leaf spot fungus usually sporulates on the abaxial
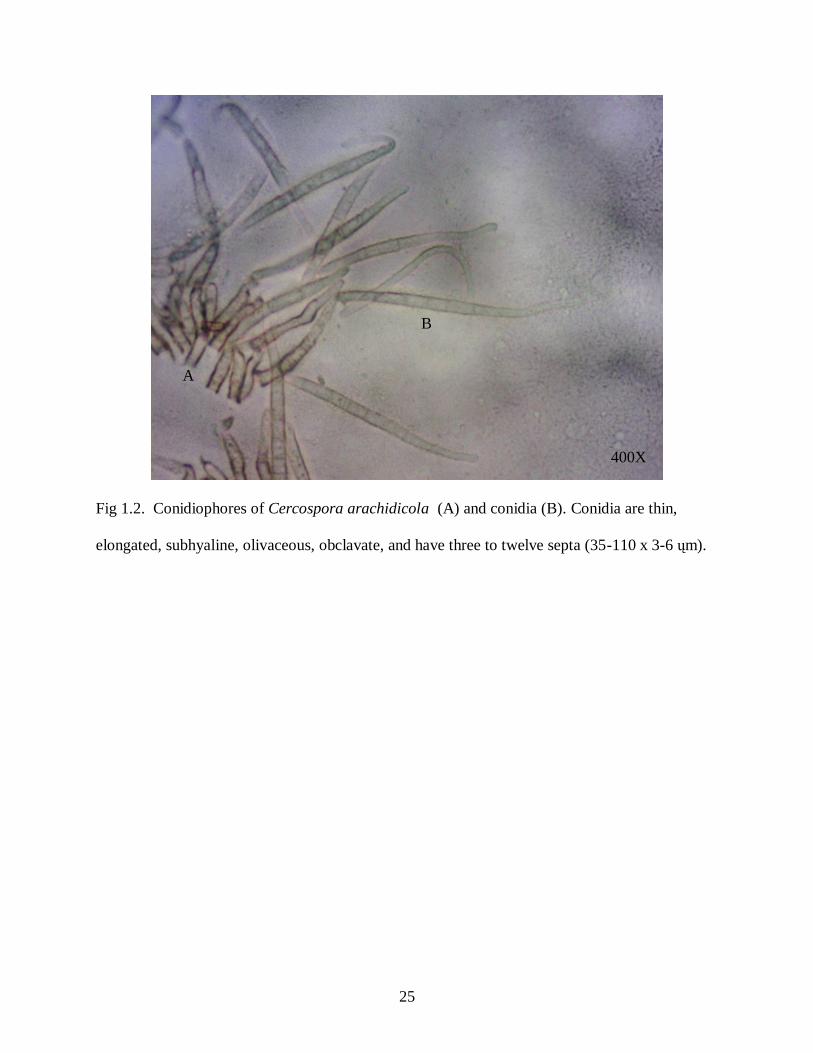
surface of the leaflet (Porter et al., 1982). Conidia of C. arachidicola (35-110 x 3-6 ųm) are thin,
elongated, subhyaline, olivaceous, obclavate, with three to twelve septa. Conidia of C.
personatum (20-70 x 4-9 ųm) are thicker, curved, “cigar shaped”, medium olivaceous,
cylindrical, and obclavate, and have one to nine septa (Shokes and Culbreath, 1997) (Fig. 1.2,
1.3).
Favorable environmental conditions for infection of early leaf spot range from 16 - 25 °C
with long periods of relative humidity greater than 90% (Nutter and Shokes, 1995; Shokes and
Culbreath, 1997). Conditions favorable for late leaf spot epidemics include periods of leaf
wetness with temperatures of 20 - 26 °C (Shokes and Culbreath, 1997). New spores on lesion
surfaces will be produced during warm, wet weather. Late leaf spot has the potential to cause
more damage over a shorter period of time than early leaf spot. This is because C. personatum
produces more spores per lesion despite of having a longer incubation period (10 to14 days

5
compared to six to eight days for C. arachidicola) (Shokes and Culbreath, 1997; Nutter and
Shokes, 1995). Smith and Crosby (1973) reported that the number of conidia increased with the
onset of rainfall. They also obtained evidence for the vertical dissemination of C. arachidicola
conidia to heights of 2.7 m above the soil surface in a peanut field. Conidia can be dispersed by
wind, splashing water, insects and farm implements and infect healthy plants in the field.
Repeated cycles of the diseases occur during the cropping season.
Fungi causing early and late leaf spot infect only peanut and both pathogens survive
between cropping periods in plant debris. Therefore, deep plowing and crop rotation will result
in decreased survival of leaf spot inoculum in the soil (Nutter and Shokes, 1995). However, use
of conservation tillage also suppressed leaf spot epidemics (Porter and Wright, 1991; Monfort et
al., 2004; Cantonwine et al. 2006, 2007), likely because undisturbed soil and previous crop
debris impedes splash dispersal of conidia from the soil (Cantonwine et al., 2007). The selection
of cultivars, fungicides, and tillage systems can all have an impact on disease development
(Nutter and Shokes, 1995).
An integrated management system can be effective for controlling leaf spot diseases,
allowing for reduced dependence on fungicides for disease control. The use of fungicides is the
primary practice for control of leaf spot. For over two decades prior to 1994, peanut growers in
the southeastern U.S. relied almost exclusively on chlorothalonil (Culbreath et al., 2002) which
is a broad spectrum, multiple-site protectant fungicide with little or no risk of resistance
developing in the leaf spot pathogens. The traditional application of chlorothalonil was based on
a calendar schedule, beginning at 30-40 days after planting and continuing at 10-14 day intervals
until 14-21 days before harvest (Shokes and Culbreath, 1997). However, chlorothalonil has little
or no efficacy against some other fungal diseases such as stem rot caused by Sclerotium rolfsii

6
(Culbreath et al., 1992a). Therefore, the use of fungicides such as tebuconazole, azoxystrobin,
(Culbreath et al., 2002; Hagan et al., 2010), flutolanil (Rideout et al., 2008), and others in
alternation or combination with chlorothalonil is a common practice among the peanut growers.
The typical use pattern for chlorothalonil was seven applications, made at approximately
14-day intervals. Today few growers use only chlorothalonil for leaf spot control. Most of the
other fungicides used are “at risk” for leaf spot pathogens becoming less sensitive, or resistant to
them. After tebuconazole was labeled in 1994, it displaced chlorothalonil as the prevalent
fungicide used on peanut in the southeastern U.S. However, resistant populations of both C.
arachidicola and C. personatum have developed (Stevenson, 2006). Although tebuconazole is
still effective against S. rolfsii, it is has reduced efficacy against one or both of the leaf spot
pathogens in many fields.
Several fungicides are available that are effective against leaf spot and one or more
soilborne pathogens. However, they are expensive, and the cost associated with fungal disease
control (cost of fungicides plus the cost of application) represents one of the highest input costs
in peanut production. Several studies have been conducted to reduce fungicide inputs through the
use of weather-based application strategies (Johnson et al., 1985; Rideout et al., 2008; Hagan et
al., 2010), reduced rates and extended spray intervals (Culbreath et al., 2002; Cantonwine et al.
2006; Gremillion et al, 2011; Monfort et al., 2004), and reduced calendar programs (Hagan et al.,
2010) with good results. A risk assessment tool, Peanut Rx, has been developed that helps
growers to decide how many fungicide applications are needed for control of foliar and soilborne
diseases based on relative risks associated with factors such as crop rotation, cultivar choice,
tillage system, planting date, and irrigation (Kemerait et al., 2011). This has prompted many

7
growers to use reduced fungicide regimes in situations where full regimes are not needed.
However, many still use a full conventional calendar program.
One of the most desirable ways to improve control of leaf spot diseases and reduce the
dependence on fungicides is the development and deployment of cultivars with resistance to both
C. arachidicola and C. personatum. Development of leaf spot resistant cultivars has been a
priority for peanut breeders for many years. The first leaf spot resistant runner-type cultivar was
‘Southern Runner’ developed by Gorbert et al. (1987), and several others with similar or higher
levels of partial resistance have been released. ‘Florida MDR-98’ (Gorbet and Shokes, 2002),
‘C-99R’ (Gorbet and Shokes, 2002), ‘Georganic’ (Holbrook and Culbreath, 2008), ‘Georgia-
01R’ (Branch, 2002), ‘DP-1’ (Gorbet and Tillman, 2008), and ‘York’ (Gorbet and Tillman,
2011) all have moderate levels of resistance to one or both of the leaf spot pathogens. In previous
studies significant differences in leaf spot severity were noted between ‘Florunner’, a susceptible
cultivar, and resistant cultivars/breeding lines. The pod yield of resistant genotypes was double
that of susceptible lines when no fungicides were applied (Gorbet et al., 1990). Those results
indicated that it was possible to develop cultivars with leaf spot resistance that reduced the need
for fungicide control of leaf spot diseases. To date, those cultivars have not been widely
accepted by the industry because most have a later maturity than standard cultivars such as
Florunner, and problems with seed germination and seedling vigor have been common with leaf
spot resistant lines. Georganic has red testae which are not acceptable for conventional
production (Holbrook and Culbreath, 2008). Therefore, commercial success of leaf spot resistant
cultivars has been limited (Tillman, 2009).
New runner-type peanut cultivars. In the late 1980s and early 1990s, tomato spotted
wilt, caused by Tomato spotted wilt tospovirus (TSWV), emerged as a new problem in peanut in

8
the southeastern U.S. (Culbreath et al., 1992b; Culbreath and Srinivasan, 2011). By the mid-
1990s it had become one of the most important diseases of peanut in that region (Culbreath et al.,
1992b, Culbreath and Srinivasan, 2011). Among other complications brought about by tomato
spotted wilt, the disease caused an abrupt shift in the emphasis of peanut breeding programs.
The leaf spot resistant cultivar Southern Runner was found to have moderate field resistance to
TSWV (Culbreath et al. 1992b). Although Southern Runner was not adopted widely for
production, it proved to be a valuable parent in breeding for resistance to TSWV. The cultivar
‘Georgia Green’ (Branch, 1996) had Southern Runner as a parent and had field resistance to
TSWV that was similar to that of Southern Runner (Culbreath et al. 1996). Georgia Green
became an integral part of an integrated program for management of TSWV (Culbreath et
al.,1992b; Culbreath and Srinivasan, 2011; Tillman, 2009).
After Georgia Green, several other runner-type cultivars were released with greater yield
potential and higher levels of field resistance to TSWV. The first cultivar released with a higher
level of field resistance to TSWV than Southern Runner or Georgia Green was C-99R (Gorbet et
al, Wells et al., 2002). Since 2006, several new cultivars have been released with good field
resistance to TSWV and excellent yield potential. Among the most prominent of those are the
new runner-type cultivars assessed in this current study, ‘Georgia-06G’, ‘Georgia-07W’,
‘Florida-07’, and ‘Tifguard’.
Georgia-06G (Branch, 2007) was released in 2006 by the Georgia Agricultural
Experiment Stations. It was developed at The University of Georgia, Coastal Plain Experiment
Station, Tifton GA. This is a high yielding, TSWV resistant cultivar with excellent grade (Total
Sound Mature Kernels - TSMK) potential, large seeded with tan testa color. This cultivar
originated from a cross between Georgia Green (Branch, 1996) x C-99R (Gorbet and Shokes,

9
2002). This cultivar has been adopted by the Georgia peanut growers since its release due to the
yield, grade potential, and kernel quality. Georgia-06G has displaced Georgia Green as the
standard peanut cultivar; in 2011 67.4% of the area planted for seed production in Georgia was
planted to Georgia-06G (Beasley et al., 2011) (Table 1.1).
Georgia-07W (Branch and Brenneman, 2008) was released in 2007 by the Georgia
Agricultural Experiment Station. It was developed at The University of Georgia, Coastal Plain
Experiment Station, Tifton GA. This is a high yielding, large seeded peanut cultivar with
resistance to TSWV and white mold (Sclerotium rolfsii). This cultivar was selected from a cross
between C-99R (Gobert and Shokes, 2002) x Georgia Green (Branch, 1996). This cultivar is
planted in Georgia in locations with high white mold incidence and was planted to 5.6% of the
seed acreage for 2011 (Beasley et al., 2011) (Table 1.1).
Florida-07 (Gorbet and Tillman, 2009) was developed by the University of Florida,
Florida Agricultural Experimental Station, North Florida Research and Education Center,
Marianna FL, and approved for release in 2006. This cultivar has excellent pod yield potential,
competitive kernel grade, high-oleic fatty acid oil chemistry, and resistance to TSWV and white
mold (Sclerotium rolfsii). This cultivar originated in a cross between C-99R with the breeding
line 89xOL4-11-1-1-1b2-B, which had ‘Marc I’ (Gorbet et al., 1992) as a parent. This cultivar is
planted in Georgia and Florida, the planted acreage for seed for 2011 reached 6.6% (Beasley et
al., 2011) (Table 1.1).
Tifguard (Holbrook et al., 2008) was released by the USDA-ARS and the Georgia
Agricultural Experiment Stations in 2007. This cultivar is high yielding and resistant to the
peanut root-knot nematode (Meloidogyne arenaria) and TSWV. Tifguard was developed from a
cross between C-99R and COAN. Tifguard is the first cultivar that has resistance to both
10
pathogens (Holbrook et al., 2008). After its release, Tifguard was found to have moderate
resistance to C. arachidicola and C. personatum (Yan Li, 2012). This cultivar is planted in
Georgia in locations with high incidence of root-knot nematode; the acreage planted for seed in
2010 was 7.4% (Beasley et al., 2011) (Table 1.1).
With the exception of Tifguard, there is no indication of resistance to the leaf spot
pathogens in the cultivars mentioned above; Florida-07, Georgia-06G, and Georgia-07W, are
classified among susceptible cultivars in the current Peanut Rx. Risk assessment index (Kemerait
et al., 2011) . However, yield losses associated with high levels of leaf spot, particularly
significant defoliation, have not been characterized for any of these new cultivars.
Yield loss assessment. Crop loss, or yield loss to disease, is considered to be the
difference between actual yield and the potential for yield obtained in absence of disease
(Madden et al., 2007). Although there are many factors that influence yield loss, including a
wide spectrum of harmful organisms and environmental stress factors, this research is concerned
with the yield in relation to leaf spot epidemics. Sometimes it is necessary to convert yield and
yield-loss values into economic terms and to quantify the effects of diseases in terms of costs
(Madden et al., 2007). In some cases yield losses to a particular disease may not justify the cost
control. The most common way of showing the impact of the epidemic on yield is to plot yield
versus disease intensity at one time during the epidemic. For peanuts the typical time to assess
this situation is at the end of the season (Backman and Crawford, 1984; Nutter and Littrell,
1996). However the most appropriate methods to relate disease severity or host productivity and
yield often are not easily discerned. Often no single method can achieve both satisfactorily. In
addition, plant pathogens and disease development are relevant to considerations of yield

11
response (Gaunt, 1995). Therefore causality and correlation between disease and yield require
careful interpretation.
Backman et al. (1984) assessed the relationship between yield and severity of early and
late leaf spot. In a four-year study of the cultivar Florunner they found that yield was reduced
by an average of 57 kg/ha for each percent increase in defoliation by leaf spot and that all levels
of defoliation resulted in yield loss. No difference in loss producing potential was observed
between C. arachidicola and C. personatum. In that study, disease severity assessment was
made calculating percent defoliation from samples of 10 central stems of the two center rows of
each plot and dividing total leaflets lost by total leaflets (Backman et al 1984). Later, several
studies involved with crop loss assessments lead to use of the duration of healthy area or healthy
leaf area duration (HAD), proposed by Waggoner and Berger (1987), to predict yield of
manually defoliated and leaf spot defoliated peanut (Aquino et al., 1992). In field experiments
with Florunner naturally infected with C. personatum and C. arachidicola, ranges of disease
severity were established by varying levels of fungicide applications. It was found that HAD,
calculated from the integral of healthy leaf area during the season, was correlated positively with
yield and this concept was more closely related to absorption of insolation than to leaf area itself
(Waggoner and Berger, 1987). Later experiments found that HAD has lower power of prediction
for yield with Southern Runner, a leaf spot resistant cultivar, because this cultivar has more leaf
production and lower partitioning of photosynthates to pods compared to Florunner (Aquino et
al. 1992). In the same study and a previous study (Nutter, 1989), canopy reflectance of 800-nm
wavelength measured with a hand-held multispectral radiometer (CROPSCAN, Inc, Fargo, ND)
was used to assess disease severity gradients and provided a rapid and objective measurement of
disease intensity and the amount of green area contributing to pod yield. When remote sensing

12
assessments were compared to visual assessments using the 1 - 10 Florida Scale (Chiteka et al.,
1988) to measure fungicide efficacy for the control of leaf spot (Nutter et al., 1990), percent
reflectance-based measurements had lower coefficients of variation than did visually based
assessments. Higher coefficients of determination (R2) and lower standard errors were obtained
when percent reflectance values were regressed on yield. That report also pointed out that
numerical rating scales do not offer the broad and continuous range of possible scores afforded
by remote sensing. Later, yield loss was assessed using defoliation-based assessments and
percent-reflectance assessments. Results indicated that measurements of healthy green leaf area
(estimated by percent reflectance) had a better relationship with pod yield than did defoliation-
based assessments (Nutter et al., 1996). Percent reflectance measurements explained 81 - 93.8%
of the variation in pod yield, while percent defoliation explained 71.6 - 92.8% of the variation in
pod yield. However, there are some disadvantages to reflectance measurements obtained by the
multispectral radiometer (CROPSCAN). Canopy reflectance may be affected by factors other
than canopy stress such as amount of incident radiation, sun angle, time of the day, leaf wetness,
sensor height, soil reflectance characteristics, soil pH, relative humidity, and others (Guan and
Nutter, 2001).
Remote sensing. The development of new remote sensing devices has increased the last
decade; several new sensors are available for scientific research, for example the optical sensor
Model PhD 600 (Patchen, Ukiah, CA), the GreenSeeker®-505 (NTech Industries Inc., Ukiah,
CA), and the Crop CircleTM
ACS-210 (Holland Scientific, Lincoln, NE). These instruments
remove the effect of ambient and process only the energy emitted by the integrated sources (Bell
et al, 2002). These sensors incorporate its own light source which emits red, near infrared and
visual wavelengths. The light is directed toward a plant canopy and a portion is reflected back to

13
the sensor, plant tissue readily absorbs light in the visible portion of the spectrum (and reflects a
small amount typically 2% to 10%) and reflects NIR light (35% to 60%) due to a discontinuity in
the refractive indexes between cell walls and intercellular air gaps (Anonymous, 2004). These
sensors usually have a data logger and calculate the normalized difference vegetation index
(NDVI). NDVI has been related to absorbed photosynthetically active radiation in wheat
(Triticum aestivum L.; Asrar et al., 1984), has been associated with leaf area index in maize (Zea
mays L.) and soybean [Glycine max (L.) Merr; Daughtry et al., 1992], has been used to measure
drought stress (Fenstermaker-Shaulis et al., 1997), turf chlorophyll content (Howell, 1999), and
turf injury and quality (Trenholm et al., 1999; Bell et al., 2000), and lately to assess detection of
tomato spotted wilt and Cylindcocladium black rot in peanut ( Isaev, 2012).
Stem lesions assessment. In addition to the familiar lesions on the leaves, during severe
epidemics of late leaf spot, C. personatum also produces lesions on the petioles, and lateral and
main stems. The presence of stem lesions, interrupts translocation along laterals, accelerates
maturity, and subsequently kills branch stems (Hemingway, 1954). Culbreath et al. (1991) made
a quantitative comparison of stem lesions in Florunner (Norden et al., 1969) and Southern
Runner (Gorbet et al., 1987) peanut cultivars. For stem lesion assessment 12 lateral branches
were collected from each plot by random selection from each row along the length of the bed.
The length of each stem was measured, and stem lesions were counted. Number of lesions per
dm of stem length was calculated for each stem to take into consideration differences in
internode and stem length between the two cultivars and variation in length among stems within
the two cultivars. Their results show that fewer stem lesions developed on Florunner than on
Southern Runner under similar conditions. Fewer stem lesion formation may help to prevent
weakening of stems and pegs, allowing greater retention of pods at harvest and therefore better

14
yield, in addition fewer stem lesions may decrease initial inoculum for future crops (Culbreath et
al., 1991). Since that report, however, incidence of stem lesions typically has not been
considered in evaluation of peanut cultivars and breeding lines for resistance to C. personatum.
Results from Florunner and Southern Runner indicated that incidence of stem lesions was
reflective of the relative severity of late leaf spot on the leaves (Culbreath et al., 1992). However
it has not been determined whether there are differences in susceptibility to stem lesions within
peanut genotypes that are susceptible to leaf infections.
Genotype leaf spot resistance field assessment. Development of a commercially
acceptable cultivar with a high level of resistance to leaf spot diseases is a common goal for
various breeding programs. However many breeding lines with resistance to leaf spot have
unacceptably poor yields or other undesirable characteristics (Smith et al., 1994). The breeding
efforts are still going on and a resistant peanut cultivar to C. arachidicola and C. personatum is
not available yet. Therefore several studies have been developed to evaluate breeding lines and
its resistance to leaf spot pathogens (Hassan and Beute, 1977; Knauft et al., 1988; Chiteka et al.,
1988; Gorbet et al., 1990; Smith et al., 1994; Holbrook and Anderson, 1995; Gremillion, 2011;
among others). The methodology used to assess genotype resistance to leaf spot may vary, but
resistance in field situations may be the most important because that is the final goal, some plant
introductions were resistant to leaf spot in greenhouse but not in the field (Hassan and Beute,
1977). There are several techniques to assess leaf spot severity in the field: 1) Defoliation ratio is
a technique that measures the lower limbs randomly selected and calculates a ratio of the
distance between the base of the limb and the first leaf (Hassan and Beute, 1977); 2) Lesion
count is a technique that selects random leaves and counts the lesions formed on each leaflet
(Hassan and Beute, 1977; Chiteka et al., 1988); 3) Leaf area infected, estimated using an

15
intensity grade scale with pictorial diagrams developed by Sulaiman and Agashe (1965) (Hassan
and Beute, 1977); 4) Percent necrotic area per leaf, used with a standardized pictorial chart
(Chiteka et al., 1988); 5) Visual estimations, this technique has several variations and has been
changing in time to reach the Florida Scale used by Chiteka (1988) and Kauft et al. (1988) (Table
1.2), since then this scale is widely used to assess disease severity in peanut cultivars (Gorbet et
al., 1990; Smith et al., 1994; Holbrook and Anderson, 1995; Gremillion, 2011).
Research objectives. The overall goal of this work was to provide information on the
relationship between leaf spot severity and yield that will be useful in making decisions
onnecessary management inputs to minimize losses to leaf spot diseases. Specific objectives
included: i) characterization of the relationships among yield, defoliation by leaf spot, peanut
grade, crop value and canopy reflectance for new runner-type peanut cultivars, and ii)
development of a simple model for predicting yield losses to leaf spot based on percent
defoliation at the end of the season. Additional objectives include iii) characterization of the
effects of new runner-type cultivars on incidence of stem lesions caused by C. arachidicola or
C. personatum. It is proposed to relate these responses to the effects of these stem lesions to the
severity of foliar symptoms caused by each pathogens, and iv) evaluation of the field response of
new breeding lines developed as part of a USAID-CRSP project for developing peanut cultivars
with multiple pathogen resistance for use in the U.S. and in developing countries in the western
hemisphere to C. arachidicola and C. personatum.

16
REFERENCES
1. Anonymous, 2004. Crop Circle ASC-210 user’s guide. Holland Scientific, Inc. Lincoln, NE.
2. Anonymous, 2012. Fast facts about peanuts. American Peanut Council. Published online at:
http://peanutsusa.com/MainMenu/About-Peanuts/Fast-Facts.html
3. Aquino, V. M., Shokes, F. M., Berger, R. D., Gorbet, D. W., and Kucharek, T. A. 1992.
Relationships among late leafspot, healthy leaf area duration, canopy reflectance, and pod
yield of peanut. Phytopathology 82:546-552.
4. Asrar, G. M., Kanemasu, E. T., and Hatfield, J. L. 1984. Estimating absorbed photosynthetic
radiation and leaf area index from spectral reflectance in wheat. J. Agron. 76:300-306.
5. Backman, P.A. and Crawford, M.A., 1984. Relationship between yield loss and severity of
early and late leaf spot diseases of peanut. Phytopathology 74: 1101-1103.
6. Beasley, J. P. Jr. , Smith, N.B., Smith, A.R, Boudreau, M., Branch, W.D., Tubbs, R.S.,
Harris, G.H., Prostko, E.P., Kemerait, R.C., Brenneman, T.B., Culbreath, A.K., Adams, D.
2010 Peanut Update. The University of Georgia Extension Peanut Team.
7. Bell, G. E., Martin, D. L., and Kuzmic, R. M. 2000. Herbicide tolerance of two cold-resistant
bermudagrass cultivars determined by both visual assessment and spectral reflectance. Weed
Technol. 14:635-641.
8. Bell, G. E., Martin, D. L., Weise, S. G., Dobson, D. D., Smith, M. W., Stone, M. L., and
Solie, J. B. 2002. Vehicle-mounted optical sensing: an objective means for evaluating turf
quality. Crop. Sci. 42:197-201.
9. Branch, W. D. 2007. Registration of ‘Georgia-06G’ peanut. J. Plant Reg. 1:120.
10. Branch, W. D., Brenneman, T.B. 2008. Registration of ‘Georgia-07W’ peanut. J. Plant Reg.
2:88-91.
11. Branch, W. D. 1996. Registration of ‘Georgia Green’ peanut. Crop Sci. 36:806.
12. Branch, W. D. 2002. Registration of ‘Georgia-01R’ peanut. Crop Sci. 42:1750–1751.
13. Cantonwine, E. G., Culbreath, A. K., and Stevenson, K. L. 2007. Characterization of early
leaf spot suppression by strip tillage in peanut. Phytopathology 97:187-194.
14. Cantonwine, E. G., Culbreath, A. K., Stevenson, K. L., Kemerait, R. C., Jr., Brenneman, T.
B., Smith, N. B., and Mullinex, B. G., Jr. 2006. Integrated disease management of leaf spot
and spotted wilt of peanut. Plant Dis. 90:493-500.

17
15. Chiteka, Z. A., Gorbet, D.W., Shokes, F. M., Kucharek, T. A., and Knauft, D. A. 1988.
Components of resistance to late leaf spot in peanut. I. levels and variability - implications
for selection. Peanut Sci. 15:25-30.
16. Coffelt, T. A., and Simpson, C. E. 1997. Origin of the peanut. Page 2 in: Compendium of
Peanut Diseases, Second Edition, N. Kokalis-Burelle, D. M. Porter, R. Rodríguez-Kábana, D.
H. Smith, and P. Subrahmanyam, eds. American Phytopathological Society, St. Paul
Minnesota.
17. Cox, F. R., Sholar, J. R. 1995. Site selection, land preparation, and management of soil
fertility. Pages 7-10 in: Peanut Health Management. H. A. Melouk and F. M. Shokes,eds.
American Phytopathological Society. St. Paul, Minnesota.
18. Culbreath, A. K., Brenneman, T. B., and Kemerait, R. C., Jr. 2002. Management of early leaf
spot of peanut with pyraclostrobin as affected by rate and spray interval. Online. Plant Health
Progress doi: 10.1094/PHP-2002-1018-01-RS.
19. Culbreath, A. K., and Srinivasan, R. 2011. Epidemiology of spotted wilt disease of peanut
caused by Tomato spotted wilt virus in the southeastern U.S. Virus Res. 155:101-109.
20. Culbreath, A. K., Stevenson, K. L., Brenneman, T. B. 2002. Management of late leaf spot of
peanut with benomyl and chlorothalonil: a study in preserving fungicide utility. Plant Dis.
86:349-355.
21. Culbreath, A. K., Todd, J. W., and Brown, S. L. 2003. Epidemiology and management of
tomato spotted wilt in peanut. Annu. Rev. Phytopathol. 41:53-75.
22. Culbreath, A. K., Minton, N. A., Brenneman, T. B., and Mullinix, B. G. 1992a. Response of
Florunner and Southern Runner peanut cultivars to chemical management of late leaf spot,
southern stem rot, and nematodes. Plant Dis. 76:1199-1203.
23. Culbreath, A. K., Todd, J. W., Demski, J. W., and Chamberlin, J. R. 1992b. Disease progress
of spotted wilt in peanut cultivars Florunner and Southern Runner. Phytopathology 82:766-
771.
24. Culbreath, A. K., Todd, J. W., Gorbet, D. W., Branch, W. D., Sprenkel, R. K., Shokes, F. M.,
and Demski, J. W. 1996. Disease progress of tomato spotted wilt virus in selected peanut
cultivars and advanced breeding lines. Plant Dis. 80:70-73.
25. Daughtry. C. S. T., Gallo, K. P., Goward, S. N., Prince, S. D., and Kustas, W. P. 1992.
Spectral estimates of absorbed radiation and phytomass production in corn and soybean
canopies. Remote Sens. Environ. 39:141-152.
26. Fentesmarker-Shaulis, L. K., Leskys, A., and Devitt, D. A. 1997. Utilization of remotely
sensed data to map and evaluate turfgrass stress associated with drought. J. Turfgrass
Manage. 2:65-81.

18
27. Gaunt, R.E. 1995. The relationship between plant disease severity and yield. Annual rev.
Phytophatol. 33:119-144.
28. Gorbet, D. W., and Shokes, F. M. 2002. Registration of ‘C-99R’ peanut. Crop Sci. 42:2207.
29. Gorbet, D. W., and Tillman, B. L. 2008. Registration of ‘DP-1’ peanut. J. Plant Reg. 2:200-
204.
30. Gorbet, D. W., and Tillman, B. L. 2009. Registration of ‘Florida-07’ peanut. J.Plant Reg.
3:14-18.
31. Gorbet, D. W., Knauft, D. A., and Norden, A. J. 1992. Registration of ‘Marc I’ peanut. Crop.
Sci. 32:279.
32. Gorbet, D. W., Knauft, D. A., and Shokes, F. M. 1990. Response of peanut genotypes with
differential levels of leafspot resistance to fungicide treatment. Crop. Sci. 30:529-533.
33. Gorbet, D. W., Norden, A. J., Shokes, F. M., and Knauft, D. A. 1987. Registration of
‘Southern Runner’ peanut. Crop. Sci. 27:817.
34. Gorbet, D. W., and Shokes, F. M. 2002. Registration of ‘MDR-98’ peanut. Crop. Sci.
42:2207–2208.
35. Gobert, D.W., Tillman, B.L. 2011. Registration of ‘York’ peanut. Plant Reg. 5:289-294.
36. Gremillion, S. K., Culbreath, A. K., Gorbet, D. W., Mullinix, B. G., Jr., Pittman, R. N.,
Stevenson, K. L., Todd, J. W., Escobar, R. E., and Condori, M. M. 2011. Field evaluations of
leaf spot resistance and yield in peanut genotypes in the United States and Bolivia. Plant Dis.
95:263-268.
37. Guan, J., and Nutter, F. W. 2002. Relationships between percentage defoliation, dry weight,
percentage reflectance, leaf-to-stem ratio, and green lead area index in the alfalfa leaf spot
pathosystem. Crop. Sci. 42:1264-1273.
38. Hagan, A.K., Campbell, H.L., Bowen, K.L., Wells, L., and Goodman, R. 2010. Managing
early leaf spot and stem rot with reduced fungicide inputs on disease-resistant peanut
cultivars. Peanut Sci. 37:129-136.
39. Hammons, R. O. 1982. Origin and early history of the peanut. Pages 1-20 in: Peanut Science
and Technology. H.E. Pattee and C. T. Young, eds.). American Peanut Research and
Education Society, Yoakum, Texas.
40. Hassan, H. N., and Beute, M. K. 1977. Evaluation of resistance to Cercospora leaf spot
peanut germplasm potentially useful in a breeding program. Peanut Sci. 4:78-83.
19
41. Hemmingway, J. S. 1954. Cercospora leafspots of groundnuts in Tanganyika. The East
African Agricultural Journal 19:263-271.
42. Henning, R.J., Allison, A. H., and Tripp L.D. 1982. Cultural practices. Pages 123-138 in:
Peanut Science and Technology. H.E. Pattee and C. T. Young,eds. American Peanut
Research and Education Society, Yoakum, Texas.
43. Holbrook, C. C., and Culbreath, A. K., 2008. Registration of ‘Georganic’ peanut. J. Plant
Reg. 2:17.
44. Holbrook, C. C., Timper, P., Culbreath, A. K., Kvien, C. K. 2008. Registration of ‘Tifguard’
peanut. J. Plant Reg. 2:92-94.
45. Holbrook, C.C., and Anderson, W. F. 1995. Evaluation of a core collection to identify
resistance to late leafspot in peanut. Crop Sci. 35:1700-1702.
46. Howell, B. M., 1999. The effectiveness of sensor based technology to determine nitrogen
deficiencies in turfgrasses. M.S. Thesis. Dept. Plant and Soil Science, Oklahoma State
University, Stillwater, OK.
47. Johnson C.S., Phipps, and Beute, M.K. 1985. Cercospora leaf spot management decisions: an
economic analysis of a weather-based strategy for timing fungicide applications. Peanut Sci.
12:82-85.
48. Ketring, D. L., and Reid J. L. 1995. Peanut growth and development. Pages 11-18 in: Peanut
Health Management. H. A. Melouk and F. M. Shokes,eds. American Phytopathological
Society. St. Paul, Minnesota.
49. Knauft, D. A., Gorbet, D. W., and Norden, A. J. 1988. Yield and market quality of seven
peanut genotypes as affected by leafspot disease and harvest date. Peanut Sci. 15:9-13.
50. Li, Y., Chen, C. Y., S.J., K., Culbreath, A. K., Holbrook, C. C., and Guo, B. 2012. Variability
in field response of peanut genotypes from the U.S. and China to Tomato spotted wilt virus
and leaf spots. Peanut Sci. 39:(In Press).
51. Madden, L. V., Hughes, G., van den Bosh, F. 2007. The study of plant disease epidemics.
American Phytopathological Society. St. Paul, Minnesota. (12):353-388.
52. Monfort, W. S., Culbreath, A. K., Stevenson, K. L., Brenneman, T. B., Gorbet, D. W., and
Phatak, S. C. 2004. Effects of reduced tillage, resistant cultivars, and reduced fungicide
inputs on progress of early leaf spot of peanut (Arachis hypogaea). Plant Dis. 88:858-864.
53. Nutter, F. W. 1989. Detection and measurement of plant disease gradients in peanut with a
multispectral radiometer. Phytopathology 79:958-963.

20
54. Nutter, F. W., and Littrell, R. H. 1996. Relationships between defoliation, canopy reflectance
and pod yield in the peanut-late leafspot pathosystem. Crop Prot. 15:135-142.
55. Nutter, F. W., and Shokes, F. M. 1995. Management of foliar diseases caused by fungi. Pages
65-73 in: Peanut Health Management. H. A. Melouk and F. M. Shokes, eds. American
Phytopathological Society. St. Paul, Minnesota.
56. Nutter, F. W., Littrell, R. H., and Brenneman, T. B. 1990. Utilization of a multispectral
radiometer to evaluate fungicide efficacy to control late leaf spot in peanut. Phytopathology
80:102-107.
57. Porter, D. M., and Wright, F. S. 1991. Early leafspot of peanuts: Effect of conservational
tillage practices on disease development. Peanut Sci. 18:76-79.
58. Porter, D. M. 1997a. Introduction. Pages 1-2 in: Compendium of Peanut Diseases, Second
Edition, N. Kokalis-Burelle, D. M. Porter, R. Rodríguez-Kábana, D. H. Smith, and P.
Subrahmanyam, eds. American Phytopathological Society, St. Paul Minnesota.
59. Porter, D. M. 1997b. Peanut diseases. Pages 3-6 in: Compendium of Peanut Diseases,
Second Edition, N. Kokalis-Burelle, D. M. Porter, R. Rodríguez-Kábana, D. H. Smith, and P.
Subrahmanyam, eds. American Phytopathological Society, St. Paul Minnesota.
60. Porter, D. M., Smith, D. H., Rodríguez-Kábana, R. 1982. Peanut plant diseases. Pages 326-
410 in: Peanut Science and Technology. H.E. Pattee and C. T. Young, eds. American Peanut
Research and Education Society, Yoakum, Texas.
61. Rideout, S. L., Brenneman, T. B., Culbreath, A. K., and Langston, D. B., Jr. 2008. Evaluation
of weather-based spray advisories for improved control of peanut stem rot. Plant Dis. 92:392-
400.
62. Shokes, F. M., and Culbreath, A. K. 1997. Early and late leaf spots. Pages 17-20 in:
Compendium of Peanut Diseases, Second Edition, N. Kokalis-Burelle, D. M. Porter, R.
Rodríguez-Kábana, D. H. Smith, and P. Subrahmanyam, eds. American Phytopathological
Society, St. Paul Minnesota.
63. Shokes, F. M., and Melouk, H. A. 1995. Plant health management in peanut production. H.
A. Melouk and F. M. Shokes (Eds.) Peanut Health Management. American
Phytopathological Society. St. Paul, Minnesota. (1):1-6.
64. Simpson, C. E., and Coffelt, T. A. 1997. Taxonomy of the genus Arachis. Pages 2-3 in:
Compendium of Peanut Diseases, Second Edition, N. Kokalis-Burelle, D. M. Porter, R.
Rodríguez-Kábana, D. H. Smith, and P. Subrahmanyam, eds. American Phytopathological
Society, St. Paul Minnesota.
65. Smith, D. H., and Crosby, F. L. 1973. Aerobiology of two peanut leaf spot fungi.
Phytopathology 63:703-707.

21
66. Smith, F. D., Brenneman, T. B., Branch, W. D., Mullinix, B.G. 1994. Evaluation of runner
peanut cultivars and advanced Georgia breeding lines for yield and resistance to late leaf spot
under three disease-management programs. Peanut Sci. 21:48-54.
67. Stevenson, K.L. and A.K. Culbreath. 2006. Evidence for reduced sensitivity to tebuconazole
in leaf spot pathogens. Proc. Amer. Peanut Res. Ed. Soc. 38:62 (Abstr.).
68. Sulaiman, M., and Agashe, N. C. 1965. Influence on climate on the incidence of tikka disease
of groundnut. Indian Oilseeds J. 9:176-179.
1. Tillman, B. L., and Stalker, H. T. 2009. Peanut. Pages 287-315 in: Oil Crops, Handbook of
Plant Breeding Volume 4. Vollmann, J, and Rajcan, I., eds. Springer Science, New York,
NY.
69. United States Department of Agriculture, 2012. Crop production 2011 summary. ISSN:
1057-7823.
70. United States Department of Agriculture, 2012. National statistics for peanut. Published
online at: http://www.nass.usda.gov/Statistics_by_Subject/result.php?C5458216-F5C3-3C99-
8281-B951270C4B42§or=CROPS&group=FIELD%20CROPS&comm=PEANUTS
71. Waggoner, P. E., and Berger, R. D. 1987. Defoliation, disease, and growth. Phytopathology
77:393-398.
72. Wells, M. L., Culbreath, A. K., Todd, J. W., Brown, S. L., and Gorbet, D. W. 2002. A
regression approach for comparing field resistance of peanut cultivars to tomato spotted wilt
tospovirus. Crop Prot. 21:467-474.

22
Table 1.1. Area planted in Georgia in 2010 to produce foundation, registered, and certified seed
for 2011.
Cultivar Hectares % of Area
Georgia-06G 30,551 67.4
Georgia Greener 4,665 10.3
Tifguard 3,332 7.4
Florida-07 3,000 6.6
Goegia-07W 2,555 5.6
Georgia-02C 860 1.9
Georgia-09B 148
AT-215 121
Georgia Green 64
Georgia-10T 1
Total 45,298
Source: Georgia Crop Improvement Association (Beasley et al. 2010)

23
Table 1.2. Florida leaf spot disease rating scale
Rank Description
1 No disease
2 Very few lesions (none on upper canopy)
3 Few lesions (very few on upper canopy)
4 Some lesions with more on upper canopy and slight defoliation noticeable
5 Lesions noticeable even on upper canopy with noticeable defoliation
6 Lesions numerous and very eveident on upper canopy with significant defoliation
(50%+)
7 Lesions numerous un upper canopy with much defoliation (70%+)
8 Upper canopy covered with lesions with high defoliation (90%+)
9 Very few leaves remaining and those covered with lesions (somre plants
completely defoliated)
10 Plants dead
Source: (Chiteka et al., 1988)
24
Fig. 1.1 Cercospora arachidicola (A) and Cercosporidium personatum (B) lesions. Lesions on
the stems (C), lesions on the petioles (D).
D
C
A
B
25
Fig 1.2. Conidiophores of Cercospora arachidicola (A) and conidia (B). Conidia are thin,
elongated, subhyaline, olivaceous, obclavate, and have three to twelve septa (35-110 x 3-6 ųm).
B
A
400X

26
Fig 1.3. Conidiophores of Cercosporidium personatum (A) and conidia (B). Conidia are a little
bit thick, slightly curved, cigar shaped, medium olivaceous, cylindrical, and obclavate, and have
one to nine septa (20-70 x 4-9 ųm).
400X
A
B

27
CHAPTER 2
RELATIONSHIPS AMONG DEFOLIATION CAUSED BY LEAF SPOT, CANOPY
REFLECTANCE, POD YIELD, AND GRADE IN NEW RUNNER-TYPE PEANUT
CULTIVARS1
_______________________
1Navia Gine, P. A., Culbreath, A. K, Tillman, B. A., Kemerait, R. C., Holbrook, C. C., Branch,
W. D., and Smith, N. B. To be submitted to Plant Disease.

28
ABSTRACT
Early and late leaf spot caused by Cercospora arachidicola and Cercosporidium
personatum, respectively, can cause severe losses on susceptible peanut (Arachis hypogaea L.)
cultivars. Losses to leaf spot have been correlated with defoliation late in the season and canopy
reflectance measured in the near-infrared wavelengths. Recently, several new peanut cultivars
have been released with excellent yield potential and field resistance to Tomato spotted wilt
virus. However, the relationships among late-season defoliation, canopy reflectance and yield
have not been characterized for these cultivars. To examine this relationship, field experiments
were conducted in 2010 in Tifton GA, and 2011 in Attapulgus, Plains, and Tifton, GA. In four
experiments, four cultivars, Florida-07, Georgia-06G, Georgia-07W, and Tifguard, were
combined in split-plot arrangement with four fungicide treatments, 7, 4, and 3 applications of
1.26 kg ai/ha of chlorothalonil with initial applications ca. 35 days after planting, and subsequent
applications ca. 14 day intervals. A fifth experiment was conducted on Georgia-06G with the
same fungicide treatments. Applications of 1.12 kg ai/ha of flutolanil were made at ca. 60 and
90 days after planting in each trial to minimize effects of Sclerotium rolsii on yield. Multiple
visual leaf spot ratings were made to estimate the levels of defoliation. On each evaluation date
in 2011, canopy reflectance in the visible and infrared light spectrum was also measured using a
Crop Circle Crop Scanner with an ACS-210 active sensor. Late leaf spot was the predominant
foliar disease in all trials. All of the cultivars evaluated were able to maintain good yields even
with moderate-to-heavy defoliation, with percent yield losses to leaf spot less than previously
reported from late leaf spot on the previous standard cultivar, Florunner. Significant negative
linear relationships were observed between final percent defoliation and yield for Georgia-06G
in all trials except Plains, 2011, for Georgia-07W in two of four trials, and for Florida-07 in one

29
of four trials. There were no significant regressions for percent defoliation and yield for
Tifguard. Percent defoliation was correlated with canopy reflectance in the infrared and visible
bands and with the normalized difference vegetative index calculated from those two
measurements.
Keywords: Cercosporidium personatum, late leaf spot, yield losses,
Late and early leaf spot caused by Cercospora arachidicola S. Hori, and Cercosporidium
personatum (Berk. & M. A. Curtis) Deighton, are among the most destructive diseases of peanut
(Arachis hypogaea L.) in the southeastern United States (Hagan, 1998), causing direct losses in
yield and losses through costs of control. In the southeastern U.S., annual yield losses due to leaf
spot have averaged 5% even with the use of fungicides (W. J. Grichar, 1998), whereas peanut
losses would likely approach 50 % without fungicides (Smith, 1984; Nutter and Shokes, 1995).
These diseases cause defoliation, reduce yield, and increase incidence of certain soil-borne
diseases such as stem rot (Hagan, 1998). Losses are primarily due to loss of peg integrity and
loss of mature pods when peanut plants are inverted (Teare et al., 1984; Knauft et al., 1988).
Losses to both diseases have been correlated with levels of leaf spot induced defoliation late in
the season, often with steep linear declines in yield with increasing defoliation (Shokes et al.,
1982; Backman and Crawford, 1984; Nutter and Littrell, 1996 Aquino et al., 1992).
In fields with severe leaf spot epidemics, growers may dig and invert the crop earlier than
normal in an effort to minimize pod losses to leaf spot. However, digging before optimum
maturity may result in lower grades (percentage of total sound mature kernels or TSMK) (Knauft
et al., 1988) and lower price per kilogram. Therefore, even if maximum yield is preserved with
early digging, the value per hectare for the crop may still be reduced. Knowledge of the
relationship between leaf spot severity and both yield and grade would be useful in making

30
decisions on whether early digging and harvest is the best option in fields with severe leaf spot
epidemics. Knowledge of the relationship between defoliation and yield can be useful in
determining levels of fungicide inputs needed to prevent losses to these diseases. The peanut
disease management decision aid, “Peanut Rx” provides numerical values for the relative risk of
peanut cultivars to losses from leaf spot diseases (Kemerait et al, 2011), and fungicide regimes
are adapted for fields with low, medium and high risk. Values for current cultivars are based
primarily on foliar ratings for leaf spot severity. Characterization of the relationships between
yield and disease severity could help determine whether relative susceptibility classification
based on foliar disease severity is reflective of risk of losses of yield to leaf spot, and help
improve the accuracy of risk classification assignment if it is not.
Earlier investigations addressing the correlation between leaf spot severity (primarily
defoliation) and yield were done with the previous standard runner-type peanut cultivar
‘Florunner’ (Shokes et al., 1982; Backman and Crawford, 1984; Nutter and Littrell, 1996,
Aquino et al., 1992). However, this cultivar is no longer grown commercially in the southeastern
U.S. Recently, several new peanut cultivars have been released with excellent yield potential
and field resistance to Tomato spotted wilt virus. The cultivar ‘Tifguard’ (Holbrook et al., 2008)
has a moderate level of resistance to early and late leaf spot pathogens (Li, et al., 2012; Culbreath
et al., 2009), but new cultivars ‘Georgia-06G’ (Branch, 2007), ‘Florida-07’(Gorbet and Tillman,
2009), and ‘Georgia-07W’ (Branch and Brenneman, 2008) are susceptible to infection by one or
both pathogens (Culbreath et al., 2009). The relationship between late-season levels of
defoliation by leaf spot and yield has not been characterized for these cultivars. In previous
studies (Aquino et al., 1992; Nutter and Littrell, 1996), canopy reflectance in the near infrared
wavelength at 800 nm was correlated with levels of defoliation caused by C. arachidicola, and

31
C.personatum. Those studies were also conducted on Florunner cultivar. Canopy reflectance
relationships with level of defoliation by leaf spot diseases have not been characterized for the
new runner-type cultivars. The objective of this research was to characterize relationships of leaf
spot disease severity measured by percent final defoliation and canopy reflectance with pod
yield, kernel quality, and dollar value/ha for the yields for four new runner-type cultivars.
MATERIALS AND METHODS
Two experiments were conducted in 2010 at the University of Georgia, Coastal Plain
Experimental Station, Lang Farm, Tifton, GA (Trial A and Trial B). In 2011, trials were
conducted at the Coastal Plain Experimental Station, Rigdon Farm, Tifton GA (Trial C), at the
University of Georgia, Attapulgus Research and Educational Center (Trial D), and at the
University of Georgia Southwest Georgia Research and Education Center, Plains, GA, (Trial E).
The soil type in Tifton at both the Lang and Rigdon farms was a Tifton sandy loam (fine sandy,
siliceous thermic Plinthic Paleudult). The soil type at the Attapulgus site was a Norfolk loamy
sand (fine loamy, siliceous thermic Typic Kandiudult), and the soil type at the Plains site was a
Greenville clayey loam (clayey, kaolinitic, thermic Rhodic Kandiudult) (Hodges et al., 1995).
All the fields from both years had a history of moderate-to-heavy infestations of C. arachidicola
and C. personatum in previous years when peanut was grown.
In all experiments, varying numbers of applications of chlorothalonil (Bravo
WeatherStik, Syngenta, Greensboro, N.C.) were used to create a range of levels of leaf spot
intensity. A split-plot experimental design with factorial arrangement of the four cultivars and
four fungicide treatments was used for Trials A, C, D, and E. Whole plot treatments consisted of
four cultivars, Georgia-06G, Georgia-07W, Florida-07, and Tifguard. Four sub-plot treatments
consisted of: a) seven; b) four; and c) three applications of 1.26 kg/ha of chlorothalonil; and d) a

32
non-treated control. A randomized complete block design experiment with the same four
fungicide treatments on one cultivar, Georgia-06G, was used for Trial B. Five, seven, five, four
and six replications were used for Trials A-E, respectively. Plots were 10 m long by 1.8 m wide
with two rows for each plot. Peanuts were planted 26 May 2010 for Trial A, 4 June 2010 for
Trial B, 2 June 2011 for Trial C, 1st June 2011 for Trial D, and 17 May 2011 for Trial E. All
fungicide regimes had an initial application ca. 30 days after planting with subsequent
applications made at ca. 14 day intervals for the duration. All plots were traversed by the tractor-
mounted boom sprayer during each fungicide application so that tractor traffic effects would be
the same for all plots.
At Tifton and Plains, fungicides were applied using a multiple-boom tractor mounted
CO2-propellant sprayer. Each boom was equipped with three Hypro TR80-03 flat fan nozzles
per row. Fungicide was delivered in 187 liters of water/ha at 310 kPa. At Attapulgus, fungicide
treatments were applied using a Lee compressed air mobile sprayer (LeeAgra, Inc., Lubbock,
TX). The sprayer was equipped with one Teejet 8002 EV5 flat fan nozzle per row. Fungicide
was delivered in 140 liters of water/ha at 276 kPa.
All plots were coversprayed two times with 1.12 kg ai/ha of flutolanil (Convoy, Nichino
America Inc., Wilmington, DE), at approximately 60 and 90 days after planting (DAP), for
control of stem rot (white mold) caused by Sclerotium rolfsii to minimize this disease as a
confounding factor for determining leaf spot and yield correlations.
To increase the potential for leaf spot epidemic development, Trial C at Tifton in 2011
was inoculated with leaves infected with C. personatum at approximately 90 DAP. Infected
leaves were dispersed by hand into foliage of plants in the border lines. All plots were irrigated
as needed to maintain favorable conditions to develop leaf spot epidemics.

33
Leaf spot severity was assessed visually using the 1-10 Leaf Spot Florida Scale (1= no
disease, 0% defoliation, and 10=100% defoliation, plants dead (Chiteka et al., 1988). Leaf spot
assessments were made on 76, 103, 117, 128, and 142 DAP in 2010 for Trials A, and B; 111,
116, 124, 134, 139, and 148 DAP for Trial C; 110, 118, 137, and 146 DAP for Trial D; and 115,
137, and 147 DAP for Trial E. Percent defoliation was calculated using the data from the Florida
Scale ratings using the equation developed by Li, et al. 2012:
% Defoliation = 100/(1+e(-(FLSc-6.0672)/0.7975)
)
where FLSc is the Florida scale value.
In 2011, canopy reflectance was also assessed several times at different stages of the
epidemic development during the season for Trials C, D, and E. An active sensor reflectance
meter (Crop Circle model ACS-210, Holland Scientific, Lincoln, NE) which measures canopy
reflectance in the visible (VIS, centered at 650nm) and near infrared (NIR, centered at 880nm)
portions of the light spectrum. A vegetation index, presented as the normalized difference
vegetation index (NDVI), was calculated from the formula:
NDVI = pNIR-pVIS / pNIR+pVIS
Sensor readings were collected in 2011 at 53, 76, 111, 124, 139, and 147 DAP for Trial C
Rigdon farm (Tifton); 56, 77, 110, 118, 137, and 146 DAP for Trial D (Attapulgus); and 57, 77,
115, 137, and 147 DAP for Trial E (Plains). The sensor was carried manually and positioned
directly over the center plot row in the nadir view at a distance of approximately 1.0 m above the
crop canopy. Scans were made of the entire length of both rows of each plot by walking at a
speed of approximately 0.9 m/sec. Sensor readings were recorded 10 times per second, resulting
in an average of approximately 4000 individual sensor readings per plot. The data were saved on
an SD Memory card. The final output of the sensor was a pseudo-reflectance value for both NIR

34
and VIS bands and the calculated NDVI. The means of sensor readings for NIR, VIS, and NDVI
were calculated for each plot.
All plots were dug and inverted at 141, and 145 DAP for the Trials A and B in 2010, and
148 DAP, 146 DAP and 147 DAP for Tifton, Attapulgus, and Plains, respectively in 2011.
Peanut pods were harvested mechanically 7 to 11 days after inverting and pod yields were
determined by weighing harvested pods after they were dried and adjusted to 10% (wt/wt)
moisture.
One 1,000-g sample of harvested pods was collected from each plot for grade
determination. The samples were cleaned, and non-pod materials were weighed. A 500-g
sample of cleaned pods was shelled using commercial shelling equipment. Kernels were
classified as sound, immature, or damaged, and the kernels in each category were weighed. The
percentages of the 500-g sample represented by sound mature, immature and damaged kernels
were determined according to official Federal–State Inspection Service methods. Pod grades
were recorded as percent total sound mature kernels (TSMK). Dollar value/ha was calculated to
evaluate impact of leaf spot severity on crop value. Price was determined for each plot using the
USDA loan value formula derived from the 2010 and 2011 peanut marketing assistance loans
(MAL's) and loan deficiency payments (LDP's), notices published by USDA Farm Service
Agency (USDA - FSA, 2010-2011):
For 2010: P = [(TSMK * $ 5.346) + ( OK * $ 1.543)] - [(FM - 4) * $ 1.1]
For 2011: P = [(TSMK * $ 5.364) + ( OK * $ 1.543)] - [(FM - 4) * $ 1.1]
Price (P) was based on the $390.8/kg loan rate adjusted for grade in 2010 and $390.78/kg for
2011. Other kernels are defined as OK, and foreign material is defined as FM. Discounts on FM

35
and sound splits only occurred when exceeding 4%. There was no deduction for damaged
kernels below 2% of damaged kernels.
The individual plot data collected each year was transferred to a statistical discovery
software (JMP; SAS Institute Inc., Cary NC) and was subjected to analysis of variance to
evaluate treatment effects on leaf spot severity, reflectance measurements, TSMK, yield and crop
value. Data from each location were analyzed independently. Cultivar and fungicide effects
were considered fixed effects and replication was considered a random effect. Fisher’s protected
least significant difference (LSD) values were used for comparison among the individual
treatments and cultivars. Pearson’s correlation coefficients were calculated to examine
correlations between leaf spot severity, reflectance measurements, yield, grade and dollar value
within each cultivar and trial. Regression analysis was conducted for each cultivar in each trial
to examine linear and quadratic models to describe relationships between defoliation and yield,
TSMK, crop value, and in 2011, canopy reflectance.
RESULTS
Late leaf spot was the predominant foliar disease by the end of the season in all trials,
although early leaf spot was present earlier in the season in each trial. Leaf spot epidemics began
relatively late in the season in all trials, and severity varied greatly among trials. Disease
progress curves from non-treated plots planted to Georgia-06G for the different trials (Fig 2.1)
showed that infestations were moderate to heavy on non-treated plots for Trials A and B at
Tifton in 2010, Trial C at Tifton in 2011 and for Trial D at Attapulgus in 2011. However
infestation was light in Trial E at Plains in 2011. Epidemics began earlier in 2010 than in 2011.
In 2011, leaf spot was evident by approximately 100 DAP. In all trials except Trial E, plants in

36
non-treated plots of one or more cultivar were moderately to heavily defoliated at harvest time.
The fungicide treatments allowed development of a range of leaf spot disease intensities.
For Trial A (Tifton - 2010) fungicide effects on final leaf spot severity were significant,
but there was no significant effect of cultivar or cultivar x fungicide treatment effects. In Trial B
(Tifton - 2010) there was a significant treatment effect. In Trial C (Tifton - 2011) cultivar,
fungicide treatment and cultivar x treatment effects were significant for leaf spot severity.
Within non-treated plots, Georgia-06G (defoliation = 92%; LSD = 17.3) had the highest disease
severity, and Tifguard had the lowest (defoliation = 28%; LSD = 17.3). In Trial D (Attapulgus -
2011) cultivar, fungicide treatment, and cultivars x fungicide treatment effects were significant
for final leaf spot severity. Within non-treated plots, leaf spot severity was higher for Georgia-
06G and Georgia-07W than other cultivars (defoliation = 90%, 86%; LSD = 21.7), and lowest in
Tifguard (defoliation = 45%; LSD = 21.7). In Trial E (Plains-2011) there were significant
cultivar and treatment effects on final leaf spot severity, but cultivar x fungicide treatment
interaction effects were not significant. Across fungicide treatments the lowest final leaf spot
severity was given by the seven-spray treatment (defoliation = 0.5%; LSD = 4.7) and the highest
among treatments was in the non-sprayed control (defoliation = 21%; LSD = 4.7).
In Trial C (Tifton – 2011), cultivar and fungicide treatment effects were significant for
NDVI, but not for cultivar x fungicide interaction. Within plots that received seven fungicide
applications, NDVI values were 0.745, 0.729, 0.772, and 0.784 (LSD = 0.045), for Florida-07,
Georgia-06G, Georgia-07W, and Tifguard, respectively. In Trial D (Attapulgus - 2011) cultivar
and fungicide treatment main effects and interaction effects were significant for NDVI. Within
plots that received seven fungicide applications, NDVI levels were 0.776, 0.784, 0.799, and
0.801 (LSD = 0.062) for Florida-07, Georgia-06G, Georgia-07W, and Tifguard, respectively. In

37
Trial E (Plains - 2011) cultivar and fungicide treatment effects on NDVI were significant, but
interaction effects were not. Within plots that received seven fungicide applications, NDVI levels
were 0.708, 0.73, 0.75, and 0.726 (LSD = 0.026) for Florida-07, Georgia-06G, Georgia-07W,
and Tifguard, respectively.
Treatment main effects and interaction effects, where applicable, were also analyzed for
TSMK, yield, and crop value. However, since the emphasis of this study was to relate each of
these to defoliation by leaf spot and canopy reflectance measurements, specific treatment effects
are not presented.
Coefficients for correlations among percent defoliation, yield, TSMK, and crop value for
each cultivar in both trials in 2010 are shown in Table 2.1. Percent defoliation was negatively
correlated with yield and crop value in Georgia-06G in both trials in 2010 (Table 2.1), but not for
other cultivars in Trial A. Yield and crop value decreased linearly with increasing percent
defoliation for Georgia-06G in both trials (Figs. 2.2 and 2.3), but there was no relationship in the
other cultivars. There was no relationship between TSMK and defoliation for any cultivar in
2010 (Table 2.1).
Coefficients for correlations among percent defoliation NDVI, NIR, VIS, yield, TSMK
and crop value for each cultivar in Trial C (Tifton, 2011) are shown in Table 2.2. In that trial,
percent defoliation by leaf spot was correlated with yield for all cultivars except Tifguard, and
was correlated with crop value for Florida-07 and Georgia-06G (P < 0.05) (Table 2.2). NDVI
was more closely correlated with percent defoliation than was either NIR or VIS measurements.
NDVI was correlated with percent defoliation for all cultivars (Table 2.2). NDVI was correlated
with yield and crop value for Florida-07 and Georgia-06G. Yield and crop value decreased

38
linearly with increasing levels of defoliation for Georgia-06G and Georgia-07W (Fig. 2.4 A and
B). NDVI decreased linearly with increasing levels of defoliation for all cultivars (Fig. 2.4-C)
For Trial D (Attapulgus, 2011), correlations among NDVI, NIR, VIS, yield, TSMK and
crop value for each are shown in Table 2.3. In that trial, percent defoliation was correlated with
yield and crop value for Georgia-06G and Georgia-07W but the correlations were not significant
for Florida-07 and Tifguard (P > 0.05)(Table 2.3). For this trial NDVI was more closely
correlated with percent defoliation than to NIR, and was not correlated with VIS (P > 0.05).
NDVI was correlated with yield for Florida-07 and Georgia-06G. Yield and crop value decreased
linearly with increasing levels of defoliation for Georgia-06G and Georgia-07W (P < 0.05) (Fig.
2.5). NDVI decreased linearly with increasing levels of defoliation for all cultivars (Fig. 2.5).
For Trial E (Plains, 2011) correlations among the seven variables for each cultivar are
shown in Table 2.4, There was no significant correlation between percent defoliation and yield
or crop value for any cultivar (Table 2.4). NIR was negatively correlated with yield and crop
value for Georgia-07W (Table 2.4). NDVI was negatively correlated with percent defoliation in
Georgia-07W and Tifguard (Table 2.4). Plots of yield vs. defoliation for all cultivars are shown
in Fig. 2.6. There were no significant relationships between defoliation and yield or NDVI for
any cultivar. In Georgia-07W and Tifguard, NDVI decreased linearly with increasing percent
defoliation (Fig. 2.6-B).
Yield decreased linearly with increasing NDVI values for Florida-07 and Georgia-06G at
Tifton Trial C (Fig. 2.7-A), and for all cultivars except Tifguard at Attapulgus Trial D (Fig. 2.7-
B). There was no significant relationship between yield and NDVI for any cultivar at Plains
Trial E (Fig. 2.7-C).

39
When assessing yield loss the coefficients of determination relating final percent
defoliation to pod yield for Trial C (Tifton) were 25% for Florida-07, 29% for Georgia-06G, and
26% for Georgia-07W. In the same trial the coefficients of determination relating NDVI to pod
yield were 20% for Florida-07, 56% for Georgia-06G, and 17% for Georgia-07W. None of these
relationships are significant for Tifguard (P > 0.05). For Trial D in Attapulgus the coefficients of
determination accounting the relationship between final percent defoliation and pod yield were
22% for Florida-07 (P = 0.07), 56% for Georgia-06G, and 17% for Georgia-07W. For the same
trial the coefficients of determination relating NDVI to pod yield were 31% for Florida-07, 70%
for Georgia-06G, and 38% for Georgia-07W. None of these correlations were significant for
Tifguard. For Trial E at Plains neither of the relationships between defoliation to pod yield or
NDVI to pod yield were significant.
DISCUSSION
Results from this study indicate that there is a reduction in yield and crop value with
increasing defoliation observed in one or more trials for all new runner-type cultivars except
Tifguard. Georgia-06G had a linear reduction in yield and crop value with increasing defoliation
in all trials except Plains in 2011. Results from Tifton and Attapulgus trials in 2011 corroborated
previous reports that Tifguard cultivar has a moderate level of resistance to leaf spot (Li, et al.,
2012, Kemerait et al., 2011), and indicate that Tifguard is also less prone to reduction in yield by
leaf spot. However, since the ranges of defoliation levels in Tifguard were considerably
narrower, it cannot be concluded that higher levels of defoliation would not result in similar
losses to leaf spot. There were no consistent differences in leaf spot severity among the other
three cultivars.

40
Backman and Crawford (1984), and Nutter and Littrell (1996) found that all levels of
defoliation resulted in reductions of yield for Florunner cultivar. Slopes of their regression lines
ranged from 40-79 kg/ha, and 24-98 kg/ha of yield loss for each point of percent defoliation in
each respective study. However, there was no indication of such a rapid decrease in yield with
increasing defoliation in this study. The greatest rate of decrease in yield observed among the
new runner-type cultivars was 14 kg/ha per each point of percent of defoliation. Regressions of
yield on final defoliation were significant for Georgia-06G in four of five trials, but in only two
of four trials for Georgia-07W and one of four trials for Florida-07. There was no significant
regression of yield or crop value on defoliation for Tifguard for any of the four trials in which it
was included. In the previous studies, steepness of the slope relating defoliation or reflectance
measurements to pod yield was greater when yield potential, as indicated by regression intercept
values was greater (Backman and Crawford, 1984; Nutter and Littrell, 1996). In this study,
based on intercept estimates from regression analysis, yield potential was higher than reported
previously in the studies with Florunner and Southern Runner (Backman and Crawford, 1984;
Nutter and Littrell, 1996), and there was no indication that relationship between yield and
defoliation was related to yield potential.
Results from these experiments indicate that canopy reflectance measurements can
provide useful assessments of relative levels of defoliation, that relate to yield as well as do
visual assessments of defoliation. Canopy reflectance assessments are more objective, and
should be less prone to inter-rater variability than visual assessments. Our results corroborated
previous reports by Nutter and Littrell (1996), and Aquino and Shokes (1992) that canopy
reflectance was correlated with levels of defoliation caused by leaf spot. In both of those
previous reports, NIR correlated with defoliation by leaf spot. However with our system, the
41
NDVI correlated more strongly with visual estimates of percentage defoliation than the NIR or
the VIS reflectance. A mobile active scan sensor was used in this study, whereas a passive
stationary sensor was used in previous studies (Nutter, 1989; Nutter et al., 1990; Aquino et al.,
1992; Nutter and Littrell, 1996). The active mobile sensor reads continuous data of the entire
plot, in contrast to the passive sensor used and takes stationary sample readings from two inner
rows of each plot (Aquino et al., 1992). The hand-held multispectral radiometer (CROPSCAN,
Inc, Fargo, ND) used in previous studies takes reflectance measurements with the use of the sun
light, so it is may be affected by cloud cover and the angle of light related to the plane of view
(Nutter, 1989). The radiometer used in this study emits its own infrared and visual light so it
measurements should be less affected by the angle or intensity of sunlight. There was no
indication that NDVI could be used to differentiate among levels of leaf spot in which little or no
defoliation has occurred. There were indications of differences in NDVI among cultivars in
plots with little leaf spot. Aquino et al. (1992) also reported differences in reflectance between
Southern Runner and Florunner cultivars in treated plots that were not attributable to defoliation.
Such differences would have to be considered in any case when leaf spot severity is assessed
using NDVI in multiple cultivars.
Stem rot incidence was very low in all trials in this study, presumably due at least in part
to applications of flutolanil. Flutolanil has excellent activity against S. rolfsii, and no effect on
leaf spot (Culbreath et al.,1992). Options for control of S. rolfsii were limited at the time of
previous studies addressing relationships between leaf spot and yield. Stem rot and interactions
of that disease with leaf spot on yield was not discussed in any of those studies (Backman and
Crawford, 1984; Nutter and Littrell, 1996). Control of stem rot permitted analysis focused on
42
leaf spot only. Characterization of interactions of stem rot and leaf spot severity and their effects
on yield are also needed for these cultivars.
Results from this study corroborate previous reports that %TSMK is lower for Florida-07
than most other cultivars (Tubbs et al, 2011). However, there were no significant fungicide
treatment effects on %TSMK, and there were no significant correlations or regression functions
for the relationship between %TSMK and percent defoliation. This differs from findings of
Hammond et al. (1974) who reported lower %TSMK values from plots of cultivar Florunner
treated with fungicides than from non-treated plots with severe leaf spot epidemics. They
hypothesized that fungicides, including chlorothalonil, applied had negative effects on TSMK. In
this study, there was no indication of correlation between pod grade and percent defoliation, or
since chlorothalonil was used to create the range of defoliation by leaf spot, no indication that the
fungicide affected %TSMK in the cultivars used. This would indicate that decisions made
regarding leaf spot control could be focused on effects on yield, without having to consider
whether grade is being affected.
Although none of the cultivars evaluated in this study have high levels of resistance to
either leaf spot pathogen, yield reductions with increasing defoliation observed were small
compared to those previously reported for Florunner (Backman and Crawford, 1984; Nutter and
Littrell, 1996 Aquino et al., 1992). Onsets of the epidemics in this study were relatively late in
all experiments, so how yields of these cultivars would be maintained in situations with
defoliation incurred earlier is not known. However, results from this study indicate that high
levels of defoliation by late leaf spot do not necessarily result in high levels of yield loss in these
cultivars.

43
REFERENCES
1. Anonymous., 2004. Crop circle ACS-210 user’s guide. Holland Scientific Inc. Lincoln, NE.
2. Aquino, V.M., Shokes, F.M., Berger, R.D., Gorbet, D.W., and Kucharek, T.A. 1992.
Relationships among late leafspot, healthy leaf area duration, canopy reflectance, and pod
yield of peanut. Phytopathology 82:546-552.
3. Backman, P.A. and Crawford, M.A.1984. Relationship between yield loss and severity of
early and late leaf spot diseases of peanut. Phytopathology 74: 1101-1103.
4. Branch W. D. 2007. Registration of 'Georgia-06G' peanut. J. Plant Reg. 1:120.
5. Branch W. D. and Brenneman, T. B. 2008. Registration of 'Georgia-07W' peanut. J. Plant
Reg. 2:88-91.
6. Cantonwine E. G. 2005. The use of Genetics and Cultural Practices to Suppress Foliar
Diseases of Peanut and Reduce Fungicide Requirements. PhD thesis work, The University of
Georgia. Athens, GA.
7. Cantonwine, E. G., Culbreath, A. K., Stevenson, K. L., Kemerait, R. C., Jr., Brenneman, T.
B., Smith, N.B., and Mullinix B.G. Jr. 2006. Integrated disease management of leaf and
spotted wilt of peanut. Plant Dis. 90:493-500.
8. Culbreath, A., Beasley, J., Kemerait, B., Prostko, E., Brenneman, T., Smith, N., Tubbs, S.,
Paz, J., Olatinwo, R., Tillman, B., Gorbet, D., Weeks, R., and Hagan, A. 2009. Peanut Rx:
Minimizing diseases of peanut in the southeastern United States, the 2009 version of the
peanut disease risk index. Pages 36-51 in: 2009 Peanut Update. E. Prostko, ed. University of
Georgia Cooperative Extension Service, Athens, GA.
9. Culbreath, A. K., Brenneman, T. B., and Kemerait, R. C., Jr. 2001. Applications of mixtures
of copper fungicides and chlorothalonil for management of peanut leaf spot diseases. Online.
Plant Health Progress doi: 10.1094/PHP-2001-1116-01-RS.
10. Culbreath, A. K., Todd, J. W., and Brown, S. L. 2003. Epidemiology and management of
tomato spotted wilt in peanut. Annu. Rev. Phytopathol. 41:53-75.
11. Culbreath, A.K.,Brenneman, T.B. and Shokes, F.M.. 1991. Quantitative comparison of stem
lesions caused by Cercosporidium personatum in Florunner and Southern Runner peanut
cultivars. Peanut Sci. 18:116-121.
12. Culbreath, A.K., Minton, N.A., Brenneman, T.B., and Mullinix, B.G. 1992. Response of
Florunner and Southern Runner peanut cultivars to chemical management of late leaf spot,
southern stem rot, and nematodes. Plant Dis. 76: 1199-1202.

44
13. Gorbet, D. W., and Tillman, B.L. 2009. Registration of 'Florida-07' peanut. J. Plant Reg.
3:14-18.
14. Grichar, W., Besler, J. Grichar, B. A. Besler, and Jaks, A. J. Jaks. 1998. Peanut (Arachis
hypogaea L.) cultivar response to leaf spot disease development under four disease
management programs. Peanut Sci. 25:33-39.
15. Guan, J. and Nutter, Jr. F.W. 2002. Relationship between percentage defoliation, dry weight,
percentage reflectance, leaf-to-stem ratio, and green lead area index in the alfalfa leaf spot
pathosystem. Crop. Sci. 42:1264-1273.
16. Kemerait, R., Culbreath, A., Beasley, J., Prostko, E., Brenneman, T., Smith, N., Tubbs, S.,
Olatinwo, R., Srinivasan, R., Boudreau, M., Tillman, B., Rowland, D., N., D., Hagan, A., and
Faircloth, W. 2011. Peanut Rx: Minimizing diseases of peanut in the southeastern United
States. Pages 100-116 in: 2011 Peanut Update. J. P. Beasley, ed. University of Georgia
Cooperative Extension Publication CSS-11-0110, Athens, GA.
17. Knauft D. A., Gorbet, D. W., and Norden, A. J. 1988. Yield and market quality of seven
peanut genotypes as affected by leafspot disease and harvest date. Peanut Sci. 15:9-13.
18. Hammond, J. M., Backman, P. A., and Lyle, J. A. 1976. Peanut foliar fungicides:
Relationships between leafspot control and kernel quality. Peanut Sci. 3:70-72.
19. Hassan, H. N. and Beute, M.K. 1977. Evaluation of resistance to Cercospora leaf spot in
peanut germplasm potentially useful in a breeding program. Peanut Sci. 4:78-81.
20. Holbrook, C.C., Timper, P., Culbreath, A.K., Kvien, C.K. 2008. Registration of 'Tifguard'
peanut. J. Plant Reg. 2:92-94.
21. Li, Y., Chen, C. Y., S.J., K., Culbreath, A. K., Holbrook, C. C., and Guo, B. 2012. Variability
in field response of peanut genotypes from the U.S. and China to Tomato spotted wilt virus
and leaf spots. Peanut Sci. 39: (In Press).
22. Nutter, F. W. 1989. Detection and measurement of plant disease gradients in peanut with a
multispectral radiometer. Phytopathology 79:958-963.
23. Nutter, F. W, Littrell, R. H., and Brenneman, T. B. 1990. Utilization of a multispectral
radiometer to evaluate fungicide efficacy to control late leaf spot in peanut. Phytopathology.
80:102-108.
24. Nutter, F.W. and Littrell, R.H. 1996. Relationships between defoliation, canopy reflectance
and pod yield in the peanut-late leaf spot pathosystem. Crop Prot. 2:135-142.
25. Nutter, Jr., F.W., and Shokes, F.M. 1995. Management of foliar diseases caused by fungi.
Pages 65-72 in: Peanut Health Management. H. A. Melouk and F. M. Shokes, eds. American
Phytopathological Society Press, St. Paul, MN.

45
26. Shokes, F. M., and Gobert, D. W. 1990. Comparing field performance of leaf spot-resistant
breeding lines. Soil Crop Sci. Soc. Fla. Proc. 49:180-184.
27. Smith, D. H. and Littrell, R. H. 1980. Management of peanut foliar diseases with fungicides,
Plant Dis. 64:356-361.
28. Tubbs, R. S., Beasley, J. P., Culbreath, A. K., Kemerait, R. C., Smith, N. B., and Smith, A.
R. 2011. Row pattern and seeding rate effects on agronomic, disease, and economic factors in
large-seeded runner peanut. Peanut Sci. 38:93-100.
29. Teare, I. D., Shokes, F. M., Gorbet, D. W., and Littrell, R. H. Peanut growth responses to
different levels of leafspot. Agronomy J. 76:103-106.
30. U.S.D.A., Farm Service Agency 2010. Processing 2010 crop year (CY) peanut MAL and
LDP using APSS county Release No. 696. Notice PS-670.
31. U.S.D.A., Farm Service Agency 2011. Processing 2011 crop year (CY) peanut MAL and
LDP using APSS county Release No. 715. Notice PS-689.
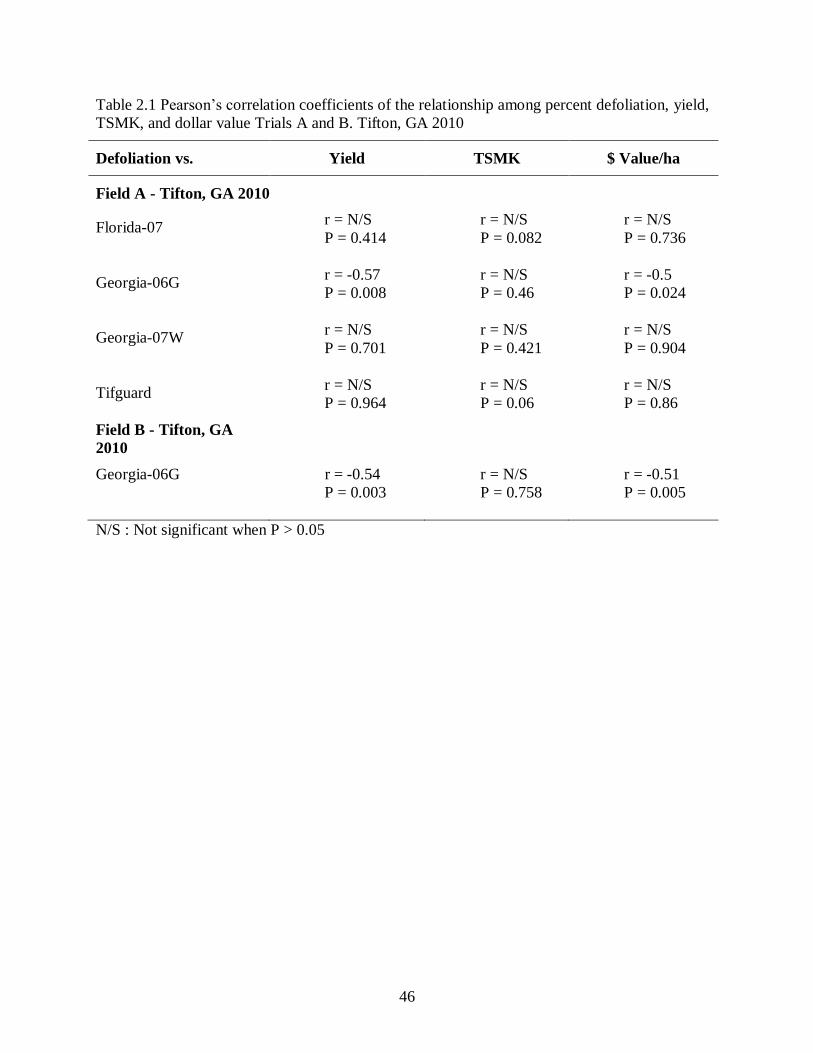
46
Table 2.1 Pearson’s correlation coefficients of the relationship among percent defoliation, yield,
TSMK, and dollar value Trials A and B. Tifton, GA 2010
Defoliation vs. Yield TSMK $ Value/ha
Field A - Tifton, GA 2010
Florida-07 r = N/S
P = 0.414
r = N/S
P = 0.082
r = N/S
P = 0.736
Georgia-06G r = -0.57
P = 0.008
r = N/S
P = 0.46
r = -0.5
P = 0.024
Georgia-07W r = N/S
P = 0.701
r = N/S
P = 0.421
r = N/S
P = 0.904
Tifguard r = N/S
P = 0.964
r = N/S
P = 0.06
r = N/S
P = 0.86
Field B - Tifton, GA
2010
Georgia-06G r = -0.54
P = 0.003
r = N/S
P = 0.758
r = -0.51
P = 0.005
N/S : Not significant when P > 0.05

47
Table 2.2 Pearson’s correlation coefficients of relationship among percent defoliation, NDVI, NIR, VIS, yield, TSMK, and dollar
value. Trial C Tifton, GA 2011.
NDVI NIR VIS Yield TSMK Value
Florida-07
Percent defoliation r = -0.86
P < 0.0001
r =- 0.78
P < 0.0001
r = N/S
P = 0.623
r = -0.5
P = 0.025
r = N/S
P = 0.294
r = -0.45
P = 0.047
NDVI r = 0.89
P < 0.0001
r = N/S
P = 0.361
r = 0.44
P = 0.049
r = N/S
P = 0.608
r = N/S
P = 0.057
NIR r = N/S
P = 0.399
r = N/S
P = 0.122
r = N/S
P = 0.854
r = N/S
P = 0.112
VIS r = N/S
P = 0.6188
r = N/S
P = 0.901
r = N/S
P = 0.616
Georgia-06G
Percent defoliation r = -0.84
P < 0.001
r = -0.6
P = 0.005
r = N/S
P = 0.278
r = -0.53
P = 0.014
r = N/S
P = 0.332
r = -0.48
P = 0.03
NDVI r = 0.63
P = 0.003
r = N/S
P = 0.055
r = 0.75
P = 0.0002
r = N/S
P = 0.306
r = 0.69
P = 0.0008
NIR r = N/S
P = 0.0732
r = N/S
P = 0.094
r = N/S
P = 0.949
r = N/S
P = 0.083
VIS r = N/S
P = 0.095
r = N/S
P = 0.271
r = N/S
P = 0.196

48
…Cont. Table 2.2
NDVI NIR VIS Yield TSMK Value
Georgia-07W
Percent defoliation r = -0.86
P < 0.0001
r = -0.61
P = 0.004
r = -0.6
P = 0.004
r = -0.50
P = 0.0231
r = N/S
P = 0.223
r = N/S
P = 0.06
NDVI r = 0.87
P <0.0001
r = 0.46
P = 0.042
r = N/S
P = 0.068
r = N/S
P = 0.185
r = N/S
P = 0.151
NIR r = N/S
P = 1
r = N/S
P = 0.535
r = 0.52
P = 0.018
r= N/S
P = 0.871
VIS r = N/S
P = 0.0523
r = N/S
P = 0.138
r= 0.48
P = 0.032
Tifguard
Percent defoliation r = -0.73
P = 0.0003
r = -0.52
P = 0.019
r = N/S
P = 0.72
r = N/S
P = 0.868
r = N/S
P = 0.782
r = N/S
P = 0.87
NDVI r = 0.61
P = 0.0042
r = N/S
P = 0.26
r = N/S
P = 0.172
r = N/S
P = 0.627
r = N/S
P = 0.20
NIR R2 = 0.59
P = 0.0061
R2 = N/S
P = 0.067
R2 = N/S
P = 0.836
R2 = N/S
P = 0.077
VIS R2 = N/S
P = 0.50
R2 = N/S
P = 0.796
R2 = N/S
P = 0.487
N/S : Not significant when P > 0.05

49
Table 2.3 Pearson’s correlation coefficients of relationship among percent defoliation, NDVI, NIR, VIS, yield, TSMK, and dollar
value. Trial D Attapulgus, GA, 2011.
NDVI NIR VIS Yield TSMK Value
Florida-07
Percent defoliation r = -0.95
P < 0.0001
r = -0.88
P < 0.0001
r = N/S
P = 0.151
r = N/S
P = 0.067
r = N/S
P = 0.131
r = N/S
P = 0.123
NDVI r = 0.87
P < 0.0001
r = 0.51
P = 0.043
r = 0.75
P = 0.024
r = N/S
P = 0.339
r = 0.51
P = 0.041
NIR r = N/S
P = 0.822
r = 0.59
P = 0.017
r = N/S
P = 0.495
r = 0.56
P = 0.025
VIS r = N/S
P = 0.385
r = N/S
P = 0.928
r = N/S
P = 0.413
Georgia-06G
Percent defoliation r = -0.96
P < 0.0001
r = -0.88
P < 0.0001
r = N/S
P = 0.215
r = -0.77
P = 0.0005
r = N/S
P = 0.747
r = -0.74
P = 0.0009
NDVI r = 0.93
P < 0.0001
r = N/S
P = 0.222
r = 0.84
P < 0.0001
r = N/S
P = 0.979
r = 0.82
P = 0.0001
NIR r = N/S
P = 0.949
r = 0.85
P < 0.0001
r = N/S
P = 0.872
r = 0.83
P < 0.0001
VIS r = N/S
P = 0.81
r = N/S
P = 0.543
r = N/S
P = 0.773

50
…Cont. Table 2.3
NDVI NIR VIS Yield TSMK Value
Georgia-07W
Percent defoliation r = -0.84
P < 0.0001
r = -0.92
P = 0.004
r = -0.67
P = 0.004
r = -0.83
P = 0.003
r = N/S
P = 0.672
r = -0.68
P = 0.003
NDVI r = 0.94
P <0.0001
r = 0.83
P = 0.002
r = 0.79
P = 0.01
r = N/S
P = 0.847
r = 0.78
P = 0.011
NIR r = N/S
P = 0.058
r = 0.81
P = 0.006
r = N/S
P = 0.825
r = 0.79
P = 0.008
VIS r = N/S
P = 0.206
r = N/S
P = 0.705
r = N/S
P = 0.205
Tifguard
Percent defoliation r = -0.92
P < 0.0001
r = -0.68
P = 0.069
r = N/S
P = 0.498
r = N/S
P = 0.377
r = N/S
P = 0.115
r = N/S
P = 0.506
NDVI r = N/S
P <0.361
r = 0.71
P = 0.045
r = N/S
P = 0.712
r = N/S
P = 0.144
r = N/S
P = 0.86
NIR r = 0.84
P = 0.002
r = N/S
P = 0.995
r = N/S
P = 0.632
r = N/S
P = 0.968
VIS r = N/S
P = 0.77
r = N/S
P = 0.609
r = N/S
P = 0.835
N/S : Not significant when P > 0.05
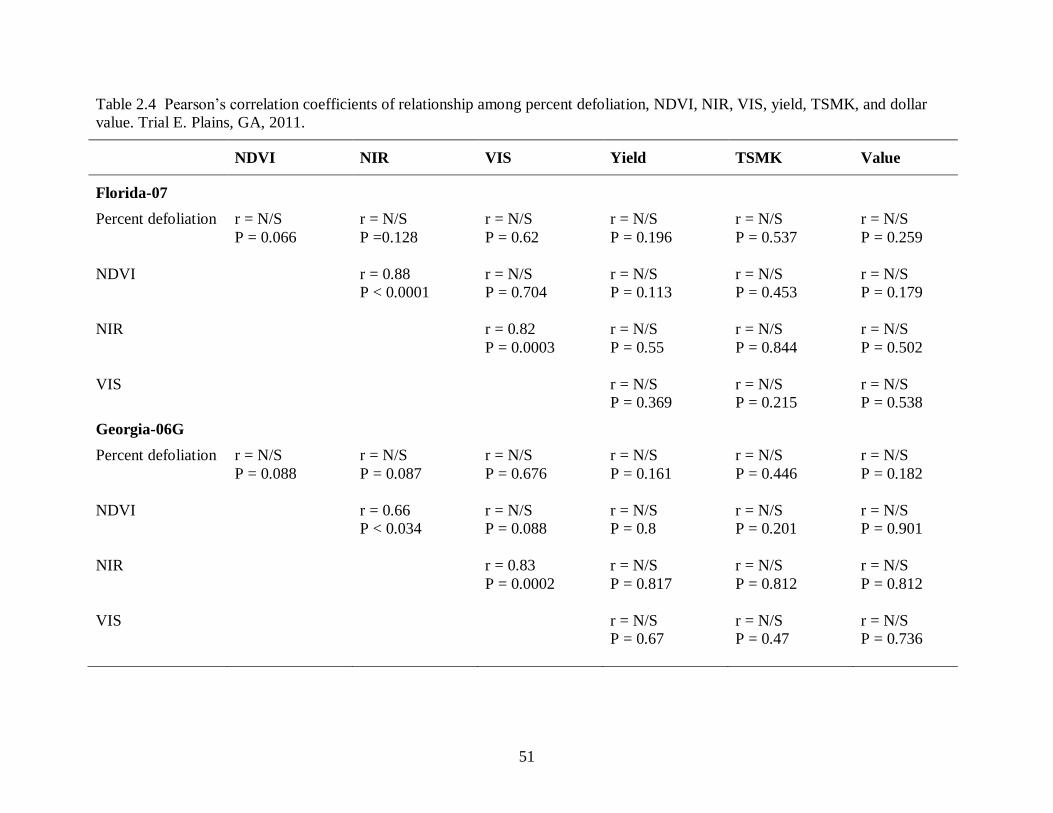
51
Table 2.4 Pearson’s correlation coefficients of relationship among percent defoliation, NDVI, NIR, VIS, yield, TSMK, and dollar
value. Trial E. Plains, GA, 2011.
NDVI NIR VIS Yield TSMK Value
Florida-07
Percent defoliation r = N/S
P = 0.066
r = N/S
P =0.128
r = N/S
P = 0.62
r = N/S
P = 0.196
r = N/S
P = 0.537
r = N/S
P = 0.259
NDVI r = 0.88
P < 0.0001
r = N/S
P = 0.704
r = N/S
P = 0.113
r = N/S
P = 0.453
r = N/S
P = 0.179
NIR r = 0.82
P = 0.0003
r = N/S
P = 0.55
r = N/S
P = 0.844
r = N/S
P = 0.502
VIS r = N/S
P = 0.369
r = N/S
P = 0.215
r = N/S
P = 0.538
Georgia-06G
Percent defoliation r = N/S
P = 0.088
r = N/S
P = 0.087
r = N/S
P = 0.676
r = N/S
P = 0.161
r = N/S
P = 0.446
r = N/S
P = 0.182
NDVI r = 0.66
P < 0.034
r = N/S
P = 0.088
r = N/S
P = 0.8
r = N/S
P = 0.201
r = N/S
P = 0.901
NIR r = 0.83
P = 0.0002
r = N/S
P = 0.817
r = N/S
P = 0.812
r = N/S
P = 0.812
VIS r = N/S
P = 0.67
r = N/S
P = 0.47
r = N/S
P = 0.736

52
…Cont. Table 2.4
NDVI NIR VIS Yield TSMK Value
Georgia-07W
Percent defoliation r = -0.83
P = 0.0002
r = N/S
P = 0.082
r = N/S
P = 0.187
R2 = N/S
P = 0.463
r = N/S
P = 0.402
r = N/S
P = 0.371
NDVI r = 0.66
P = 0.033
r = 0.7
P = 0.015
r = N/S
P = 0.38
r = N/S
P = 0.865
r = N/S
P = 0.378
NIR r = 0.75
P = 0.003
r = 0.73
P = 0.007
r = N/S
P = 0.533
r = 0.74
P = 0.006
VIS r = N/S
P = 0.108
r = N/S
P = 0.702
r = N/S
P = 0.099
Tifguard
Percent defoliation r = -0.73
P = 0.008
r = N/S
P = 0.457
r = N/S
P = 0.587
r = N/S
P = 0.172
r = N/S
P = 0.87
r = N/S
P = 0.191
NDVI r = 0.79
P = 0.001
r = N/S
P = 0.448
r = N/S
P = 0.092
r = N/S
P = 0.707
r = N/S
P = 0.142
NIR r = 0.93
P < 0.0001
r = N/S
P = 0.275
r = N/S
P = 0.671
r = N/S
P = 0.276
VIS r = N/S
P = 0.616
r = N/S
P = 0.436
r = N/S
P = 0.537
N/S : Not significant when P > 0.05

53
Fig. 2.1 Disease progress curves for defoliation caused by late leaf spot (Cercosporidium
personatum) in the non-treated plots of the cultivar Georgia-06G in 2010 and 2011 at Tifton, GA
(Trials A, and C), Attapulgus, GA (Trial D), and Plains, GA (Trial E) in 2011.

54
A
0 10 20 30 40 50 60 70 80 90 100
Yie
ld (
kg/h
a)
0
1000
2000
3000
4000
5000
6000
7000
8000
FL-07 kg/ha = 6326 (124) No significant response P > 0.41
GA-06G kg/ha = 6451 (123) -10.0(3.4)*def, P < 0.01, R2 = 0.32
GA-7W kg/ha = 6444 (116) No significant response P > 0.70
TG kg/ha 6403 (157) No significant response P > 0.96
B
Defoliation (%)
0 10 20 30 40 50 60 70 80 90 100
Cro
p v
alue
($/h
a)
1000
1500
2000
2500
3000
3500
FL-07 $/ha = 2501 (56.0) No significant response, P = 0.03, R2 = 0.25
GA-06G $/ha = 2451 (51.8) - 3.5(1.4)*def, P = 0.02, R2 = 0.25
GA-7W $/ha = 2462 (40.7) No significant response, P > 0.90
TG $/ha = 2562 (64.4) No significant response, P > 0.85
Fig. 2.2 Relationships of yield (kg/ha) (A) and crop value ($/ha) (B) in function of final percent
defoliation in Trial A, Tifton, GA 2010. Florida-07 (FL-07, closed circles), Georgia-06G (GA-
06G, open circles, solid line), Georgia-07W (GA-07W, closed triangles), and Tifguard (TG, open
triangles).
55
A
Defoliation (%)
0 10 20 30 40 50 60 70 80 90 100
Yie
ld (
kg/h
a)
0
1000
2000
3000
4000
5000
6000
7000
8000
GA-06G (kg/ha) = 6526 (238) - 14.4 (4.4)*def, P < 0.01, R2 = 0.29
B
Defoliation (%)
0 10 20 30 40 50 60 70 80 90 100
Cro
p v
alue
($/h
a)
1000
1500
2000
2500
3000
3500
GA-06G $/ha = 2450 (94) - 5.3( 1.8)*def, P < 0.01, R2 = 0.26
Fig. 2.3 Relationships of yield (kg/ha) (A) and crop value ($/ha) (B) in function of final percent
defoliation in Trial B, Tifton, GA 2010. Georgia-06G (GA-06G, open circles, solid line).

56
A
0 10 20 30 40 50 60 70 80 90 100
Yie
ld (
kh
/ha
)
0
1000
2000
3000
4000
5000
6000
7000
8000
9000
FL-07 kg/ha = No significant response P > 0.07
GA-06G kg/ha = 6903 (164) - 13.4(2.9)*def, P < 0.01, R2 = 0.60
GA-07W kg/ha = 6919 (210) - 13.6(3.8)*def, P < 0.01, R2 = 0.48
TG kg/ha = No significant response, P > 0.37
B
0 10 20 30 40 50 60 70 80 90 100
Cro
p v
alu
e (
$/h
a)
1000
1500
2000
2500
3000
3500
Florida-07 $/ha = 2846 (89) - 3.0(1.9)*def, P = 0.13, R2 = 0.15
Georgia-06G $/ha = 2857 (73) - 5.5(1.3)*def, P < 0.01, R2 = 0.55
Georgia-07W $/ha = 2880 (90) - 5.7(1.6)*def, P < 0.01, R2 = 0.47
Tifguard $/ha = No significant response, P > 0.55
C
Defoliation (%)
0 10 20 30 40 50 60 70 80 90 100
ND
VI
0.3
0.4
0.5
0.6
0.7
0.8
0.9
GA-06G NDVI = 0.77 (0.010) - 0.002(0.0002)*def, P < 0.01, R2 = 0.93
GA-07W NDVI = 0.81 (0.013) - 0.002(0.0002)*def, P < 0.01, R2 = 0.87
TG NDVI = 0.80 (0.006) - 0.002(0.0003)*def, P < 0.01, R2 = 0.72
FL-07 NDVI = 0.77 (0.009) - 0.002(0.0002)*def, P < 0.01, R2 = 0.91

57
Fig. 2.4 Relationships of yield (kg/ha) (A), crop value ($/ha) (B), and NDVI (C) in function of
final percent defoliation in Trial D, Attapulgus, GA 2011. Florida-07 (FL-07, closed circles,
long-dashed line), Georgia-06G (GA-06G, open circles, solid line), Georgia-07W (GA-07W,
closed triangles, short-dashed line), and Tifguard (TG, open triangles, dotted line). In Graph B,
regression lines for Georgia-06G and Georgia-07W are very similar and are superimposed. In
Graph C, regression lines for Georgia-06G and Florida-07 are very similar, and are
superimposed.

58
A
0 10 20 30 40 50 60 70 80 90 100
Yie
ld (
kg
/ha
)
0
1000
2000
3000
4000
5000
6000
7000
8000
FL-07 (kg/ha) = 5878 (161) - 8.7(3.5)*def, P = 0.03, R2 = 0.25
GA-06G (kg/ha) = 6119 (196) - 9.4(3.5)*def, P < 0.01, R2 = 0.29
GA-07W (kg/ha) = 5644 (106) - 6.6(2.7)*def, P = 0.02, R2 = 0.26
TG No significant response, P > 0.87
B
0 10 20 30 40 50 60 70 80 90 100
Cro
p v
alu
e (
$/h
a)
0
500
1000
1500
2000
2500
3000
FL-07 $/ha = 2176 (62) - 2.9(1.4)*def, P = 0.05 R2 = 0.20
GA-06G $/ha = 2406 (78) - 3.3(1.4)*def, P = 0.03 R2 = 0.23
GA-07W $/ha = No significant response (P = 0.06)
TG $/ha = No significant response (P = 0.87)
C
Defoliation (%)
0 10 20 30 40 50 60 70 80 90 100
ND
VI
0.4
0.5
0.6
0.7
0.8
0.9
FL-07 NDVI = 0.74 (0.01) - 0.002(0.0002)*def, P < 0.01, R2 = 0.74
GA-06G NDVI = 0.72 (0.01) - 0.001(0.0002)*def, P < 0.01, R2 = 0.71
GA-07W NDVI = 0.76 (0.009) -0.002(0.0002)*def, P < 0.01, R2 = 0.74
Tifguard NDVI = 0.78(0.010) - 0.003(0.0006)*def, P < 0.01, R2 = 0.53

59
Fig. 2.5 Relationships of yield (kg/ha) (A), crop value ($/ha) (B), and NDVI (C) in function of
final percent defoliation in Trial C, Tifton, GA 2011. Florida-07 (FL-07, closed circles, short-
dashed line), Georgia-06G (GA-06G, open circles, solid line), Georgia-07W (GA-07W, closed
triangles, long-dashed line), and Tifguard (TG, open triangles, dotted line).

60
A
0 10 20 30 40 50 60 70 80 90 100
Yie
ld (
kg/h
a)
0
1000
2000
3000
4000
5000
6000
7000
8000
FL-07 (kg/ha) = No significant response, P > 0.19
GA-06G (kg/ha) = No significant response, P > 0.16
GA-7W (kg/ha) = No significant response, P > 0.46
TG (kg/ha) = No significant response, P > 0.17
B
Defoliation (%)
0 10 20 30 40 50 60 70 80 90 100
ND
VI
0.5
0.6
0.7
0.8
0.9
FL-07 NDVI = No significant response, P = 0.07
GA-06G NDVI = No significant response, P = 0.08
GA-07W NDVI = 0.73 (0.006) - 0.002(0.0004)*def, P < 0.01, R2 = 0.49
TG NDVI = 0.72 (0.007) - 0.002(0.0008)*def, P < 0.0P < 0.01, R2 = 0.28
Fig. 2.6 Relationships of yield (kg/ha) (A) and NDVI (B) in function of final percent defoliation
in Trial E, Plains, GA 2011. Florida-07 (FL-07, closed circles), Georgia-06G (GA-06G, open
circles), Georgia-07W (GA-07W, closed triangles, long-dashed line), and Tifguard (TG, open
triangles, dotted line).

61
A
0.4 0.5 0.6 0.7 0.8 0.9
Yie
ld (
kg/h
a)
0
1000
2000
3000
4000
5000
6000
7000
8000
FL-07 Yieldk = 2951(1269) + 3883(1840)*NDVI, P = 0.05, R2
= 0.20
GA-06G Yieldk = 308(1143) + 8130(1740)*NDVI, P = 0.05, R2
< 0.56
GA-07W Yieldk = No significant Response, P = 0.07
TG Yieldk = No significant Response, P = 0.17
B
NDVI
0.4 0.5 0.6 0.7 0.8 0.9
Yie
ld (
kg/h
a)
0
1000
2000
3000
4000
5000
6000
7000
8000
9000
FL-07 kg/ha = 3684(1297) + 4697(1851)*NDVI, P = 0.02, R2
= 0.31
GA-06G kg/ha = 2331(703) + 5966(1032)*NDVI, P < 0.01, R2
= 0.70
GA-07W kg/ha = 3005 (1143) + 4722(1596) NDVI, P = 0.01, R2 = 0.38
TG kg/ha = No significant Response, P = 0.71
C
NDVI
0.4 0.5 0.6 0.7 0.8 0.9
Yie
ld (
kg/h
a)
0
1000
2000
3000
4000
5000
6000
7000
8000
FL-07 kg/ha No significant response, P = 0.11
GA-06G kg/ha No significant response, P = 0.80
GA-07W kg/ha = No significant Response, P = 0.38
TG Yieldk = No significant Response, P = 0.09

62
Fig. 2.7 Relationships of yield (kg/ha) in function of NDVI. Florida-07 (FL-07, closed circles,
short-dashed line), Georgia-06G (GA-06G, open circles, solid line), Georgia-07W (GA-07W,
closed triangles, long-dashed line), and Tifguard (TG, open triangles, dotted line) in Trial C in
Tifton (A), Trial D in Attapulgus (B), and Trial E in Plains, GA, (C), 2011.
63
CHAPTER 3
EFFECT OF RUNNER-TYPE PEANUT CULTIVARS AND ADVANCED BREEDING
LINES ON SEVERITY OF LATE LEAF SPOT AND POD YIELD1
____________________________________
1Navia Gine, P. A., Culbreath, A. K, Tillman, B. A., Holbrook, C. C., and Branch, W. D.,
Pittman, R., Todd, J. D. To be submitted to Peanut Science.

64
ABSTRACT
Field trials were conducted in Tifton, GA and Marianna, FL to evaluate field reactions of
new peanut genotypes developed as part of the USAID Peanut CRSP program. Four genotypes
from the University of Florida were evaluated in all four locations, and two additional genotypes
developed in Georgia were evaluated in Tifton. Trials included susceptible and resistant
standards. Three of the Florida genotypes (97x45-HO1-2-B2G-1-2-1-2, 98x64-2-2-1-2b4-B, and
96x72-HO1-10-2-1-b4-B) and CRSP 1048-192T showed moderate levels of field resistance to C.
personatum. The fourth line from Florida (97x31-1-1-7-B2-5-1-2-B) showed good yield
potential even with severe defoliation by leaf spot. CRSP 1048-192T combined partial
resistance to C. personatum, early maturity and good yield potential, such combination is very
promising for guiding the breeding efforts into this direction.
Keywords: Cercosporidium personatum, late leaf spot, advanced breeding lines,
resistance.
Early and late leaf spot caused by Cercospora arachidicola Hori and Cercorporidium
personatum (Berk. and Kurt.) Deighton, respectively, are major foliar diseases of peanut
(Arachis hypogaea L.). In the U.S., management of these diseases relies primarily on fungicide
applications (Smith and Littrell, 1980; Shokes, 1982; Johnson et al. 1985). However the use of
cultivars with partial resistance to these pathogens has potential to reduce or eliminate the
dependency on fungicides for management of these diseases (Pande, 2001; Gremillion, 2010). In
other peanut producing areas of the world, fungicides may not be available, or their use may be
cost-prohibitive. Therefore, breeding for resistance to early and late leaf spot pathogens is a
major objective in most peanut breeding programs (Abdou, et al. 1974; Chiteka et al. 1988).
Sources resistance in wild and cultivated peanut have been reported (Abdou, et al. 1974; Hassan,

65
1977), and a study of all the available foliar-disease-resistant genotypes for peanut at the
International Crops Research Institute for the Semi-Arid Tropics (ICRISAT), Patancheru, India,
indiecated that approximately 84% of them originated in South America or had South American
connections (Subrahmanyam et al., 1989).
Breeding efforts achieved cultivars like York (Gorbet and Tillman, 2011) and Georganic
(Holbrook and Culbreath, 2008) which are considered resistant to leaf spot. However these
cultivars are not accepted for conventional peanut production due to low yield potential for York
and the red testa (seed coat) for Georganic. Therefore breeding goals besides resistance to leaf
spot also incorporate yield potential and kernel quality in its traits (Tillman and Stalker, 2009),
and resistance to tomato spotted wilt virus which has been one of the most destructive diseases
for peanuts in the United States the last 20 years (Culbreath et al. 2003). After many years of
research the new available runner-type cultivars like Georgia-06G and Florida-07 are not
necessarily resistant to leaf spot but are resistant to TSWV and have excellent yield potential.
Thus there remains a necessity to develop cultivars that have resistance to leaf spot pathogens
because the cost of fungicide inputs is still very high.
One of the key countries for finding foliar-disease-resistant genotypes for peanut is
Bolivia; more sources of resistance to early leaf spot were found there than in any other country
(Holbrook and Isleib, 2001). Bolivia is well known for its genetic diversity for Arachis spp.
(Subrahmanyam et al., 1989; Holbrook and Isleib, 2001; Williams, 2001; Jarvis et al., 2003;
Gremillion, 2011). With the objective of developing improved cultivars for the United States and
Bolivia with potential of disease resistance from Bolivia’s diverse germplasm, the USDA-ARS
in collaboration with Peanut Collaborative Research and Support Program (Peanut CRSP)
initiated a project to develop breeding lines with Bolivian genetic material. The Bolivian cultivar

66
‘Bayo Grande’ has been used in crossings to get new breeding lines. The first evaluation made
by this project on leaf spot resistance and yield in peanut genotypes in the United States and
Bolivia was developed by Sara Gremillion and collaborators in 2004 and 2005 (Gremillion et al.,
2011).
The objective of this study was to evaluate four new breeding lines developed by the
University of Florida and three breeding lines developed through joint efforts of the USDA-ARS,
the University of Georgia, and the University of Florida.
MATERIALS AND METHODS
Field experiments were conducted in 2010 and 2011 at two locations: the University of
Georgia Coastal Plain Experiment Station, Tifton, GA (elevation 107 m), and the University of
Florida, North Florida Research and Education Center, Marianna, FL (elevation 51 m). Seven
breeding lines were evaluated in the study, four of them were common in all tests. These
genotypes were selected to assess leaf spot resistance. Current available commercial varieties
were used as controls for these experiments (Table 3.1).
A split-plot design with four replications was used in both years in Tifton and a
randomized complete block design with three replications was used in both years in Marianna.
Peanuts were planted 15 June 2010 and 10 June 2011 in Tifton GA, 4 June 2010 and 2 June 2011
in Marianna FL. Plots for Tifton consisted of 6.09 m-by-1.82-m plots with two rows, 0.9 m apart,
and the seeding rate was 11 seed/m. Plots for Marianna consisted of 6 m-by-1.8 m plots with two
rows, 0.9 m apart, and the seeding rate was 11 seed/m.
At Tifton, whole plots consisted of two fungicide treatments. Fungicide treatments
consisted of a) seven sprays of chlorothalonil (Echo, Sipcam Agro USA, Roswell, GA) at 1.26
kg ai/ha, starting approximately 30 days after planting (DAP) with subsequent applications made

67
at 14-day intervals, and b) non-treated. Sub-plots consisted of twelve genotypes in 2010 and nine
genotypes in 2011. Genotypes evaluated in each year are listed in Tables 3.2 and 3.3 and include
cultivars Georgia Valencia (Branch, 2001), Georgia-06G (Branch, 2007), Florida-07 (Gorbet and
Tillman, 2009), and Georgia Green (Branch, 1996) as susceptible standards and Georganic
(Holbrook and Culbreath, 2008) as a moderately resistant standard. Genotypes included
University of Florida breeding lines 97x31-1-7-B2-5-1-2-B, 98x64-2-2-1-2-b4-B, 97x45-HO1-2-
B2G-1-2-1-2, and 96x72-HO1-10-2-1-2-b4-B. Peanut CRSP breading lines CRSP 1048-192T
and CRSP 1048-266T were included in both years; CRSP 1048-362T was included in 2010.
These three genotypes are sister lines, developed from a cross between Georgia Valencia
(Branch, 2001) and CRSP-08. CRSP-08 was developed from a cross between Florida-MDR-98
and Bayo Grande, a Bolivian land race cultivar (Gremillion et al., 2011)
At Marianna, treatments in both years consisted of 10 genotypes. These included the
breeding lines 97x31-1-7-B2-5-1-2-B, 98x64-2-2-1-2-b4-B, 97x45-HO1-2-B2G-1-2-1-2, and
96x72-HO1-10-2-1-2-b4-B, developed at the University of Florida, and cultivars Florida-07
(Gorbet and Tillman, 2009), Georgia-07W (Branch and Brenneman, 2008), Tifguard (Holbrook
et al., 2008), C-99R (Gorbet and Shokes, 2002 ), AP-4 (Tillman and Gorbet , 2009), and York
(Gorbet and Tillman, 2011). The cultivar York was included as a moderately resistant standard.
All plots in Tifton were treated with 1.12 kg ai/ha of flutolanil (Convoy, Nichino,
Wilmington, DE) at approximately 60 and 90 DAP to control stem rot caused by Sclerotium
rolfsii to minimize this disease as a confounding factor. Flutolanil is not effective against leaf
spot (Culbreath et al, 1992). Fungicides were applied using a multiple-boom tractor mounted
CO2-propellant sprayer. Each boom was equipped with three Hypro TR80-03 flat fan nozzles
per row. Irrigation was applied as needed at all locations.

68
Disease assessments were made using the Florida 1 to 10 scale (Chiteka et al., 1988),
where 1 = 0% defoliation and 10 = 100% defoliation, plant dead from leaf spot. In Tifton disease
intensity was evaluated 135 DAP in 2010; 125 DAP and 136 DAP in 2011. In Marianna disease
severity was evaluated 138 DAP in 2010, and 146 DAP in 2011. Percent defoliation was
calculated from Florida Scale values (FLSc) using the formula:
% Defoliation = 100/(1+e(-(FLSc-6.0672)/0.7975)
)
as reported by Li et al. 2012.
Peanuts were inverted in Tifton at 147 DAP in 2010 and 138 DAP in 2011. At Marianna
peanuts were inverted at 147 DAP in 2010 and 153 DAP in 2011. Peanut pods were harvested
mechanically 7 to 11 days after inverting, and pod yields were determined by weighing harvested
pods after they were dried and adjusted to 10% (wt/wt) moisture.
The individual plot data collected each year was transferred to a statistical discovery
software (JMP; SAS Institute Inc., Cary NC) and was subjected to analysis of variance to
evaluate treatment effects on leaf spot severity and yield. Data from each location were analyzed
independently. Cultivar and fungicide effects were considered fixed effects and replication was
considered a random effect. Fisher’s protected least significant difference (LSD) values were
used for comparison among the individual treatments, and cultivars.
RESULTS
Leaf spot reactions
Late leaf spot was the predominant foliar disease in all trials. Epidemics developed
relatively late in the year, but were severe by the time of the final ratings in some non-sprayed
plots. Standard cultivars Georgia Green and Florida-07 were almost completely defoliated by
the end of the season.
69
At Tifton, fungicide, genotype and fungicide X genotype effects on final disease severity
ratings and percent defoliation were significant in both years. Therefore, comparisons of
genotypes were made within each level of the fungicide treatments. Applications of
chlorothalonil resulted in lower leaf spot severity ratings and percent defoliation for all entries in
both years (Tables 3.2 and 3.3). In 2010, within non-treated plots, final leaf spot severity ratings
were highest for Georgia Valencia (Table 3.2). Several breeding lines had severity ratings and
percent defoliation by leaf spot that were similar to that of Georganic, and were lower than those
of Georgia Green, Georgia-06G or Florida-07 standards. Within treated plots, leaf spot severity
ratings and percent defoliation were highest in Georgia Valencia, and there were no differences
among the other entries (Table 3.2).
In the non-treated plots in 2011, leaf spot severity was similar for Georgia Green and
Georgia-06G (Table 3.3). All breeding line entries except 97x31-1-7-B2-5-1-2-B had final
severity ratings lower than that of Georgia Green. Leaf spot severity was lowest in Georganic.
Fewer differences were noted when comparisons were based on percent defoliation (Table 3.3).
Percent defoliation was lowest in Georganic. Breeding lines 98x64-2-2-1-2-b4-B and CRSP
1048-266T had defoliation levels that were lower than that of Georgia Green, but no other entry
had final defoliation lower than that of Georgia Green (Table 3.3). Applications of chlorothalonil
greatly reduced disease severity and percent defoliation in all entries. Within treated plots, there
were few differences among entries for disease severity ratings and no differences based on
defoliation in either year.
Leaf spot epidemics were severe in Marianna in both years, and genotype effects on
disease severity and percent defoliation were significant in both years. Leaf spot severity ratings
were higher in Florida-07 and Georgia-07W than in any other entry in 2010, and were higher

70
than all other entries except 97x31-1-1-7-B2-5-1-2-B in 2011 (Table 3.4). In 2010, all of the
experimental breeding lines except 97x31-1-1-7-B2-5-1-2-B had disease severity ratings similar
to that of York (Table 4). Genotypes 98x64-2-2-1-2-b4-B and 96X72-HO1-10-2-1-2-b4-B had
leaf spot severity ratings that were similar to those of York in both years (Table 3.4). Genotype
comparisons for defoliation followed similar trends as leaf spot severity, and 98x64-2-2-1-2-b4-
B and 96X72-HO1-10-2-1-2-b4-B had percent defoliation estimates that were similar to those of
York in both years (Table 3.4).
Pod Yield
At Tifton in 2010, yields were low in all plots, and there were few differences among
genotypes regardless of fungicide treatment (Table 3.3). There were significant fungicide and
genotype effects, but fungicide X genotype interaction was not significant.
At Tifton in 2011, yields were relatively low. There was a significant fungicide X
genotype interaction. There were no differences in yield among entries within non-treated plots.
Within treated plots, yields of 97x31-1-7-B2-5-1-2-B were higher than any other entry except
Florida-07 (Table 3.3). Among the other genotypes, only 97x45-HO1-2-B2G-1-2-1-2 and
96x72-HO1-10-2-1-2-b4-B had yields higher than those of Georgia Green.
At Marianna, breeding lines 97x31-1-1-1-7-B2-5-1-2-B and 96x72-HO1-10-2-1-2-b4-B
had yields that were among the highest of the entries in both years, and better than the leaf spot
resistant standard cultivar, York, in both years (Table 3.4).
DISCUSSION
Fields in Marianna, FL and Tifton, GA provided suitable natural infections of C.
arachidicola and C. personatum; however late leaf spot was the predominant disease for both
years of study (2010-2011). Our results corroborated previous reports of field resistance in
71
Georganic (Tifton), and in York (Marianna), and more moderate/intermediate resistance in C-
99R (Marianna) and Tifguard (Marianna and Tifton) (Monfort et al., 2004; Cantonwine et al.,
2006; Holbrook and Culbreath, 2008; Gremillion et al., 2011; Gorbet and Tillman, 2011).
Under conditions of severe leaf spot disease pressure where no fungicide was applied, the
Florida breeding lines (98x64-2-2-1-2b4-B, 97x45-HO1-2-B2G-1-2-1-2, and 96x72-HO1-10-2-
1-2-b4-B) and one CRSP breeding line (192-T) had disease ratings that were not significantly
different than resistant cultivars Georganic and York in 2010. However in 2011, a higher disease
severity allowed differentiation of the breeding lines from the resistant cultivars with York and
Georganic displaying significantly less defoliation. Also in 2011 in Marianna, two Florida
breeding lines (98x64-2-2-1-2b4-B and 96x72-HO1-10-2-1-2-b4-B) had the same level of
defoliation as Tifguard and C-99R. In our trials we found evidence that the breeding lines from
Florida have moderate field resistance to C. personatum and that there is commercial potential
for those lines. None of the CRSP lines showed a high level of resistance to C. personatum;
however CRSP 1048-192T showed low to moderate field resistance across two years in Tifton.
There is commercial potential for this line because it is early maturing (harvest occurred at 138
DAP). Two days prior to harvest, the leaf spot rating for CRSP 1048-192T was similar to later
maturing cultivars like Georgia-06G and Florida-07 and the rating was lower than for Georgia
Green. This finding may indicate partial resistance to late leaf spot and corroborates a previous
screening study (Culbreath, unpublished data).
In this study the CRSP breeding lines were evaluated as if they had later maturities.
However, preliminary information indicates they have shorter time to maturity than Georgia
Green. Low levels of leaf spot resistance, when combined with shorter times to maturity, could
be valuable for leaf spot management. Resistance to leaf spot pathogens in early-maturing
72
runner-type genotypes has been rare (Branch and Culbreath, 1995). Harvesting the breeding
lines beyond their optimum maturity may have decreased their yield as well (Knauft et al., 1988).
Additional evaluations are needed to characterize the relative time to maturity for these lines and
to evaluate the effects of leaf spot epidemics on the lines.
Yield is one of the most important breeding goals because peanut breeding is focused to
farmer’s needs (Tillman and Stalker, 2009). Genotypes evaluated in this study have good yield
potential even without fungicides; yield potential that in some cases may exceed available
cultivars. Trials in Marianna showed better pod yields than trials in Tifton, and yield potential is
promising for most or all of the Florida breeding lines. One of the most promising breeding lines
was 96x72-HO1-10-2-1-b4-B which was among the best yielding lines and most leaf spot
resistant in Marianna in both 2010 and 2011. Breeding line 97x31-1-1-1-7-B2-5-1-2-B was also
among the best yielding lines in both years in Marianna and Tifton. These breeding lines had
better yields than the resistant cultivars Georganic and York, especially in 2011 when they had
highest ranking yield; however leaf spot and defoliation were severe for these breeding lines.
In Tifton in 2010 yields were very low in the treated and non-treated plots due late
harvest, evaluation of yield on that trial is not relevant. The Tifton test in 2011 there was a
significant treatment X cultivar interaction in yield response, the genotype 97x31-1-7-B2-5-1-2-
B exceeded significantly all the cultivars tested in this trial having the highest yield in the
fungicide treated plots (Table 2).
Evaluation of leaf spot resistant breeding lines provided useful information on relative
resistance, stability, and response to fungicide management of potential peanut cultivars. The
resistant genotypes had promising levels of leaf spot resistance and some of them had early
maturity. As Branch and Culbreath stated in 1995, a cultivar having disease resistance, early

73
maturity and high yield would present tremendous advantages to the whole peanut industry.
Breeding lines tested in this study show potential for this, but more trials are needed to
characterize time to maturity, and evaluate combination of that maturity, leaf spot tolerance, and
yield potential for these breeding lines in larger plots. The promising lines identified in this study
with excellent yield potential and partial resistance or tolerance to leaf spot are: 97x45-HO1-2-
B2G-1-2-1-2, 98x64-2-2-1-2b4-B, 97x31-1-1-1-7-B2-5-1-2-B, 96x72-HO1-10-2-1-b4-B. The
promising breeding line with partial resistance to leaf spot, early maturity and good yield
potential is CRSP 1048-192T.

74
REFERENCES
2. Abdou, Y. A. M., Gregory, W. C., and Cooper, W. E. 1974. Sources and nature of resistance
to Cercospora arachidicola Hori. and Cercosporidium personatum (Beck. and Curt.)
Deighton in Arachis species. Peanut Sci. 1:6-11.
3. Branch W. D. 2001. Registration of ‘Georgia Valencia’ peanut. Crop Sci. 41:2002-2003.
4. Branch W. D. 2007. Registration of ‘Georgia-06G’ peanut. J. Plant Reg. 1:120.
5. Branch W. D. and Brenneman, T. B. 2008. Registration of ‘Georgia-07W’ peanut. J. Plant
Reg. 2:88-91.
6. Branch, W. D. 1996. Registration of ‘Georgia Green’ peanut. Crop Sci. 36:806.
7. Branch, W. D., and Culbreath, A. K. 1995. Combination of early maturity and leaf spot
tolerance within an advanced Georgia peanut breeding line. Peanut Sci. 22:106-108.
8. Cantonwine, E. G., Culbreath, A. K., Holbrook, C. C., and Gorbet, D.W. 2008. Disease
progress of early leaf spot and components of resistance to Cercospora arachidicola and
Cercosporidium personatum in runner-type peanut cultivars. Peanut Sci. 35:1-10.
9. Chiteka, Z. A., Gorbet, D.W., Shokes, F. M., Kucharek, T. A., and Knauft, D. A. 1988.
Components of resistance to late leaf spot in peanut. I. levels and variability - implications
for selection. Peanut Sci. 15:25-30.
10. Culbreath, A. K., Brenneman, T. B., and Minton, N. A. 1992. Response of Florunner and
Southern Runner peanut cultivars to chemical management of late leaf spot, southern stem
rot, and nematodes. Plant Dis. 76:1199-1203.
11. Culbreath, A. K., Todd, J. W., and Brown, S. L. 2003. Epidemiology and management of
tomato spotted wilt in peanut. Annu. Rev. Phytopathol. 41:53-75.
12. Gobert, D.W., Tillman, B.L. 2011. Registration of ‘York’ peanut. Plant Reg. 5:289-294.
13. Gorbet, D. W., and Shokes, F. M. 2002. Registration of 'C-99R' peanut. Crop Sci. 42:2207.
14. Gorbet, D. W., and Tillman, B.L. 2009. Registration of ‘Florida-07’ peanut. J. Plant Reg.
3:14-18.
15. Gorbet, D. W., Knauft, D. A., and Shokes, F. M. 1990. Response of peanut genotypes with
differential levels of leafspot resistance to fungicide treatments. Crop Sci. 30:529-533.

75
16. Gremillion, S. K., Culbreath, A. K., Gorbet, D. W., Mullinix, B. G., Jr., Pittman, R. N.,
Stevenson, K. L., Todd, J. W., Escobar, R. E., and Condori, M. M. 2011. Field evaluations of
leaf spot resistance and yield in peanut genotypes in the United States and Bolivia. Plant Dis.
95:263-268.
17. Haji, N. H., and Beute, M. K. 1977. Evaluation of resistance to Cercospora leafspot in peanut
germplasm potentially useful in breeding program. Peanut Sci. 4:78-83
18. Hassan, H. N., and Beute, M. K. 1977. Evaluation of resistance to Cercospora leaf spot
peanut germplasm potentially useful in a breeding program. Peanut Sci. 4:78-83.
19. Holbrook, C.C., and Anderson, W. F. 1995. Evaluation of a core collection to identify
resistance to late leafspot in peanut. Crop Sci. 35:1700-1702.
20. Holbrook, C.C., and Culbreath, A. K. 2008. Registration of ‘Georgianic’ peanut. J. Plant
Reg. 2:17.
21. Holbrook, C.C., and Isleib, T.G. 2001. Geographical distribution of genetic diversity in
Arachis hypogaea. Peanut Sci. 28:80-84.
22. Holbrook, C.C., Timper, P., Culbreath, A.K., Kvien, C.K. 2008. Registration of ‘Tifguard’
peanut. J. Plant Reg. 2:92-94.
23. Jarvis A., Ferguson, M. E., Williams, D. E., Guarino, L., Jones, P. G., Stalker, H. T., Valls, F.
M., Pittman, R. N., Simpson, C. E., and Bramel, P. 2003. Biogeography of wild Arachis
assessing conservation status and setting future priorities. Crop. Sci. 43:1100-1108.
24. Johnson C.S., Phipps, and Beute, M.K. 1985. Cercospora leaf spot management decisions: an
economic analysis of a weather-based strategy for timing fungicide applications. Peanut Sci.
12:82-85.
25. Knauft, D. A., Gorbet, D. W., Norden, A. J. 1988. Yield and Market Quality of Seven Peanut
Genotypes as Affected By Leafspot Disease and Harvest Date. Peanut Sci. 15:9-13.
26. Li, Y., Chen, C. Y., S.J., K., Culbreath, A. K., Holbrook, C. C., and Guo, B. 2012. Variability
in field response of peanut genotypes from the U.S. and China to Tomato spotted wilt virus
and leaf spots. Peanut Sci. 39: (In Press).
27. Monfort, W. S., Culbreath, A. K., Stevenson, K. L., Brenneman, T. B., Gorbet, D. W.,
Phatak, S. C. 2004. Plant Dis. 88:858-864.
28. Pande, S., and Narayana Rao, J. 2001. Resistance of wild Arachis species to late leaf spot and
rust in greenhouse trials. Plant Dis. 85:851-855.
29. Shokes, F.M., and Gorbet, D.W. 1982. Effect of planting date and date of spray initiation on
control of peanut leaf spots in Florida. Plant Dis. 66:574-575.

76
30. Simpson, C. E., and Starr, J. L. 2001. Registration of ‘COAN’ peanut. Crop Sci. 41:918.
31. Simpson, C. E., Krapovickas, A., amd Valls, F. M. 2001. History of Arachis including
evidence of a A. hypogaea L. progenitors. Peanut Sci. 28:78-80.
32. Smith, D. H., and Littrell, R. H. 1980. Management of peanut foliar diseases with fungicides.
Plant Dis. 64:356-361.
33. Smith, F. D., Brenneman, T. B., Branch, W. D., Mullinix, B.G. 1994. Evaluation of runner
peanut cultivars and advanced Georgia breeding lines for yield and resistance to late leaf spot
under three disease-management programs. Peanut Sci. 21:48-54.
34. Subrahmanyam, P., Rao, V. R., McDonald, D., Moss, J. P., and Ginnons, R. W. 1989.
Origins of resistance to rust and late leaf spot in peanut (Arachis hypogaea, fabaceae).
Economic Bot. Vol. 43. 4:444-455.
35. Tillman, B. L., and Gorbet, D. W. 2009. Registration of ‘AP-4’ peanut. J. Plant Reg. 3:138-
142.
36. Tillman, B. L., and Stalker, H. T. 2009. Peanut. Pages 287-315 in: Oil Crops, Handbook of
Plant Breeding Volume 4. Vollmann, J, and Rajcan, I., eds. Springer Science, New York,
NY.
37. Watson, G.R., Kucharek, T.A., and Shokes, F.M. 1998. Components of resistance in peanut
late peanut leaf spot. Soil Crop Sci. Florida Proc. 57:87-91.
38. Williams, D. E. 2001. New directions for collecting and conserving peanut genetic diversity.
Peanut Sci. 23:135-140.

77
Table 3.1 Pedigree, relative maturity, and oleic acid content of peanut genotypes evaluated for
yield and leaf spot resistance in 2010 and 2011.
Genotype Pedigree Maturity Oleic acid
content
97x31-1-7-B2-5-1-2-B [(92xOL100-2-3-)x(84x47-2-)] M N
98x64-2-2-1-2-b4-B L H
97x45-HO1-2-B2G-1-2-1-2 ((89x47-)x(89xOL28-)) L H
96x72-HO1-10-2-1-2-b4-B [(89xOL2)x(84x28-)] L H
CRSP 1048-192T [(Georgia Valencia)xCRSP-08)] E N
CRSP 1048-266T [(Georgia Valencia)xCRSP-08)] E N
CRSP 1048-362T [(Georgia Valencia)xCRSP-08)] E N M = medium; L = late; E = early N = normal; H = high

78
Table 3.2 Effect of peanut genotypes and fungicide treatments on severity of late leaf spot and pod yield, Tifton, GA 2010.
Disease severitya Percent defoliation Yield (kg/ha)
Genotype/Cultivar Nontreatedb Treated
b
Nontreated
Treated Nontreated Treated
97x31-1-7-B2-5-1-2-B 6.4 cd 2.4 bc 57.7 cde 1.0 b 1358 ab 1640 a
98x64-2-2-1-2-b4-B 5.5 d 2.1 c 35.2 e 0.7 b 1228 bcd 1313 abc
97x45-HO1-2-B2G-1-2-1-2 5.6 d 2.3 bc 38.1 de 0.8 b 1185 bcd 1360 ab
96x72-HO1-10-2-1-2-b4-B 5.5 d 2.5 bc 34.2 e 1.1 b 1510 a 1480 ab
CRSP 1048-192T 5.8 d 2.5 bc 40.3 de 1.2 b 921 ef 905 ef
CRSP 1048-266T 7.3 bc 2.7 b 73.6 abc 1.5 b 1067 de 923 def
CRSP 1048-362T 6.5 cd 2.6 b 62.8 bcd 1.3 b 716 fg 1000 cdef
Georgia Valencia 9.3 a 4.8 a 98.2 a 16.3 a 630 g 775 f
Georgia-06G 7.4 bc 2.5 bc 83.6 ab 1.2 b 1279 bc 1289 abc
Florida-07 8.0 b 2.6 b 91.4 a 1.3 b 1248 bcd 1433 ab
Georganic 5.8 d 2.4 bc 41.2 de 1.0 b 1092 cde 1185 bcde
Georgia Green 7.9 b 2.5 bc 90.5 a 1.2 b 1095 cde 1264 bcd
LSD (P = 0.05) 1.0 0.4 25.3 2.1 207.4 356.5
a Disease severity evaluated using the Florida 1-10 scale, where 1 = no leaf spot, and 10 = plants completely defoliated and killed by
leaf spot.
b Means within the same column followed by the same letter are not significantly different (P < 0.05) using LSMeans Student’s t-test
comparisons.

79
Table 3.3 Effect of peanut genotype and fungicide treatments on severity of late leaf spot and pod yield, Tifton, GA 2011.
LSD (P = 0.05) 0.7 0.7 10.2 10.2 1018.1 1043.3
a Disease severity evaluated using the Florida 1-10 scale, where 1 = no leaf spot, and 10 = plants completely defoliated and killed by
leaf spot.
b Means within the same column followed by the same letter are not significantly different (P < 0.05) using LSMeans Student’s t-test
comparisons.
Disease severitya Percent defoliation Yield (kg/ha)
Genotype Non-treatedb Treated
b Non-treated
b Treated
b Non-treated
b Treated
b
97x31-1-7-B2-5-1-2-B 8.6 abc 4.1 a 95.7 a 9.0 a 2043 a 4340 a
98x64-2-2-1-2-b4-B 7.3 e 3.4 ab 80.8 b 3.8 c 2419 a 3131 bcd
97x45-HO1-2-B2G-1-2-1-2 7.9 cde 3.6 ab 90.2 ab 5.0 abc 2002 a 3263 bc
96x72-HO1-10-2-1-2-b4-B 8.1 bcd 3.6 ab 93.4 ab 4.4 bc 2033 a 3263 bc
CRSP 1048-192T 7.9 cde 3.5 ab 90.3 ab 5.0 abc 2175 a 2571 bcd
CRSP 1048-266T 7.5 de 3.4 ab 83.7 bc 3.8 c 1748 a 2165 d
Georgia-06G 8.8 ab 3.0 b 96.2 a 2.2 c 1870 a 2582 bcd
Florida-07 8.3 abc 3.3 b 94.4 ab 3.2 c 2267 a 3496 ab
Georganic 5.9 f 3.1 b 45.7 c 3.0 c 2277 a 2754 bcd
Georgia Green 9.0 a 4.0 a 98.0 a 8.4 ab 1555 a 2256 cd

80
Table 3.4 Effect of peanut genotypes on severity of late leaf spot, percent defoliation, and pod yield, Marianna, FL 2010 and 2011.
Genotype Disease severitya Percent defoliation Yield (kg/ha)
2010b 2011
b 2010
b 2011
b 2010
b 2011
b
97x31-1-1-7-B2-5-1-2-B 7.1 bc 8.0 ab 79.7 abc 92.0 ab 5713 abc 6400 a
98x64-2-2-1-2-b4-B 5.6 de 7.3 bcd 36.2 def 81.7 abcd 5139 cd 6284 ab
96x72-HO1-10-2-1-2-b4-B 5.5 e 7.0 cd 33.7 ef 75.3 cd 6245 a 6263 ab
97x45-HO1-2-B2G-1-2-1-2 5.5 e 7.5 bc 33.7 ef 84.8 abc 4926 d 6360 a
C-99R 6.6 bcd 6.8 cd 60.0 bcd 70.92 cd 5327 bcd 4774 d
Florida-07 9.3 a 8.3 a 98.3 a 94.4 ab 5446 bcd 6230 ab
Georgia-07W 9.0 a 8.5 a 97.6 a 95.0 a 5652 abc 5815 abc
Tifguard 7.4 b 7.0 cd 83.9 ab 76.5 cd 5880 ab 5771 abc
AP-4 6.3 cde 7.1 cd 55.5 cde 79.7 bcd 4763 d 5584 bc
York 5.3 e 6.6 d 28.7 f 66.98 d 5183 bcd 5056 cd
LSD (P = 0.05) 1.0 0.7 25.5 14.8 628.6 684.5
a Disease severity evaluated using the Florida 1-10 scale, where 1 = no leaf spot, and 10 = plants completely defoliated and killed by
leaf spot.
b Means within the same column followed by the same letter are not significantly different (P < 0.05) using LSMeans Student’s t-test
comparisons.

81
CHAPTER 4
INCIDENCE OF STEM LESIONS CAUSED BY CERCOSPORIDIUM PERSONATUM IN
NEW PEANUT RUNNER-TYPE CULTIVARS
_________________________
1Navia Gine, P. A., Culbreath, A. K, Tillman, B. A., Holbrook, C. C., Kemerait, R. C., and
Branch, W. D. To be submitted to Peanut Science.

82
ABSTRACT
Cercosporidium personatum, the cause of late leaf spot of peanut (Arachis hypogaea L.) can
cause lesions on the stems in addition to the leaves of peanut plants. However, few comparisons
of peanut genotypes for incidence of stem lesions have been reported. Field experiments were
conducted in Tifton, GA in 2010 and 2011, Attapulgus, GA in 2011, and Mariana FL, in 2010
and 2011 to compare incidence of stem lesions in new peanut runner-type cultivars. Cultivars
evaluated at Tifton and Attapulgus included Florida-07, Georgia-06G, Georgia-07W, and
Tifguard, and cultivars evaluated at Marianna included Florida-07, Georgia-07W, Tifguard, and
York. Stem lesions did not occur in high numbers in all trials even with high levels of
defoliation. Incidence of stem lesions was higher for Florida-07 than for Georgia-07W, Tifguard
and York in Mariana FL in 2010 and 2011, and higher than in Georgia-06G and Tifguard in
Attapulgus GA, in 2011. Cultivars Tifguard and York with moderate levels of resistance to C.
personatum based on foliar disease assessment also had lower incidence of stem lesions.
However, at Marianna in both years, there were incidence of stem lesions was higher in Florida-
07 than in Georgia-07W when both had similar high levels of defoliation due to late leaf spot.
These results suggest that occurrence and incidence of stem lesions should also be considered in
characterizations of genotype responses to C. personatum.
Keywords: Cercosporidium personatum, cankers, resistance, yield losses.
Early and late leaf spot caused by Cercospora arachidicola S. Hori and Cercosporidium
personatum Berk. & M.A. Curtis, respectively, are common peanut (Arachis hypogaea L.)
diseases that cause defoliation and can reduce yield by as much as 50% or more (Shokes and
Culbreath, 1997). As the name implies, symptoms most often associated with these diseases are
dark irregularly shaped to circular lesions that form on the leaves. However, all aboveground

83
plant parts are subject to infection, and late in the season during severe epidemics, lesions occur
on leaf petioles, gynophores, central stems, and lateral branches (Jenkins, 1938; Hemmingway,
1954; Nutter and Shokes, 1995). Lesions on the stem may interrupt translocation
(Hemmingway, 1954). In severe cases, the stem may be completely girdled and killed. Yield
losses associated with leaf spot often appear to be due more to loss of mature pods due to
breaking of pegs during harvest than to reduction of pods formed (Knauft et al. 1988).
Damage to the stems may affect the integrity of the gynophores and the ability of the
plant to retain pods through the digging and harvest processes. However, severity of damage by
C. arachidicola or C. personatum to the stems is not commonly evaluated in leaf spot
investigations.
Developing cultivars with resistance to the leaf spot pathogens or tolerance to the
diseases they cause is an objective of most peanut breeding programs. Currently, only partial,
rate-limiting resistance is available in runner-type peanut. Most evaluations of peanut genotype
response to the leaf spot pathogens in the field are based on incidence and severity of leaf spot on
the leaves and levels of defoliation incurred. However, cultivar differences in incidence of stem
lesions caused by C. personatum have been observed (Culbreath et al, 1991).
The cultivar Southern Runner has a moderate level of resistance to C. personatum based
on severity of leaf spot in the field (Gobert and Norden et al. 1986) and components of resistance
measured in greenhouse or growth chamber experiments (Watson et al., 1998). Culbreath et al,
(1991) reported that incidence of stem lesions caused by C. personatum was also much lower in
the cultivar Southern Runner than on the leaf spot-susceptible cultivar Florunner. It was
hypothesized that lower incidence of lesions on the stems was due to resistance of the stem
tissue. Such resistance could minimize weakening of the stems and pegs and help minimize

84
losses to leaf spot, even when substantial defoliation occurs. However, since that report,
consideration of stem lesions has not been common in studies characterizing peanut genotype
response to either leaf spot pathogen.
Since 2006 several new runner-type cultivars have been released with excellent yield
potential and high levels of field resistance to Tomato spotted wilt virus. Currently the
predominant runner-type cultivars grown in the southeastern U.S. include Georgia-06G, Florida-
07, Georgia-07W, York, and Tifguard (Beasley et al., 2010). Tifguard and York have a
moderate level of resistance to both C. arachidicola and C. personatum (Holbrook et al., 2008;
Gobert and Tillman, 2011), but the other three are susceptible to both pathogens (Branch, 2006;
Branch and Brenneman, 2008; Gobert and Tillman, 2009). Susceptibility of these cultivars to
stem infections by either leaf spot pathogen has not been evaluated. The objective of this study
was to determine the effect of stem lesions caused by C. arachidicola or C. personatum on new
runner-type cultivars and to relate those responses to the severity of the diseases on the leaves.
MATERIALS AND METHODS
Field experiments were conducted at the Coastal Plain Experimental Station in Tifton,
GA, at the Georgia Extension and Research Station in Attapulgus, GA, and at the North Florida
Research and Education Center in Marianna, FL, in 2010 and 2011. Non-treated plots of
cultivars Georgia-06G, Georgia-07W, Florida-07, and Tifguard that were part of split-plot
designed field experiments with multiple-fungicide treatments in Tifton, GA and Attapulgus,
GA, as described in Chapter 2, were used for stem lesion incidence comparisons. Plot length was
12.8 m at Tifton in 2010 and 12.0 m at Tifton and Attapulgus in 2011. All plots were 1.8 m
wide. Five replications were used in both trials at Tifton and four replications were used at
Attapulgus.

85
A randomized complete block design with 3 replications was used in Marianna in both
years. Cultivars used were Florida-07, Georgia-07W, Tifguard, and York that were entries in a
larger trial for evaluating leaf spot resistance (Chapter 3). Plots were 6 m long by 1.8 m wide for
in both years.
In 2010, planting dates were 26 May at Tifton, and 4 June 2010 at Marianna. In 2011,
plant dates were 2 June at Tifton, 1 June at Attapulgus, and June 2 at Marianna. All plots in
Tifton and Attapulgus were cover sprayed two times with 1.12 kg ai/ha of flutolanil (Convoy,
Nichino, Address), at approximately 60, and 90 days after planting (DAP), to control stem rot
(white mold) caused by Sclerotium rolfsii. Flutolanil has no efficacy against early or late leaf
spot (Culbreath et al., 1992)
For this study, leaf spot severity was assessed visually using the 1-10 Leaf Spot Florida
Scale (1= no disease 0% defoliation, and 10=100% defoliation, plants dead (Chiteka et al.,
1988). Leaf spot assessments were made at 142 DAP at Tifton in 2010, 138 DAP at Marianna in
2010, 146 DAP at Marianna in 2011, 148 DAP at Tifton in 2011, and 146 DAP at Attapulgus in
2011. Percent defoliation was calculated using the data from leaf spot Florida Scale ratings using
the equation developed by Li et al., 2012:
% Defoliation = 100/(1+e(-(FLSc-6.0672)/0.7975)
)
For evaluation of lesions on the stems, 12 lateral branches were collected from each plot.
Lateral stems were collected by arbitrary selection, with samples taken from the center of the
row along the length of the bed. In 2010, samples were collected 13 October at Tifton, and 20
October at Marianna. In 2011, stems were collected 26 October at Marianna, 25 October at
Tifton, and 26 October at Attapulgus. Lesions were counted as described by Culbreath et al.
(1992) except counts were made for the distal 30 cm of the stem. Representative lesions from all

86
trials were examined with a hand lens to determine which pathogen was present. In 2011,
representative lesions from stems at trials at Marianna and Attapulgus were examined using the
dissecting microscope, and conidia produced on the stems were evaluated with a compound
microscope to confirm diagnosis. All stem lesions examined were late leaf spot.
In 2010, plots were dug and 14 October at Tifton, and 20 October at Marianna. In 2011
plots were inverted 2 November at Marianna, 28 October at Tifton, and 26 October at
Attapulgus. Plots were harvested mechanically, and yield was determined for each plot as pod
weight and adjusted to 10% moisture (wt/wt).
The individual plot data collected each year was transferred to statistical discovery
software (JMP; SAS Institute Inc., Cary NC) and was subjected to analysis variance to evaluate
cultivar and treatment effects on leaf spot severity, number of stem lesions, and yield. Cultivar
effects were considered fixed effects, and replication was considered a random effect. Fisher’s
protected least significant difference (LSD) values where used for comparison among the
individual treatments, and cultivars.
RESULTS
Late leaf spot was the predominant foliar disease in trials by the time of harvest, but early
leaf spot was present in all trials earlier in the season. Only late leaf spot lesions were observed
on the stems. Leaf spot epidemics began late in the season in all trials. Epidemics were moderate
at Tifton in 2010, but were heavy in all other trials.
In Tifton, in 2010, there were no differences among cultivars for incidence of stem
lesions, leaf spot severity ratings, or pod yield (Table 4.1). Results were similar at Tifton in
2011 except leaf spot severity ratings and percent defoliation were lower for Tifguard than any
other cultivar (Table 4.1).
87
In 2010, at Marianna, incidence of stem lesions was highest for Florida-07. Incidence of
stem lesions was higher for Georgia-07W than for Tifguard and York (Table 4.1). Florida scale
leaf spot severity ratings were highest for Florida-07, and Georgia-07W, Tifguard, and York
each differed, with severity ratings decreasing in that respective order. Percent defoliation was
similar for Florida-07 and Georgia-07W. Percent defoliation was lowest in York (Table 4.1).
There were no differences in yield among cultivars. In 2011 at Marianna, incidence of stem
lesions was highest in Florida-07W, and there were no differences among the other cultivars
(Table 4.1). Florida scale ratings and percent defoliation were similar for Florida-07 and
Georgia-07W, and higher than for Tifguard and York. Yield of Florida-07 was higher than that
of York (Table 4.1). Yields of Georgia-07W and Tifguard were intermediate and did not differ
from either Florida-07 or York.
At Attapulgus, incidence of stem lesions was low, but there were differences among
cultivars (Table 4.1). Incidence of stem lesions was higher for Florida-07 than for Tifguard or
Georgia-06G. Incidence was intermediate for Georgia-07W. Leaf spot ratings and percent
defoliation were lowest in Tifguard, and there were no differences among the other cultivars.
Yield was higher in Florida-07 than for Georgia-07W (Table 4.1). Yields of Georgia-06G and
Tifguard were intermediate (Table 4.1).
DISCUSSION
Results from this study corroborate the previous report by Culbreath et al. (1992) that
peanut cultivar can affect the incidence of stem lesions caused by C. personatum. Incidence of
stem lesions caused by C. personatum was higher in Florida-07 than in Tifguard at Attapulgus,
and higher than in Tifguard, York, and Georgia-07W in both experiments at Mariana. Lower
incidence of stem lesions in Tifguard and York than in Florida-07 or Georgia-07W correspond

88
with lower levels of defoliation in those cultivars. Tifguard and York have moderate levels of
field resistance to C. personatum, compared to Florida-07 as was the case with Southern Runner
compared to Florunner (Culbreath et al., 1992). However, incidence of stem lesions in Georgia-
07W was lower than in Florida-07 in two years at Marianna in which the percent defoliation
caused by leaf spot was very high and did not differ for those cultivars.
Although Georgia-06 was included in three of the trials, stem lesion incidence in those
trials was too low to determine conclusively the relative susceptibility of that cultivar. At
Attapulgus, however, although Georgia-06G had higher Florida scale leaf spot ratings, and
similar levels of defoliation as Florida-07, stem lesion incidence in Georgia-06G was lower than
that of Florida-07. These results suggest that relative susceptibility to foliar infection and
defoliation by C. personatum may not be completely indicative of susceptibility to stem
infections by this pathogen.
Although peanut cultivar affects incidence of stem lesions incidence, other factors that
affect stem lesion development have not been characterized. Variability among trials for stem
lesion incidence in Florida-07 was substantial, despite levels of defoliation of 70% or more in all
trials. Components of the apparent resistance to stem lesion infection such as incubation and
latent periods, lesion size, and capability to completely girdle the peanut stem need
characterization. Similarly, it is not known whether the same environmental conditions are
optimal for leaf infection and stem infection. The occurrence of stem lesions typically only after
high levels of leaf let infection and defoliation are present suggests that the time at which high
levels of defoliation is reached should be examined as a factor affecting stem susceptibility to
infection.

89
Yield losses to leaf spot often are associated with breaking of the gynophores during the
inversion process (Knauft, 1988). However, comparisons of strength of gynophores with leaf
spot lesions and those without, have not been reported. Lesions on gynophores themselves were
not evaluated in this study, but these and stem lesions likely should be examined for
characterizing the relationship between leaf spot severity and yield.
Nuesry (1981), reported that infected stem tissue was suitable for survival of C.
arachidicola and C. personatum. Culbreath et al. (1991) hypothesized that cultivar differences
in incidence of stem lesions on peanut crop debris might also affect survival of the leaf spot
pathogens, especially in fields not planted to peanut the next year, since woody stem tissue
should be more resilient. However, that hypothesis has not been tested.
This study indicates that there are differences in susceptibility to stem lesion development
among new runner-type cultivars. As observed in the previous investigation (Culbreath, 1991),
cultivars with moderate levels of resistance to C. personatum based on foliar disease assessment
also had lower incidence of stem lesions. However, results from this study also indicate that
there may be variability in susceptibility to stem lesion formation among cultivars that are
similar in their susceptibility to foliar infection and defoliation.

90
REFERENCES
1. Branch, W.D. 2007. Registration of ‘Georgia-06G’ peanut. J. Plant Reg. 1:120.
2. Branch, W.D., and Brenneman T.B. 2008. Registration of ‘Georgia-07W’ peanut. J. Plant
Reg. 2:88-91.
3. Culbreath, A. K., Brenneman, T. B., and Mullinix, B. G. 1992. Response of Florunner and
Southern Runner peanut cultivars to chemical management of late leaf spot, southern stem
rot, and nematodes. Plant Dis. 76:1199-1203.
4. Culbreath, A. K., Brenneman, T.B., and Shokes, F. M. 1991. Quantitative comparison of
stem lesions caused by Cercosporidium personatum in Florunner and Southern Runner
peanut cultivars. Peanut Sci. 18:116-121.
5. Gobert, D.W., Tillman, B.L. 2009. Registration of ‘Florida-07’ peanut. J. Plant Reg. 3:14-18.
6. Gobert, D.W., Tillman, B.L. 2011. Registration of ‘York’ peanut. J. Plant Reg. 5:289-294.
7. Gorbet, D. W., A. J. Norden, et al. 1986. "Southern Runner a new leafspot resistant peanut
variety. Florida Agricultural Experiment Stations Circular (S324): 1-13.
8. Hemmingway, J. S. 1954. Cercospora leafspots of groundnuts in Tanganyika. The East
African Agricultural Journal 19:263-271.
9. Holbrook, C.C., Timper, P., Culbreath, A.K., Kvien, C.K. 2008. Registration of ‘Tifguard’
peanut. J. Plant Reg. 2:92-94.
10. Jenkins, W. A. 1938. Two fungi causing leaf spot of peanut. J. Agric. Res. 56:317-332.
11. Knauft, D. A., Gobert, D. W., and Norden, A. J. 1988. Yield and market quality of seven
peanut genotypes grown without leaf spot control. Peanut Sci. 15:9-13.
12. Nuesry, S. M. 1981. Survival of Cercospora arachidicola, Cercosporidium personatum and
primary infection in peanuts in Oklahoma. Oklahoma St. Univ. Ph.D Thesis. 110 pp.
13. Nutter, F.W. Jr., and Shokes, F.M. 1995. Management of foliar diseases caused by fungi.
Pages 65-73 in: Peanut health management, Melouk, H. A., and Shokes, F.M. (eds). APS
Press, St Paul, MN. pp. 65-73.
14. Shokes, F. M., and Culbreath, A.K. 1997. Early and late leaf spots. Pages in: Compendium
of peanut diseases, 2nd
Ed., Kokalis-Burell, N., Porter, D.M., Rodriguez-Kabana, R., Smith,
D.H., and Subrahmanyam, P. (eds). APS Press, St. Paul, MN. pp. 17-20.

91
15. Tillman, B.L., Gobert, D.W. 2008. ‘Florida-07’, a medium maturity, large seeded, high oleic
peanut variety with resistance to tomato spotter wilt. Florida Cooperative Extension Service,
Institute of Agricultural Sciences, University of Florida. SS AGR 313:1-3.
16. Watson, G.R., Kucharek, T.A., and Shokes, F.M. 1998. Components of resistance in peanut
late peanut leaf spot. Soil Crop Sci. Florida Proc. 57:87-91.

92
Table 4.1 Effect of cultivar on incidence of stem lesions, defoliation, and pod yield.
Experimental fields Stem
lesions1
Florida
Scale2
Percent
defoliation2
yield
(kg/ha)
Tifton 2010
Florida-07 3.60a 6.85a 70.0a 6046a
Georgia-06G 3.30a 6.90a 69.2a 5891a
Georgia-07W 1.94a 6.05a 48.7a 6127a
Tifguard
2.33a 6.65a 64.2a 6437a
Marianna FL, 2010
Florida-07 22.02a 9.00a 97.6a 5446a
Georgia-07W 7.88b 7.66b 86.8a 5652a
Tifguard 1.97c 5.16c 29.1b 5880a
York 0.24c 4.00d 6.7c 5182a
Marianna FL, 20113
Florida-07 8.73a 8.3a 94.4a 6230a
Georgia-07W 2.04b 8.5a 95.0a 5815ab
Tifguard 0.95b 7.0b 76.5b 5771ab
York 0.31b 6.6b 66.9b 5056bc
Tifton, 2011 3
Florida-07 1.45a 7.4a 80.82a 5119a
Georgia-06G 0.38a 8.1a 92.26a 4947a
Georgia-07W 0.92a 7.1a 73.95a 5119a
Tifguard 0.42a 5.3b 27.89b 5213a
Attapulgus, 20113
Florida-07 2.50a 7.1b 78.9a 6519a
Georgia-06G 0.70b 7.8a 89.5a 5827ab
Georgia-07W 1.38ab 7.5a 86.0a 5713b
Tifguard 0.55b 5.8b 45.0b 6167ab
Disease severity evaluated using the Florida 1-10 scale, where 1 = no leaf spot, and 10 =
plants completely defoliated and killed by leaf spot.
Means within the same column followed by the same letter are not significantly different (P
< 0.05) using LSMeans Student’s t-test comparisons. 1 Average : 30 cm of lateral stem stem
2 Final rating
3 Only non-treated replications
93
CHAPTER 5
CONCLUSIONS
The main objective of this research was to provide information on the relationship
between severity of leaf spot caused by Cercospora arachidicola or Cercosporidium personatum
(measured by defoliation and canopy reflectance) and yield that will be useful in making
decisions on what management inputs are necessary to prevent losses to leaf spot diseases on
new runner type-cultivars. Additional objectives were to determine the effect of new runner-type
cultivars on incidence stem lesions caused by C. arachidicola or C. personatum and to relate
those responses to the respective effects of those cultivars on severity of foliar symptoms caused
by those pathogens, and to evaluate field response to C. arachidicola and C. personatum of new
breeding lines developed as part of a USAID-CRSP project for developing peanut cultivars with
multiple pathogen resistance for use in the U.S. and in developing countries. The primary disease
investigated in these studies is Cercosporidium personatum
There was a reduction in yield and crop value with increasing defoliation in one or more
trials for all the cultivars evaluated except Tifguard. Georgia-06G had a linear reduction in yield
and crop value with increasing defoliation in all trials except Plains in 2011. Results from Tifton
and Attapulgus trials in 2011 corroborated previous reports that Tifguard has a moderate level of
resistance to C. personatum, and indicate that also is less prone to reduction in yield by leaf spot.
However, since the ranges of defoliation levels in Tifguard were considerably narrower, it cannot
be concluded that higher levels of defoliation would not result in similar losses to leaf spot.
There were no consistent differences in leaf spot severity among the other three cultivars.

94
Results indicate that canopy reflectance measurements (NDVI) can provide useful
assessments of relative levels of defoliation within cultivars, that relate to yield as well as do
visual assessments of defoliation. Canopy reflectance assessments are more objective, and
should be less prone to inter-rater variability than visual assessments. Our results corroborated
previous reports that canopy reflectance was correlated with levels of defoliation caused by leaf
spot. There were indications of differences in NDVI among cultivars in plots with little leaf spot.
Onsets of the epidemics in this study were relatively late in all experiments, so how
yields of these cultivars would be maintained in situations with defoliation incurred earlier is not
known. However, results from this study indicate that high levels of defoliation by late leaf spot
do not necessarily result in high levels of yield loss in these cultivars.
Our results corroborated previous reports of field resistance in Georganic, and in York,
and more moderate/intermediate resistance in C-99R and Tifguard. Under conditions of severe
leaf spot disease pressure University of Florida breeding lines (98x64-2-2-1-2b4-B, 97x45-HO1-
2-B2G-1-2-1-2, and 96x72-HO1-10-2-1-2-b4-B) and one CRSP breeding line (CRSP 192T) had
disease ratings that were not significantly different than resistant cultivars Georganic and York in
2010. In 2011 York and Georganic significantly less defoliation than these lines, but breeding
lines still had lower levels of defoliation than standard susceptible cultivars. The same year in
Marianna two Florida breeding lines (98x64-2-2-1-2b4-B and 96x72-HO1-10-2-1-2-b4-B) had
similar levels of defoliation as moderately resistant cultivars Tifguard and C-99R. The breeding
lines from Florida have moderate field resistance to C. personatum and potential for use in
production. None of the CRSP lines showed a high level of resistance to C. personatum , but
CRSP 1048-192T showed low to moderate field resistance across two years in Tifton. One of the
most promising breeding lines was 96x72-HO1-10-2-1-b4-B. That genotype was among the best

95
yielding lines in Marianna both years, along with lower levels of leaf spot. One or more of hese
breeding lines had better yields than the resistant cultivars Georganic and York.
This study corroborates a previous report that peanut cultivar can affect the incidence of
stem lesions caused by C. personatum. Incidence of stem lesions caused by C. personatum was
higher in Florida-07 than in Tifguard at Attapulgus, and higher than in Tifguard, York, and
Georgia-07W in both experiments at Mariana. Lower incidence of stem lesions in Tifguard and
York than in Florida-07 or Georgia-07W correspond with lower levels of defoliation in those
cultivars that have moderate levels of field resistance to C. personatum. However, incidence of
stem lesions in Georgia-07W was lower than in Florida-07 in two years at Marianna in which the
percent defoliation by leaf spot did not differ for those cultivars. Although Georgia-06 was
included in three of the trials, stem lesion incidence in those trials was too low to determine
conclusively the relative susceptibility of that cultivar.