Embed Size (px)
Citation preview
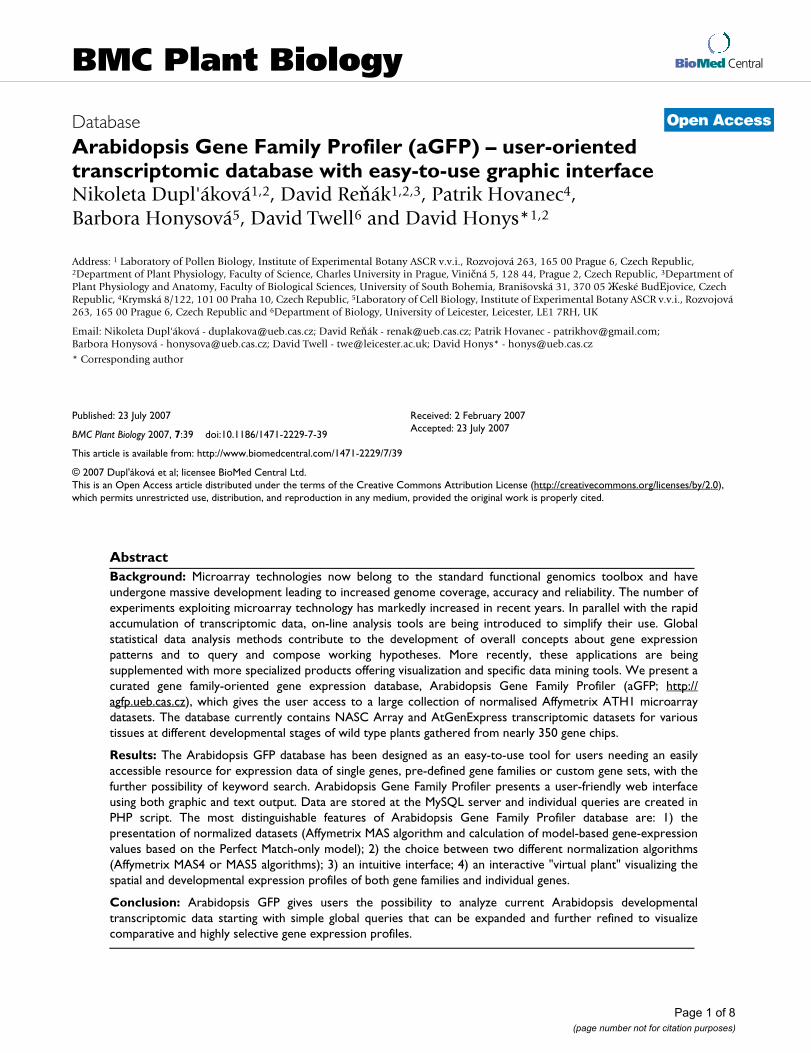
BioMed CentralBMC Plant Biology
ss
Open AcceDatabaseArabidopsis Gene Family Profiler (aGFP) – user-oriented transcriptomic database with easy-to-use graphic interfaceNikoleta Dupl'áková1,2, David Reňák1,2,3, Patrik Hovanec4, Barbora Honysová5, David Twell6 and David Honys*1,2Address: 1 Laboratory of Pollen Biology, Institute of Experimental Botany ASCR v.v.i., Rozvojová 263, 165 00 Prague 6, Czech Republic, 2Department of Plant Physiology, Faculty of Science, Charles University in Prague, Viničná 5, 128 44, Prague 2, Czech Republic, 3Department of Plant Physiology and Anatomy, Faculty of Biological Sciences, University of South Bohemia, Branišovská 31, 370 05 Жeské BudЕjovice, Czech Republic, 4Krymská 8/122, 101 00 Praha 10, Czech Republic, 5Laboratory of Cell Biology, Institute of Experimental Botany ASCR v.v.i., Rozvojová 263, 165 00 Prague 6, Czech Republic and 6Department of Biology, University of Leicester, Leicester, LE1 7RH, UK
Email: Nikoleta Dupl'áková - [email protected]; David Reňák - [email protected]; Patrik Hovanec - [email protected]; Barbora Honysová - [email protected]; David Twell - [email protected]; David Honys* - [email protected]
* Corresponding author
AbstractBackground: Microarray technologies now belong to the standard functional genomics toolbox and haveundergone massive development leading to increased genome coverage, accuracy and reliability. The number ofexperiments exploiting microarray technology has markedly increased in recent years. In parallel with the rapidaccumulation of transcriptomic data, on-line analysis tools are being introduced to simplify their use. Globalstatistical data analysis methods contribute to the development of overall concepts about gene expressionpatterns and to query and compose working hypotheses. More recently, these applications are beingsupplemented with more specialized products offering visualization and specific data mining tools. We present acurated gene family-oriented gene expression database, Arabidopsis Gene Family Profiler (aGFP; http://agfp.ueb.cas.cz), which gives the user access to a large collection of normalised Affymetrix ATH1 microarraydatasets. The database currently contains NASC Array and AtGenExpress transcriptomic datasets for varioustissues at different developmental stages of wild type plants gathered from nearly 350 gene chips.
Results: The Arabidopsis GFP database has been designed as an easy-to-use tool for users needing an easilyaccessible resource for expression data of single genes, pre-defined gene families or custom gene sets, with thefurther possibility of keyword search. Arabidopsis Gene Family Profiler presents a user-friendly web interfaceusing both graphic and text output. Data are stored at the MySQL server and individual queries are created inPHP script. The most distinguishable features of Arabidopsis Gene Family Profiler database are: 1) thepresentation of normalized datasets (Affymetrix MAS algorithm and calculation of model-based gene-expressionvalues based on the Perfect Match-only model); 2) the choice between two different normalization algorithms(Affymetrix MAS4 or MAS5 algorithms); 3) an intuitive interface; 4) an interactive "virtual plant" visualizing thespatial and developmental expression profiles of both gene families and individual genes.
Conclusion: Arabidopsis GFP gives users the possibility to analyze current Arabidopsis developmentaltranscriptomic data starting with simple global queries that can be expanded and further refined to visualizecomparative and highly selective gene expression profiles.
Published: 23 July 2007
BMC Plant Biology 2007, 7:39 doi:10.1186/1471-2229-7-39
Received: 2 February 2007Accepted: 23 July 2007
This article is available from: http://www.biomedcentral.com/1471-2229/7/39
© 2007 Dupl'áková et al; licensee BioMed Central Ltd. This is an Open Access article distributed under the terms of the Creative Commons Attribution License (http://creativecommons.org/licenses/by/2.0), which permits unrestricted use, distribution, and reproduction in any medium, provided the original work is properly cited.
Page 1 of 8(page number not for citation purposes)
BMC Plant Biology 2007, 7:39 http://www.biomedcentral.com/1471-2229/7/39
BackgroundCompletion and annotation of the Arabidopsis thalianagenome represented a major step in plant genetic research[1]. This knowledge enabled gene prediction, assignmentof functional categories and gave an opportunity to studygene and chromosome organization including the distri-bution of transposable elements. Finally it has enabledthe characterization of global gene expression patterns atthe transcriptome level at different developmental stagesand under various physiological and stress conditions.Efforts to reveal the biological functions of thousand ofgenes and their integration into proteome, metabolomeand interactome networks has become the principal focusof many studies and represents key objective of the 2010Project [2]
A number of efficient and accurate gene expression analy-sis technologies to determine the expression levels of indi-vidual genes have been widely exploited in recent decades(Northern blot analysis, quantitative reverse transcrip-tion-PCR, cDNA library screening). Most of these meth-ods enable analysis of the expression of single or relativelyfew selected genes. For the discovery of partial or wholegene functional or regulatory networks, the developmentof high-throughput technologies is essential withgenome-wide transcriptomic studies providing a majorinput [3]. Several such methods have been developedincluding, cDNA fingerprinting [4], serial analysis of geneexpression – SAGE [5], massively parallel signaturesequencing – MPSS [6], high-density DNA oligonucle-otide probe microarrays [7,8] or cDNA arrays [9]. DNAmicroarray technologies are among the most frequentlyused methods for parallel global analysis of gene expres-sion. These methods are based on the principle of selec-tive and differential hybridization between sample targetmolecules and immobilized DNA probes. Hybridisationto probes arrayed on a solid surface report the relativeabundance of DNA or RNA target molecules by fluores-cent signal detection [10,11]. Microarray technologiesnow belong to the standard functional genomics toolbox[12,13] and have undergone massive development lead-ing to increased genome coverage, accuracy and reliabil-ity. Whole Genome microarrays developed by Affymetrix(Santa Clara, CA, USA) in collaboration with Syngentarepresented the first standard in genome wide transcrip-tomic studies in plants. Whole genome Affymetrix ATH1GeneChips cover about 76% of the Arabidopsis thalianagenes [14]. Moreover, the introduction of the MinimumInformation About Microarray experiments (MIAME) asstandard documentation for array experiments and intranscriptomic databases, increasing the value and com-parability of microarray data [15].
The number of experiments exploiting microarray tech-nology has markedly increased in recent years. Not sur-
prisingly, there are potential difficulties in navigatingbetween different available data sets. Microarray expres-sion data are deposited on servers, many of which arepublicly accessible. Public plant microarray data aredeposited in several databases including ArrayExpress[16], GEO [17], NASCarrays [18] and the Stanford Micro-array Database [19-21]. Currently these databases storeseveral thousands of individual datasets and some ofthese offer on-line tools for data normalization, filtering,statistical testing and pattern discovery [22-26].
In parallel with the rapid accumulation of transcriptomicdata, on-line analysis tools are being introduced to sim-plify their use. Global statistical data analysis methodscontribute to the identification of overall gene expressionpatterns and to query and compose new working hypoth-eses based on these findings [11,12,27,28]. More recently,these applications are being supplemented with more spe-cialized products offering visualization and specific datamining tools. Genevestigator, Botany Array Resource, Ara-bidopsis co-expression tool, and Expression Profiler offerWeb-based tools to analyse large microarray datasets.Genevestigator offers two types of queries: a gene-centricapproach and a genome-centric approach, which are rep-resented by several analysis tools; Gene Correlator, GeneAtlas, Gene Chronologer, Response Viewer and the Meta-Analyzer, that is among the most sophisticated complexamongst available microarray analysis toolboxes [29,30].Botany Array Resource offers similar services supple-mented with tools for discovery and analyses of cis-ele-ments in promoters [31]. Expression Profiler (EP)provides tools for hierarchical and K-groups clustering,clustering comparison, similarity search or the signaturealgorithm [32,33]. The more specialized PathoPlant data-base on plant-pathogen interactions and components ofsignal transduction pathways related to plant pathogene-sis also harbors gene expression data from Arabidopsis thal-iana microarray experiments to enable searching forspecific genes regulated upon pathogen infection or elici-tor treatment [34,35]. Finally, Arabidopsis Co-ExpressionTool (ACT) allows users to identify genes with expressionpatterns correlated across selected experiments or thecomplete data set and offers the novel clique finder tool[36-38].
In this article we introduce Arabidopsis Gene Family Pro-filer (arabidopsisGFP, aGFP), a web-based gene expres-sion database with visualization tools. Duringprogramming, we took into account that for many micro-array data users, extraction of global expression patternsof single genes or gene families can be time-consumingand its visualization difficult. Moreover, the use of variousnormalization algorithms in individual experimentsmakes direct comparison of genes of interest within vari-ous datasets uncertain. To solve these issues, we devel-
Page 2 of 8(page number not for citation purposes)
BMC Plant Biology 2007, 7:39 http://www.biomedcentral.com/1471-2229/7/39
oped aGFP to provide the user with two normalizationand gene detection algorithms and a "virtual plant" Arabi-dopsis Gene Family Profiler facility that enables users toobtain a global expression profile of user specified and/orpre-defined gene families. These attributes of aGFP con-tribute a useful resource for the rapid bioinformatic anal-ysis of Arabidopsis gene expression data throughcomparative expression profile analysis in a gene family-based context.
Construction and contentThe Arabidopsis Gene Family Profiler (aGFP) databasewas designed to give users the possibility to visualizeexpression patterns of individual genes, pre-defined genefamilies or user-defined gene sets in various tissues and atdifferent developmental stages of wild type Arabidopsisthaliana plants. aGFP largely exploits microarray experi-ments obtained through the NASC AffyWatch transcrip-tomics service [39]. We adopted the general concept"from simple to complex". In the first approximation, anarithmetical mean expression signal from multiple exper-iments is displayed. In subsequent steps the user canchoose to display expression data for individual plantorgans or tissues at particular growth stages. This is accom-panied by the option of progressive replacement of arith-metical means by individual expression values. So theuser has the option to choose the different levels of visu-alization to suit needs. Finally, the user can switch from"virtual plant" visualization to a simple bar chart (stand-ard or log-scaled) or tabulated display and can browsethrough individual experiments down to normalized oreven raw data extracted from individual gene chips. Genefamily data can also be visualized as a colorized spotchart.
Although the idea of web-based database tools is notnovel, aGFP database offers a quick and interactive dis-play of gene expression profiles using the virtual plantfacility as well as alternate more conventional outputs. Anovel feature of aGFP is that it enables the evaluation ofthe impact of normalization procedures on microarrayexpression data as well the possibility of rapid definitionof user-defined families or gene groups. Simultaneously,aGFP serves as a facile and synoptic developmental refer-ence guide for expression profiles of individual genes orgene families in wild-type Arabidopsis thaliana plants.
Data resourcesThe arabidopsisGFP database covers transcriptomic exper-iments accumulated from wild type Arabidopsis thalianaplants of various ecotypes grown under normal physio-logical conditions. Original raw microarray data wereobtained from Nottingham Arabidopsis Stock Centre(NASC) through the AffyWatch service [39]. In order toensure the quality and compatibility of expression data
only microarray experiments using Affymetrix ATH1whole genome arrays with at least two biological repli-cates were included. To date, arabidopsisGFP databasecovers transcriptomic data from 345 microarrays covering120 experiments.
ProgrammingaGFP is composed as a relational MySQL database andWeb server application, which is programmed in PHPscript language [PHP:Hypertext Preprocessor]. Geneexpression data are presented by dynamic HTML webpages with several types of graphic output. Graphs weregenerated using PHP module jpgraph [40]. HTML codewas programmed to be correctly displayed in all com-monly used internet browsers (Microsoft InternetExplorer/Mozilla Firefox/Opera). The user exploits a web-based interface for acquisition of custom-defined data. Auser-friendly intuitive web-based interface is designed toenable simple and rapid navigation in aGFP. The aGFPdatabase was created using general-to-specific strategyenabling the user to obtain a certain amount of informa-tion at every step with progressive targeted specification asthe query develops.
Data normalizationAll gametophytic and sporophytic datasets were normal-ized using freely available dChip 1.3 software [41]. Thereliability and reproducibility of datasets was ensured bythe use of duplicate or triplicate hybridization data ineach experiment, normalization of all arrays to themedian probe intensity and the use of normalized CELintensities of all arrays for the calculation of model-basedgene-expression values based on the Perfect Match-onlymodel [42,43]. A given gene was scored as 'expressed'when it gave a reliable expression signal in all replicates.An expression signal value of '0' means that the detectioncall value was 'absent' or 'marginal' in at least one repli-cate provided. In arabidopsisGFP, the facility is providedto instantly switch between transcriptomic data normal-ized by two different algorithms – MAS 5.0 or MAS 4.0.
Annotation pagesAnnotation of individual experiments is in accordancewith MIAME standard [15]. Arabidopsis thaliana growthstages were according to Boyes et al. [44]. Affymetrix genechips harbour several oligonucleotide probe types – prev-alent unique probe sets (_at) accompanied by identicalprobe sets (_s set) and probes in a mixed probe set (_xset). Moreover, progressive Arabidopsis genome annota-tion has led to a reduction in the number of unique probesets that has resulted in a reduction in the number of reli-ably 'present' genes. For these reasons, genes representedby these ambiguous probe sets were not included in thedatabase [45]. This fact was taken into account and theaGFP database is regularly updated. Each locus in aGFP
Page 3 of 8(page number not for citation purposes)
BMC Plant Biology 2007, 7:39 http://www.biomedcentral.com/1471-2229/7/39
database is associated with relevant annotation releasedby TAIR (currently version 6) [46], and direct links toother web resources are available for each gene – TIGR[47,48], MPSS [49], TAIR [50,51], MIPS [52,53].
Definition of gene families and superfamiliesarabidopsisGFP contains lists of pre-defined gene familiesand superfamilies enabling the rapid comparative visuali-zation of expression profiles of their members. Genes inarabidopsisGFP are organized into two hierarchical levelsconsisting of gene families and superfamilies. All datawere assembled from various relevant resources, themajority from TAIR – Arabidopsis Gene Family Informa-tion [54] and AGRIS [55,56]. Gene families were furtherorganized in a different manner as gene family subclassesto different extent in each family and source. In order tosimplify the different sub-divisions from different datasources, we rearranged them carefully and used only twolevels, gene family and superfamily.
Utility and discussionData selectionAt the aGFP home page, the user can select the search cat-egory (AGI number, BAC locus, Gene name, keyword)and two other input parameters; the gene detection algo-rithm (MAS4.0 or MAS5.0) and the source of expressiondata (AtGenExpress or NASCArrays). To make aGFP ascomfortable as possible to use, at any stage of the querythe user has the possibility to directly switch optionsbetween these pairs of parameters. This represents a dis-tinct feature of the aGFP database that enables direct com-parison of the influence of the detection algorithm or dataresource on expression profiles.
aGFP database presents data normalised using two differ-ent algorithms, empirical MAS 4.0 and statistical MAS 5.0.Although MAS4.0 is believed to yields more false-positivecalls [57], our analyses of four developmental stages ofpollen development showed that the MAS5.0 detectionalgorithm tended to eliminate a number of genes origi-nally detected as expressed by MAS4.0 and which wereexperimentally verified to be so [58]. This was often thecase even for highly expressed genes (B. Honysová and D.Honys, unpublished results), highlighting the addedvalue of the empirical MAS4.0 detection algorithm andcomparative analysis.
Experiments included in the aGFP database are presentedin two different subsets. The first subset contains dataobtained within a scope of the AtGenExpress project [59],the second comprises all other datasets deposited at NASCand was labeled NASCArrays [26]. The reason for this sep-aration was that AtGenExpress contains a structured set ofexperiments, involving Columbia-0 plants grown undercomparable conditions to provide a gene expression atlas
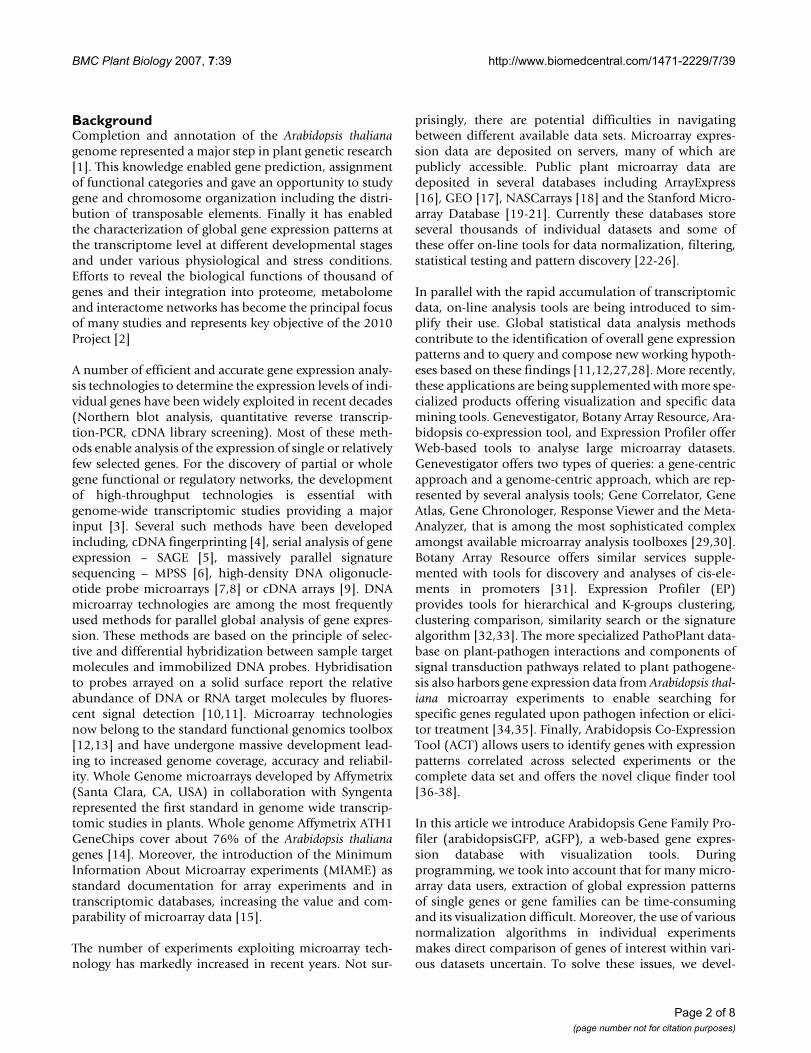
at several developmental stages. On the contrary, NAS-CArrays contains experiments carried out in various eco-types grown under various conditions. Data in each subsetare presented using several different graphical displaysand, the user has an option to instantly switch betweensubsets in each environment (Fig. 1).
The other key feature of aGFP is the possibility to selectpre-defined gene families and superfamilies. In subse-quent steps, expression data for family members can beextracted down to the level of individual genes. Moreover,the user has also the possibility to work with custom-defined gene sets based on various search options (AGInumber, Gene number, BAC locus, keyword search).
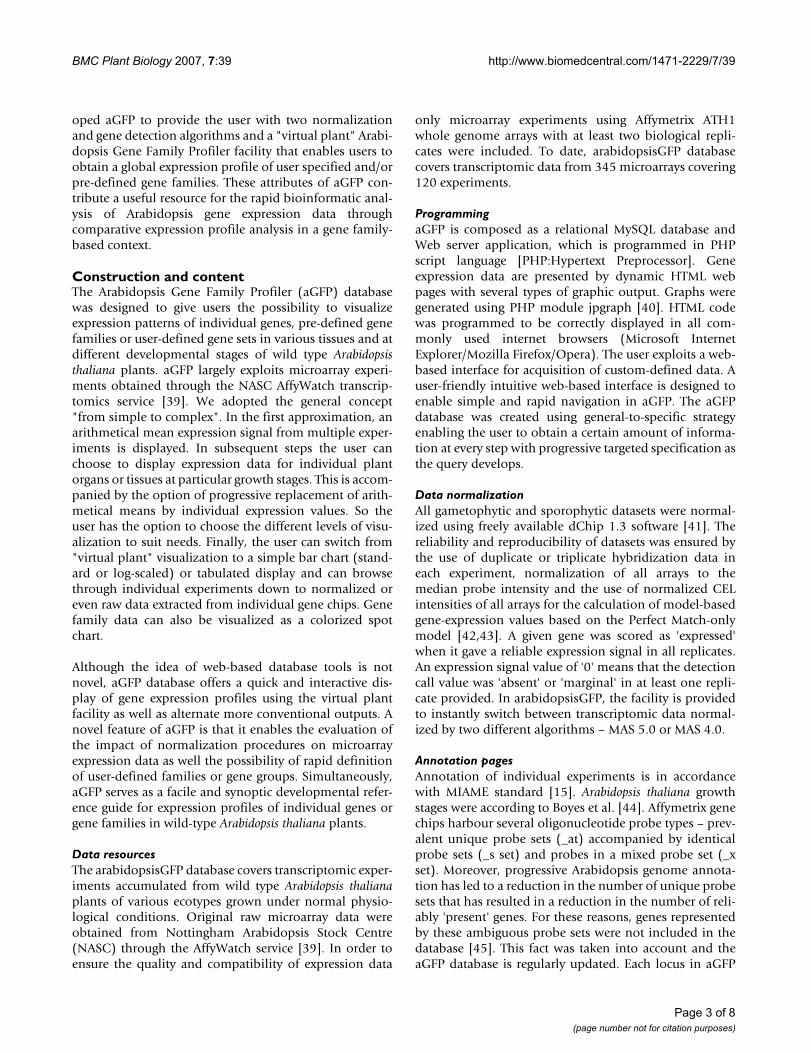
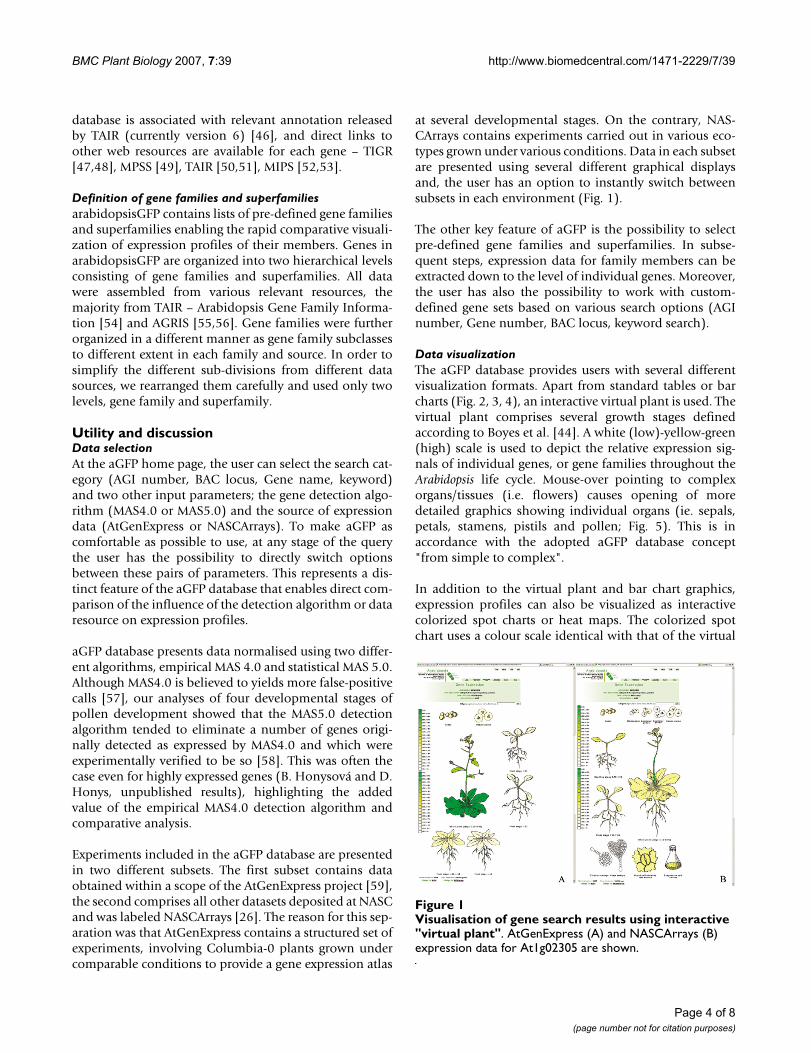
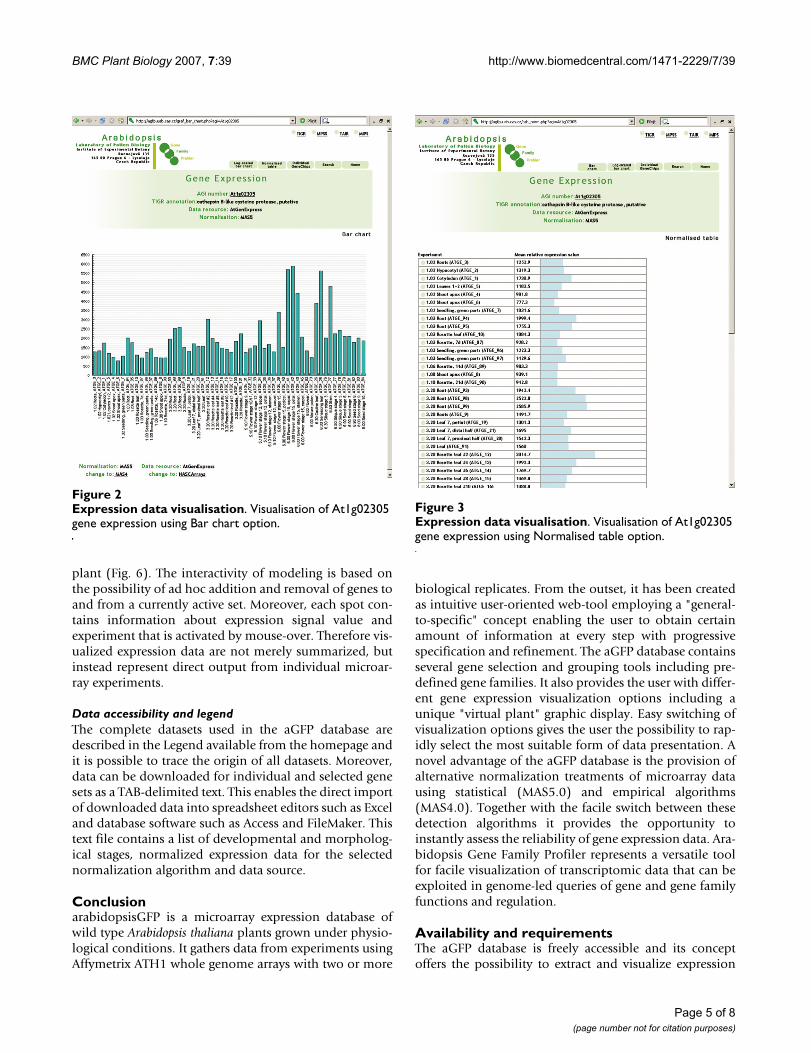
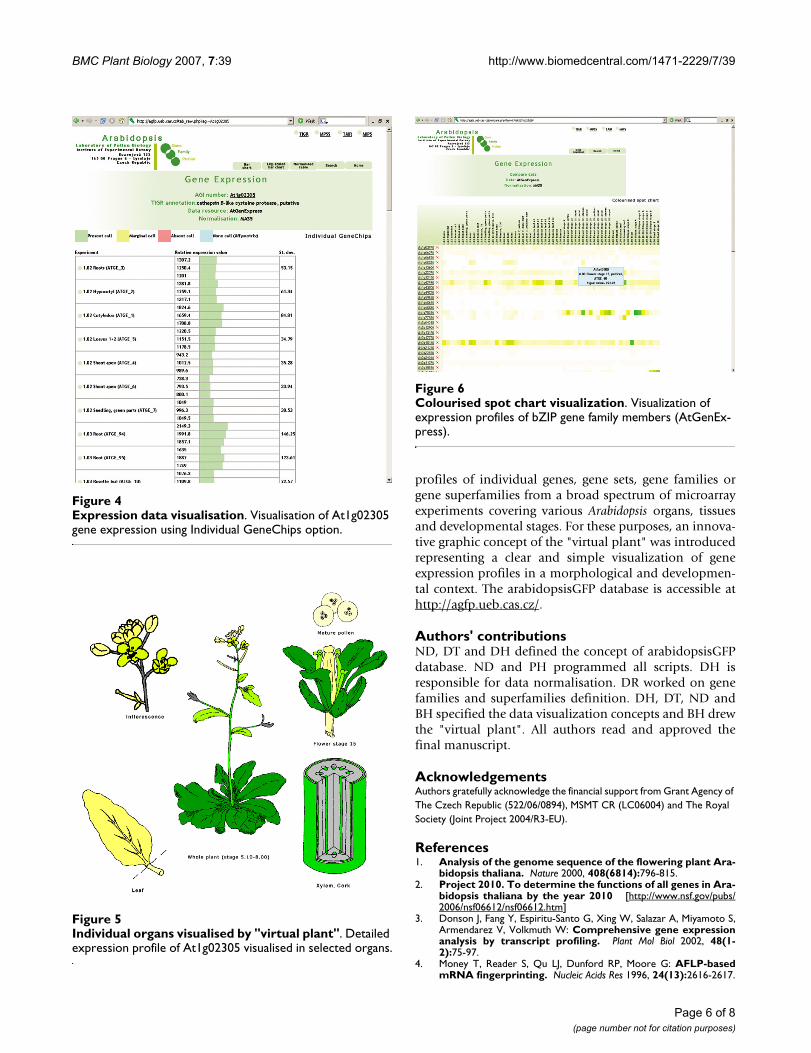
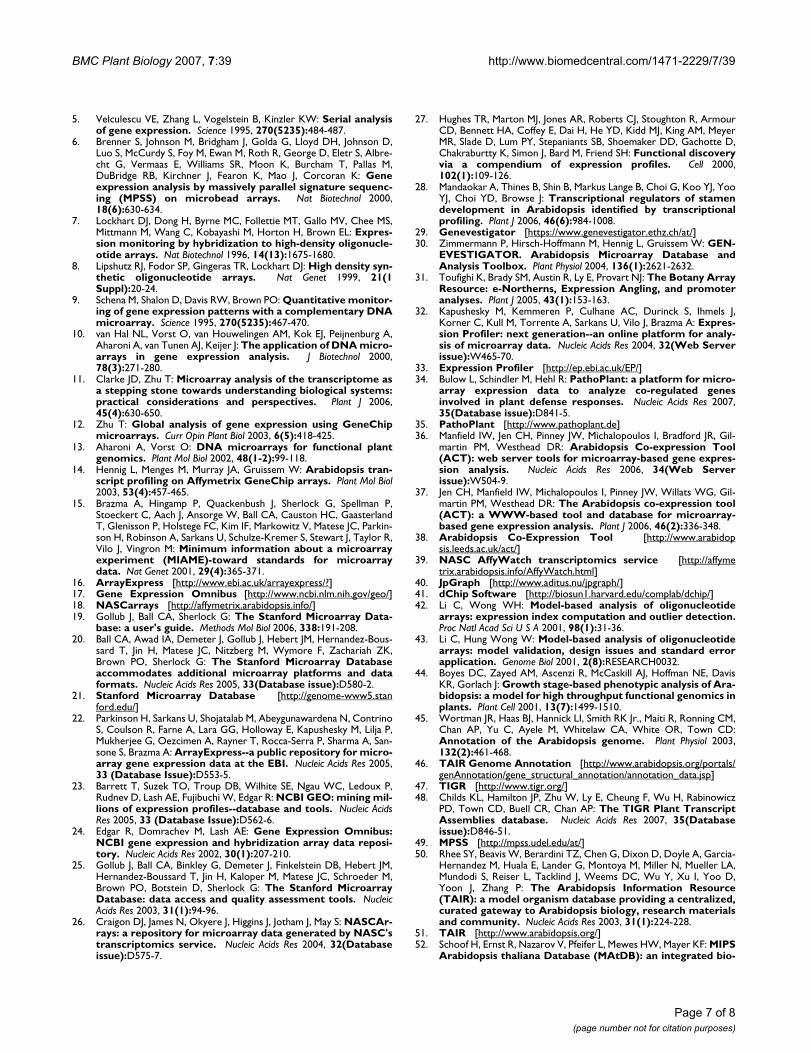
Data visualizationThe aGFP database provides users with several differentvisualization formats. Apart from standard tables or barcharts (Fig. 2, 3, 4), an interactive virtual plant is used. Thevirtual plant comprises several growth stages definedaccording to Boyes et al. [44]. A white (low)-yellow-green(high) scale is used to depict the relative expression sig-nals of individual genes, or gene families throughout theArabidopsis life cycle. Mouse-over pointing to complexorgans/tissues (i.e. flowers) causes opening of moredetailed graphics showing individual organs (ie. sepals,petals, stamens, pistils and pollen; Fig. 5). This is inaccordance with the adopted aGFP database concept"from simple to complex".
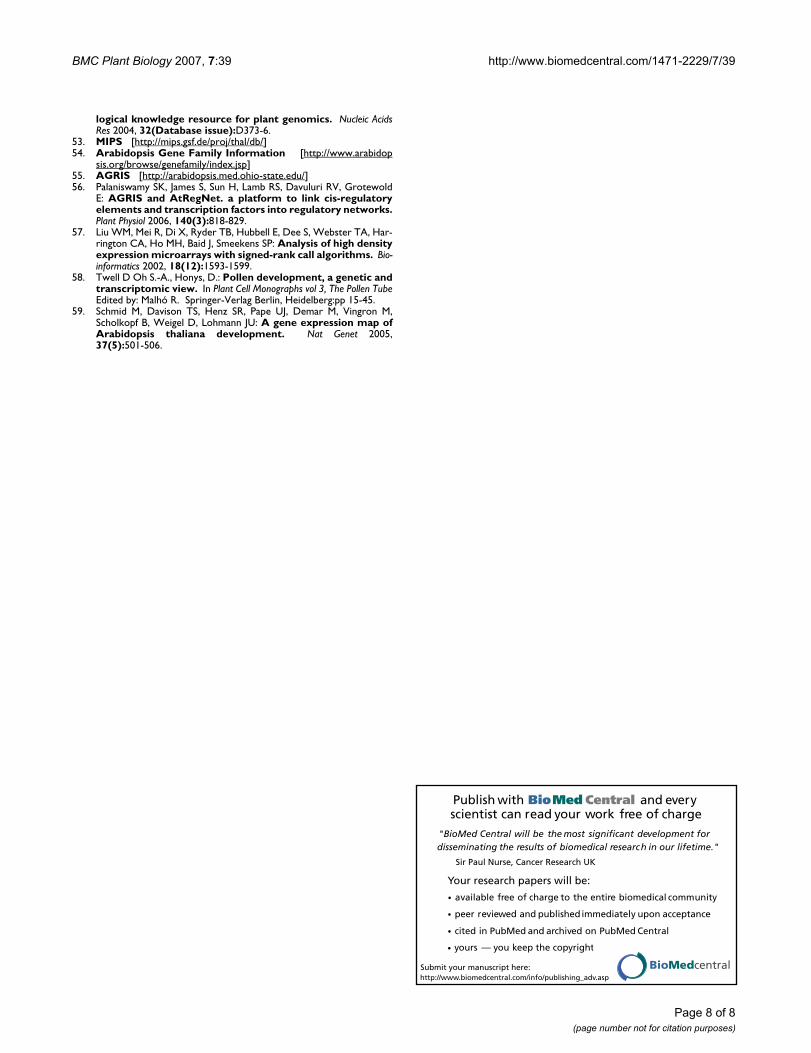
In addition to the virtual plant and bar chart graphics,expression profiles can also be visualized as interactivecolorized spot charts or heat maps. The colorized spotchart uses a colour scale identical with that of the virtual
Visualisation of gene search results using interactive "virtual plant"Figure 1Visualisation of gene search results using interactive "virtual plant". AtGenExpress (A) and NASCArrays (B) expression data for At1g02305 are shown.
Page 4 of 8(page number not for citation purposes)
BMC Plant Biology 2007, 7:39 http://www.biomedcentral.com/1471-2229/7/39
plant (Fig. 6). The interactivity of modeling is based onthe possibility of ad hoc addition and removal of genes toand from a currently active set. Moreover, each spot con-tains information about expression signal value andexperiment that is activated by mouse-over. Therefore vis-ualized expression data are not merely summarized, butinstead represent direct output from individual microar-ray experiments.
Data accessibility and legendThe complete datasets used in the aGFP database aredescribed in the Legend available from the homepage andit is possible to trace the origin of all datasets. Moreover,data can be downloaded for individual and selected genesets as a TAB-delimited text. This enables the direct importof downloaded data into spreadsheet editors such as Exceland database software such as Access and FileMaker. Thistext file contains a list of developmental and morpholog-ical stages, normalized expression data for the selectednormalization algorithm and data source.
ConclusionarabidopsisGFP is a microarray expression database ofwild type Arabidopsis thaliana plants grown under physio-logical conditions. It gathers data from experiments usingAffymetrix ATH1 whole genome arrays with two or more
biological replicates. From the outset, it has been createdas intuitive user-oriented web-tool employing a "general-to-specific" concept enabling the user to obtain certainamount of information at every step with progressivespecification and refinement. The aGFP database containsseveral gene selection and grouping tools including pre-defined gene families. It also provides the user with differ-ent gene expression visualization options including aunique "virtual plant" graphic display. Easy switching ofvisualization options gives the user the possibility to rap-idly select the most suitable form of data presentation. Anovel advantage of the aGFP database is the provision ofalternative normalization treatments of microarray datausing statistical (MAS5.0) and empirical algorithms(MAS4.0). Together with the facile switch between thesedetection algorithms it provides the opportunity toinstantly assess the reliability of gene expression data. Ara-bidopsis Gene Family Profiler represents a versatile toolfor facile visualization of transcriptomic data that can beexploited in genome-led queries of gene and gene familyfunctions and regulation.
Availability and requirementsThe aGFP database is freely accessible and its conceptoffers the possibility to extract and visualize expression
Expression data visualisationFigure 2Expression data visualisation. Visualisation of At1g02305 gene expression using Bar chart option.
Expression data visualisationFigure 3Expression data visualisation. Visualisation of At1g02305 gene expression using Normalised table option.
Page 5 of 8(page number not for citation purposes)
BMC Plant Biology 2007, 7:39 http://www.biomedcentral.com/1471-2229/7/39
profiles of individual genes, gene sets, gene families orgene superfamilies from a broad spectrum of microarrayexperiments covering various Arabidopsis organs, tissuesand developmental stages. For these purposes, an innova-tive graphic concept of the "virtual plant" was introducedrepresenting a clear and simple visualization of geneexpression profiles in a morphological and developmen-tal context. The arabidopsisGFP database is accessible athttp://agfp.ueb.cas.cz/.
Authors' contributionsND, DT and DH defined the concept of arabidopsisGFPdatabase. ND and PH programmed all scripts. DH isresponsible for data normalisation. DR worked on genefamilies and superfamilies definition. DH, DT, ND andBH specified the data visualization concepts and BH drewthe "virtual plant". All authors read and approved thefinal manuscript.
AcknowledgementsAuthors gratefully acknowledge the financial support from Grant Agency of The Czech Republic (522/06/0894), MSMT CR (LC06004) and The Royal Society (Joint Project 2004/R3-EU).
References1. Analysis of the genome sequence of the flowering plant Ara-
bidopsis thaliana. Nature 2000, 408(6814):796-815.2. Project 2010. To determine the functions of all genes in Ara-
bidopsis thaliana by the year 2010 [http://www.nsf.gov/pubs/2006/nsf06612/nsf06612.htm]
3. Donson J, Fang Y, Espiritu-Santo G, Xing W, Salazar A, Miyamoto S,Armendarez V, Volkmuth W: Comprehensive gene expressionanalysis by transcript profiling. Plant Mol Biol 2002, 48(1-2):75-97.
4. Money T, Reader S, Qu LJ, Dunford RP, Moore G: AFLP-basedmRNA fingerprinting. Nucleic Acids Res 1996, 24(13):2616-2617.
Colourised spot chart visualizationFigure 6Colourised spot chart visualization. Visualization of expression profiles of bZIP gene family members (AtGenEx-press).
Expression data visualisationFigure 4Expression data visualisation. Visualisation of At1g02305 gene expression using Individual GeneChips option.
Individual organs visualised by "virtual plant"Figure 5Individual organs visualised by "virtual plant". Detailed expression profile of At1g02305 visualised in selected organs.
Page 6 of 8(page number not for citation purposes)
BMC Plant Biology 2007, 7:39 http://www.biomedcentral.com/1471-2229/7/39
5. Velculescu VE, Zhang L, Vogelstein B, Kinzler KW: Serial analysisof gene expression. Science 1995, 270(5235):484-487.
6. Brenner S, Johnson M, Bridgham J, Golda G, Lloyd DH, Johnson D,Luo S, McCurdy S, Foy M, Ewan M, Roth R, George D, Eletr S, Albre-cht G, Vermaas E, Williams SR, Moon K, Burcham T, Pallas M,DuBridge RB, Kirchner J, Fearon K, Mao J, Corcoran K: Geneexpression analysis by massively parallel signature sequenc-ing (MPSS) on microbead arrays. Nat Biotechnol 2000,18(6):630-634.
7. Lockhart DJ, Dong H, Byrne MC, Follettie MT, Gallo MV, Chee MS,Mittmann M, Wang C, Kobayashi M, Horton H, Brown EL: Expres-sion monitoring by hybridization to high-density oligonucle-otide arrays. Nat Biotechnol 1996, 14(13):1675-1680.
8. Lipshutz RJ, Fodor SP, Gingeras TR, Lockhart DJ: High density syn-thetic oligonucleotide arrays. Nat Genet 1999, 21(1Suppl):20-24.
9. Schena M, Shalon D, Davis RW, Brown PO: Quantitative monitor-ing of gene expression patterns with a complementary DNAmicroarray. Science 1995, 270(5235):467-470.
10. van Hal NL, Vorst O, van Houwelingen AM, Kok EJ, Peijnenburg A,Aharoni A, van Tunen AJ, Keijer J: The application of DNA micro-arrays in gene expression analysis. J Biotechnol 2000,78(3):271-280.
11. Clarke JD, Zhu T: Microarray analysis of the transcriptome asa stepping stone towards understanding biological systems:practical considerations and perspectives. Plant J 2006,45(4):630-650.
12. Zhu T: Global analysis of gene expression using GeneChipmicroarrays. Curr Opin Plant Biol 2003, 6(5):418-425.
13. Aharoni A, Vorst O: DNA microarrays for functional plantgenomics. Plant Mol Biol 2002, 48(1-2):99-118.
14. Hennig L, Menges M, Murray JA, Gruissem W: Arabidopsis tran-script profiling on Affymetrix GeneChip arrays. Plant Mol Biol2003, 53(4):457-465.
15. Brazma A, Hingamp P, Quackenbush J, Sherlock G, Spellman P,Stoeckert C, Aach J, Ansorge W, Ball CA, Causton HC, GaasterlandT, Glenisson P, Holstege FC, Kim IF, Markowitz V, Matese JC, Parkin-son H, Robinson A, Sarkans U, Schulze-Kremer S, Stewart J, Taylor R,Vilo J, Vingron M: Minimum information about a microarrayexperiment (MIAME)-toward standards for microarraydata. Nat Genet 2001, 29(4):365-371.
16. ArrayExpress [http://www.ebi.ac.uk/arrayexpress/?]17. Gene Expression Omnibus [http://www.ncbi.nlm.nih.gov/geo/]18. NASCarrays [http://affymetrix.arabidopsis.info/]19. Gollub J, Ball CA, Sherlock G: The Stanford Microarray Data-
base: a user's guide. Methods Mol Biol 2006, 338:191-208.20. Ball CA, Awad IA, Demeter J, Gollub J, Hebert JM, Hernandez-Bous-
sard T, Jin H, Matese JC, Nitzberg M, Wymore F, Zachariah ZK,Brown PO, Sherlock G: The Stanford Microarray Databaseaccommodates additional microarray platforms and dataformats. Nucleic Acids Res 2005, 33(Database issue):D580-2.
21. Stanford Microarray Database [http://genome-www5.stanford.edu/]
22. Parkinson H, Sarkans U, Shojatalab M, Abeygunawardena N, ContrinoS, Coulson R, Farne A, Lara GG, Holloway E, Kapushesky M, Lilja P,Mukherjee G, Oezcimen A, Rayner T, Rocca-Serra P, Sharma A, San-sone S, Brazma A: ArrayExpress--a public repository for micro-array gene expression data at the EBI. Nucleic Acids Res 2005,33 (Database Issue):D553-5.
23. Barrett T, Suzek TO, Troup DB, Wilhite SE, Ngau WC, Ledoux P,Rudnev D, Lash AE, Fujibuchi W, Edgar R: NCBI GEO: mining mil-lions of expression profiles--database and tools. Nucleic AcidsRes 2005, 33 (Database Issue):D562-6.
24. Edgar R, Domrachev M, Lash AE: Gene Expression Omnibus:NCBI gene expression and hybridization array data reposi-tory. Nucleic Acids Res 2002, 30(1):207-210.
25. Gollub J, Ball CA, Binkley G, Demeter J, Finkelstein DB, Hebert JM,Hernandez-Boussard T, Jin H, Kaloper M, Matese JC, Schroeder M,Brown PO, Botstein D, Sherlock G: The Stanford MicroarrayDatabase: data access and quality assessment tools. NucleicAcids Res 2003, 31(1):94-96.
26. Craigon DJ, James N, Okyere J, Higgins J, Jotham J, May S: NASCAr-rays: a repository for microarray data generated by NASC'stranscriptomics service. Nucleic Acids Res 2004, 32(Databaseissue):D575-7.
27. Hughes TR, Marton MJ, Jones AR, Roberts CJ, Stoughton R, ArmourCD, Bennett HA, Coffey E, Dai H, He YD, Kidd MJ, King AM, MeyerMR, Slade D, Lum PY, Stepaniants SB, Shoemaker DD, Gachotte D,Chakraburtty K, Simon J, Bard M, Friend SH: Functional discoveryvia a compendium of expression profiles. Cell 2000,102(1):109-126.
28. Mandaokar A, Thines B, Shin B, Markus Lange B, Choi G, Koo YJ, YooYJ, Choi YD, Browse J: Transcriptional regulators of stamendevelopment in Arabidopsis identified by transcriptionalprofiling. Plant J 2006, 46(6):984-1008.
29. Genevestigator [https://www.genevestigator.ethz.ch/at/]30. Zimmermann P, Hirsch-Hoffmann M, Hennig L, Gruissem W: GEN-
EVESTIGATOR. Arabidopsis Microarray Database andAnalysis Toolbox. Plant Physiol 2004, 136(1):2621-2632.
31. Toufighi K, Brady SM, Austin R, Ly E, Provart NJ: The Botany ArrayResource: e-Northerns, Expression Angling, and promoteranalyses. Plant J 2005, 43(1):153-163.
32. Kapushesky M, Kemmeren P, Culhane AC, Durinck S, Ihmels J,Korner C, Kull M, Torrente A, Sarkans U, Vilo J, Brazma A: Expres-sion Profiler: next generation--an online platform for analy-sis of microarray data. Nucleic Acids Res 2004, 32(Web Serverissue):W465-70.
33. Expression Profiler [http://ep.ebi.ac.uk/EP/]34. Bulow L, Schindler M, Hehl R: PathoPlant: a platform for micro-
array expression data to analyze co-regulated genesinvolved in plant defense responses. Nucleic Acids Res 2007,35(Database issue):D841-5.
35. PathoPlant [http://www.pathoplant.de]36. Manfield IW, Jen CH, Pinney JW, Michalopoulos I, Bradford JR, Gil-
martin PM, Westhead DR: Arabidopsis Co-expression Tool(ACT): web server tools for microarray-based gene expres-sion analysis. Nucleic Acids Res 2006, 34(Web Serverissue):W504-9.
37. Jen CH, Manfield IW, Michalopoulos I, Pinney JW, Willats WG, Gil-martin PM, Westhead DR: The Arabidopsis co-expression tool(ACT): a WWW-based tool and database for microarray-based gene expression analysis. Plant J 2006, 46(2):336-348.
38. Arabidopsis Co-Expression Tool [http://www.arabidopsis.leeds.ac.uk/act/]
39. NASC AffyWatch transcriptomics service [http://affymetrix.arabidopsis.info/AffyWatch.html]
40. JpGraph [http://www.aditus.nu/jpgraph/]41. dChip Software [http://biosun1.harvard.edu/complab/dchip/]42. Li C, Wong WH: Model-based analysis of oligonucleotide
arrays: expression index computation and outlier detection.Proc Natl Acad Sci U S A 2001, 98(1):31-36.
43. Li C, Hung Wong W: Model-based analysis of oligonucleotidearrays: model validation, design issues and standard errorapplication. Genome Biol 2001, 2(8):RESEARCH0032.
44. Boyes DC, Zayed AM, Ascenzi R, McCaskill AJ, Hoffman NE, DavisKR, Gorlach J: Growth stage-based phenotypic analysis of Ara-bidopsis: a model for high throughput functional genomics inplants. Plant Cell 2001, 13(7):1499-1510.
45. Wortman JR, Haas BJ, Hannick LI, Smith RK Jr., Maiti R, Ronning CM,Chan AP, Yu C, Ayele M, Whitelaw CA, White OR, Town CD:Annotation of the Arabidopsis genome. Plant Physiol 2003,132(2):461-468.
46. TAIR Genome Annotation [http://www.arabidopsis.org/portals/genAnnotation/gene_structural_annotation/annotation_data.jsp]
47. TIGR [http://www.tigr.org/]48. Childs KL, Hamilton JP, Zhu W, Ly E, Cheung F, Wu H, Rabinowicz
PD, Town CD, Buell CR, Chan AP: The TIGR Plant TranscriptAssemblies database. Nucleic Acids Res 2007, 35(Databaseissue):D846-51.
49. MPSS [http://mpss.udel.edu/at/]50. Rhee SY, Beavis W, Berardini TZ, Chen G, Dixon D, Doyle A, Garcia-
Hernandez M, Huala E, Lander G, Montoya M, Miller N, Mueller LA,Mundodi S, Reiser L, Tacklind J, Weems DC, Wu Y, Xu I, Yoo D,Yoon J, Zhang P: The Arabidopsis Information Resource(TAIR): a model organism database providing a centralized,curated gateway to Arabidopsis biology, research materialsand community. Nucleic Acids Res 2003, 31(1):224-228.
51. TAIR [http://www.arabidopsis.org/]52. Schoof H, Ernst R, Nazarov V, Pfeifer L, Mewes HW, Mayer KF: MIPS
Arabidopsis thaliana Database (MAtDB): an integrated bio-
Page 7 of 8(page number not for citation purposes)
BMC Plant Biology 2007, 7:39 http://www.biomedcentral.com/1471-2229/7/39
Publish with BioMed Central and every scientist can read your work free of charge
"BioMed Central will be the most significant development for disseminating the results of biomedical research in our lifetime."
Sir Paul Nurse, Cancer Research UK
Your research papers will be:
available free of charge to the entire biomedical community
peer reviewed and published immediately upon acceptance
cited in PubMed and archived on PubMed Central
yours — you keep the copyright
Submit your manuscript here:http://www.biomedcentral.com/info/publishing_adv.asp
BioMedcentral
logical knowledge resource for plant genomics. Nucleic AcidsRes 2004, 32(Database issue):D373-6.
53. MIPS [http://mips.gsf.de/proj/thal/db/]54. Arabidopsis Gene Family Information [http://www.arabidop
sis.org/browse/genefamily/index.jsp]55. AGRIS [http://arabidopsis.med.ohio-state.edu/]56. Palaniswamy SK, James S, Sun H, Lamb RS, Davuluri RV, Grotewold
E: AGRIS and AtRegNet. a platform to link cis-regulatoryelements and transcription factors into regulatory networks.Plant Physiol 2006, 140(3):818-829.
57. Liu WM, Mei R, Di X, Ryder TB, Hubbell E, Dee S, Webster TA, Har-rington CA, Ho MH, Baid J, Smeekens SP: Analysis of high densityexpression microarrays with signed-rank call algorithms. Bio-informatics 2002, 18(12):1593-1599.
58. Twell D Oh S.-A., Honys, D.: Pollen development, a genetic andtranscriptomic view. In Plant Cell Monographs vol 3, The Pollen TubeEdited by: Malhó R. Springer-Verlag Berlin, Heidelberg:pp 15-45.
59. Schmid M, Davison TS, Henz SR, Pape UJ, Demar M, Vingron M,Scholkopf B, Weigel D, Lohmann JU: A gene expression map ofArabidopsis thaliana development. Nat Genet 2005,37(5):501-506.
Page 8 of 8(page number not for citation purposes)