Embed Size (px)
Citation preview
1 | Arabic-speaking countries in international student assessments | December 2019
Arabic-speaking countries in international student assessments
Table of Contents
01 Executive summary
04 Policy conclusions
06 The Arabic-speaking countries in international student assessments
08 Students performance in international assessments
10 Human Capital Index
11 Reading in PISA and PIRLS
14 Mathematics in PISA and TIMSS
17 Science achievement in PISA and TIMSS
20 Variation in student performance and gender gaps
22 Student socio-economic background and achievement
24 Student attitudes toward reading
27 Student attitudes toward mathematics and science
30 Absenteeism and bullying
32 Country examples
33 Estonia
34 Poland
36 Portugal
38 References
39 Annex
41 Authors
Please cite this publication as: Jakubowski M., Alromi N., Gajderowicz T., Alshumrani S., Rogala M., Jamjoom S., (2019), Arabic-speaking countries in international student assessments, www.evidenceinstitute.pl/arabic-speaking-countries-in-international-student-assessments
01 | Arabic-speaking countries in international student assessments | December 2019
Executive summary
02 | Arabic-speaking countries in international student assessments | December 2019
▮This report analyzes assessment results and student attitudes for the eight Arabic-speaking countries that participated in the latest PISA, TIMSS, and PIRLS assessments.
▮We use data from TIMSS 2015 (mathematics and science), PIRLS 2016 (reading), and several PISA assessments (reading, mathematics, and science).
▮Combining the results from all assessments in the three subjects, the United Arab Emirates has the best results, although the gap between students in this country and the international benchmark is still substantial.
▮The UAE is behind the international benchmark by an equivalent of around three years of schooling. For Oman and Saudi Arabia this gap is around 4 years of education or more, and something in between for Bahrain and Jordan. Morocco, Kuwait, and Egypt are behind the international average by the equivalent 5 years of schooling or more.
▮The PIRLS assessment shows that a majority of students master basic reading skills in Bahrain, the United Arab Emirates, Saudi Arabia, and Oman. In Kuwait half of students reach this level, while in Morocco and Egypt only 1 in 3 is able to read at the basic level in the 4th grade. In the benchmarking countries nearly all students reach the basic reading competency level. A substantial number of 15-year-olds in the Arabic-speaking countries still lack basic reading skills, as the PISA 2018 study shows.
03 | Arabic-speaking countries in international student assessments | December 2019
▮The TIMSS and PISA studies show that in mathematics the proportion of underperforming students is even larger. In Saudi Arabia, Kuwait, Morocco, Egypt, and Jordan, most students do not reach the basic international benchmark in the 8th grade. In Oman slightly more than half of students reach this level, and in Bahrain and the UAE three-quarters of students are at or above this benchmark.
▮In science as well, the proportion of students not reaching the basic international benchmarks is much higher than in other countries.
▮Achievement differences between students are relatively large in the Arabic-speaking countries. The gender gap is especially large in reading, where girls outperform boys by much more than in other countries. However, the Arabic-speaking countries are also among the few countries in which girls outperform boys in mathematics too.
▮Students in the Arabic-speaking countries have on average lower socio-economic status that in the OECD countries. At the same time, the association between family background and student performance also tends to be weaker in the Arabic-speaking countries. The UAE is the only exception here, with a higher than OECD average socio-economic background of students and stronger association with reading performance.
▮Students in the Arabic-speaking countries have highly positive attitudes towards reading, and less so towards mathematics, although this is still above the international average. However, they are aware that their skills are relatively low and do not feel themselves to be, for example, confident readers. Students who have negative attitudes also show substantially lower levels of performance.
▮Students in the Arabic-speaking countries also value science more strongly. While their average performance is below the international benchmark, students who value science more have much higher levels of achievement comparing to those who do not value science.
▮Students in the Arabic-speaking countries report being absent from school more often than in other countries.
▮Students in the Arabic-speaking countries experience more bullying and the detrimental effect of bullying on achievement is also stronger in these countries.
04 | Arabic-speaking countries in international student assessments | December 2019
Policy conclusions
05 | Arabic-speaking countries in international student assessments | December 2019
1. Weak institutional frameworks and lack of accountability. Most systems in the Arab countries are centralized and rely on bureaucratic procedures for managing and evaluating schools. Also, assessments of student learning outcomes are not common and are not publicly shared.
2. Weakness or absence of a unified and explicit vision of education that all stakeholders could work towards. As a result, there is a lack of systematic work that ensures the continuity of development programs within national frameworks that everyone involved could seek to adopt and effectively realize. This also limits any attempts to monitor education with indicators that would allow for the annual tracking of progress. Finally, the lack of a clear vision and challenging but achievable goals that are widely discussed with teachers and parents makes these education systems less effective.
3. Decision-making that ignores evidence and research. Decision-making mechanisms and the development of educational policies do not rely on cumulative data and evidence. The national systems do not use objective, multi-sourced databases and information that could contribute to decision-making processes at all levels of the education system. Research on education in Arab countries is rare and is usually disconnected from policy discussions. It is necessary to invest in evidence-based policy ecosystems that would encourage policy-relevant research and ensure that evidence is routinely used in decision-making.
4. Copying of international examples without careful consideration of local circumstances. Drawing on international programs and experiences to develop education without looking carefully at the frames of reference, motivations, and circumstances that informed other countries’ policies. Not accounting for the conditions for their success leads to shortcomings in their appropriate adaptation and makes success less likely in the Arab countries.
5. Lack of reflection on and evaluation of educational programs and reforms. Whether at the level of the educational system, the school or the student, it is common that programs are implemented without any attempt to evaluate them and to reflect on their successes or failures. The educational field attests to the absence of well-informed experience in evaluating education programs. It is necessary to develop the capacity to perform rigorous evaluations of educational interventions and to disseminate their results among policymakers and practitioners.
The efforts made by Arab countries to develop their education systems follow examples from other countries. This report documents, however, that the results of these policy measures do not bring similar effects as measured by student learning outcomes. The Arabic-speaking countries reviewed in this report perform below international benchmarks in all subjects, which is confirmed by data from PISA, PIRLS, and TIMSS assessments collected for more than fifteen years now. The report provides examples of countries that have made great progress in their education systems according to the same international assessments. Comparing to Poland, Portugal, Estonia, and other successful reformers, one can list a few aspects that are weaker or missing in the education systems of the Arab countries.
06 | Arabic-speaking countries in international student assessments | December 2019
Imagine a school system in which no comparison of student outcomes is possible. Each school has its own way of evaluating students and does not share any data that can be compared with others. Students progress from school to school and no one knows how much they are learning. We don’t know which schools are more effective as there is no way to compare them except through subjective opinions. In this situation administrators can focus only on inputs as this is the measurable thing they can control. Obviously, on a small scale one can also focus on the quality of teachers and processes, but for a country with hundreds or even thousands of schools that approach will not provide sufficient information with which to make reasonable decisions.
Before the introduction of international student assessments, education systems around the world were like schools that do not have any comparable data to share, except limited information on inputs. Countries were compared according to how much they spent on education or how many years of education average students attained. For modern education systems such information is not sufficient.
Thanks to international assessments, we now know that countries differ importantly in terms of student learning outcomes. Some systems are able to move all students above basic competency levels, while in others too many students finish school without basic reading fluency or math skills. We learned that inputs are not as important as the quality of teaching. Countries with relatively few resources devoted to education can outperform those which spend much more, but without committing to necessary reforms that could improve teaching. We can now learn from these countries by knowing how well their students are doing in international assessments.
National and international standardized student assessments had a profound effect on school systems. Most developed countries have a system of examinations or of monitoring sample-based assessments, which provide information on student learning outcomes. It is now possible to assess how much students are learning and if they meet the expectations set by the national curriculum or by international benchmarks. We can also compare schools or school systems to see which one is more effective.
Of course, tests are not perfect measures of student outcomes and it is difficult to use their results to evaluate teaching quality. However, without them we are blind when it comes to
The Arabic-speaking countries in international student assessments
Importance of international large-scale student assessments for education policy and practice

07 | Arabic-speaking countries in international student assessments | December 2019
working on our intuitions and non-testable opinions. It is also true that is difficult to copy solutions from one school to another, and even more difficult to adapt successful solutions from one country to another. But it is a mistake, and neglectful of an opportunity to improve, if we close our eyes to evidence from assessments that clearly demonstrate that some schools and some education systems do much better than others.
Over the last 25 years, international assessments have come a long way. The first results were discussed mostly by education experts. Often the winning narrative was that countries differ in the way they teach subjects and every one has its own way of educating children. However, growing evidence that some countries are much more successful in providing young people with the necessary skills can no longer be ignored. Now the results of international assessments stimulate intensive discussion of policies that can be adapted from top-performing countries to improve teaching quality. Not only experts, but also policymakers and parents, are closely observing how their countries perform in PISA, TIMSS or PIRLS.
International assessments reliably compare student achievement, but also focus on contextual factors and policy levers that vary across countries. Huge effort is made to make these comparisons as reliable as possible. Representative samples of students are drawn in each country for similarly defined student populations. w testing methods are used and complex psychometric models are employed to estimate student achievement with the highest precision. Also, international consortia make sure that assessments use test items that are fully comparable across cultures and languages, while expert teams control the implementation and quality of surveys conducted in every country.
Large-scale international assessments like TIMSS, PISA, and PIRLS are now commonly used in developed countries. In the latest PISA edition in 2018 around 80 school systems participated and the results are representative for more than 30 million students around the world. In addition, the data collected provide rich background information on student opinions and attitudes, teaching methods, school climate, parental attitudes, etc. The results are summarized in international reports, but micro data are published to allow researchers to conduct their own studies.
This report is unique as it summarizes information from several international student assessments. The most recent results from PISA, TIMSS, and PIRLS are compared across the eight Arabic-speaking countries. As an international benchmark, we use results from 14 countries that participated in all these assessments with reasonably stable results. The report discusses differences in student achievement, attitudes, and behavior. Key results of these comparisons are discussed from the policy perspective, allowing policy makers and practitioners to learn how these data can be used to improve teaching quality in their countries.
We hope that this report will demonstrate the usefulness of international student assessments for policy makers and practitioners. It is crucial to utilize these data and to make better-informed decisions in education. One of the main findings from the international assessments is that over the last 20 years achievement in most countries has not changed, despite many reforms and resources spent on trying to improve education. This is also true for the Arabic-speaking countries, among which some invested a lot in education with only minor changes in student results. The report provides examples of countries that have consistently improved student outcomes, and while no one can simply copy solutions from one education system to another, international assessments tell us where we can look for policies that have been highly successful in at least some places. We believe that this report is a step forward in developing evidence-based policy making and teaching practice in the Arabic-speaking countries. Let’s have a look at these data and start a discussion on current education policy and practice from the evidence-based perspective.
08 | Arabic-speaking countries in international student assessments | December 2019
Students performance in international assessments
This study explores a dozen international assessments using microdata at the student level to estimate and compare their levels of achievement. As a benchmark, we use the results from the OECD PISA study. This is the largest program of international student assessment, covering all the developed countries. In the latest round, 78 countries and economies participated in PISA 2018, including the four Arabic-speaking countries
analyzed in this report: Saudi Arabia, Jordan, Morocco, and the United Arab Emirates. We link these results to other data to provide comparisons with Arabic-speaking countries that are not covered by PISA but participate in TIMSS or PIRLS – the other two large-scale international student assessments that cover multiple countries. In this way, we can reliably compare achievement for more Arabic-speaking countries, including Bahrain, Egypt, Kuwait, and Oman.
Our comparisons use data for 14 benchmarking countries that participated in all the most recent PISA, TIMSS, and PIRLS assessments, i.e. PISA 2009, 2012, 2015, 2018, TIMSS 2015 4th and 8th grade, and PIRLS 2016. We standardize achievement distributions for these countries so as to make all results comparable to the international OECD PISA scale. The technical details of our approach are provided in PISA, TIMSS, and PIRLS Technical Reports. Overall, we use datasets with results for nearly 3 million students from around the world. The main analysis is based on 1 million students from more than 11,000 schools coming from 23 countries. This is rich data that provides evidence on student performance in Arabic-speaking countries in the international perspective.
Before proceeding with the results it is important to note the differences in population coverage across countries and studies. While in most countries the majority of students attend school and are sampled for the international assessments, in some countries large proportions of young people are not in schools and are therefore not included in the assessments. Relevant data on coverage are provided in are provided in PISA, TIMSS, and PIRLS Technical Reports, but as an example compare the coverage of 15-year-old populations across the countries studied. In the United Arab Emirates, the PISA sample covers 92 percent of 15-year-olds and in Saudi Arabia 85 percent. This is similar coverage that in OECD countries (e.g. Finland at 96 percent, Poland 90 percent, and Canada 86 percent). However, coverage of 15-year-olds in Morocco is 64 percent and in Jordan only 54 percent. This means that in Morocco one third and in Jordan nearly half of the 15-year-olds are not covered by the PISA assessment. We can assume that achievement levels of these students might be low as they have dropped out of school already; however, the results reported here and in other international reports do not take this into account as no information is available about these students. In primary schools the coverage is usually higher as most children are attending them. Thus, combining the results from primary and secondary school studies, as it is done in this report, improves overall reliability of the comparisons across countries.
datasets with results for nearly 3 million students from around the world

09 | Arabic-speaking countries in international student assessments | December 2019
In this section we focus on average results of students in reading, mathematics, and science. The composite score presented on Figure 1 is calculated from adjusted average student scores in these three subjects, across the PISA, TIMSS and PIRLS studies. The international benchmark is a score of 500 points and is comparable to the OECD average used in the PISA reports (with a standard deviation of student performance around of 100 points). All the Arabic-speaking countries in our comparison have student performance levels below the international benchmark. The United Arab Emirates has the highest performance, followed by Bahrain and Jordan. Oman and Saudi Arabia have similar average scores, placing them in the middle across the compared countries, while Morocco, Kuwait and Egypt close the ranking.
To interpret results on the PISA international scale one can compare them to performance differences between countries. Singapore is consistently one of the highest performing countries in PISA and also in TIMSS and PIRLS. In PISA 2018 the gap between the OECD average and Singapore’s performance in reading and science is around 60 points and in mathematics it is close to 80. This is similar to the difference between our international benchmark and the performance of the United Arab Emirates – the highest performing country in our comparisons. The performance of the United Arab Emirates is similar to that of Chile, and above Mexico and Colombia, which are the lowest performing countries in the OECD. Comparing the UAE non-OECD countries that participated in PISA 2018 assessment, it scores close to Romania and above the average for Brazil.
Another way to compare these results is to refer to the average gain students make during one year of education on the PISA scale. As the OECD estimates, this gain can be between 20 and 40 points depending on the country or subject. Assuming a conservative number of 30 points, it shows that the UAE is behind the international benchmark by around three years of school education. For Oman and Saudi Arabia this gap is around 4 years of education or more, and between 3 and 4 years for Bahrain and Jordan. Other countries in our comparisons are behind the international average by the equivalent 5 years of schooling or more.
200250300350400450500550
Egypt
Kuwait
Morocco
Saudi Arabia
Oman
Jordan
Bahrain
United Arab Emirates
International benchmark
Figure 1. Composite score for average student performance in international assessments
Overall, this shows large disparities between student performance in Arabic-speaking countries and the international average, which is close to the OECD average. However, as we will demonstrate in this report, the gaps between students are also larger within Arabic-speaking countries, meaning that there are groups of students who are much closer to the average performance of OECD countries, while others perform far below international standards.
We will now discuss performance estimates and general findings for the three domains assessed in the PISA, PIRLS and TIMSS international assessments.
Source: Adjusted results from PISA, PIRLS, and TIMSS assessments. See Table A1 in the Annex.
10 | Arabic-speaking countries in international student assessments | December 2019
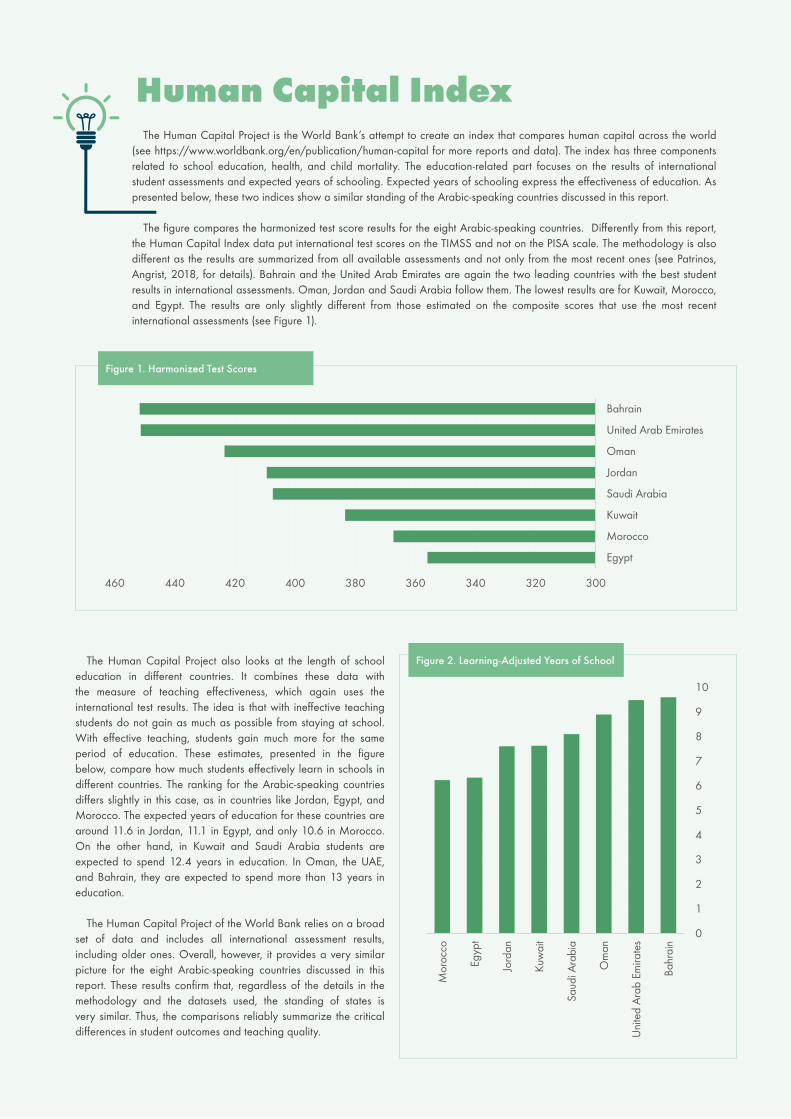
The Human Capital Project is the World Bank’s attempt to create an index that compares human capital across the world (see https://www.worldbank.org/en/publication/human-capital for more reports and data). The index has three components related to school education, health, and child mortality. The education-related part focuses on the results of international student assessments and expected years of schooling. Expected years of schooling express the effectiveness of education. As presented below, these two indices show a similar standing of the Arabic-speaking countries discussed in this report.
The figure compares the harmonized test score results for the eight Arabic-speaking countries. Differently from this report, the Human Capital Index data put international test scores on the TIMSS and not on the PISA scale. The methodology is also different as the results are summarized from all available assessments and not only from the most recent ones (see Patrinos, Angrist, 2018, for details). Bahrain and the United Arab Emirates are again the two leading countries with the best student results in international assessments. Oman, Jordan and Saudi Arabia follow them. The lowest results are for Kuwait, Morocco, and Egypt. The results are only slightly different from those estimated on the composite scores that use the most recent international assessments (see Figure 1).
Human Capital Index
The Human Capital Project also looks at the length of school education in different countries. It combines these data with the measure of teaching effectiveness, which again uses the international test results. The idea is that with ineffective teaching students do not gain as much as possible from staying at school. With effective teaching, students gain much more for the same period of education. These estimates, presented in the figure below, compare how much students effectively learn in schools in different countries. The ranking for the Arabic-speaking countries differs slightly in this case, as in countries like Jordan, Egypt, and Morocco. The expected years of education for these countries are around 11.6 in Jordan, 11.1 in Egypt, and only 10.6 in Morocco. On the other hand, in Kuwait and Saudi Arabia students are expected to spend 12.4 years in education. In Oman, the UAE, and Bahrain, they are expected to spend more than 13 years in education.
The Human Capital Project of the World Bank relies on a broad set of data and includes all international assessment results, including older ones. Overall, however, it provides a very similar picture for the eight Arabic-speaking countries discussed in this report. These results confirm that, regardless of the details in the methodology and the datasets used, the standing of states is very similar. Thus, the comparisons reliably summarize the critical differences in student outcomes and teaching quality.
300320340360380400420440460
Egypt
Morocco
Kuwait
Saudi Arabia
Jordan
Oman
United Arab Emirates
Bahrain
0
1
2
3
4
5
6
7
8
9
10
Bahr
ain
Uni
ted
Ara
b Em
irate
s
Om
an
Saud
i Ara
bia
Kuw
ait
Jord
an
Egyp
t
Mor
occo
300320340360380400420440460
Egypt
Morocco
Kuwait
Saudi Arabia
Jordan
Oman
United Arab Emirates
Bahrain
0
1
2
3
4
5
6
7
8
9
10
Bahr
ain
Uni
ted
Ara
b Em
irate
s
Om
an
Saud
i Ara
bia
Kuw
ait
Jord
an
Egyp
t
Mor
occo
Figure 2. Learning-Adjusted Years of School
Figure 1. Harmonized Test Scores

11 | Arabic-speaking countries in international student assessments | December 2019
200250300350400450500550
Egypt
Morocco
Kuwait
Oman
Saudi Arabia
Bahrain
Jordan
United Arab Emirates
International benchmark
average in reading
PISA 2018
PISA 2009
PIRLS 2016
Reading in PISA and PIRLS
The results for reading are based on the average results from PISA 2018 for four countries that participated in this study and on reading scores from PIRLS 2016, in which most of the Arabic-speaking countries participated. In addition, we use PISA 2009 reading results for the benchmarking countries and for Jordan to increase the reliability of these comparisons (in PISA 2009 reading was also the main testing domain as in PISA 2018). The PIRLS results are adjusted to make them comparable with PISA for all eight Arabic-speaking countries.
The results for reading show a similar gap with the international benchmark. They can be compared to PISA proficiency levels, which describe what students can do in reading at each level. The key level in PISA is Level 2, which is defined as a minimum proficiency in each subject. Students below this level are not able to use their skills and knowledge to solve real-life problems. In reading, that means they can decode the text but have difficulties in finding its meaning and interpreting it, which is a serious limitation in their further education and in their future economic and social life.
The lower limit for Level 2 in PISA for reading is 407 points. On average students in the UAE, Jordan and Bahrain are close to this minimum or slightly above it. Some students in these countries perform at or above this level, but most students struggle with reading and have rather limited reading skills. Students in countries like Saudi Arabia or Oman are on average below this level and most of them do lack basic reading skills. Most of the students in the other countries are below level 2, meaning they are not acquiring the required reading skills in school, which is a barrier in further education and in life. Later in the report, we discuss how many students are at each level in each country, but this comparison already shows that too many students in the Arabic-speaking countries are not meeting the basic educational requirements.
PISA reading proficiency Level 2 and below
At Level 2, students begin to demonstrate the capacity to use their reading skills
to acquire knowledge and solve a wide range of practical problems. Students who do not attain Level 2 proficiency in reading often have difficulty when confronted with material that is unfamiliar to them or that
is of moderate length and complexity. They usually need to be prompted with cues or instructions before they can engage with a text. In the context of the United
Nations Sustainable Development Goals, Level 2 proficiency has been identified
as the “minimum level of proficiency” that all children should acquire by the end of
secondary education.
Figure 2. Reading achievement average composite score and student performance in PISA 2009-2018 and PIRLS 2016
Source: OECD, 2019, p. 89.
Source: Adjusted results from PISA, PIRLS, and TIMSS assessments. See Table A1 in the Annex.
12 | Arabic-speaking countries in international student assessments | December 2019
0% 20% 40% 60% 80%
Morocco
Lebanon
Saudi Arabia
United Arab Emirates
Jordan
International benchmark
When reading predominantly simpler Literary Texts, students can locate and retrieve explicitly stated information, actions, or ideas; make straightforward inferences about events and reasons for actions; begin to interpret story events and central ideas. When reading predominantly simpler Informational Texts, students can
locate and reproduce explicitly stated information from text and other formats (e.g., charts, diagrams); begin to make straightforward inferences about explanations, actions, and descriptions.
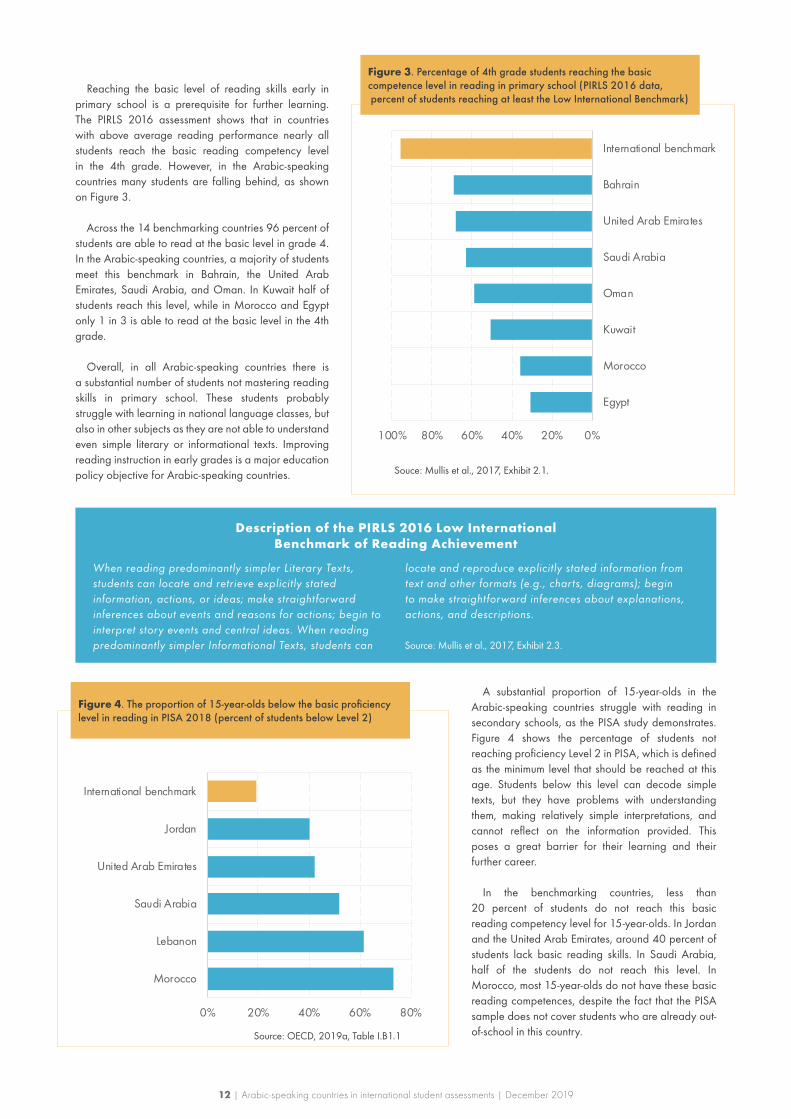
Reaching the basic level of reading skills early in primary school is a prerequisite for further learning. The PIRLS 2016 assessment shows that in countries with above average reading performance nearly all students reach the basic reading competency level in the 4th grade. However, in the Arabic-speaking countries many students are falling behind, as shown on Figure 3.
Across the 14 benchmarking countries 96 percent of students are able to read at the basic level in grade 4. In the Arabic-speaking countries, a majority of students meet this benchmark in Bahrain, the United Arab Emirates, Saudi Arabia, and Oman. In Kuwait half of students reach this level, while in Morocco and Egypt only 1 in 3 is able to read at the basic level in the 4th grade.
Overall, in all Arabic-speaking countries there is a substantial number of students not mastering reading skills in primary school. These students probably struggle with learning in national language classes, but also in other subjects as they are not able to understand even simple literary or informational texts. Improving reading instruction in early grades is a major education policy objective for Arabic-speaking countries.
Figure 3. Percentage of 4th grade students reaching the basic competence level in reading in primary school (PIRLS 2016 data, percent of students reaching at least the Low International Benchmark)
A substantial proportion of 15-year-olds in the Arabic-speaking countries struggle with reading in secondary schools, as the PISA study demonstrates. Figure 4 shows the percentage of students not reaching proficiency Level 2 in PISA, which is defined as the minimum level that should be reached at this age. Students below this level can decode simple texts, but they have problems with understanding them, making relatively simple interpretations, and cannot reflect on the information provided. This poses a great barrier for their learning and their further career.
In the benchmarking countries, less than 20 percent of students do not reach this basic reading competency level for 15-year-olds. In Jordan and the United Arab Emirates, around 40 percent of students lack basic reading skills. In Saudi Arabia, half of the students do not reach this level. In Morocco, most 15-year-olds do not have these basic reading competences, despite the fact that the PISA sample does not cover students who are already out-of-school in this country.
Figure 4. The proportion of 15-year-olds below the basic proficiency level in reading in PISA 2018 (percent of students below Level 2)
0%20%40%60%80%100%
Egypt
Morocco
Kuwait
Oman
Saudi Arabia
United Arab Emirates
Bahrain
International benchmark
Description of the PIRLS 2016 Low International Benchmark of Reading Achievement
Source: Mullis et al., 2017, Exhibit 2.3.
Souce: Mullis et al., 2017, Exhibit 2.1.
Source: OECD, 2019a, Table I.B1.1
13 | Arabic-speaking countries in international student assessments | December 2019
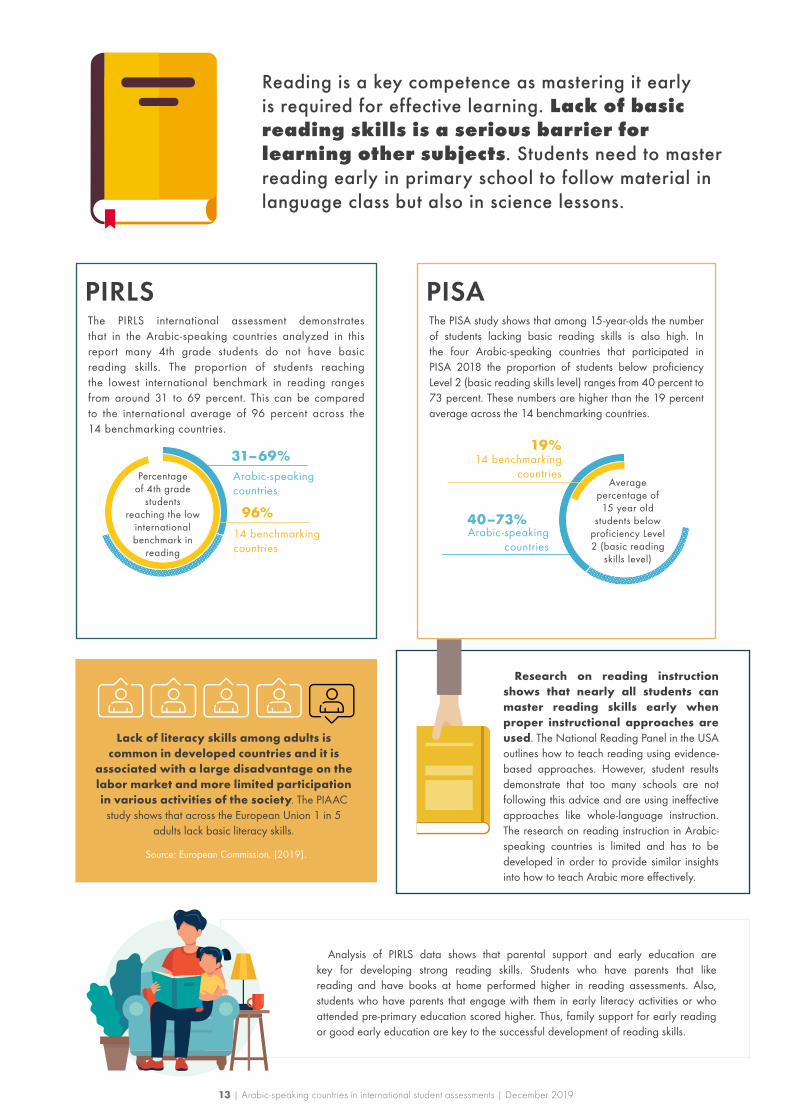
The PISA study shows that among 15-year-olds the number of students lacking basic reading skills is also high. In the four Arabic-speaking countries that participated in PISA 2018 the proportion of students below proficiency Level 2 (basic reading skills level) ranges from 40 percent to 73 percent. These numbers are higher than the 19 percent average across the 14 benchmarking countries.
The PIRLS international assessment demonstrates that in the Arabic-speaking countries analyzed in this report many 4th grade students do not have basic reading skills. The proportion of students reaching the lowest international benchmark in reading ranges from around 31 to 69 percent. This can be compared to the international average of 96 percent across the 14 benchmarking countries.
Reading is a key competence as mastering it early is required for effective learning. Lack of basic reading skills is a serious barrier for learning other subjects. Students need to master reading early in primary school to follow material in language class but also in science lessons.
Analysis of PIRLS data shows that parental support and early education are key for developing strong reading skills. Students who have parents that like reading and have books at home performed higher in reading assessments. Also, students who have parents that engage with them in early literacy activities or who attended pre-primary education scored higher. Thus, family support for early reading or good early education are key to the successful development of reading skills.
Research on reading instruction shows that nearly all students can master reading skills early when proper instructional approaches are used. The National Reading Panel in the USA outlines how to teach reading using evidence-based approaches. However, student results demonstrate that too many schools are not following this advice and are using ineffective approaches like whole-language instruction. The research on reading instruction in Arabic-speaking countries is limited and has to be developed in order to provide similar insights into how to teach Arabic more effectively.
Arabic-speaking countries
Arabic-speaking countries
14 benchmarking countries
14 benchmarking countries
96%
19%31–69%
40–73%
Percentage of 4th grade
students reaching the low
international benchmark in
reading
PIRLS
Average percentage of 15 year old
students below proficiency Level 2 (basic reading
skills level)
PISA
Source: European Commission. (2019).
Lack of literacy skills among adults is common in developed countries and it is
associated with a large disadvantage on the labor market and more limited participation in various activities of the society. The PIAAC
study shows that across the European Union 1 in 5 adults lack basic literacy skills.
14 | Arabic-speaking countries in international student assessments | December 2019
341
354
356
368
374
383
421
431
501
200250300350400450500550
Kuwait
Saudi Arabia
Morocco
Egypt
Jordan
Oman
Bahrain
United Arab Emirates
International benchmark
average in mathematics
PISA 2018
PISA 2012
TIMSS 2015 8th grade
TIMSS 2015 4th grade
Mathematics in PISA and TIMSS
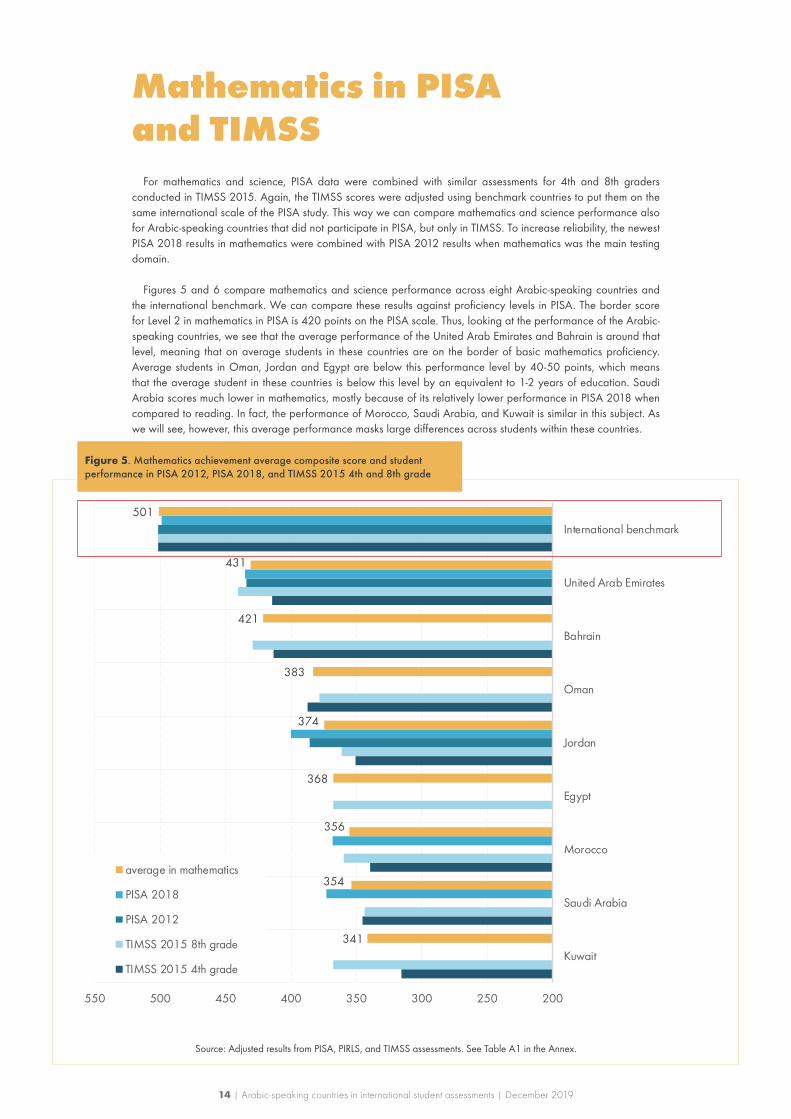
For mathematics and science, PISA data were combined with similar assessments for 4th and 8th graders conducted in TIMSS 2015. Again, the TIMSS scores were adjusted using benchmark countries to put them on the same international scale of the PISA study. This way we can compare mathematics and science performance also for Arabic-speaking countries that did not participate in PISA, but only in TIMSS. To increase reliability, the newest PISA 2018 results in mathematics were combined with PISA 2012 results when mathematics was the main testing domain.
Figures 5 and 6 compare mathematics and science performance across eight Arabic-speaking countries and the international benchmark. We can compare these results against proficiency levels in PISA. The border score for Level 2 in mathematics in PISA is 420 points on the PISA scale. Thus, looking at the performance of the Arabic-speaking countries, we see that the average performance of the United Arab Emirates and Bahrain is around that level, meaning that on average students in these countries are on the border of basic mathematics proficiency. Average students in Oman, Jordan and Egypt are below this performance level by 40-50 points, which means that the average student in these countries is below this level by an equivalent to 1-2 years of education. Saudi Arabia scores much lower in mathematics, mostly because of its relatively lower performance in PISA 2018 when compared to reading. In fact, the performance of Morocco, Saudi Arabia, and Kuwait is similar in this subject. As we will see, however, this average performance masks large differences across students within these countries.
Figure 5. Mathematics achievement average composite score and student performance in PISA 2012, PISA 2018, and TIMSS 2015 4th and 8th grade
Source: Adjusted results from PISA, PIRLS, and TIMSS assessments. See Table A1 in the Annex.
15 | Arabic-speaking countries in international student assessments | December 2019
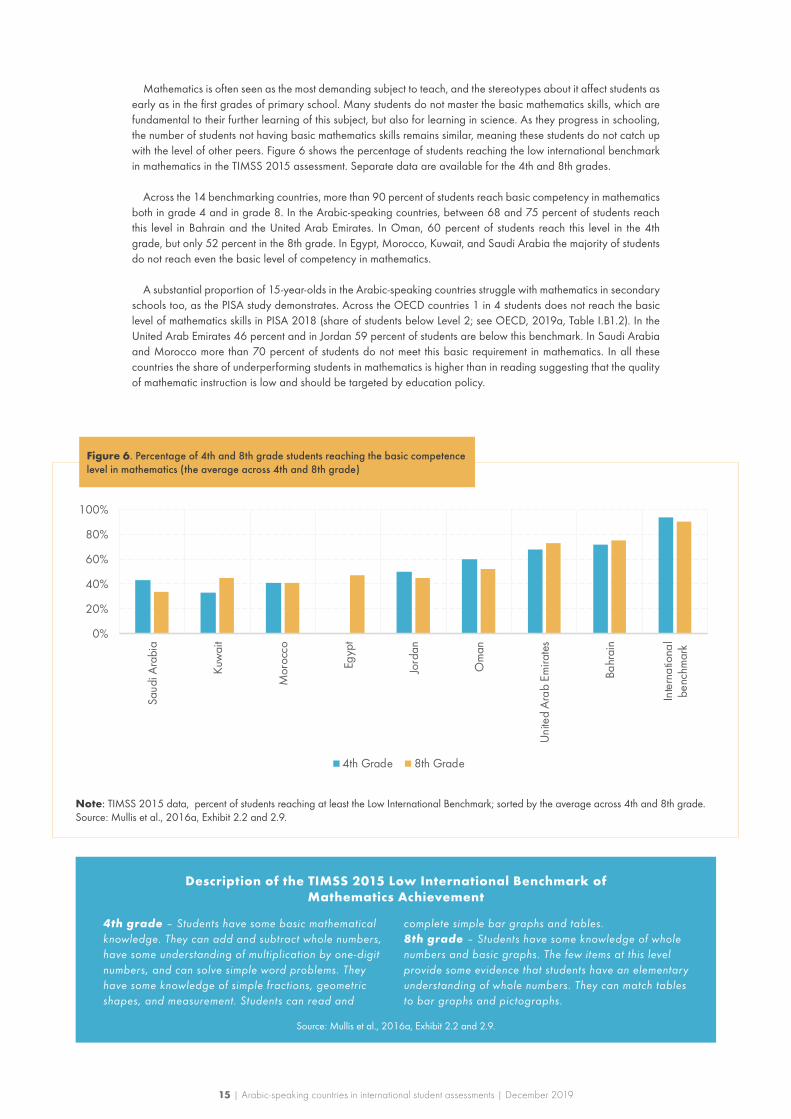
Mathematics is often seen as the most demanding subject to teach, and the stereotypes about it affect students as early as in the first grades of primary school. Many students do not master the basic mathematics skills, which are fundamental to their further learning of this subject, but also for learning in science. As they progress in schooling, the number of students not having basic mathematics skills remains similar, meaning these students do not catch up with the level of other peers. Figure 6 shows the percentage of students reaching the low international benchmark in mathematics in the TIMSS 2015 assessment. Separate data are available for the 4th and 8th grades.
Across the 14 benchmarking countries, more than 90 percent of students reach basic competency in mathematics both in grade 4 and in grade 8. In the Arabic-speaking countries, between 68 and 75 percent of students reach this level in Bahrain and the United Arab Emirates. In Oman, 60 percent of students reach this level in the 4th grade, but only 52 percent in the 8th grade. In Egypt, Morocco, Kuwait, and Saudi Arabia the majority of students do not reach even the basic level of competency in mathematics.
A substantial proportion of 15-year-olds in the Arabic-speaking countries struggle with mathematics in secondary schools too, as the PISA study demonstrates. Across the OECD countries 1 in 4 students does not reach the basic level of mathematics skills in PISA 2018 (share of students below Level 2; see OECD, 2019a, Table I.B1.2). In the United Arab Emirates 46 percent and in Jordan 59 percent of students are below this benchmark. In Saudi Arabia and Morocco more than 70 percent of students do not meet this basic requirement in mathematics. In all these countries the share of underperforming students in mathematics is higher than in reading suggesting that the quality of mathematic instruction is low and should be targeted by education policy.
Figure 6. Percentage of 4th and 8th grade students reaching the basic competence level in mathematics (the average across 4th and 8th grade)
Note: TIMSS 2015 data, percent of students reaching at least the Low International Benchmark; sorted by the average across 4th and 8th grade. Source: Mullis et al., 2016a, Exhibit 2.2 and 2.9.
Description of the TIMSS 2015 Low International Benchmark of Mathematics Achievement
4th grade – Students have some basic mathematical knowledge. They can add and subtract whole numbers, have some understanding of multiplication by one-digit numbers, and can solve simple word problems. They have some knowledge of simple fractions, geometric shapes, and measurement. Students can read and
complete simple bar graphs and tables. 8th grade – Students have some knowledge of whole numbers and basic graphs. The few items at this level provide some evidence that students have an elementary understanding of whole numbers. They can match tables to bar graphs and pictographs.
Source: Mullis et al., 2016a, Exhibit 2.2 and 2.9.
0%
20%
40%
60%
80%
100%
Saud
i Ara
bia
Kuw
ait
Mor
occo
Egyp
t
Jord
an
Om
an
Uni
ted
Ara
b Em
irate
s
Bahr
ain
Inte
rnat
iona
lbe
nchm
ark
4th Grade 8th Grade

16 | Arabic-speaking countries in international student assessments | December 2019
Mathematics is a language of science but basic math skills are also
necessary for a successful professional career and for
everyday tasks. Higher skills in mathematics are required for
understanding the development of modern technologies using Big Data
and Artificial Intelligence.
Mathematics is often a subject that students are afraid of and believe to be difficult. Anxiety
about mathematics can seriously limit students’ learning and affect their attitudes and skills even in adult life. Research shows, however, that anxiety and self-efficacy are related to student achievement and effective teaching.
Successfully developing mathematics knowledge and skills is the best method for
limiting student anxiety and building positive attitudes towards mathematics and its
applications.
Analysis of the TIMSS data for early mathematics achievement shows that parental support and early education are key for developing
these skills. Students have higher levels of achievement if their parents engage with them in early numeracy activities. Also, students who
attended pre-primary education show higher mathematics skills. Thus, family support and early education are both associated with the
development of higher mathematics skills.
The TIMSS international assessment demonstrates that in the Arab-speaking countries many 4th and 8th grade students do not have basic mathematics skills. The proportion of students reaching the low international benchmark in mathematics ranges from 33 to 75 percent. This can be compared to the international average of 92 percent across the 14 benchmarking countries.
The PISA study shows that among 15-year-olds the number of students lacking basic math skills is also high. In the four Arab-speaking countries that participated in PISA 2018 the proportion of students below the basic mathematics skills level (Level 2) ranges from 46 to 76 percent. These numbers are higher than the international benchmark of 22 percent.
Research on mathematics
instruction shows that developing positive
attitudes and promoting effective instruction are both strongly related to
achievement. Students who have more positive attitudes towards
mathematics tend to more often think about continuing education in technical subjects, like engineering,
data science, or finance. This is especially true for girls, who often share negative stereotypes that affect their career
choices, even if their maths skills are relatively good. Thus, effective teaching of mathematics seems to
be as important as developing positive attitudes towards this subject.
Limited numeracy skills of adults are commonly seen as the biggest obstacle for developing businesses that rely on new technologies. Adults not having basic numeracy
skills have significantly lower salaries and have more limited labor market options. The PIAAC study of adults
shows that across the European Union more than 20 percent of adults do not possess basic numeracy skills.
68%
Percentage of students reaching
the lowest international benchmark
in mathematics
14 benchmarking countries
Arabic-speaking countries33%–75%
92%
Source: European Commission. (2019).
17 | Arabic-speaking countries in international student assessments | December 2019
Mathematics is a language of science but basic math skills are also
necessary for a successful professional career and for
everyday tasks. Higher skills in mathematics are required for
understanding the development of modern technologies using Big Data
and Artificial Intelligence.
Mathematics is often a subject that students are afraid of and believe to be difficult. Anxiety
about mathematics can seriously limit students’ learning and affect their attitudes and skills even in adult life. Research shows, however, that anxiety and self-efficacy are related to student achievement and effective teaching.
Successfully developing mathematics knowledge and skills is the best method for
limiting student anxiety and building positive attitudes towards mathematics and its
applications.
Analysis of the TIMSS data for early mathematics achievement shows that parental support and early education are key for developing
these skills. Students have higher levels of achievement if their parents engage with them in early numeracy activities. Also, students who
attended pre-primary education show higher mathematics skills. Thus, family support and early education are both associated with the
development of higher mathematics skills.
The TIMSS international assessment demonstrates that in the Arab-speaking countries many 4th and 8th grade students do not have basic mathematics skills. The proportion of students reaching the low international benchmark in mathematics ranges from 33 to 75 percent. This can be compared to the international average of 92 percent across the 14 benchmarking countries.
The PISA study shows that among 15-year-olds the number of students lacking basic math skills is also high. In the four Arab-speaking countries that participated in PISA 2018 the proportion of students below the basic mathematics skills level (Level 2) ranges from 46 to 76 percent. These numbers are higher than the international benchmark of 22 percent.
Research on mathematics
instruction shows that developing positive
attitudes and promoting effective instruction are both strongly related to
achievement. Students who have more positive attitudes towards
mathematics tend to more often think about continuing education in technical subjects, like engineering,
data science, or finance. This is especially true for girls, who often share negative stereotypes that affect their career
choices, even if their maths skills are relatively good. Thus, effective teaching of mathematics seems to
be as important as developing positive attitudes towards this subject.
Limited numeracy skills of adults are commonly seen as the biggest obstacle for developing businesses that rely on new technologies. Adults not having basic numeracy
skills have significantly lower salaries and have more limited labor market options. The PIAAC study of adults
shows that across the European Union more than 20 percent of adults do not possess basic numeracy skills.
68%
Percentage of students reaching
the lowest international benchmark
in mathematics
14 benchmarking countries
Arabic-speaking countries33%–75%
92%
Source: European Commission. (2019).
344
345
354
370
413
413
432
435
500
200250300350400450500550
Kuwait
Egypt
Morocco
Saudi Arabia
Jordan
Oman
Bahrain
United Arab Emirates
International benchmark
average in science
PISA 2018
PISA 2015
TIMSS 2015 8th grade
TIMSS 2015 4th grade
Science achievement in PISA and TIMSS
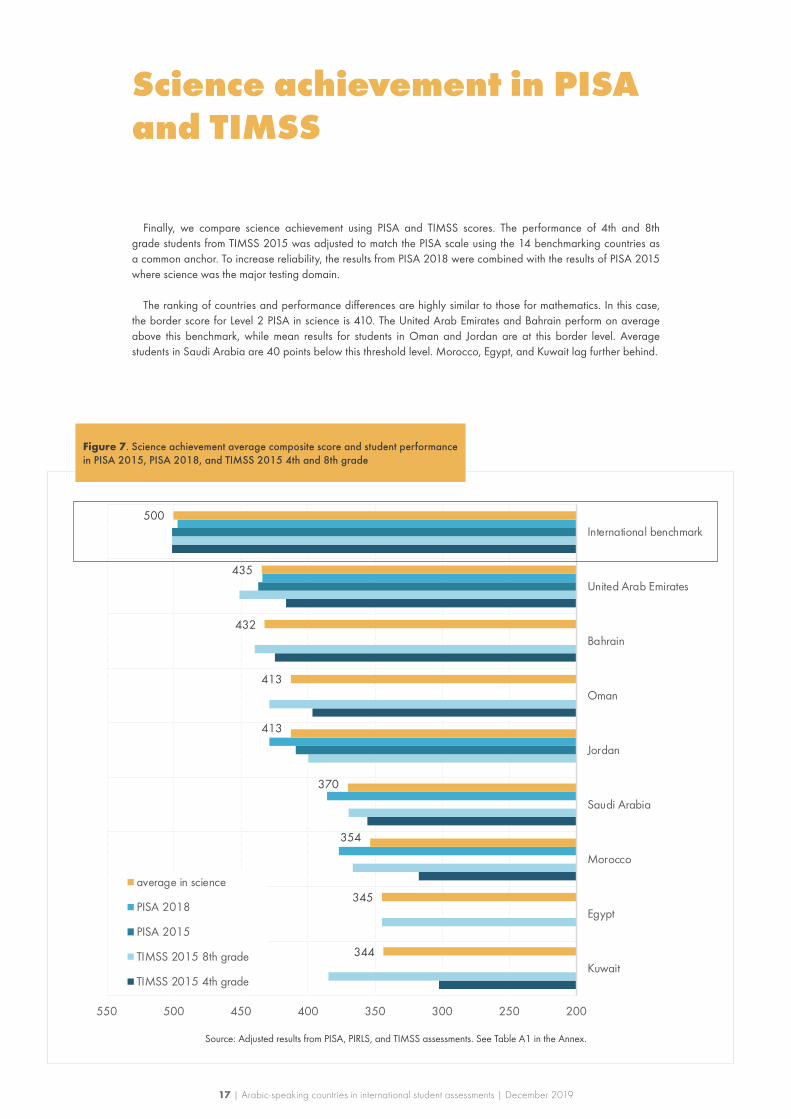
Finally, we compare science achievement using PISA and TIMSS scores. The performance of 4th and 8th grade students from TIMSS 2015 was adjusted to match the PISA scale using the 14 benchmarking countries as a common anchor. To increase reliability, the results from PISA 2018 were combined with the results of PISA 2015 where science was the major testing domain.
The ranking of countries and performance differences are highly similar to those for mathematics. In this case, the border score for Level 2 PISA in science is 410. The United Arab Emirates and Bahrain perform on average above this benchmark, while mean results for students in Oman and Jordan are at this border level. Average students in Saudi Arabia are 40 points below this threshold level. Morocco, Egypt, and Kuwait lag further behind.
Figure 7. Science achievement average composite score and student performance in PISA 2015, PISA 2018, and TIMSS 2015 4th and 8th grade
Source: Adjusted results from PISA, PIRLS, and TIMSS assessments. See Table A1 in the Annex.

18 | Arabic-speaking countries in international student assessments | December 2019
20%30%40%50%60%70%80%90%
100%
Mor
occo
Egyp
t
Kuw
ait
Saud
i Ara
bia
Jord
an
Om
an
Uni
ted
Ara
b Em
irate
s
Bahr
ain
Inte
rnat
iona
l ben
chm
ark
4th Grade 8th Grade
In science, similarly to reading and mathematics, large number of students in the Arabic-speaking countries do not meet the basic international benchmarks. Figure 8 shows the percentage of students reaching the low international benchmark in science in the TIMSS 2015 assessment. Separate data are available for the 4th and 8th grades except for Egypt and Jordan, which participated in the 8th grade assessment only.
On average, across the 14 benchmarking countries 93 percent of students reach at least the low international benchmark and the majority perform at higher levels. In the Arabic-speaking countries Bahrain, UAE, Oman, and Jordan, the majority of students reach this level (from 63 percent in Jordan to 73 percent in the UAE). In Saudi Arabia half of the students perform at the low international benchmark or above, while the other half do not reach this basic science competency level. In Morocco, Egypt, and Kuwait, most students are below the international low benchmark. Also, the share of under-performing students is much higher in the 4th grade in all countries except Saudi Arabia and Bahrain, which suggests that science instruction in the early grades should be strengthened.
PISA 2018 results confirm that a large proportion of students in the Arabic-speaking countries performs below international benchmarks in science. Across the 14 benchmarking countries, 19 percent of students perform below Level 2 in science. In the United Arab Emirates 46 percent and in Jordan 59 percent of students do not reach PISA Level 2 in science. In Saudi Arabia and Morocco these numbers are higher, with 62 percent of Saudi students and 69 percent of Moroccan students not reaching the basic PISA benchmark for science.
Figure 8. Percentage of 4th and 8th grade students reaching the basic competence level in science (the average across 4th and 8th grade)
Description of the TIMSS 2015 Low International Benchmark of Science Achievement
4th grade – Students show basic knowledge of life and physical sciences. Students demonstrate some basic knowledge of behavioral and physical characteristics of plants and animals as well as of the interaction of living things with their environments, and apply knowledge of some facts related to human health. Students show basic knowledge of states of matter and physical properties of matter. They interpret simple diagrams, complete simple tables, and provide short, fact-based written responses.
8th grade – Students show some basic knowledge of biology, chemistry, physics, and Earth science. Students apply basic knowledge of ecosystems and adaptation of animals to their environment, show knowledge of basic facts related to thermal and electrical conductivity and electromagnetism, and show knowledge of some basic Earth science facts. Students interpret simple pictorial diagrams and apply basic knowledge to practical situations.
Source: Mullis et al., 2016b, Exhibit 2.11.
Source: Mullis et al., 2016b. Exhibit 2.2 and 2.9.
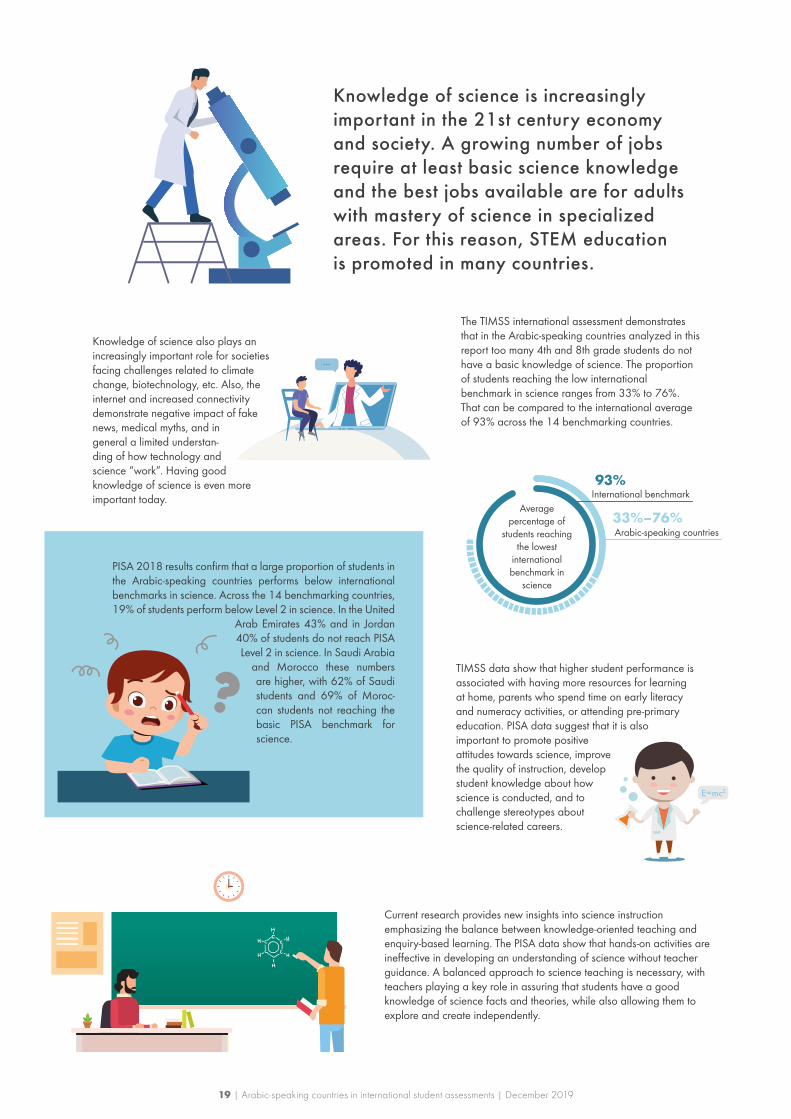
Knowledge of science also plays an increasingly important role for societies facing challenges related to climate change, biotechnology, etc. Also, the internet and increased connectivity demonstrate negative impact of fake news, medical myths, and in general a limited understan-ding of how technology and science “work”. Having good knowledge of science is even more important today.
The TIMSS international assessment demonstrates that in the Arabic-speaking countries analyzed in this report too many 4th and 8th grade students do not have a basic knowledge of science. The proportion of students reaching the low international benchmark in science ranges from 33% to 76%. That can be compared to the international average of 93% across the 14 benchmarking countries.
PISA 2018 results confirm that a large proportion of students in the Arabic-speaking countries performs below international benchmarks in science. Across the 14 benchmarking countries, 19% of students perform below Level 2 in science. In the United
Arab Emirates 43% and in Jordan 40% of students do not reach PISA Level 2 in science. In Saudi Arabia
and Morocco these numbers are higher, with 62% of Saudi students and 69% of Moroc-can students not reaching the basic PISA benchmark for science.
TIMSS data show that higher student performance is associated with having more resources for learning at home, parents who spend time on early literacy and numeracy activities, or attending pre-primary education. PISA data suggest that it is also important to promote positive attitudes towards science, improve the quality of instruction, develop student knowledge about how science is conducted, and to challenge stereotypes about science-related careers.
Knowledge of science is increasingly important in the 21st century economy and society. A growing number of jobs require at least basic science knowledge and the best jobs available are for adults with mastery of science in specialized areas. For this reason, STEM education is promoted in many countries.
Arabic-speaking countries33%–76%
Average percentage of
students reaching the lowest
international benchmark in
science
93%International benchmark
Current research provides new insights into science instruction emphasizing the balance between knowledge-oriented teaching and enquiry-based learning. The PISA data show that hands-on activities are ineffective in developing an understanding of science without teacher guidance. A balanced approach to science teaching is necessary, with teachers playing a key role in assuring that students have a good knowledge of science facts and theories, while also allowing them to explore and create independently.
19 | Arabic-speaking countries in international student assessments | December 2019
Knowledge of science also plays an increasingly important role for societies facing challenges related to climate change, biotechnology, etc. Also, the internet and increased connectivity demonstrate negative impact of fake news, medical myths, and in general a limited understan-ding of how technology and science “work”. Having good knowledge of science is even more important today.
The TIMSS international assessment demonstrates that in the Arabic-speaking countries analyzed in this report too many 4th and 8th grade students do not have a basic knowledge of science. The proportion of students reaching the low international benchmark in science ranges from 33% to 76%. That can be compared to the international average of 93% across the 14 benchmarking countries.
PISA 2018 results confirm that a large proportion of students in the Arabic-speaking countries performs below international benchmarks in science. Across the 14 benchmarking countries, 19% of students perform below Level 2 in science. In the United
Arab Emirates 43% and in Jordan 40% of students do not reach PISA Level 2 in science. In Saudi Arabia
and Morocco these numbers are higher, with 62% of Saudi students and 69% of Moroc-can students not reaching the basic PISA benchmark for science.
TIMSS data show that higher student performance is associated with having more resources for learning at home, parents who spend time on early literacy and numeracy activities, or attending pre-primary education. PISA data suggest that it is also important to promote positive attitudes towards science, improve the quality of instruction, develop student knowledge about how science is conducted, and to challenge stereotypes about science-related careers.
Knowledge of science is increasingly important in the 21st century economy and society. A growing number of jobs require at least basic science knowledge and the best jobs available are for adults with mastery of science in specialized areas. For this reason, STEM education is promoted in many countries.
Arabic-speaking countries33%–76%
Average percentage of
students reaching the lowest
international benchmark in
science
93%International benchmark
Current research provides new insights into science instruction emphasizing the balance between knowledge-oriented teaching and enquiry-based learning. The PISA data show that hands-on activities are ineffective in developing an understanding of science without teacher guidance. A balanced approach to science teaching is necessary, with teachers playing a key role in assuring that students have a good knowledge of science facts and theories, while also allowing them to explore and create independently.
20 | Arabic-speaking countries in international student assessments | December 2019
60100140180
Internationalbenchmark
Bahrain
Saudi Arabia
Kuwait
Oman
Morocco
United ArabEmirates
Egypt
60 100 140 180
Bahrain
Morocco
Internationalbenchmark
Saudi Arabia
Kuwait
Oman
Jordan
United ArabEmirates
Egypt
Variation in student performance and gender gaps
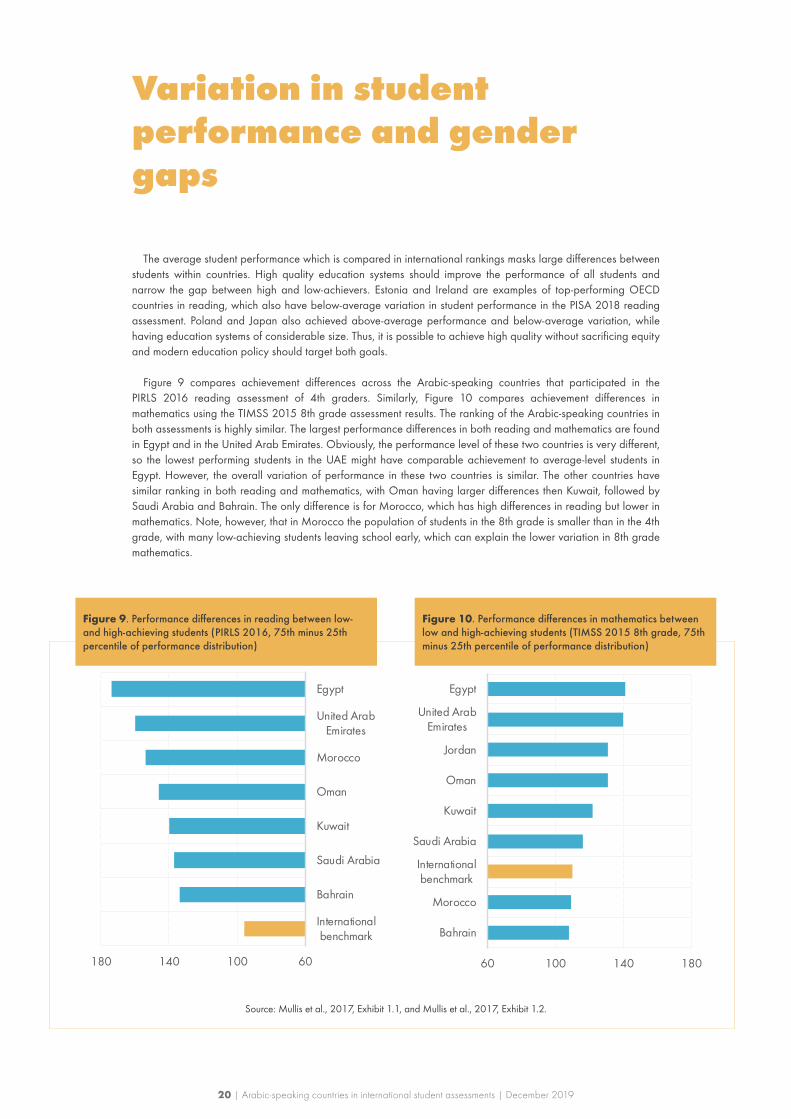
The average student performance which is compared in international rankings masks large differences between students within countries. High quality education systems should improve the performance of all students and narrow the gap between high and low-achievers. Estonia and Ireland are examples of top-performing OECD countries in reading, which also have below-average variation in student performance in the PISA 2018 reading assessment. Poland and Japan also achieved above-average performance and below-average variation, while having education systems of considerable size. Thus, it is possible to achieve high quality without sacrificing equity and modern education policy should target both goals.
Figure 9 compares achievement differences across the Arabic-speaking countries that participated in the PIRLS 2016 reading assessment of 4th graders. Similarly, Figure 10 compares achievement differences in mathematics using the TIMSS 2015 8th grade assessment results. The ranking of the Arabic-speaking countries in both assessments is highly similar. The largest performance differences in both reading and mathematics are found in Egypt and in the United Arab Emirates. Obviously, the performance level of these two countries is very different, so the lowest performing students in the UAE might have comparable achievement to average-level students in Egypt. However, the overall variation of performance in these two countries is similar. The other countries have similar ranking in both reading and mathematics, with Oman having larger differences then Kuwait, followed by Saudi Arabia and Bahrain. The only difference is for Morocco, which has high differences in reading but lower in mathematics. Note, however, that in Morocco the population of students in the 8th grade is smaller than in the 4th grade, with many low-achieving students leaving school early, which can explain the lower variation in 8th grade mathematics.
Figure 9. Performance differences in reading between low- and high-achieving students (PIRLS 2016, 75th minus 25th percentile of performance distribution)
Figure 10. Performance differences in mathematics between low and high-achieving students (TIMSS 2015 8th grade, 75th minus 25th percentile of performance distribution)
Source: Mullis et al., 2017, Exhibit 1.1, and Mullis et al., 2017, Exhibit 1.2.

21 | Arabic-speaking countries in international student assessments | December 2019
Strikingly, while variation in the benchmarking countries is slightly larger in mathematics than in reading, it is the opposite for the Arabic-speaking countries. Reading performance in all the countries considered, except Morocco, varies much more than in mathematics, and also the difference in relation to the international benchmark is much larger. For Morocco the data are probably not comparable due to different enrollment rates in the 4th and 8th grades. Thus, the key finding here is that achievement differences in reading are unusually large for the Arabic-speaking countries.
The large gap between boys and girls in reading is one of the explanations for the larger differences among students in the Arabic-speaking countries. The gender achievement gap in reading is commonly found across countries and international assessments. However, the reading performance advantage of girls is much larger in the Arabic-speaking countries. As shown in Figure 11, the largest gap is in Saudi Arabia, where girls outperform boys in primary school by 2/3 of a standard deviation (PIRLS 2016 results). In secondary school, the gap is smaller but still substantial – in PISA 2018 the gender gap in reading is close to half a standard deviation, which is one of the largest differences across countries. In primary school the gap is large in all countries with the smallest difference in Morocco, which is still twice as large as the gap found in the benchmarking countries. In secondary school, the PISA 2018 data show that the largest gender gap in reading performance is in the United Arab Emirates.
Across countries the achievement in mathematics is usually similar among boys and girls. Figure 12 shows that in the Arabic-speaking countries the gap in mathematics achievement is smaller, and in one (Morocco) negligible. However, the gap is still substantial in countries like Saudi Arabia, Bahrain, Jordan and Oman. Actually, these countries are the only participants in TIMSS 2015 in which girls substantially outperform boys in mathematics.
0 10 20 30 40 50 60 70
Internationalbenchmark
Morocco
United ArabEmirates
Kuwait
Egypt
Bahrain
Oman
Jordan
Saudi Arabia
PISA 2018
PIRLS 2016
-50 -40 -30 -20 -10 0 10
International benchmark
Morocco
Kuwait
Egypt
United Arab Emirates
Saudi Arabia
Bahrain
Jordan
Oman
8th grade
4th grade
Figure 12. Differences in mathematics peformance betwen boys and girls (boys minus girls; TIMSS 2015)
Figure 11. Advantage of girls over boys in reading (PISA 2018 and PIRLS 2016)
Source: OECD, 2019b, Table II.B1.7.1; and Mullis et al., 2017, Exhibit 1.5.
Source: Mullis et al., 2016a, Exhibits 1.10 and 1.11.

22 | Arabic-speaking countries in international student assessments | December 2019
-4 -3 -2 -1 0 1 2
Morocco
Saudi Arabia
Jordan
Internationalbenchmark
United ArabEmirates
A general finding from education research is that student achievement is associated with parents’ socio-economic status, or more precisely, with parents’ education, occupation, and various resources at home. Students from educated families have access to the cultural capital that most students from uneducated families can access only at school. They can also share with their parents more ambitious attitudes, higher self-esteem, or simply have more resources to support learning. They can also inherit the genes that are behind their parents’ success.
Every school system should support students from families with a lower socio-economic status and more limited resources, so as to make the association between family background and educational achievement weaker. While none of the systems tested in international assessments entirely succeeded in this goal, there are countries where student performance can be in large part predicted by parents’ status and systems in which the occupation of the father and mother, their educational attainement, and resources matter less for their child’s success.
The PISA assessment collects rich information about parents’ education, occupation, and home resources. This information is carefully analyzed so as to make international comparisons meaningful. The so-called ESCS index (PISA index of economic, social and cultural status) is a composite measure that can be used to compare student socio-economic background across countries, and also in relation to student performance.
Figure 13 compares the average socio-economic status of students in the four Arabic-speaking countries participating in PISA 2018. This index is standardized to have the average of zero and a standard deviation of one across the OECD countries. Thus, a positive value means that on average socio-economic status is higher in a country when compared to the OECD average. A negative value means that students have on average lower socio-economic status in relation to the OECD average.
Student socio-economic background and achievement
Figure 13. Median and range of socio-economic status in PISA 2018 (10th percentile, median, and 90th percentile of the PISA ESCS index)
Source: Authors' analysis of PISA 2018 data.
-4-3
-2-1
01
2
10th percentile median 90th percentile

23 | Arabic-speaking countries in international student assessments | December 2019
Among the four Arabic-speaking countries participating in PISA 2018, only the United Arab Emirates had a higher median socio-economic status than the 14 countries used as an international benchmark. Also, in the UAE, differences in the socio-economic status of student families are smaller than in other Arabic-speaking countries. Saudi Arabia and Jordan have a similar median socio-economic status of student families, but the differences are slightly larger in Saudi Arabia. Morocco has the lowest socio-economic status and the largest differences among students. This lower average socio-economic status can partly explain the much lower results of students in Morocco, but also to some extent the lower results in Saudi Arabia and Jordan.
In the evaluation of an education system a key question is how strong the relationship between family background and student achievement is. Figure 14 compares this relationship for reading using two measures: percentage of explained variance and the regression slope. The first measure shows how much of the variation in student reading scores can be explained by socio-economic status alone. The second measure shows how different the results are of students of various socio-economic status. In both cases, larger values suggest that socio-economic status plays a more important role for student achievement, or, in other words, that the education system is not able to minimize the association between student family background and learning.
Figure 14 shows that the strongest association between family background and reading achievement is in the United Arab Emirates and the weakest in Morocco and Jordan. In Saudi Arabia, the overall variation in student performance is smaller than in the United Arab Emirates or in countries forming the international benchmark, so the percentage of variance explained by socio-economic status is relatively large. However, the achievement differences between students of low and high socio-economic status are lower and similar to those found in Jordan.
Figure 14. Association between student family background and reading achievement in PISA 2018
Source: OECD, 2019b, Table II.B1.2.3.
7,1%7,7%
11,1%11,2% 11,5%
0%
2%
4%
6%
8%
10%
12%
14%
0
5
10
15
20
25
30
35
40
45
50
Morocco Jordan United ArabEmirates
Internationalbenchmark
SaudiArabia
ESCS slope share of variance explained by ESCS
24 | Arabic-speaking countries in international student assessments | December 2019
Student attitudes toward reading
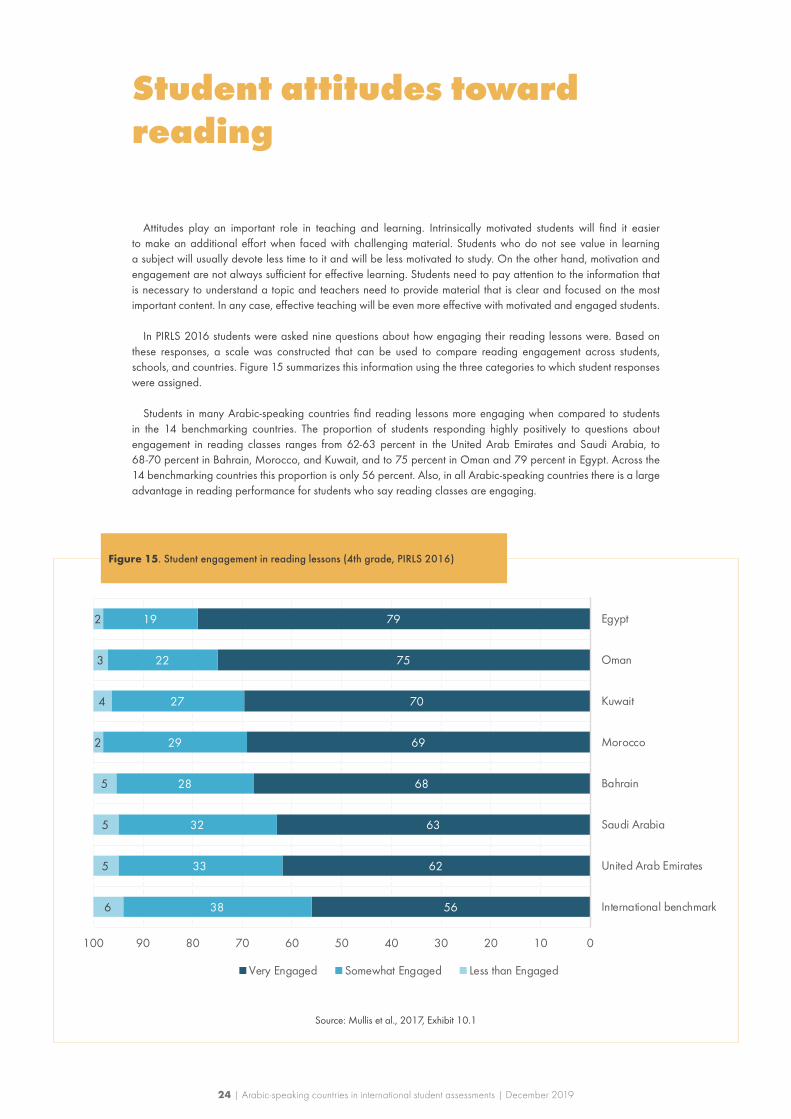
Attitudes play an important role in teaching and learning. Intrinsically motivated students will find it easier to make an additional effort when faced with challenging material. Students who do not see value in learning a subject will usually devote less time to it and will be less motivated to study. On the other hand, motivation and engagement are not always sufficient for effective learning. Students need to pay attention to the information that is necessary to understand a topic and teachers need to provide material that is clear and focused on the most important content. In any case, effective teaching will be even more effective with motivated and engaged students.
In PIRLS 2016 students were asked nine questions about how engaging their reading lessons were. Based on these responses, a scale was constructed that can be used to compare reading engagement across students, schools, and countries. Figure 15 summarizes this information using the three categories to which student responses were assigned.
Students in many Arabic-speaking countries find reading lessons more engaging when compared to students in the 14 benchmarking countries. The proportion of students responding highly positively to questions about engagement in reading classes ranges from 62-63 percent in the United Arab Emirates and Saudi Arabia, to 68-70 percent in Bahrain, Morocco, and Kuwait, and to 75 percent in Oman and 79 percent in Egypt. Across the 14 benchmarking countries this proportion is only 56 percent. Also, in all Arabic-speaking countries there is a large advantage in reading performance for students who say reading classes are engaging.
56
62
63
68
69
70
75
79
38
33
32
28
29
27
22
19
6
5
5
5
2
4
3
2
0102030405060708090100
International benchmark
United Arab Emirates
Saudi Arabia
Bahrain
Morocco
Kuwait
Oman
Egypt
Very Engaged Somewhat Engaged Less than Engaged
Figure 15. Student engagement in reading lessons (4th grade, PIRLS 2016)
Source: Mullis et al., 2017, Exhibit 10.1
25 | Arabic-speaking countries in international student assessments | December 2019
38
54
54
56
56
57
57
65
44
37
36
35
39
36
36
29
18
9
10
9
5
7
7
5
0102030405060708090100
International benchmark
United Arab Emirates
Bahrain
Egypt
Morocco
Kuwait
Saudi Arabia
Oman
Very much like reading Somewhat like reading Do not like reading
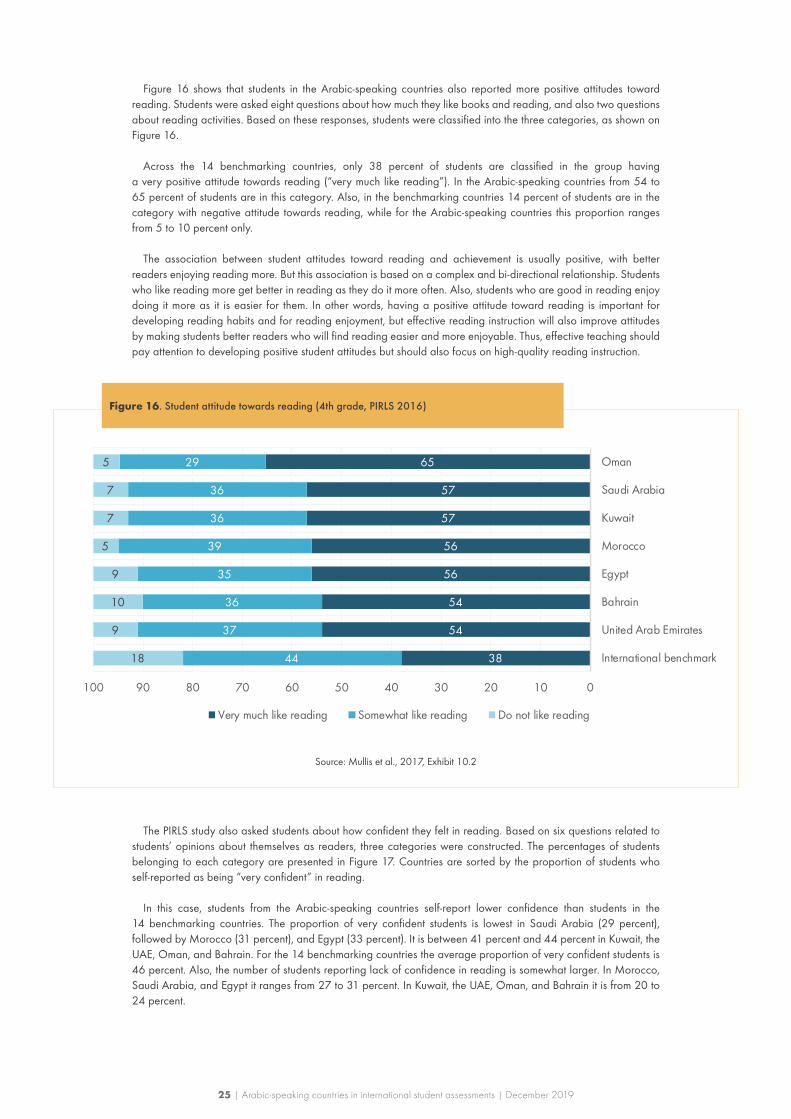
Figure 16 shows that students in the Arabic-speaking countries also reported more positive attitudes toward reading. Students were asked eight questions about how much they like books and reading, and also two questions about reading activities. Based on these responses, students were classified into the three categories, as shown on Figure 16.
Across the 14 benchmarking countries, only 38 percent of students are classified in the group having a very positive attitude towards reading (“very much like reading”). In the Arabic-speaking countries from 54 to 65 percent of students are in this category. Also, in the benchmarking countries 14 percent of students are in the category with negative attitude towards reading, while for the Arabic-speaking countries this proportion ranges from 5 to 10 percent only.
The association between student attitudes toward reading and achievement is usually positive, with better readers enjoying reading more. But this association is based on a complex and bi-directional relationship. Students who like reading more get better in reading as they do it more often. Also, students who are good in reading enjoy doing it more as it is easier for them. In other words, having a positive attitude toward reading is important for developing reading habits and for reading enjoyment, but effective reading instruction will also improve attitudes by making students better readers who will find reading easier and more enjoyable. Thus, effective teaching should pay attention to developing positive student attitudes but should also focus on high-quality reading instruction.
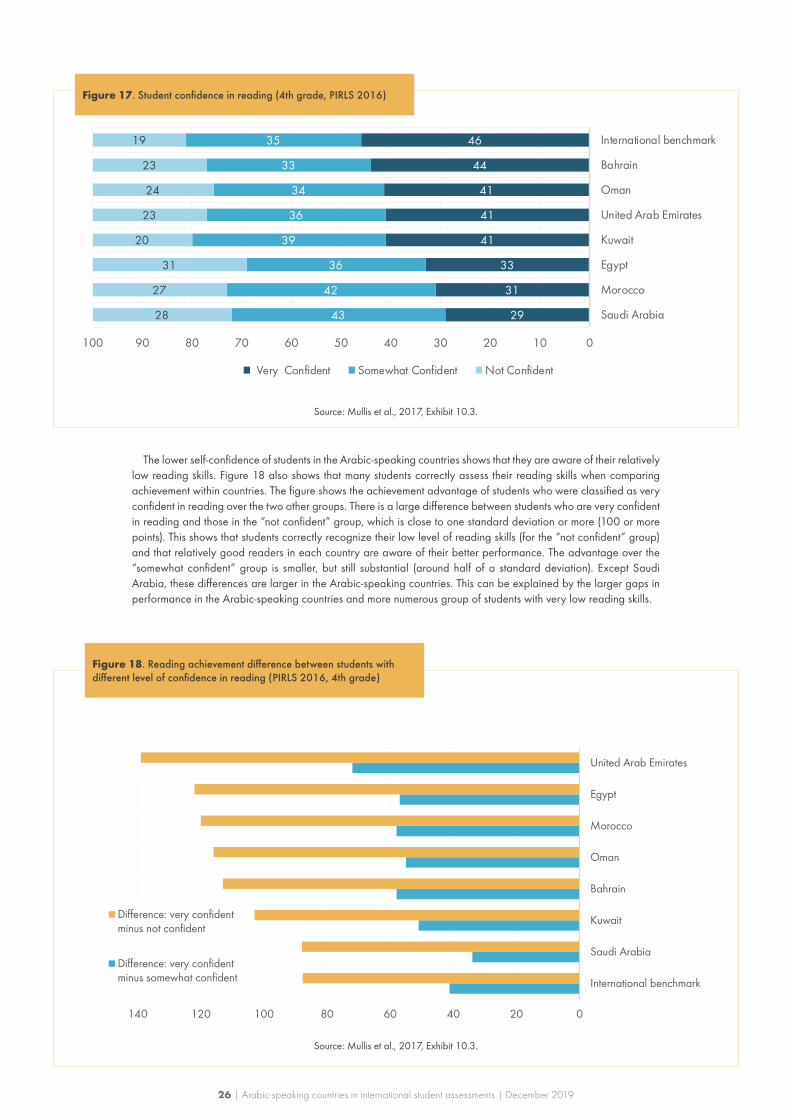
The PIRLS study also asked students about how confident they felt in reading. Based on six questions related to students’ opinions about themselves as readers, three categories were constructed. The percentages of students belonging to each category are presented in Figure 17. Countries are sorted by the proportion of students who self-reported as being “very confident” in reading.
In this case, students from the Arabic-speaking countries self-report lower confidence than students in the 14 benchmarking countries. The proportion of very confident students is lowest in Saudi Arabia (29 percent), followed by Morocco (31 percent), and Egypt (33 percent). It is between 41 percent and 44 percent in Kuwait, the UAE, Oman, and Bahrain. For the 14 benchmarking countries the average proportion of very confident students is 46 percent. Also, the number of students reporting lack of confidence in reading is somewhat larger. In Morocco, Saudi Arabia, and Egypt it ranges from 27 to 31 percent. In Kuwait, the UAE, Oman, and Bahrain it is from 20 to 24 percent.
Figure 16. Student attitude towards reading (4th grade, PIRLS 2016)
Source: Mullis et al., 2017, Exhibit 10.2
26 | Arabic-speaking countries in international student assessments | December 2019
The lower self-confidence of students in the Arabic-speaking countries shows that they are aware of their relatively low reading skills. Figure 18 also shows that many students correctly assess their reading skills when comparing achievement within countries. The figure shows the achievement advantage of students who were classified as very confident in reading over the two other groups. There is a large difference between students who are very confident in reading and those in the “not confident” group, which is close to one standard deviation or more (100 or more points). This shows that students correctly recognize their low level of reading skills (for the “not confident” group) and that relatively good readers in each country are aware of their better performance. The advantage over the “somewhat confident” group is smaller, but still substantial (around half of a standard deviation). Except Saudi Arabia, these differences are larger in the Arabic-speaking countries. This can be explained by the larger gaps in performance in the Arabic-speaking countries and more numerous group of students with very low reading skills.
29
31
33
41
41
41
44
46
43
42
36
39
36
34
33
35
28
27
31
20
23
24
23
19
0102030405060708090100
Saudi Arabia
Morocco
Egypt
Kuwait
United Arab Emirates
Oman
Bahrain
International benchmark
Very Confident Somewhat Confident Not Confident
Figure 17. Student confidence in reading (4th grade, PIRLS 2016)
Figure 18. Reading achievement difference between students with different level of confidence in reading (PIRLS 2016, 4th grade)
Source: Mullis et al., 2017, Exhibit 10.3.
Source: Mullis et al., 2017, Exhibit 10.3.
020406080100120140
International benchmark
Saudi Arabia
Kuwait
Bahrain
Oman
Morocco
Egypt
United Arab Emirates
Difference: very confidentminus not confident
Difference: very confidentminus somewhat confident
27 | Arabic-speaking countries in international student assessments | December 2019
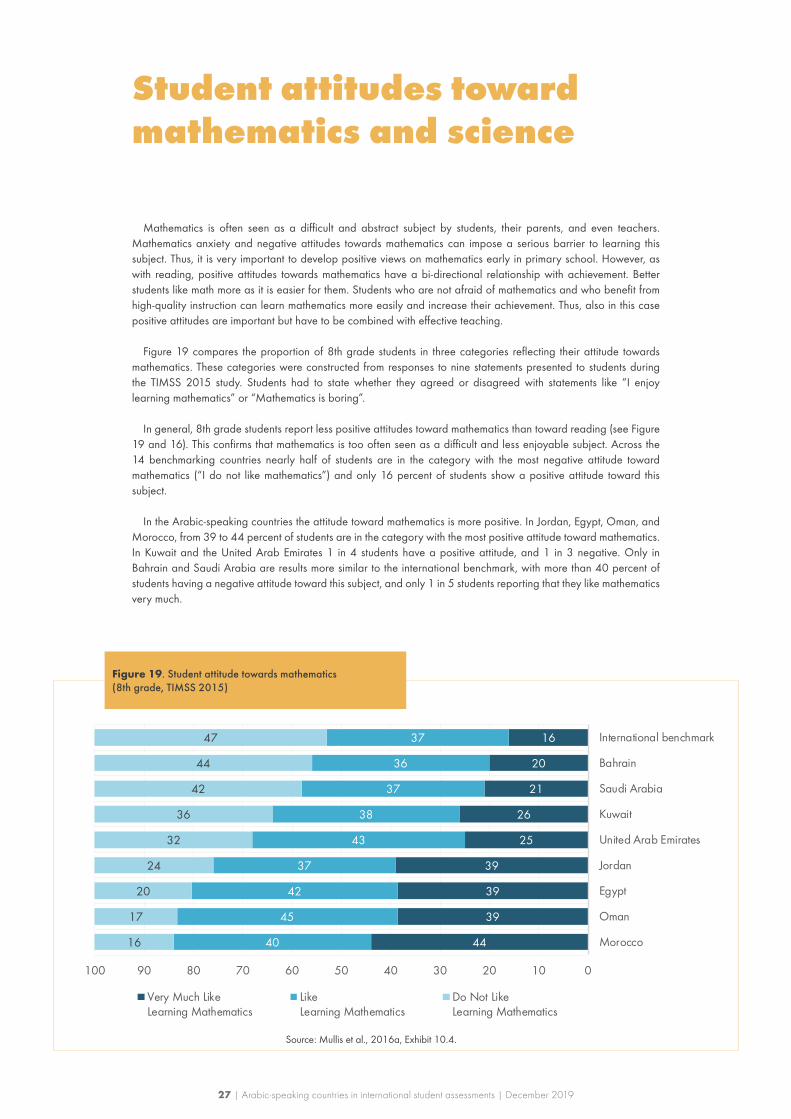
Mathematics is often seen as a difficult and abstract subject by students, their parents, and even teachers. Mathematics anxiety and negative attitudes towards mathematics can impose a serious barrier to learning this subject. Thus, it is very important to develop positive views on mathematics early in primary school. However, as with reading, positive attitudes towards mathematics have a bi-directional relationship with achievement. Better students like math more as it is easier for them. Students who are not afraid of mathematics and who benefit from high-quality instruction can learn mathematics more easily and increase their achievement. Thus, also in this case positive attitudes are important but have to be combined with effective teaching.
Figure 19 compares the proportion of 8th grade students in three categories reflecting their attitude towards mathematics. These categories were constructed from responses to nine statements presented to students during the TIMSS 2015 study. Students had to state whether they agreed or disagreed with statements like “I enjoy learning mathematics” or “Mathematics is boring”.
In general, 8th grade students report less positive attitudes toward mathematics than toward reading (see Figure 19 and 16). This confirms that mathematics is too often seen as a difficult and less enjoyable subject. Across the 14 benchmarking countries nearly half of students are in the category with the most negative attitude toward mathematics (“I do not like mathematics”) and only 16 percent of students show a positive attitude toward this subject.
In the Arabic-speaking countries the attitude toward mathematics is more positive. In Jordan, Egypt, Oman, and Morocco, from 39 to 44 percent of students are in the category with the most positive attitude toward mathematics. In Kuwait and the United Arab Emirates 1 in 4 students have a positive attitude, and 1 in 3 negative. Only in Bahrain and Saudi Arabia are results more similar to the international benchmark, with more than 40 percent of students having a negative attitude toward this subject, and only 1 in 5 students reporting that they like mathematics very much.
Student attitudes toward mathematics and science
44
39
39
39
25
26
21
20
16
40
45
42
37
43
38
37
36
37
16
17
20
24
32
36
42
44
47
0102030405060708090100
Morocco
Oman
Egypt
Jordan
United Arab Emirates
Kuwait
Saudi Arabia
Bahrain
International benchmark
Very Much LikeLearning Mathematics
LikeLearning Mathematics
Do Not LikeLearning Mathematics
Figure 19. Student attitude towards mathematics (8th grade, TIMSS 2015)
Source: Mullis et al., 2016a, Exhibit 10.4.

28 | Arabic-speaking countries in international student assessments | December 2019
As already mentioned, the positive attitude toward mathematics is strongly associated with student achievement. This is because better students find it easier to learn this subject and because their positive attitude helps them with learning and achieving better results. Figure 20, however, shows that the difference between students who like mathematics very much and those who do not like this subject is the largest in the 14 benchmarking countries and in the United Arab Emirates. The UAE is also the country with the best achievement in this subject. Thus, it shows that students provided with effective instruction and who are achieving good results also share more positive views on this subject. In other countries the differences are also substantial, but slightly smaller in Bahrain, Oman, Morocco, and Egypt. In Saudi Arabia, Kuwait, and Jordan students with different attitudes have, relatively speaking, the smallest difference in achievement.
For student learning, but also for a society as a whole, it is increasingly important to understand and value science. New technologies are changing our lives and to use them effectively and reasonably requires a good understanding of the science behind them. In addition, new technologies create new challenges, which can be faced only by societies with a good understanding of science and that value science and science teaching.
The TIMSS 2015 study asked several questions to students to measure whether they valued science or not. As before, students were classified into three categories based on responses to the nine statements that measured how important it was for students to learn science and how much they believed that knowing science was useful.
Figure 21 compares the Arabic-speaking countries to each other and to the international benchmark in terms of the proportion of students valuing science or not. Across the 14 benchmarking countries, 1 in 4 students do not value science, and only 1 in 3 students strongly value science. This is a striking difference from the much more positive view prevailing among students in the Arabic-speaking countries, where only a small proportion of students do not value science (from 6 percent in Egypt and Oman to 15 percent in Saudi Arabia), and where half of students or more strongly value science (68 percent in Jordan).
010203040506070
Jordan
Kuwait
Saudi Arabia
Egypt
Morocco
Oman
Bahrain
United Arab Emirates
International benchmark
Difference: very much likeminus do not likeDifference: very much likeminus like
Figure 20. Performance difference between students with different attitudes toward mathematics (TIMSS 2015, 8th grade, mathematics)
Source: Mullis et al., 2016a, Exhibit 10.4.

29 | Arabic-speaking countries in international student assessments | December 2019
010203040506070
Morocco
Saudi Arabia
International benchmark
Oman
Kuwait
Jordan
Bahrain
Egypt
United Arab Emirates
Difference: strongly valueminus do not value
Difference: strongly valueminus value
The more positive views on science are associated with higher performance in the subject. As shown in Figure 22, the difference is especially large in the United Arab Emirates and Egypt, where students strongly valuing science outperform those who do not by around 60-70 points and those who have moderate views on science by more than 40 points. The difference is smaller in Bahrain, Jordan, Kuwait, and Oman, but still substantial and close to or above the international benchmark. In Saudi Arabia and Morocco, the differences are much smaller and students who do not value science and those with moderate views have more similar achievement levels.
These results probably also reflect the bi-directional relationship between valuing science and science achievement. Students who know more about science can better understand its applications, new technologies, and the challenges related to it, which strengthen their positive view of it. Students who do not value science have much lower achievement levels, and thus they cannot understand how science contributes to our lives and society. These results show how important it is to teach science effectively and develop a common understanding among students, for example by showing them real-life science applications, that science plays an important role in the modern world, and that mastering basic science knowledge is necessary to fully participate in the modern economy and society.
29
48
49
52
54
59
62
65
68
45
39
36
34
36
33
32
29
25
26
13
15
14
10
8
6
6
7
0102030405060708090100
International benchmark
United Arab Emirates
Saudi Arabia
Bahrain
Kuwait
Morocco
Oman
Egypt
Jordan
Strongly ValueScience
ValueScience
Do Not ValueScience
Figure 21. Do students value science? (TIMSS 2015, 8th grade)
Figure 22. Valuing science and science achievement (TIMSS 2015, 8th grade)
Source: Mullis et al., 2016b, Exhibit 10.7.
Source: Mullis et al., 2016b, Exhibit 10.7.
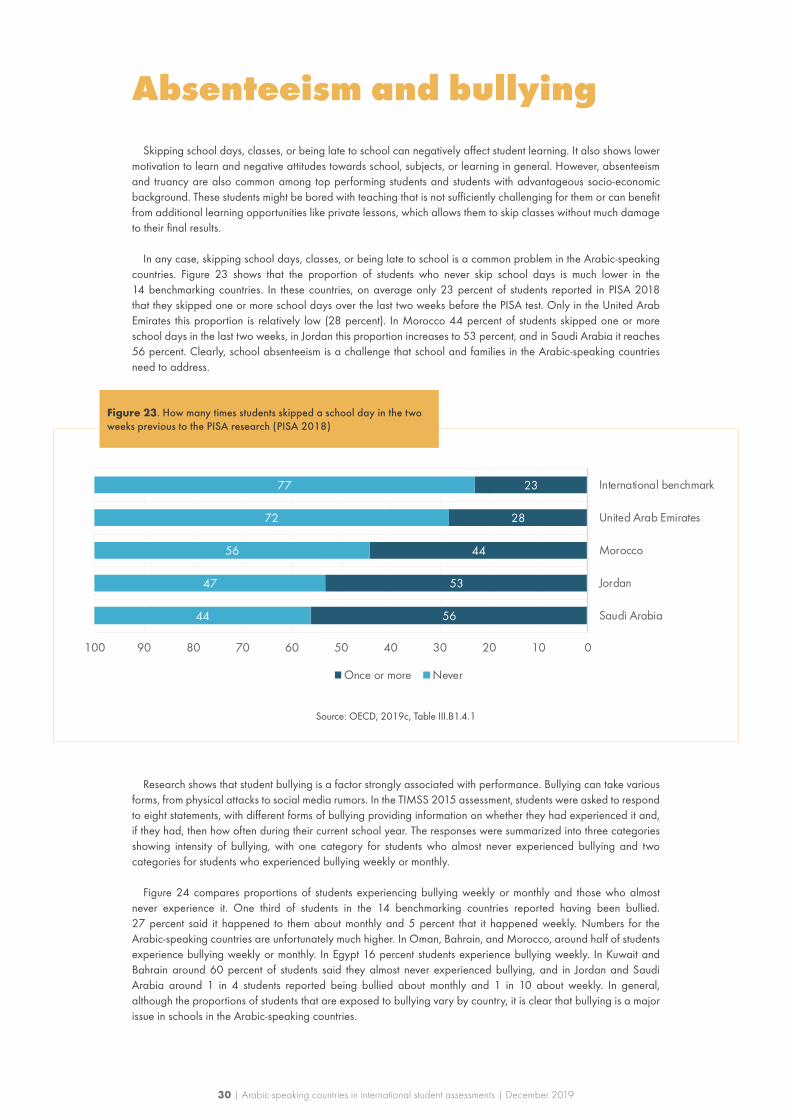
30 | Arabic-speaking countries in international student assessments | December 2019
56
53
44
28
23
44
47
56
72
77
0102030405060708090100
Saudi Arabia
Jordan
Morocco
United Arab Emirates
International benchmark
Once or more Never
Absenteeism and bullying
Skipping school days, classes, or being late to school can negatively affect student learning. It also shows lower motivation to learn and negative attitudes towards school, subjects, or learning in general. However, absenteeism and truancy are also common among top performing students and students with advantageous socio-economic background. These students might be bored with teaching that is not sufficiently challenging for them or can benefit from additional learning opportunities like private lessons, which allows them to skip classes without much damage to their final results.
In any case, skipping school days, classes, or being late to school is a common problem in the Arabic-speaking countries. Figure 23 shows that the proportion of students who never skip school days is much lower in the 14 benchmarking countries. In these countries, on average only 23 percent of students reported in PISA 2018 that they skipped one or more school days over the last two weeks before the PISA test. Only in the United Arab Emirates this proportion is relatively low (28 percent). In Morocco 44 percent of students skipped one or more school days in the last two weeks, in Jordan this proportion increases to 53 percent, and in Saudi Arabia it reaches 56 percent. Clearly, school absenteeism is a challenge that school and families in the Arabic-speaking countries need to address.
Research shows that student bullying is a factor strongly associated with performance. Bullying can take various forms, from physical attacks to social media rumors. In the TIMSS 2015 assessment, students were asked to respond to eight statements, with different forms of bullying providing information on whether they had experienced it and, if they had, then how often during their current school year. The responses were summarized into three categories showing intensity of bullying, with one category for students who almost never experienced bullying and two categories for students who experienced bullying weekly or monthly.
Figure 24 compares proportions of students experiencing bullying weekly or monthly and those who almost never experience it. One third of students in the 14 benchmarking countries reported having been bullied. 27 percent said it happened to them about monthly and 5 percent that it happened weekly. Numbers for the Arabic-speaking countries are unfortunately much higher. In Oman, Bahrain, and Morocco, around half of students experience bullying weekly or monthly. In Egypt 16 percent students experience bullying weekly. In Kuwait and Bahrain around 60 percent of students said they almost never experienced bullying, and in Jordan and Saudi Arabia around 1 in 4 students reported being bullied about monthly and 1 in 10 about weekly. In general, although the proportions of students that are exposed to bullying vary by country, it is clear that bullying is a major issue in schools in the Arabic-speaking countries.
Figure 23. How many times students skipped a school day in the two weeks previous to the PISA research (PISA 2018)
Source: OECD, 2019c, Table III.B1.4.1

31 | Arabic-speaking countries in international student assessments | December 2019
44%
49%
51%
55%
58%
60%
64%
64%
68%
41%
36%
38%
29%
32%
32%
26%
27%
27%
14%
15%
11%
16%
10%
8%
11%
9%
5%
0%10%20%30%40%50%60%70%80%90%100%
Oman
Bahrain
Morocco
Egypt
United Arab Emirates
Kuwait
Jordan
Saudi Arabia
International benchmark
Almost Never About Monthly About Weekly
Bullying is detrimental to student learning. Figure 25 shows that students who are bullied about weekly have much lower achievement than those who are almost never bullied. The largest gap, above 80 score points, is in Egypt, which is also the country with the largest proportion of students reporting being bullied about weekly. Thus, the strong negative effect on performance and prevalence of bullying in Egypt should be considered as a major issue in schools in this country. The effects in the UAE, Jordan and Saudi Arabia, are also strongly negative, and while in these countries bullying is less prevalent, the overall effect on student performance is negative and substantial. In Oman, Bahrain, and Morocco the negative effect of bullying on achievement is smaller, but it is also a major issue in these countries, considering the high proportion of bullied students.
Figure 25. Lower performance of bullied students (8th grade, mathematics, TIMSS 2015)
Figure 24. Percentage of 8th grade students reporting bullying in TIMSS 2015
Source: Mullis et al., 2016a, Exhibit 7.6.
Source: Mullis et al., 2016a, Exhibit 7.6.
0102030405060708090
Morocco
Kuwait
International benchmark
Bahrain
Oman
Saudi Arabia
Jordan
United Arab Emirates
Egypt
Difference: never minus weekly
Difference: never minus monthly

32 | Arabic-speaking countries in international student assessments | December 2019
Country examples
One of the striking results from the international assessments like PISA, TIMSS or PIRLS
is that most countries perform similarly across different years and assessments. Only
a few countries increased their performance over time, and for even fewer countries the
improvements were stable and confirmed by different international assessments. The stable results
of most countries and the small number of examples of countries with data showing consistent
improvement demonstrate how difficult it is to reform education systems. Since the first international
assessments in the 1990s, many countries have put substantial resources into education and many
reforms have been implemented. However, only a small number of countries have succeeded in their
attempts to substantially improve their student outcomes, as evidenced by results from international
assessments. It is important to understand how these countries reformed their education systems and
discuss whether these policies can be adapted to local circumstances to bring the same positive
effects elsewhere.
Across the PISA studies, only three OECD countries improved their performance over the years and
are now performing at or above the OECD average. Estonia joined PISA in 2006 and since then has
improved its reading performance, while sustaining high scores in mathematics and science. Poland
has participated in PISA since 2000 and has substantially improved achievement in reading and
mathematics. In 2000, Poland was below the OECD average in all subjects, while now performs
above it and is among the top performers in Europe. Portugal was far below the OECD average in
2000, but thanks to large improvements in all subjects performs now at the OECD average. All these
countries have improved their student outcomes thanks to the reforms, which we discuss below.

33 | Arabic-speaking countries in international student assessments | December 2019
ESTONIAEstonia is a small country in Northern Europe with less than 1.5 million people. Estonia is one of the best
educated nations in Europe. The proportion of adults with an upper secondary degree and of young people studying at the tertiary level are among the highest in Europe. In PIAAC, the only international assessment of adult competencies, Estonians outperformed other countries, showing a relatively high level of skills among older generations. While the Estonian economy is still catching up with other European countries after the transformation from the socialist economy, household income is more equitably distributed than in other countries.
In the PISA 2018 survey Estonia ranked first in reading performance among the OECD countries. While it performed well in science and mathematics, when assessed for the first time in 2006, Estonian students performed much lower in reading. Since then they have improved substantially, as shown in Figure A. It is worth noting that Estonian students show not only high competencies in all three subjects assessed in PISA, but that their performance also varies less than in most countries. In other words, it is a country with high results but also high equity.
Figure 26. Estonian results in PISA
An emphasis on equity, continuous investment in quality general education, and high expectations of but also the autonomy of teachers are the three key characteristics of the Estonian education system. While the system is decentralized, with a large degree of autonomy enjoyed by schools, it has to be noted that the number of schools and students is relatively small. Thus, consensus on and common ownership of reform might also be characteristics of the Estonian system, and this could be difficult to replicate in larger countries or less homogenous societies.
Investment into equity starts with government support for preschool education, which is subsidized and accessible to most families. In schools, free lunches and access to medical services, but also additional compensatory classes for struggling students, are provided to assure support for all students. Also, there are special programs and funding for students with special needs. It is often emphasized that all students should have equal opportunities to excel in school, and support for those from disadvantages backgrounds or having special needs is considered as obligatory and crucial for social cohesion, which is an important national goal.
The Estonian educational system provides equal access to preschool education, and also has a national curriculum that is obligatory for all students up to the age of 16. Thus, students follow the same education program for longer than is the case in many European countries and schools provide additional support for students to meet
EESSTTOONNIIAA
480
490
500
510
520
530
540
550
2006 2009 2012 2015 2018
reading mathematics science OECD Average
34 | Arabic-speaking countries in international student assessments | December 2019
the basic expectations as stated in the national curriculum. Students cannot be segregated by ability and tests are used for diagnostic, and not sorting, purposes. Grade repetition is rare and limited to special cases. In effect, Estonia not only performs above the OECD average, but also has the smallest proportion of students in the OECD not meeting the basic proficiency levels established by PISA (see Table I.1, OECD, 2019a).
All teachers in Estonia are required to have a Master’s degree and teacher education requires knowledge of theory, but also research and practical training in schools. The profession of teacher is highly valued in the society and teachers show a high level of professionalism, as confirmed in international studies like TALIS. Teachers benefit from a large degree of autonomy when it comes to teaching methods and the selection of textbooks or materials. Also, principals have some discretion as to how the curriculum is delivered in their schools, the recruitment of teachers, and allocation of their budget. This extensive autonomy is accompanied by an accountability system in which student outcomes play the central role.
Finally, the Estonian system emphasizes the role of research, monitoring, and professional development. Estonia participates in most international assessments. To become a teacher, one needs to defend a research thesis. The system is small, but monitored with standardized assessments, data collected through the national information system, and research conducted at universities in collaboration with the ministry of education. As part of their professional duties, data and evidence are routinely analyzed by the ministry but also school principals and teachers.
POLANDPoland is a country in Central Europe with a population around 36 million people and a relatively large
education system. Its capital, Warsaw, has more students than Estonia and results comparable to students from Singapore. The whole country, however, is very diversified and socio-economic differences between the big cities and rural areas are large. Despite the fast-growing economy, access to high-quality education and, for example, preschool services, is still limited in many rural areas.
Poland has participated in PISA since the first edition in 2000. The first results were highly unsatisfactory, with average student performance below the OECD average and one of the largest differences between schools across the OECD countries. However, PISA 2000 assessed the last cohort of students who went through the education system before the reform that was implemented in 1999. The goals of the 1999 reform were to improve the quality of education and to increase educational opportunities for all students. The reform also responded to the changing economy, which since the 1990s has had the highest rate of growth across the OECD countries. In other words, the reform was necessary as the demand for skilled workers had been increasing and the education system had to respond by improving general education and by increasing the number of students continuing education at the tertiary level.
The education reforms in Poland had one overarching idea behind them: to expand comprehensive education so as to provide learning opportunities for all students. The structural reform of 1999 replaced 8 years of primary school with 9 years of comprehensive education in primary and lower secondary schools. The curricular reform of 2008 introduced a new requirement for all vocational schools to cover at least a one-year equivalent of the core subjects taught in academic schools. In a way, it also completed the reforms begun in 1999, through the introduction of a consistent curriculum emphasizing key competences from preschool up to the end of upper secondary education. Finally, reform of early education began in 2009 and was continued until 2015. It introduced obligatory education for 5-year-olds and extended the right to a preschool education to 3- and 4-year-olds. Overall, the reforms expanded the length of obligatory comprehensive education from 8 to 10 years. In 2015, general education began at the age of 3 and continued until the age of 16. Unfortunately, in 2016 these reforms were in large part reversed and now the period of general education is similar length to what had been in place before 1999.

35 | Arabic-speaking countries in international student assessments | December 2019
The goal of the reforms was to encourage as many students as possible to continue education and to open a way to tertiary education for them. In 2000, only 12.5 percent of Polish 30-34-year-olds benefited from having a tertiary degree. Between 2000 and 2018 Poland experienced the largest increase across the EU in the proportion of young people obtaining a tertiary diploma (by 33 percentage points). Despite this increase, the market premium for a tertiary education diploma is now comparable to the average across the EU or OECD countries. Evaluation of the 1999 reform in Poland also shows that it improved salaries and decreased the probability of unemployment for students who benefited from the reform.
The foundations for a modern, effective school system were established by the 1999 reform, which not only modified the structure of schools but also increased school and teacher autonomy, freed-up the textbook market, introduced standardized national exams, changed the professional development scheme for teachers, introduced a new financing system that allocated funds according to the per-pupil formula, further decentralized the system, and initiated curriculum changes. The reforms were successfully continued in 2007 with further curriculum reform that enhanced teacher autonomy and shifted the focus to learning outcomes. The school evaluation reform and early education reforms that started in 2008 and continued until 2015 further strengthened the foundations of the education system. The results from PISA and other international assessments show the positive outcomes of these reforms.
International assessments document large improvements in student outcomes over the last 20 years. In PISA, Poland is the only OECD country that has improved its performance – from below the OECD average level to above-average. The latest results from TIMSS and PIRLS also show improved outcomes in primary education. Finally, the PIAAC assessments of adults show that only the youngest cohorts perform at or above the OECD average.
Figure 27 presents the average performance of Polish students in PISA since 2000. Average performance increased between 2000 and 2006 thanks to the better performance of low-achieving students. Also, the performance-differences between schools decreased from one of the largest to one of the smallest across the OECD countries, which was the effect of postponing student segregation to different types of upper secondary schools. In fact, across 2000 and 2018 Poland experienced the largest improvement among the lowest performing students across the OECD countries, which can be attributed to the strengthening of the compulsory general education that was made obligatory for all students up to the age of 16. The latest improvements, mostly in mathematics, can be associated with the reform of the curriculum and school evaluation system, which both focus on learning outcomes and improvement of teaching quality.
Figure 27. Polish results in PISA
Poland
470
480
490
500
510
520
530
2000 2003 2006 2009 2012 2015 2018
reading mathematics science OECD Average
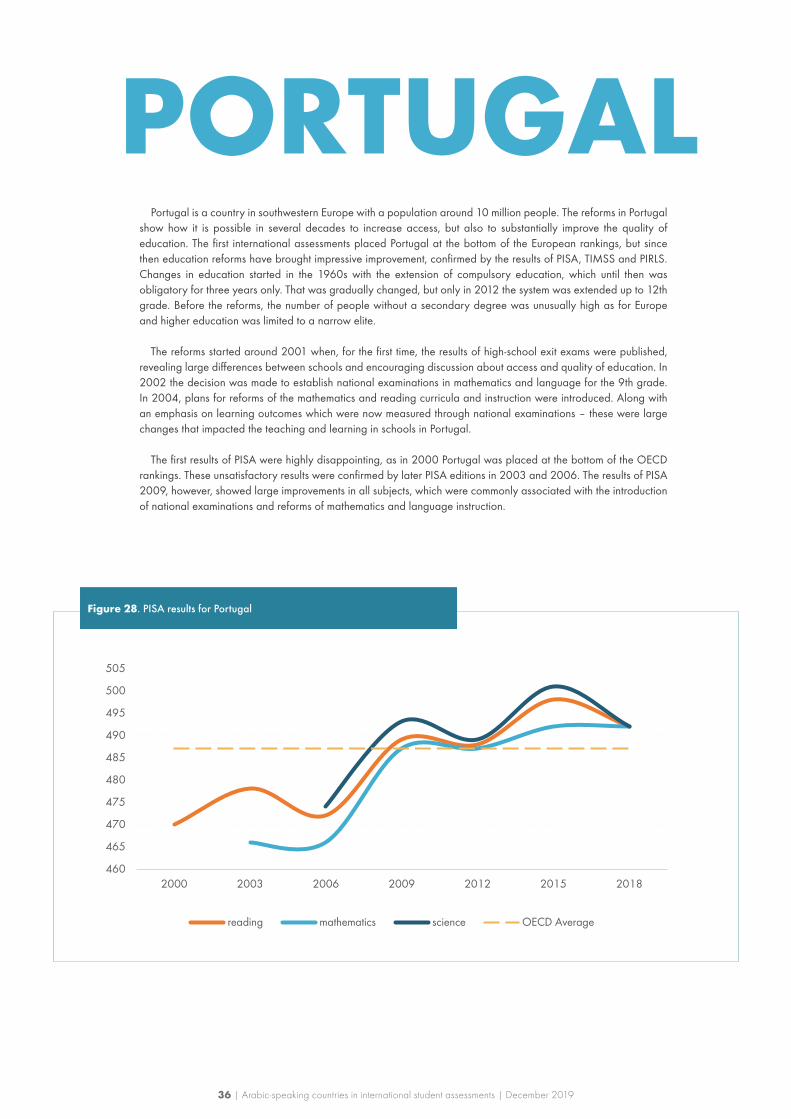
36 | Arabic-speaking countries in international student assessments | December 2019
PORTUGALPortugal is a country in southwestern Europe with a population around 10 million people. The reforms in Portugal
show how it is possible in several decades to increase access, but also to substantially improve the quality of education. The first international assessments placed Portugal at the bottom of the European rankings, but since then education reforms have brought impressive improvement, confirmed by the results of PISA, TIMSS and PIRLS. Changes in education started in the 1960s with the extension of compulsory education, which until then was obligatory for three years only. That was gradually changed, but only in 2012 the system was extended up to 12th grade. Before the reforms, the number of people without a secondary degree was unusually high as for Europe and higher education was limited to a narrow elite.
The reforms started around 2001 when, for the first time, the results of high-school exit exams were published, revealing large differences between schools and encouraging discussion about access and quality of education. In 2002 the decision was made to establish national examinations in mathematics and language for the 9th grade. In 2004, plans for reforms of the mathematics and reading curricula and instruction were introduced. Along with an emphasis on learning outcomes which were now measured through national examinations ‒ these were large changes that impacted the teaching and learning in schools in Portugal.
The first results of PISA were highly disappointing, as in 2000 Portugal was placed at the bottom of the OECD rankings. These unsatisfactory results were confirmed by later PISA editions in 2003 and 2006. The results of PISA 2009, however, showed large improvements in all subjects, which were commonly associated with the introduction of national examinations and reforms of mathematics and language instruction.
Figure 28. PISA results for Portugal
Figure C. PISA results for Portugal.
460
465
470
475
480
485
490
495
500
505
2000 2003 2006 2009 2012 2015 2018
reading mathematics science OECD Average
37 | Arabic-speaking countries in international student assessments | December 2019
Portugal was heavily affected by the most recent economic crisis in 2009, which resulted in large spending cuts on health, pensions, and education. Despite that, the expansion of compulsory education up to grade 12 was continued. Moreover, changes in curriculum were implemented with, for example, English introduced as an obligatory subject. These changes were followed by more substantial reforms that focused on teaching quality.
The reforms begun in 2011 had five pillars. First, an ambitious, knowledge-rich curriculum was introduced with standards related to the learning outcomes established for each subject. The curriculum prioritized basic competences in elementary school, which focused on reading fluency and basic concepts and skills in mathematics, and at later stages it included other key subjects like history and biology. Curriculum reforms were aligned with changes in textbooks, which related content to new standards and assessments. National assessments and independent school evaluations were the second key component of the changes. From then on, all students and schools were assessed using the same tools and by a semi-independent, newly established evaluation body. Third, schools were encouraged to support struggling students so as to limit grade repetition and to promote educational success for all students. Additional hours for individual support or group lessons was sponsored by the ministry to meet these objectives. Fourth, schools were given some autonomy and rewarded for required outcomes, which was a big change from a centralized system in which previously all schools and teachers had identical settings throughout the country. Finally, the reform introduced new solutions in vocational education, mostly to encourage businesses to invest in education, or closely matched to labor market needs.
PISA outcomes for Portugal demonstrate that the overall impact of these reforms on student outcomes is highly positive. Portugal performs now close to or even above the OECD average in PISA, and it also does well in other international assessments like TIMSS or PIRLS. In just two decades, Portugal made enormous progress in education, which is documented by the large improvement in student performance. The well-structured curriculum, clear and higher expectations aligned with an accountability system, and commitment to investment in education are the key principles for the successful reforms in Portugal.

38 | Arabic-speaking countries in international student assessments | December 2019
References ▮ Crato N. (2020), Curriculum and educational reforms
in Portugal: An analysis on why and how students’
knowledge and skills improved. In: Fernando M.
Reimers, ed., Audacious Education Purposes: How
governments transform the goals of education systems,
Springer. in Euro
▮ Jakubowski, Maciej and Pokropek, Artur, (2015),
Reading achievement progress across countries,
International Journal of Educational Development, 45,
issue C, p. 77-88.
▮ Jakubowski, M., Konarzewski, K., Muszyński, M,
Smulczyk, M., Walicki, P. (2017), Szkolne talenty
Europy u progu zmian. Polscy uczniowie w najnowszych
badaniach międzynarodowych. Raport Fundacji
Evidence Institute i Związku Nauczycielstwa Polskiego.
Retrieved at www.evidenceinstitute.pl (in Polish)
▮ Jakubowski M., (2020), Polish education reforms
and evidence from international assessments. In:
N. Crato (2020), What Makes Countries Improve
Education. A Contrasted Analysis of 10 Countries
Results in PISA 2018, Springer.
▮ Kitsing M. (2017), Country box on Estonia in:
Jakubowski et al. (2017).
▮ Mullis, I.V.S., Martin, M.O., Foy, P., & Hooper,
M, (2016a), TIMSS 2015 International Results in
Mathematics.
▮ Mullis, I.V.S., Martin, M.O., Foy, P., & Hooper, M,
(2016b). TIMSS 2015 International Results in Science.
▮ Mullis, I.V.S., Martin, M.O., Foy, P., & Hooper, M,
(2017). PIRLS 2016 International Results in Reading.
▮ OECD, (2019a), PISA 2018 Results (Volume I). What
Students Know and Can Do. Paris, OECD Publishing.
▮ OECD, (2019b), PISA 2018 Results (Volume II). Where
All Students Can Succeed. Paris, OECD Publishing.
▮ OECD (2019c), PISA 2018 Results (Volume III): What
School Life Means for Students’ Lives, PISA, OECD
Publishing, Paris.
▮ Patrinos, Harry Anthony; Angrist, Noam, (2018),
Global Dataset on Education Quality: A Review and
Update (2000-2017). Policy Research working paper;
no. WPS 8592. Washington, D.C. : World Bank Group.
39 | Arabic-speaking countries in international student assessments | December 2019
AnnexThis report analyzes data from several international student assessments for the eight Arabic-speaking countries. Four of them participated in the most recent PISA 2018 study: Jordan, Morocco, Saudi Arabia, and the United Arab Emirates. Their results were combined with results from the other two most recent international assessments PIRLS 2016 and TIMSS 2015, in which four other countries participated ‒ Bahrain, Egypt, Kuwait, and Oman.
PISA, TIMSS, and PIRLS all use different assessment scales. Thus, their results are not directly comparable. The rankings cannot be compared too as different groups of countries participate in each study. OECD PISA scale is standardized to have distribution with average equal to 500 and standard deviation of 100 across the OECD countries (weighting each country equally). Although the OECD group evolved over the years, the PISA scale provides a reasonably stable reference point. Thus, in our analysis, we re-scale the results of TIMSS and PIRLS to the PISA scale. In the end, all results can be interpreted as presented on the OECD PISA scale, although the linking process is simple and based on difficult-to-test assumptions, so the results must be interpreted with caution. For more sophisticated approaches, one can see (Patrinos and Angrist, 2018; Jakubowski and Pokropek, 2015). However, in our case, these more sophisticated approaches would yield similar policy conclusions as they do not alternate rankings of countries considered in this report.
For the sake of brevity and comparability, we constructed in this report the International Average Benchmark. There are 14 benchmarking countries that participated in all the most recent PISA, TIMSS, and PIRLS assessments, e.g., PISA 2012, 2015, 2018, TIMSS 2015 4th and 8th grade, and PIRLS 2016. These countries have relatively stable achievement results across these studies, which allows creating a reliable benchmark for our comparisons. For these countries, we calculate average performance in PISA 2012, 2015, and 2018. We use average performance in PISA 2018 as a benchmark for reading, as this edition focused on measuring reading. For mathematics, PISA 2012 is the benchmark as mathematics was the main domain in this edition. Finally, we use PISA 2015 as a benchmark for science as it was the main domain in this edition.
Table A1 on the next page shows results for all 14 benchmarking countries and for the eight Arabic-speaking countries across all compared international assessments. The difference between the average PISA result and the average TIMSS or PIRLS result for the 14 benchmarking countries is used to shift TIMSS or PIRLS results for the eight Arabic-speaking countries and put them on PISA-comparable scale. The difference is equal 51 points for reading (e.g. the average of 551 points in PIRLS compared to 500 points in PISA 2018), 25 points for mathematics in the 8th grade and 38 points in the 4th grade, and in science 26 points for the 8th grade and 34 points for the 4th grade. No further adjustments have been made. The table presents original results for PISA and adjusted results for PIRLS and TIMSS.
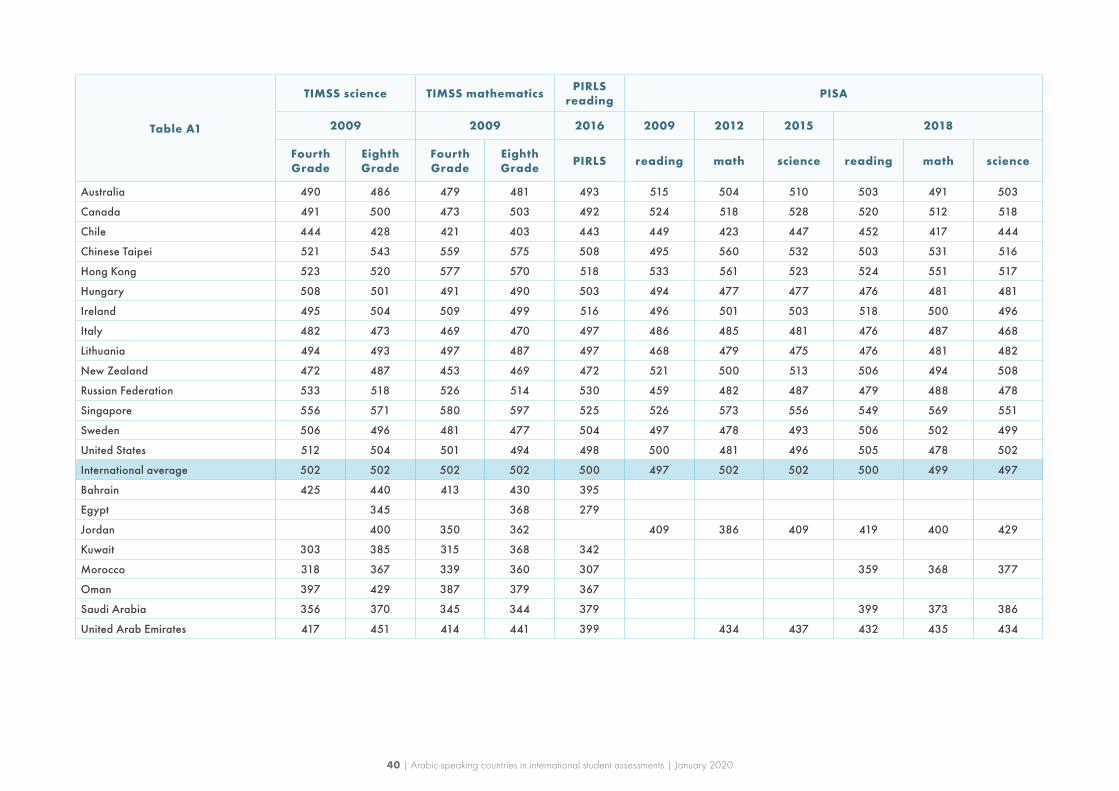
40 | Arabic-speaking countries in international student assessments | January 2020
Table A1
TIMSS science TIMSS mathematics PIRLS reading PISA
2009 2009 2016 2009 2012 2015 2018
Fourth Grade
Eighth Grade
Fourth Grade
Eighth Grade PIRLS reading math science reading math science
Australia 490 486 479 481 493 515 504 510 503 491 503
Canada 491 500 473 503 492 524 518 528 520 512 518
Chile 444 428 421 403 443 449 423 447 452 417 444
Chinese Taipei 521 543 559 575 508 495 560 532 503 531 516
Hong Kong 523 520 577 570 518 533 561 523 524 551 517
Hungary 508 501 491 490 503 494 477 477 476 481 481
Ireland 495 504 509 499 516 496 501 503 518 500 496
Italy 482 473 469 470 497 486 485 481 476 487 468
Lithuania 494 493 497 487 497 468 479 475 476 481 482
New Zealand 472 487 453 469 472 521 500 513 506 494 508
Russian Federation 533 518 526 514 530 459 482 487 479 488 478
Singapore 556 571 580 597 525 526 573 556 549 569 551
Sweden 506 496 481 477 504 497 478 493 506 502 499
United States 512 504 501 494 498 500 481 496 505 478 502
International average 502 502 502 502 500 497 502 502 500 499 497
Bahrain 425 440 413 430 395
Egypt 345 368 279
Jordan 400 350 362 409 386 409 419 400 429
Kuwait 303 385 315 368 342
Morocco 318 367 339 360 307 359 368 377
Oman 397 429 387 379 367
Saudi Arabia 356 370 345 344 379 399 373 386
United Arab Emirates 417 451 414 441 399 434 437 432 435 434
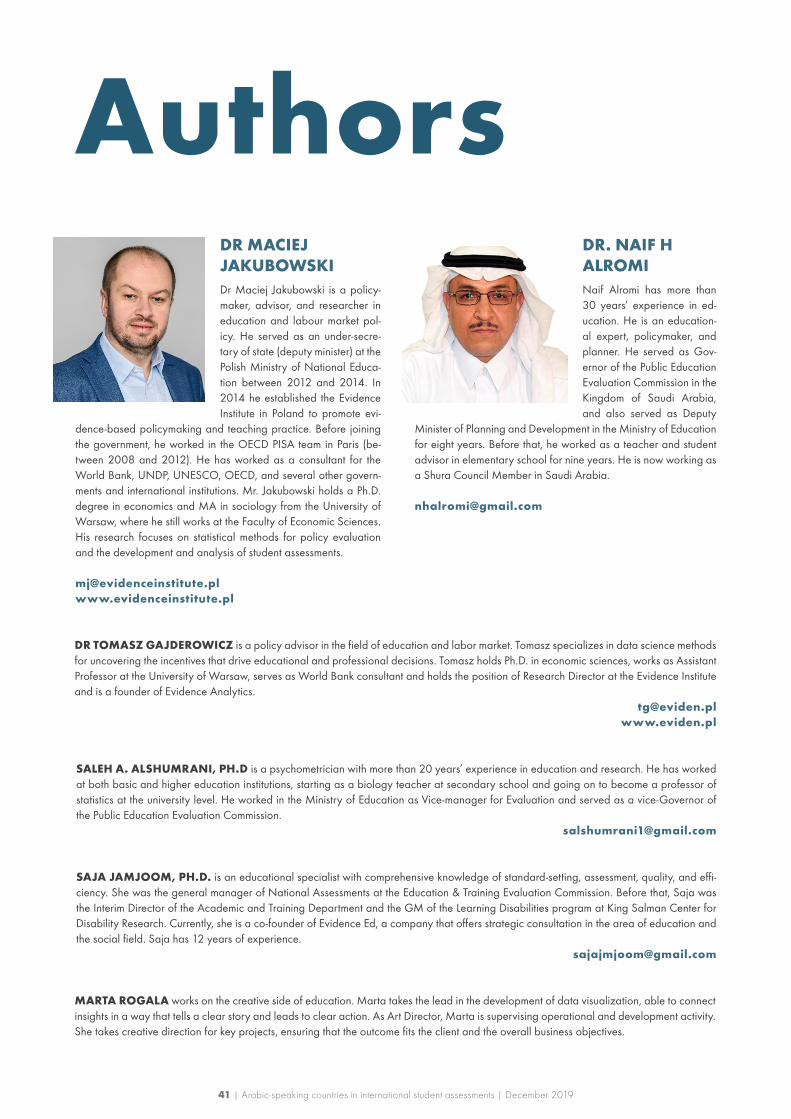
41 | Arabic-speaking countries in international student assessments | December 2019
AuthorsDR. NAIF H ALROMINaif Alromi has more than 30 years’ experience in ed-ucation. He is an education-al expert, policymaker, and planner. He served as Gov-ernor of the Public Education Evaluation Commission in the Kingdom of Saudi Arabia, and also served as Deputy
Minister of Planning and Development in the Ministry of Education for eight years. Before that, he worked as a teacher and student advisor in elementary school for nine years. He is now working as a Shura Council Member in Saudi Arabia.
DR MACIEJ JAKUBOWSKI Dr Maciej Jakubowski is a policy-maker, advisor, and researcher in education and labour market pol-icy. He served as an under-secre-tary of state (deputy minister) at the Polish Ministry of National Educa-tion between 2012 and 2014. In 2014 he established the Evidence Institute in Poland to promote evi-
dence-based policymaking and teaching practice. Before joining the government, he worked in the OECD PISA team in Paris (be-tween 2008 and 2012). He has worked as a consultant for the World Bank, UNDP, UNESCO, OECD, and several other govern-ments and international institutions. Mr. Jakubowski holds a Ph.D. degree in economics and MA in sociology from the University of Warsaw, where he still works at the Faculty of Economic Sciences. His research focuses on statistical methods for policy evaluation and the development and analysis of student assessments.
SAJA JAMJOOM, PH.D. is an educational specialist with comprehensive knowledge of standard-setting, assessment, quality, and effi-ciency. She was the general manager of National Assessments at the Education & Training Evaluation Commission. Before that, Saja was the Interim Director of the Academic and Training Department and the GM of the Learning Disabilities program at King Salman Center for Disability Research. Currently, she is a co-founder of Evidence Ed, a company that offers strategic consultation in the area of education and the social field. Saja has 12 years of experience.
SALEH A. ALSHUMRANI, PH.D is a psychometrician with more than 20 years’ experience in education and research. He has worked at both basic and higher education institutions, starting as a biology teacher at secondary school and going on to become a professor of statistics at the university level. He worked in the Ministry of Education as Vice-manager for Evaluation and served as a vice-Governor of the Public Education Evaluation Commission.
DR TOMASZ GAJDEROWICZ is a policy advisor in the field of education and labor market. Tomasz specializes in data science methods for uncovering the incentives that drive educational and professional decisions. Tomasz holds Ph.D. in economic sciences, works as Assistant Professor at the University of Warsaw, serves as World Bank consultant and holds the position of Research Director at the Evidence Institute and is a founder of Evidence Analytics.
MARTA ROGALA works on the creative side of education. Marta takes the lead in the development of data visualization, able to connect insights in a way that tells a clear story and leads to clear action. As Art Director, Marta is supervising operational and development activity. She takes creative direction for key projects, ensuring that the outcome fits the client and the overall business objectives.