Embed Size (px)
Citation preview

Vol. 1, No. 2 May 2011
The Arab Social Media Report aims to inform a better understanding of the impact of social media on development and growth in the Arab region by exploring the following questions:
• What are the penetration trends of social networking services in the Arab region?
• What is the growth rate, and what is the demographic and gender breakdown?
• What factors affect the adoption of these platforms in different Arab countries (e.g., income, youth population, digital access, Internet freedom, etc.)?
• What is the impact of these phenomena on citizen engagement and social inclusion? What is the impact of the new social networking dynamics on innovation and entrepreneurship?
Ultimately, we hope that the report findings shed light on the role that social media played during the civil movements in the region in 2011.
OverviewUntil recently, experts theorized about the promises of social networking technologies, including their ability to influence a participatory governance model, grassroots civic engagement, new social dynamics, inclusive societies and new opportunities for businesses and entrepreneurs. A few months into 2011, there is more evidence suggesting that some of these promises can prove realistic. Today, social media tools have merged online and offline identities, while playing an arguably critical role in dramatic changes sweeping the Arab region. Governments and businesses alike have taken notice of the potential offered by the increased penetration of social networking tools in the Arab region, and new trends in governance and business are emerging. Facebook continues to be the most popular social networking tool in the Arab region, and the inaugural Arab Social Media Report focused on Facebook usage as the primary metric of social media usage in the Arab region. In this second edition of the report, in addition to Facebook our research expands to Twitter, another social networking platform which has been influential on several levels during the first quarter of the year.
Produced by the Dubai School of Government’s Governance and Innovation Program, the second Arab Social Media Report highlights and specifically analyzes usage trends of online social networking across the Arab region based on data collected in the first quarter of 2011. In this edition, the report analyzes data on Twitter and Facebook users in all 22 Arab countries, in addition to Iran, Israel and Turkey, highlighting the role they played in the civil movements that swept the region during that period. This is part of a larger research initiative focusing on social engagement through ICT for better policy in Arab states, which explores the use of social networking services in governance, social inclusion and entrepreneurship promotion. The initiative also studies the potential of social networking applications for increasing collaboration, knowledge sharing and innovation, both between and among government entities, citizens and the private sector.
1. IntroductionSocial media tools have continued to grow in popularity throughout the first quarter of 2011. Facebook and Twitter, for example, have expanded their user base and platforms significantly. Facebook has over 677 million users as of April (with the Middle East constituting one of the regions that
Civil Movements: The Impact of Facebook and Twitter
This report, along with updated information, charts and links to social networking ASMR group pages are available at:
www.ArabSocialMediaReport.com.
For questions or media enquiries please direct emails to the authors at:
2 Arab Social Media Report Vol. 1, No. 2
80
70
60
50
40
30
20
10
0Jan 23 Jan 30 Feb 06 Feb 13 Feb 20
Figure 1: Syria: Social Media Internet Traffic Before and After Lifting the Ban on Social Media(February 7, 2011) - YouTube as an example8
contributed the largest amount of new users)1. Its mobile users have exceeded 250 million2 subscribers. Twitter users also exceeded 200 million users at the end of March.3 Collectively, these 200 million users tweet about 4 billion tweets a month.4
The first three months of 2011 saw what can only be termed a substantial shift in the Arab world’s usage of social media towards online social and civil mobilization online, whether by citizens — to organize demonstrations (both pro- and anti-government), disseminate information within their networks, and raise awareness of ongoing events locally and globally – or by governments, in some cases to engage with citizens and encourage their participation in government processes, while in other cases to block access to websites and monitor and control information on these sites.5 Figures 1, 2 and 36 illustrate the Internet blackouts in several Arab countries during first quarter of 2011.7 Egypt’s blackout lasted for five days, from January 28 – February 2. Meanwhile, Libya - at the time of accessing the site (April 20, 2011) - still seemed to be suffering from low Internet access and reduced traffic. Conversely, in the case of Syria, with the lift of the ban on social media websites by the government on February 7, YouTube and other social media traffic increased significantly.
Facebook has over 677 million users as of April (with the Middle East constituting one of the regions that contributed the largest amount of new users) . Its mobile users have exceeded 250 million subscribers. Twitter users also exceeded 200 million users at the end of March. Collectively, these 200 million users tweet
about 4 billion tweets a month.
1 http://www.insidefacebook.com/2011/05/11/facebook-surpasses-677-million-users-more-traffic-trends-and-data-at-inside-facebook-gold-may-2011-edition/?utm_source=feedburner&utm_medium=feed&utm_campaign=Feed%3A+InsideFacebook+%28Inside+Facebook%29
2 http://www.insidefacebook.com/2011/03/31/facebook-passes-250-million-mobile-users-overhauls-mobile-website/?utm_source=feedburner&utm_medium=feed&utm_campaign=Feed%3A+InsideFacebook+%28Inside+Facebook%29
3 http://www.mediabistro.com/alltwitter/twitter-active-users_b6628
4 http://venturebeat.com/2011/03/14/twitter-1-billion-tweets/?source=facebook
5 http://www.ottawacitizen.com/mobile/iphone/story.html?id=4771747
6 The traffic graphs show the fraction of the worldwide traffic to a given Google product that comes from a given region. The data are then normalized and scaled so that the highest value in the graph is 100.
7 as gauged by Google’s Internet traffic report
8 Source (Accessed April 10, 2011): www.google.com/transparencyreport/traffic/?r=SY&l=YOUTUBE&csd=1295947800000&ced=1298367000000

3Civil Movements: The Impact of Facebook and Twitter
40
30
20
10
0
Figure 2: Libya: Internet Traffic Before and After March 3, 2011- Sample of all Google Products9
Feb 20 Feb 27 Mar 6 Mar 13
35
30
25
20
15
10
5
0Jan 24 Jan 25 Jan 26 Jan 27 Jan 28 Jan 29 Jan 30 Jan 31 Feb 1 Feb 2 Feb 3 Feb 4 Feb 5
Figure 3: Egypt: Internet Traffic Between January 28 and February 2, 2011- Sample of all Google Products10
9 Source (Accessed April 10, 2011) : http://www.google.com/transparencyreport/traffic/?r=LY&l=EVERYTHING&csd=1297962000000&ced=1300381200000
10 Source (Accessed April 10, 2011) http://www.google.com/transparencyreport/traffic/?r=EG&l=EVERYTHING&csd=1294957800000&ced=1297377000000

4 Arab Social Media Report Vol. 1, No. 2
Figure 4 shows some highlights of the first quarter of 2011 in both citizens’ and governments’ use of social media. The former includes an example of the innovation that emerges in times of crisis. The latter ranges from the Egyptian military council creating Facebook pages to engage with their constituents, to Syria unblocking access to previously restricted social networking sites. Moreover, it is not just governments and citizens that are wrestling with the new political uses of social media. The social media companies themselves are facing a dilemma when it comes to addressing this kind of usage, the implications it may have, and how to maintain the neutrality of these sites without infringing upon their users’ freedom of speech. As Figure 4 shows, Facebook had to contend with the backlash from the Israeli government surrounding the “Third Palestinian Intifada” page before eventually taking it down at the end of March. The page was recreated two days later, and as of mid-April has close to 170,000 “likes.”
(1)http://thenextweb.com/me/2011/01/10/facebook-twitter-blocked-in-algeria-amid-riots/
(2) http://gigaom.com/2011/01/28/how-egypt-switched-o�-the-internet/
(3) http://www.hu�ngtonpost.com/2011/02/02/egypt-facebook-use-internet_n_817710.html/
(4) http://globalvoicesonline.org/2011/02/08/syria-facebook-and-youtube-unblocked-among-others/
(5) http://www.gizmocrunch.com/web/5465-libya-internet-down-facebook-twitter-egypt
(6) http://bikyamasr.com/wordpress/?p=27802
(7) http://www.bbc.co.uk/news/technology-12829808
(8) http://www.bbc.co.uk/news/world-middle-east-12902273
(9) https://www.facebook.com/Intifada.15May
1/9/2011 1/26/2011 2/1/2011 2/6/2011 2/18/2011 2/18/2011 3/22/2011 3/28/2011 3/30/2011
Figure 4: Selected Highlights of Social Media and Internet Activity in the Arab Region in Q1-2011
Facebookand Twitter
partiallyblocked inAlgeria forone day
(1)
Internetblackoutin Egypt
for5 days
(2)
EgyptFacebook
usageskyrockets
afterinternet’s
return(3)
Syria liftsban onsocialmedia
websites(4)
Libyashutsdown
Internet(5)
EgyptianSupremeMilitaryCouncilengages
with citizenson Facebook
(6)
Sudanpro-government
supportersuse
social mediato stopprotests
(7)
Facebooktakes downpalestinian
intifada page(with 350ksupporters)
(8)
NewFacebookIntifada
pageis created
withover 167ksupporters
within 2 weeks(9)
As detailed further on within this report, the number of Facebook users has risen significantly in most Arab countries, most notably so in the countries where protests have taken place. The role of social media in the revolutions that have swept the region has been debated, with some camps labeling them the main instigators and other relegating them to mere tools. Regardless, it can be stated that many of the calls to protest in the Arab region were initially made on Facebook (save for the first protest in Tunisia). Figure 5 illustrates the countries where a Facebook page’s call to protest on a given date was made, and whether or not these protests were manifested in the streets. In all cases but one (the initial failed call to protest in Syria on February 4), this has proven true.
The number of Facebook users has risen significantly in most Arab countries, most notably so in the countries where protests have taken place.

5Civil Movements: The Impact of Facebook and Twitter
* Facebook penetration rates at at the start of protests in each country
** Initial protest was not organized on Facebook, although further protests were
(1) http://www.thedailybeast.com/blogs-and-stories/2011-01-15/tunisa-protests-the-facebook-revolution/
(2)http://www.newsweek.com/2011/01/22/the-revolution-comes-to-egypt.html
(3)http://articles.cnn.com/2011-02-10/world/yemen.student.protest_1_student-protest-demonstration-facebook?_s=PM:WORLD
(4) http://www.google.com/hostednews/afp/article/ALeqM5gmg4rvAfz5HpVrBLnRRPpOxQUwvQ?docId=CNG.48f3fb2a5d4e5791795d8c3f3b8c5311.8e1
(5) http://www.google.com/hostednews/afp/article/ALeqM5i2YM2LCYTyiuV6jLNIhaLdIPiOAA?docId=CNG.174090b19aab9f0dd092524489bf4699.331
(6) http://globalvoicesonline.org/2011/02/16/libya-protests-begin-in-benghazi-ahead-of-february-17-day-of-wrath/
(7) http://www.nytimes.com/2011/03/01/world/middleeast/01oman.html
(8) http://www.reuters.com/article/2011/02/23/us-saudi-facebook-idUSLDE71M08Q20110223
(9) http://www.bbc.co.uk/news/world-middle-east-12749674
%18.8*
Yes**
TunisiaJan 14 (1)
EgyptJan 25 (2)
YemenFeb 3 & 10
(3)
SyriaFeb 4 (4)
BahrainFeb 14 (5)
LibyaFeb 17 (6)
OmanMar 3 (7)
Saudi ArabiaMar 11& 20 (8)
Syria,March15 and
onwards(9)
PalestineMay 15 (10)
%5.5
Yes
%0.93
Yes
%1.19
No
%32.0
Yes
%4.3
Yes
%7.8
Yes
%12.9
Yes
%1.67
Yes
%12.8
Yes
Figure 5: Mapping Calls for Protest on Facebook with Actual Demonstration
Figure 6: Growth Rate of Facebook Users During the 2011 Protests, as Compared to a Similar Time Period in 2010
BahrainFeb 14 - Apr 5
15%
29%
12% 10%
21%
6%
18%
2011 2010
4%
17%
47%
20%
10%
-76%
6%
EgyptJan 25 - Apr 5
LibyaFeb 17 - Apr 5
OmanMar 2 - Apr 5
Saudi ArabiaMar 11 - Apr 5
TunisiaJan 14 - Apr 5
YemenFeb 3 - Apr 5
60%
40%
20%
0%
-20%
-40%
-60%
-80%
-100%
This is not to say that there was a causal relationship, or that the Facebook pages were the defining or only factor in people organizing themselves on these dates, but as the initial platform for these calls, it cannot be denied that they were a factor in mobilizing movements. However, given the small Facebook penetration in most of these countries (notably Syria and Yemen), it can be argued that for many protestors these tools were not central. It can also be argued that Facebook was an instrumental tool for a core number of activists who then mobilized wider networks through other platforms or through traditional real-life networks of strong ties. Egypt, for example, has a relatively low penetration rate of 5.5%, but given its large population, that translates into around 6 million Facebook users, who in turn are connected to a much larger number of social contacts who can be influenced by information from those with Facebook accounts.

6 Arab Social Media Report Vol. 1, No. 2
Conversely, the protests themselves seem to have led to a rise in number of Facebook users in the region. The countries where protests occurred have all shown a positive growth rate, except for Libya, which could be explained by the number of expatriate workers leaving or switching Facebook locations.11 Moreover, as Figure 6 illustrates, by comparing the growth rate for each country during and following the protests to a similar period just preceding the protests, we notice that the growth rates have doubled and even tripled in some countries.
The numbers themselves do not illustrate the type of usage, of course. Some usage may be political, with other usage purely social and not entirely related to the civil movements at the time. But the exponential growth in the number of Facebook users coinciding with the protests in each country does indicate the need for further research to explore the possible correlation.
2. Spotlight on Tunisia and Egypt: Facebook Usage during the Civil MovementsAs a first step in taking a closer look at the usage of Facebook during the protests and civil movements, the Governance and Innovation program at the Dubai School of Government conducted a survey that was distributed through Facebook’s targeted advertising platform to all Facebook users in Tunisia and Egypt. The survey ran for three weeks in March 2011, and was conducted in Arabic, English and French. There were 126 respondents from Egypt and 105 from Tunisia.
In both countries, Facebook users were of the opinion that Facebook had been used primarily to raise awareness within their countries about the ongoing civil movements (31% in both Tunisia and Egypt), spread information to the world about the movements (33% and 24% in Tunisia and Egypt respectively), and organize activists and actions (22% and 30% in Tunisia and Egypt respectively). Less than 15% in either country believed Facebook was primarily being used for entertainment or social reasons
Figure 7: The Main Usage of Facebook during the Civil Movement and Events in Early 2011 was to:
Other
Entertainment and social uses: Connect with friends, games etc.
Raise awareness inside the country on the causes of the movements
Spread information to the world about the movement and related events
Organize actions and manage activists (teams or individuals)
Egypt Tunisia
100%
90%
80%
70%
60%
50%
40%
30%
20%
10%
0%
3.09%
12.37%
30.93%
24.05%
29.55%
2.48%10.74%
31.40%
33.06%
22.31%
The majority (at almost 60%) of Facebook users in each country felt that the main impact of blocking the Internet was a positive one for the social movements, spurring people to be more active, decisive and to find ways to be more creative about communicating and organizing (see Figure 8).
11 http://english.aljazeera.net/news/middleeast/2011/02/201122703618479675.html

7Civil Movements: The Impact of Facebook and Twitter
100%
90%
80%
70%
60%
50%
40%
30%
20%
10%
0%
Figure 9: The Primary Language you used to communicate on Facebook during the Civil Movement was:
French
English
Arabic
Egypt Tunisia
24.60%
75.40%
47.62%
0.95%
51.43%
No impact: Shutting off the Internet or blocking Facebook did not have any impact on the civil movement
Negative (disrupted the main communication channel people were using to organize and communicate with each other)
Positive (making people more determined, pushing undecided people to be more active, mobilizing poeple to find creative ways to organize and communicate)
Egypt Tunisia
100%
90%
80%
70%
60%
50%
40%
30%
20%
10%
0%
15.87%
27.78%
56.35%
12.38%
28.57%
59.05%
Figure 8: The Primary Impact on the Civil Movements of the Authorities’ Blocking the Internet and Facebook was:
In Tunisia, the primary language of use was split almost evenly between Arabic and French, while in Egypt 75% mainly used Arabic and the remaining 25% used English while communicating on Facebook. (Figure 9).
When it came to politicians’ use of social media, Tunisia and Egypt diverge slightly. As Figure 10 illustrates, a significant majority of Facebook users in Egypt (71%) would rather vote for a candidate that engages with citizens through social media tools, whereas only 47% of Facebook users in Tunisia would.

8 Arab Social Media Report Vol. 1, No. 2
Figure 10: How will the use of social networking tools by politicians in upcoming electoral and political campaigns influence your choice of candidate?
No Impact: A candidate’s use of social media will not affect my vote.
Negatively: I am less likely to vote for a candidate who uses social media (such as Facebook, Twitter, etc.).
Positively: I am more likely to vote for a canidate who uses social media (such as Facebook, Twitter, etc.) to connect with citizens.
Egypt Tunisia
100%
90%
80%
70%
60%
50%
40%
30%
20%
10%
0%
22.22%
6.35%
71.43%
36.19%
16.19%
47.62%
Figure 11: Where did you get your news/information on the events during the civil movements?
Social media sources (social
networking sites: Facebook, twitter,
blogs, etc...)
Egypt
Tunisia
100%
90%
80%
70%
60%
50%
40%
30%
20%
10%
0%
88.10%
94.29%
62.70%
85.71%
59.09%64.29%
56.85%
47.62%
35.71%40.00%
Local, independent or private media
(television, newspaper,
radio, online sources in your
country)
Other sources Regional or international
media (satellite television,
newspapers, radio
newsportals)
Sate-sponsored media
(television, newspapers,
radio sponsored by your
government)

9Civil Movements: The Impact of Facebook and Twitter
Table 1: Facebook Users and Official Population Figures for the GCC Countries
Country
Oman
Saudi Arabia
Kuwait
Bahrain
Qatar
UAE
Population
3,103,580
27,136,979
3,484,881
1,234,596
1,699,435
8,260,000
Facebook Users
277,840
4,092,600
795,100
302,940
481,280
2,406,120
Facebook penetration (%)
8.95
15.08
22.82
24.54
28.32
29.13
Not surprisingly, given that the survey is conducted among Facebook users, social media figured highly in both countries as a source of information during the civil movements (94% of people in Tunisia said they got their news from these tools, while 88% of people in Egypt did). Both countries also relied the least on state-sponsored media for their information (at 40% and 36% of people in Tunisia and Egypt respectively). More Egyptians relied on local media than they did on regional or international media, while the reverse was true in Tunisia.
3. Mapping Facebook in the Arab World – Update Q1 - 2011This edition of the Arab Social Media Report focuses both on Facebook and Twitter usage in the Arab region. This section, specifically, provides an update on Facebook usage during the first quarter of 2011, continuing from the last report, which provided an overview of Facebook users through 2010. As such, the number of Facebook users in all 22 Arab countries, in addition to Iran, Israel and Turkey, was collected periodically between January and April 2011, in the following age brackets — youth (15-29), and adults (30 and over) — as well as by gender. Below are the key findings:
Penetration and uptakeFacebook in the Arab World: A Snapshot
• The total number of Facebook users in the Arab world stands at 27,711,503 (as of April 5, 2011), up from 21,377,282 (January 5, 2011), having almost doubled since the same time last year (14,791,972 in April 2010).
• At the beginning of April 2011, the country average for Facebook user penetration in the Arab region was just over 7.5%, up from just under 6% at the end of 2010.
• The number of Facebook users in the Arab world increased by 30% in the first quarter of 2011.
• GCC countries still dominate the top five Arab Facebook users as percentage of population, with Lebanon being the only exception. The UAE remains at the top of the Arab region.
• Egypt still constitutes about a quarter of total Facebook users in the Arab region, and has added more users in the Q1-2011 than any Arab country, at close to 2 million new Facebook users between January 5 and April 5.
The populations for the Arab world used in this report were compiled from the United Nations ILO Department of Statistics.12 All of the figures in international reports conflict with more recent official GCC population numbers. Replacing some of the population figures with more recent figures from National Statistics Offices13 (specifically for the GCC countries) drastically changes the Facebook penetration rates within the GCC (see Table 1 and Figure 12). These official population figures are acknowledged as the more accurate data, but ILO numbers were used to ensure consistency across the Arab region.
12 http://laborsta.ilo.org/
13 Arab ICT Use Report 2010, Madar Research, Dubai, UAE

10 Arab Social Media Report Vol. 1, No. 2
Figure 12: Facebook Penetration Rates of GCC countries, April 5, 2011 (using official population figures)
35.00
30.00
25.00
20.00
15.00
10.00
5.00
0.00Oman Saudi Arabia Kuwait Bahrain Qatar UAE
8.95
15.08
22.8224.54
28.32 29.13
Moreover, when comparing the uptake of Facebook in Arab countries with that in some of the “Top 10“ countries (in terms of Facebook penetration worldwide), several Arab countries still outpace the Top 10 in terms of new users acquired throughout the first quarter of 2011, as percentage of population. At the beginning of April 2011, eight Arab countries had acquired more Facebook users (as a percentage of population) than the US, one of the highest ranking countries in the world in terms of Facebook penetration. In comparison, Turkey has also acquired a large number of new Facebook users (both as a percentage of population, and in terms of actual numbers), and has outpaced a lot of the Arab countries (Figure 13). With over 3.6 million new Facebook users signing up between January and April 2011, Turkey has acquired almost double the number of Facebook users that Egypt has over the same period (1.95 million) (Figure 14).
Figure 13: New Facebook Users In the Arab Region and Globally (Jan. 5 -Apr. 5, 2011), as Percentage of Population*
7.00
6.00
5.00
4.00
3.00
2.00
1.00
0.00
UAEEg
ypt
Canad
a
Jord
anChi
leIra
n
Tuni
sia
Mor
occo
Syria
Bahra
in
Algeria
Israe
l
Kuwait US
Iraq
Saud
i Ara
bia
UK
Turk
ey
Om
an
Suda
n
Pales
tine
Norway
Leba
non
6.06
5.315.11
4.76 4.75
3.16 3.102.75
2.27 2.23 2.21 2.19 2.01 1.93 1.901.74
1.56 1.48 1.391.01
0.84
0.14 0.03
*2011 populations, from United Nations ILO Department of Statistics, http://laborsta.ilo.org/
See Figure 12 for rankings using official GCC population data

11Civil Movements: The Impact of Facebook and Twitter
* 2011 population, from United Nations ILO Department of Statistics, http://laborsta.ilo.org/ See Figure 12 for rankings using official GCC population data.
Figure 15: Facebook User Penetration* in the Arab Region, plus Iran, Israel and Turkey (Apr. 2011)
60.00
50.00
40.00
30.00
20.00
10.00
0.00Ira
nLib
ya
Leba
non
Yem
en
Om
an
Bahr
ain UAE
Suda
n
Djibou
ti
Qata
rSy
ria
Jord
an
Pales
tine
Som
alia
Algeria
Kuwait
Mau
ritan
ia
Mor
occo
Comor
osEg
ypt
Turk
eyIsr
ael
Iraq
Tuni
sia
Saud
i Ara
bia
0.22 0.22 1.01 1.28 1.37 1.78 1.94 2.24 3.745.42 5.89
7.66 9.37 9.7813.10
15.28
21.25 22.4925.5125.50
30.63
35.89 36.83
44.18
50.01
TurkeyEgyptKSA
MoroccoAlgeriaTunisia
IraqJordan
UAESyria
KuwaitYemen
IsraelPalestineLebanon
SudanOman
IranBahrain
MauritaniaSomaliaDjibouti
ComorosQatarLibya
-500,000 0 500,000 1,000,000 1,500,000 2,000,000 2,500,000 3,000,000 3,500,000 4,000,000
3,645,649
1,951,690
845,620
590,360
-30,780
-182,300
560,820
535,640
291,480
65,010
192,732
39,047
165,420
25,480
161,380
22,300
140,340
14,820
124,720
6,660
326,600
113,940
2,800
313,640
101,780
Figure 14: Number of New Facebook Users in the Arab Region, plus Iran, Israel and Turkey (Jan. 5- Apr. 5, 2011)
On a regional level14 , the Arab countries can be divided into three groups according to their rates of Facebook penetration (Figure 15).
14 Israel, Iran and Turkey are also included for comparative purposes in this report, as Middle Eastern countries that share certain socioeconomic and geopolitical characteristics with many Arab countries.

12 Arab Social Media Report Vol. 1, No. 2
1. Topperformers:These countries’ Facebook user penetration rates are on par with the Top 20 countries in the world, indicating a pervasive use of Facebook in their societies. (Facebook penetration above 30%)
2. Emerging countries: These countries’ Facebook user penetration ranges from 10%-25%, indicating a medium penetration of Facebook users.
3. Developingusers:These countries have low rates of Facebook user penetration, ranging from less than 1% to just under 10%, indicating room for growth.
These rankings have changed minimally since the end of 2010, with only Lebanon slipping from fourth to fifth place, Yemen moving up two places and Iran slipping to last place.
Figure 16 highlights the numbers of Facebook users and their penetration as percentage of total Facebook users in the Arab world.
Remaining Arab Countries
Algeria
Tunisia
UAE
Morocco
KSA
Egypt
6,586,26024% 7,074,147
25%
1,947,9007%
2,356,5208%
2,406,1209%
3,203,44012%
4,092,60015%
Figure 16: Number of Facebook Users and Percentage of Users in the Arab Region (Apr. 2011)
Demographic and gender breakdown of Facebook penetration
The demographic breakdown of Facebook users indicates that they are a youthful group. Youth (between the ages of 15 and 29) make up around 70% of Facebook users in the Arab region, indicating a slight increase in the number of users over 30 years old since the end of 2010. Moreover, the UAE is still the most balanced in terms of adult and youthful Facebook users, while countries such as Somalia, Palestine and Morocco persist in having a predominantly youthful Facebook user population (see Figure 17).
Youth (between the ages of 15 and 29) make up around 70% of Facebook users in the Arab region, indicating a slight increase in the number of users over 30
years old since the end of 2010.
The gender breakdown of Facebook users shows a slight increase in the percentage of female users, rising from 32% at the end of 2010 to 33.5% in the first quarter of 2011. This is still significantly lower than the global trend,
where women constitute 61% of Facebook users

13Civil Movements: The Impact of Facebook and Twitter
Figure 18: Gender Breakdown of Facebook Users in the Arab countries* (April 2011)
Yem
enSo
mal
ia
Iraq
Mau
ritan
ia
Om
anSa
udi A
rabi
a
Qat
arAl
geria
Liby
aD
jibou
ti
UAE
Kuw
ait
Com
oros
Egyp
tPa
lesti
neM
oroc
co
Jord
an
Tuni
siaBa
hrai
nLe
bano
n100%
90%
80%
70%
60%
50%
40%
30%
20%
10%
0%
21 2230 31 34
36 41
2531 32 35
38 42 45
2731 33 36
38 42
79 7870 69 66
6459
7569 68
65 62 58 55
7369 67
64 62 58
Female users as percentage of total country users
Male users as percentage of total country users
*Excluding Syria and Sudan (due to US technology sanctions, no data on gender breakdown of Facebook users is available)
Figure 17: Demographic Breakdown of Facebook Users in the Arab Region* (April 2011)
Pale
stine
Mor
occo
Djib
outi
Yem
enSo
mal
ia
Jord
anAl
geria
Tuni
sia
Egyp
tM
aurit
ania
Com
oros
Liby
a
Iraq
Leba
non
Saud
i Ara
bia
Om
anBa
hrai
n
Kuw
ait
Qat
ar
UAE
100%
90%
80%
70%
60%
50%
40%
30%
20%
10%
0%
19 21 22 2531 33
38
21 23 2532 34
43 45
21 2428 33 36
44
81 79 78 7569 67
62
79 77 7568 66
57 55
79 76 72 6764
56
Over 30 FB users (% of total country users)
15-29 FB users (% of total country users)
*Excluding Syria and Sudan (due to US technology sanctions, no data on demographic breakdown of Facebook users is available)
The gender breakdown of Facebook users shows a slight increase in the percentage of female users, rising from 32% at the end of 2010 to 33.5% in the first quarter of 2011. This is still significantly lower than the global trend, where women constitute 61% of Facebook users15 (see Figure 18).
In terms of Facebook usage, Lebanon is still the most gender-balanced of the Arab countries, followed closely by Bahrain, Tunisia and Jordan, while at the other end of the spectrum Facebook users in Somalia and Yemen are overwhelmingly male.
15 http://socialmediatoday.com/paulkiser/285851/who-uses-facebook-twitter-linkedin-myspace-4thq-1stq-stats-and-analysis

14 Arab Social Media Report Vol. 1, No. 2
Language breakdown of Facebook users
Facebook users across the Arab region also vary in their preference of language interface. Table 2 and Figure 19 highlight the three main languages used on Facebook in the region (Arabic, English and French) and the percentage of Facebook users that prefer to use each language interface.
Table 2: Language Interface Preferred by Facebook Users* (as a percentage) - Ranked by Arabic
Country
Yemen
Palestine
Saudi Arabia
Iraq
Egypt
Jordan
Oman
Libya
Bahrain
Kuwait
Mauritania
Morocco
Qatar
Algeria
UAE
Lebanon
Djibouti
Tunisia
Somalia
Comoros
Arabic (% of FB users)
75.00
66.90
59.62
53.09
49.88
44.32
36.38
32.51
30.80
27.81
23.32
16.65
16.07
14.05
9.91
5.11
2.25
1.56
1.22
0.20
English (% of FB users)
21.61
31.97
38.04
41.75
48.98
54.77
62.00
47.84
67.54
69.72
4.03
4.19
79.42
3.25
85.36
90.63
58.68
2.72
84.02
5.54
French (% of FB users)
0.24
0.45
0.35
0.57
0.39
0.20
0.39
4.72
0.29
0.92
71.11
76.55
1.09
82.11
1.24
2.85
36.76
94.60
1.32
92.87
*Excluding Syria and Sudan (due to US technology sanctions, no data on demographic breakdown of Facebook users is available)
Language preferences across the region diverged considerably. Countries that predominantly use Facebook’s English interface are Lebanon (91%), UAE (85%), Somalia (84%), Qatar (79%), Kuwait (70%), Bahrain (68%) and Oman (62%), while Yemen (75%), Palestine (67%), and Saudi Arabia (60%) mainly use the Arabic interface. Tunisia (95%), Comoros (93%), Algeria (82%), Morocco (77%), and Mauritania (71%), all predominantly use the French interface. Egypt, Jordan, Libya and Iraq are more evenly split between the use of Arabic and English interfaces.
The GCC countries (with the exception of Saudi Arabia) primarily prefer to use English on Facebook, most likely because of their large English-speaking expatriate population. North African countries (with the exception of Egypt)
prefer to use French.

15Civil Movements: The Impact of Facebook and Twitter
Figure 19: Language Interface Preference for Facebook Users in the Arab World
Arabic(% of FB users)
English(% of FB users)
French(% of FB users)Al
geria
Bahr
ain
Com
oros
Djib
outi
Egyp
t
Iraq
Jord
anKu
wai
tLe
bano
n
Liby
aM
aurit
ania
Mor
occo
Om
anPa
lesti
ne
Qat
arSa
udi A
rabi
aSo
mal
iaTu
nisia
UAE
Yem
en
120.00
100.00
80.00
60.00
40.00
20.00
0.00
only 30-40 million of the 200 Twitter users are actually “active,” meaning that most information on Twitter is generated by a minority, while the majority use
Twitter to consume news as more of a newsfeed than a microblog.
Overall, the GCC countries (with the exception of Saudi Arabia) primarily prefer to use English on Facebook, most likely because of their large English-speaking expatriate population. North African countries (with the exception of Egypt) prefer to use French.
4: Mapping Twitter in the Arab World – Users, Tweets and TrendsTwitter has grown in the five years since its inception to become a powerful microblogging tool used for purposes ranging from marketing to celebrity endorsement, to news aggregation and dissemination, and even disaster relief, among others. As mentioned in the introduction, the number of Twitter users has grown to over 200 million by April 2011, tweeting 1 billion tweets per week. Some studies have pointed out that 20,000 “elite” users generate about 50% of all “tweets”16 (a claim later refuted by a Twitter executive), and only 30-40 million of the 200 Twitter users are actually “active,”17 meaning that most information on Twitter is generated by a minority, while the majority use Twitter to consume news as more of a newsfeed than a microblog.
Moreover, according to official Twitter statistics, at the end of the first quarter of 2011, the number of tweets had risen to 155 million a day, up from 55 million a day around the same time last year, with a 41% increase daily in the number of tweets. The first quarter of 2011 has also shown a 50% increase in monthly unique mobile signups and a 52% increase in Twitter account signups.
Twitter penetration and uptake in the Arab region
The total number of active Twitter users, tweets and top trends in each of the 22 Arab countries (plus Iran, Israel and Turkey) over the period January 1 – March 30, 2011 was estimated using a Twitter API (application programming interface) specially developed for this research. The methodology used is detailed in Annex 1. Briefly, it consists of sampling a certain number of Twitter users in each country captured across a two week span, and using this sample to estimate the active Twitter population18 (active in this case being defined as someone who has tweeted at least once within these two weeks – dormant users were not included), the volume of tweets they generated and the top trends for the retroactive three-month period mentioned.
16 http://research.yahoo.com/pub/3386. Twitter executive Sean Garret has refuted this claim on his Twitter page.
17 http://colombia.twirus.com/details/blog/722/
18 These estimates include accounts of all levels of activity, from prolific tweeters to accounts which are rarely used. Only dormant users (i.e., users who have never tweeted at all) are excluded from this estimate.

16 Arab Social Media Report Vol. 1, No. 2
• The estimated number of active Twitter users in the Arab region at the end of March 2011 was 1,150,292. Multiplying by the ratio of total users to active users above (an average of 200 million/35 million = 5.7), we get a total Twitter population of 6,567,280.
• The estimated number of tweets generated in the Arab region in the first quarter of 2011 (Jan. 1 – March 30) by these “active users” was 22,750,000 tweets. The estimated number of daily tweets is 252,000 tweets per day, or 175 tweets a minute, or roughly three tweets a second.
• The estimated number of daily tweets per active user in the Arab region in the first quarter of 2011 is 0.81 daily tweets.
• The most popular trending hashtags across the Arab region in the first quarter were #egypt (with 1.4 million mentions in the tweets generated during this period) #jan25 (with 1.2. million mentions), #libya (with 990,000 mentions), #bahrain (640,000 mentions), and protest (620,000)
As with Facebook, Turkey dominates in the number of Twitter users, with 217,627 users, followed by the UAE, which leads the Arab countries with 201,060 Twitter users (See Figure 20). The top five Arab countries in terms of number of Twitter users are UAE, Qatar, Egypt, Saudi Arabia and Kuwait.
ComorosMauritania
DjiboutiSomalia
OmanSudan
PalestineAlgeria
MoroccoIraq
YemenIran
TunisiaSyria
JordanBahrain
LibyaLebanon
IsraelKuwait
Saudi ArabiaEgyptQatarUAE
Turkey
0 500,000 1,000,000 1,500,000 2,000,000 2,500,000
217,627
133,209
201,060
131,204
113,428
79,163
55,859
34,292
21,625
13,235
9,459
4,244
1,407
115,084
104,849
61,896
63,919
40,020
35,746
29,422
17,384
11,369
6,679
4,046
834
Figure 20: Number of Active Twitter Users in the Arab Region plus Iran, Israel and Turkey (Average number between Jan. 1 and March 30, 2011)
17Civil Movements: The Impact of Facebook and Twitter
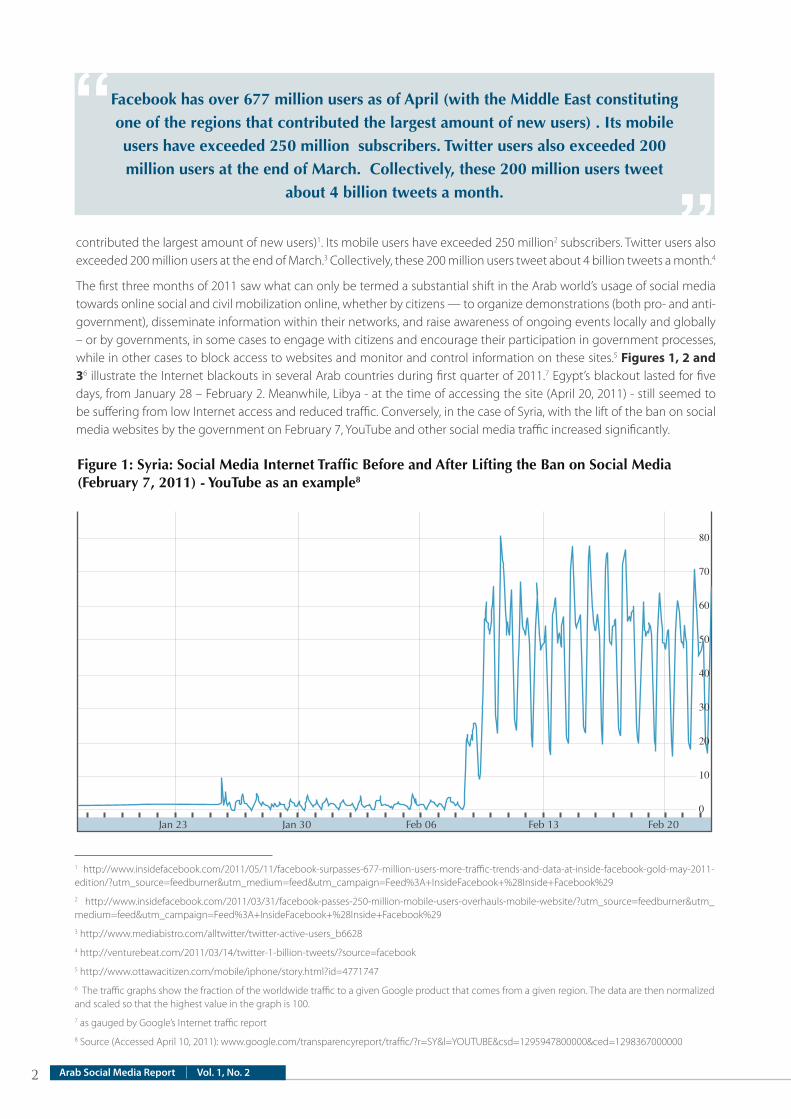
When it comes to Twitter penetration as a percentage of population on a regional level, Qatar and Bahrain lead the way with a 8.46% and 7.53% Twitter penetration respectively. The “top 5” countries in terms of Twitter penetration are the same as “top 5” countries in terms of Facebook penetration (with a shift in ranking, however): Qatar, Bahrain, UAE, Kuwait and Lebanon (Figure 21). Arab countries can be divided into:
1. Top performers: These countries’ Twitter user penetration is above 5%, indicating a high use of Twitter in their societies relative to other Arab countries.
2. Emergingcountries: These countries’ Twitter user penetration ranges from 3%-5%, indicating a medium penetration of Twitter users relative to other Arab countries.
3. Developingusers:These countries have Twitter user penetration rates are under 2%. Most countries in this category actually have a penetration rate of just under 1%, with the exception of Lebanon, indicating room for growth.
Figure 21: Twitter Penetration in the Arab Region plus Iran, Israel and Turkey (Average between Jan. 1 and March 30, 2011)
Qat
arBa
hrai
n
UA
EKu
wai
tLe
bano
n
Isra
el
Liby
aJo
rdan
Djib
outi
Saud
i Ara
bia
Tuni
sia
Turk
eyPa
lest
ine
Om
an
Syria
Egyp
tC
omor
osYe
men Iraq
Mor
occo Iran
Som
alia
Mau
ritan
iaA
lger
iaSu
dan
9.00
8.00
7.00
6.00
5.00
4.00
3.00
2.00
1.00
0.00
8.46
7.53
4.18
3.63
1.851.42
0.96 0.850.45 0.43 0.34 0.28 0.25 0.23 0.17 0.15 0.12 0.12 0.07 0.05 0.05 0.04 0.04 0.04 0.02
* 2011 populations, from United Nations ILO Department of Statistics, http://laborsta.ilo.org/
See Figure 22 for rankings using official GCC population data.
As with Facebook penetration, the populations used in calculating Twitter penetration are based on ILO statistics. The penetration rates using the official population numbers for the GCC can be seen in Table 3 and Figure 22.
Table 3: Twitter Users and Officials Population Figures for the GCC Countries
March 30, 2011
Oman
Saudi Arabia
UAE
Kuwait
Bahrain
Qatar
Population
3,103,580
27,136,979
8,260,000
3,484,881
1,234,596
1,699,435
Twitter users
6,680
115,000
201,000
113,000
61,900
133,000
Twitter penetration (%)
0.22
0.42
2.43
3.24
5.01
7.83

18 Arab Social Media Report Vol. 1, No. 2
Figure 22: Twitter Penetration of GCC Countries (March 30, 2011), using Official Population Figures
9.00
8.00
7.00
6.00
5.00
4.00
3.00
2.00
1.00
0.00
Oman Saudi Arabia UAE Kuwait Bahrain Qatar
0.22 0.42
2.43
3.24
5.01
7.83
Over 60% of tweets within the first quarter of 2011 were generated by Kuwait, Qatar, UAE, Saudi Arabia and Egypt.
ComorosMauritania
DjiboutiSomalia
OmanSudan
AlgeriaMorocco
IraqTunisiaJordan
PalestineYemen
SyriaLebanonBahrain
IsraelLibyaEgypt
Saudi ArabiaUAE
QatarKuwairTurkey
0 500,000 1,000,000 3,000,0001,500,000 3,500,0002,000,000 4,000,0002,500,000 4,500,000 5,000,000
4,680,000
3,060,000
3,690,000
2,790,000
2,160,000
1,350,000
783,000
639,000
342,000
252,000
81,900
61,200
10,800
2,250,000
1,890,000
990,000
1,350,000
729,000
639,000
576,000
252,000
89,100
79,200
10,800
Figure 23: Number of Tweets in the Arab Region* plus Israel and Turkey (Jan. 1 - March 30, 2011)
* Iran was excluded due to lack of credible data on number of tweets

19Civil Movements: The Impact of Facebook and Twitter
Volume of tweets in the Arab region
The volume of tweets from each country was estimated between January 1 and March 30 (see Figure 23), and calculated as a percentage of total tweets in the Arab region over this time period (Figure 24).
The top five generators of tweets in the Arab region are Kuwait, Qatar, UAE, Saudi Arabia and Egypt, who also have the top five largest active Twitter populations in the region. Consequently, to a certain extent, the size of a country’s active Twitter population correlates with the volume of tweets it generates. Figure 23 shows that over 60% of tweets within the first quarter of 2011 were generated by these five countries.
Figure 24: Percentage of Tweets in the Arab Region (Jan. 1 - March 30, 2011)
Kuwait
Qatar
United Arab Emirates
Saudi Arabia
Egypt
Remaining
38.61 %
16.24 %
13.47 %
12.28 %
9.90 %9.50 %
25000
20000
15000
10000
5000
0
Jan
1
Jan
3
Jan
5
Jan
7
Jan
9
Jan
11
Jan
13
Jan
15
Jan
17
Jan
19
Jan
21
Jan
23
Jan
25
Jan
27
Jan
29
Jan
31
Feb
2
Feb
4
Feb
6
Feb
8
Feb
10
Feb
12
Feb
14
Feb
16
Feb
18
Feb
20
Feb
22
Feb
24
Feb
26
Feb
28
Figure 25: Volume of Daily Tweets in Bahrain
Feb 14 protests in Bahrain
In looking at the fluctuations in the volume of daily tweets in certain countries, we can see that some of the fluctuations or “spikes” seem to coincide with current events at the time. This does not conclusively indicate that the events directly contributed to the fluctuations in tweet volume, but their concurrence provides a high degree of circumstantial evidence for linking current events to a higher tweet volume. Figures 25, 26, 27 and 28 highlight a timeline of daily tweets19 over the first quarter of 2011 in Bahrain, Egypt, Saudi Arabia and Tunisia.
19 Daily tweet volumes are approximations based on smaller samples than the rest of the study and as such tend to be “noisy.” Refer to Annex 1 for methodology.

20 Arab Social Media Report Vol. 1, No. 2
35000
30000
25000
20000
15000
10000
5000
0
Jan
1
Jan
3
Jan
5
Jan
7
Jan
9
Jan
11
Jan
13
Jan
15
Jan
17
Jan
19
Jan
21
Jan
23
Jan
25
Jan
27
Jan
29
Jan
31
Feb
2
Feb
4
Feb
6
Feb
8
Feb
10
Feb
12
Feb
14
Feb
16
Feb
18
Feb
20
Feb
22
Feb
24
Feb
26
Feb
28
Figure 26: Volume of Daily Tweets in Egypt
Internet blackout in
Egypt (Jan 28- Feb 2)
President Mubarak leaves office Feb 11
Jan 14 protests in Tunisia
90,000
80,000
70,000
60,000
50,000
40,000
30,000
20,000
10,000
0
Mar
1
Mar
2
Mar
3
Mar
4
Mar
5
Mar
6
Mar
7
Mar
8
Mar
9
Mar
10
Mar
11
Mar
12
Mar
13
Mar
14
Mar
15
Mar
16
Mar
17
Mar
18
Mar
19
Mar
20
Mar
21
Mar
22
Mar
23
Mar
24
Mar
25
Mar
26
Mar
27
Mar
28
Mar
29
Mar
30
Figure 27: Volume of Daily Tweets in Saudi Arabia
Lead-up to Mar 20 protests in Saudi Arabia
Mar 11 protests in Saudi Arabia

21Civil Movements: The Impact of Facebook and Twitter
Figure 28: Volume of Daily Tweets in Tunisia
12,000
10,000
8,000
6,000
4,000
2,000
0
Jan
1
Jan
4
Jan
7
Jan
10
Jan
13
Jan
16
Jan
19
Jan
22
Jan
25
Jan
28
Jan
31
Feb
3
Feb
6
Feb
9
Feb
12
Feb
15
Feb
18
Feb
21
Feb
24
Feb
27
Mar
2
Mar
5
Mar
8
Mar
11
Mar
14
Jan 14 protests in Tunisia
Tunisian interim president appoints new prime
minister - Feb 27
Figure 29: Top Twitter Trends in the Arab Region Q1-2011 (number of mentions)
1,400,000
1,200,000
1,000,000
800,000
600,000
400,000
200,000
0
#egypt #jan25 #libya #bahrain protest
1,400,000
1,200,000
990,000
640,000 620,000
Top Twitter trends in the Arab region
The top trends for each country are estimated over the first three months of 2011. Across the region, the top five trends are illustrated in Figure 29 below.
As with the daily volume of tweets, spikes and fluctuations within the daily volume of mentions of popular trending words and hashtags coincided with current events at the time, for certain countries. Figures 30 and 31 show a timeline of the mentions of top trending terms in tweets generated in Egypt and Tunisia (#jan25 and #sidibouzid, respectively), overlaid onto their daily tweet volume graphs. This gives a clearer idea of what the Twitter conversation in these two countries was about, and that, to a large extent, social and political events ongoing at the time did indeed drive the conversation.

22 Arab Social Media Report Vol. 1, No. 2
35000
30000
25000
20000
15000
10000
5000
0
Jan
25
Jan
27
Jan
29
Jan
31
Feb
2
Feb
4
Feb
6
Feb
8
Feb
10
Feb
12
Feb
14
Feb
16
Feb
18
Feb
20
Feb
22
Feb
24
Feb
26
Feb
28
Figure 30: Daily Tweet Volume and Mentions of #jan25 in Egypt
#jan25 mentions daily Tweet volume
Internetblackout
President Mubarak leaves office Feb 11
#sidibouzid mentions daily Tweet volume
12,000
10,000
8,000
6,000
4,000
2,000
0
Jan
1
Jan
8
Jan
15
Jan
22
Jan
29
Feb
5
Feb
12
Feb
19
Feb
26
Mar
5Jan 14
protests
Tunisian interim president appoints new prime minister- Feb 27
Figure 31: Daily Tweet Volume and Mentions of #sidibouzid in Tunisia

23Civil Movements: The Impact of Facebook and Twitter
AnalysisRegional Overview
• Compared to 2010, in the first three months of 2011, Facebook grew in the Arab region at an even faster rate, growing 30% in the first three months as compared to 18% over the same period in 2010. Countries where major civil movements have occurred have shown exponential growth during and after those civil movements, with the exception of Libya, which has shown a dramatic decrease in number of Facebook users possibly due to the mass exodus of expats during the past few months. Country rankings have changed minimally, indicating distributed growth throughout the region.
• Female participation in Facebook usage remains glaringly low. Even though the percentage of female users has risen slightly in the region (to 33.5%), the percentage of female users globally still remains significantly higher (at 61%), and is growing at a faster rate.
• Youth continue to drive the growth of Facebook in the region, making up 70% of Facebook users, although the number of users who are over 30 years of age has risen slightly, possibly due to more adults signing on to Facebook in the wake of the civil movements across the region.
• English is the language of choice for most users in seven Arab countries, while French is the language of choice in five Arab countries, with Arabic the language of choice for most users in three Arab countries. The remaining countries’ Facebook populations were split between Arabic and English. The availability of various language interfaces could partly explain the larger number of Facebook users in the region, as compared to Twitter users, as Twitter has yet to launch its Arabic interface.
• When it comes to Twitter usage, The GCC countries (specifically Qatar, Bahrain, the UAE and Kuwait) along with Egypt dominate the top five countries in terms of both Twitter users and volume of tweets. Generally, the volume of tweets and number of Twitter users are correlated, indicating that the estimated Twitter users across the region are all active (tweeting at least once every two weeks, and on average just under once a day).
Twitter Country SpotlightsIn terms of Twitter penetration as a percentage of population, Arab countries can be divided into the following:
Countries with high Twitter user penetration
These include Qatar and Bahrain, both countries with high Facebook penetration and Internet penetration rates, as well as very high mobile subscription rates (see Table 6). Qatar also has the second largest Twitter user population in the region (behind the UAE), and has generated the second largest number of tweets in the region (behind Kuwait), with the majority of these tweets coming from Doha. Given the much smaller population of Qatar, as compared with these two GCC countries, there are clearly other reasons, beyond Internet penetration, which may help to explain the high uptake of Twitter in the first quarter of 2011. Possible factors include Qatar winning the 2022 World Cup bid last year, which generated Twitter buzz and recruited new Twitter users who appear to have been retained through the last three months.20 The Qatari government has also embraced Twitter, among other social media tools, as part of its social media strategy.21 Moreover, Doha recently hosted the Doha 2011 Twestival, indicating a healthy interest in Twitter among the population of Doha.22
Countries with above - average Twitter user penetration
These include the UAE and Kuwait, again two countries with high Internet, Facebook, and mobile penetration rates. Kuwait generated the highest number of tweets in the region over the first quarter of 2011, despite having almost half the Twitter population of the UAE. One possible reason for this emerged on closer inspection of the patterns of tweeting captured in the sampling. These indicated a higher than average number (compared to the rest of the region) of very active users, which could include spam or ‘bots,’23 as well as possibly indicating a thriving social media marketing industry that utilizes Twitter campaigns.
20 http://dohatweetups.com/2011/01/qatar-2022-tweet-up/
21 http://www.scribd.com/doc/50680415/ictQATAR-Creating-a-Strategic-Presence-in-Social-Media
22 http://twitter.com/#!/dohatwestival
23 Internet bots are software applications that run simple and repetitive automated tasks over the Internet, at a rate much higher than is possible for a human.

24 Arab Social Media Report Vol. 1, No. 2
Users in the GCC countries above predominantly use Facebook’s English interface, which could partly explain their higher Twitter rankings over Arab countries that predominantly use Facebook’s Arabic interface, such as Saudi Arabia and Palestine, both with above - average Internet and Facebook penetration. A disinclination to use an English interface could contribute to lower numbers of Twitter users in these countries, given that the micro-blogging website does not offer an Arabic interface.
Countries with below-average Twitter user penetration
The remaining Arab countries all have low Twitter user penetration (the majority of them under 0.5%, with the exception of Lebanon, Jordan and Libya). Of these countries, Egypt particularly stands out, with one of the lowest Twitter user penetration rates in the region, especially given that the country has close to 7 million Facebook users and 17-18 million Internet users.
There are two possible reasons for this. The first is that the distribution of Twitter users in Egypt is primarily concentrated in Cairo (51% of Twitter users), followed by Alexandria (8% of Twitter users), with the remaining 40% dispersed, in areas with less than 1.5% of Twitter users in each. Mansoura, for example, has 0.8% of Twitter users, while Tanta has 0.7%. This concentration of Twitter users in Cairo indicates that Twitter usage has not really caught on outside the capital. The second possible factor could be that Twitter has not yet offered an Arabic interface (initially scheduled for the first quarter of 2011). Given that Egypt’s Facebook users are evenly split between using Facebook’s Arabic and English interfaces, the fact that there is no Arabic interface available for Twitter could deter many potential Twitter users.
Overall, levels of Internet and Facebook penetration seem to be a good indicator of Twitter usage, along with mobile subscriptions rates, given that mobile signups to Twitter have been increasing globally. A language barrier is also apparent in countries that primarily use an Arabic interface on Facebook, as that has not been made available on Twitter yet. Social and political events, as evidenced by the top trends, also influenced the tweet volumes across the region.
ConclusionThe role of social media in the uprisings sweeping the Arab world has been under assessment during 2011. The level of social media’s contribution to the buildup of the uprisings is still debatable. This report provides empirical evidence suggesting that the growth of social media in the region and the shift in usage trends have played a critical role in mobilization, empowerment, shaping opinions, and influencing change. A critical mass of young and active social media users in the Arab world exists today. This is coupled with a continued shift of usage trends from social into political nature across the region. Arab governments’ reactions to this new phenomenon have been mixed. For decades, most Arab governments enjoyed full control on information flows in societies. While some governments tried to resist change, and to strangle the new forms of informational flows emerging in their societies — by blocking access to social media websites, the Internet or mobile networks altogether — a few were more responsive, and started adapting to the changes. These more responsive governments tried to take advantage of the growth of social media usage among the mostly young population by putting new guidelines and policies in place. It is still early to make a final assessment about the role of social media in the Arab civil movements or the role they will be playing in changing the ways in which governments interact with societies in the region. One thing that is certain is that given the region’s young population and increasing penetration rates, social media will continue to play a growing role in political, societal and economic developments in the Arab region.

25Civil Movements: The Impact of Facebook and Twitter
Annex 1
Methodolgy
Facebook Data
The number of Facebook users in all 22 Arab countries, in addition to Iran, Israel and Turkey, was collected periodically between January 5 and April 5, 2011, in the following age brackets—youth (15-29), and adults (30 and over).
Raw data on for all Arab countries was collected using Facebook’s official internal data (Group A), excluding Syria and Sudan (Group B), for which data had to be found from a source other than the Facebook. Due to American technology export laws, Facebook does not provide data on the number of users in Syria, Sudan and Iran for advertising purposes. The real numbers of Facebook users in Syria and Iran (in November 2007 and June 2008, respectively) were located through an online search; no such data for Sudan was found, so all Sudan data was estimated using the Arab daily growth rate (calculated from the Group A countries between January 5 and April 5, 2011). This rate was used to calculate the number of users in group B, for consistency’s sake, to ensure a smaller error margin than using the growth rates of similar countries for each individual country. For Syria, specifically, after February 7, 2011, when social media sites were no longer banned, a different daily growth was used to reflect the ensuing surge in growth number of Facebook users. This rate was based on the average daily growth rate in Yemen, which has a similar ICT and socio-economic indicators as Syria and witnessed an uprising influenced by Facebook as well. In addition, a one-off factor was added to the calculation of the Syria growth rate after lifting the ban on social media website on February 7. This was estimated based on the surge in number of Facebook users in Egypt after the Internet was unblocked on February 2.
It should be noted that for all charts in this paper, the numbers of Facebook users in Syria, Sudan and Iran are estimates, while the numbers for remaining countries were compiled from official Facebook data.
Twitter data
The number of Twitter users, number of tweets, and top trends in all 22 Arab countries, in addition to Iran, Israel and Turkey, was estimated between January 1 and March 30, 2011 by retrospectively sampling 190,706 Twitter users and 10,552,772 tweets. The study was conducted using a specially developed Twitter API.
For Twitter users, estimating thesizeofaTwitterpopulation was a simple two-step process:
• Capture a number of samples (or «sweeps») of users from each country
• Use a mark-recapture based technique to compute a population estimate
Sweeps were done across all hours of the day over 2 one-week time periods (Sweep 1: 28/3/2011 to 4/4/2011 (09:00 GMT) Sweep 2: 6/4/2011 to 13/4/2011 (14:20 GMT)). These samples only included “active” tweeters, who tweeted at least once during the two week sampling process. Consequently, dormant users were eliminated, but people who tweeted had not been captured. The mark-recapture technique looks at the overlap between different samples in order to estimate the total size of a population. This estimated population then includes all Twitter users who tweet at least once every two weeks, even if they were “on Twitter holiday” and not actually captured in the sample.
Users were then allocated to their correct countries using Twitter’s location search, and refined using Yahoo! and Google geo-locating services to adjust for any errors. Israel and Palestine specifically were difficult to allocate, given that geo-locating services would return “Israel” for the entire country. In this case, users’ self-described locations were used. Corrections were also made for unresolved locations, by estimating the size of this effect in every country and adjusting for it.
The mark-recapture technique uses the standard Lincoln-Petersen formula for mark-recapture population estimation. This formula relies on several assumptions:
1. That the population does not significantly change between samples i.e. there aren›t many people joining or leaving Twitter across the sampling period.
2. That the sampling procedure does not have an effect on individual behaviors (in ecological sampling the act of capturing an animal might sometimes kill it).
3. That all individuals in the population are equally likely to be captured

26 Arab Social Media Report Vol. 1, No. 2
The first two assumptions are valid in this case, while the third assumption does not hold for message-based sampling, as some Twitter users are much more prolific than others. Consequently, the estimates were corrected for heterogeneity (i.e. corrected for the increased likelihood of being picked up in a sweep if one is more active).
Forvolumeoftweetsandtrendanalysis, the Twitter users’ posting history or “timeline” was traced back to at most 3,200 messages for each user across the three-month time period (analyzing over 10 million messages in total for all sampled users). This had to be adjusted for more prolific users, as it was not possible to trace back through the entire period, given that the high volume for tweets they generated “used up” the allotted 3,200 messages at a much faster rate than other users.
Average daily number of tweets per person was calculated for each country, and it is the average tweets-per-day excluding people who post more than once an hour or less than once every couple of days. This methodology claims that this is a better representation of what the “normal” Twitter uses tweets daily, rather than a straight average which will include outliers and bots.
Word frequency calculation was used to come up with most popular trends. A list of “stopwords” or commonly used words such as “the” and “some” were excluded in both Arabic and English, as well as Twitter-specific words such as “RT”. The English list contained around 700 words, while the Arabic list contained over 13,000.
It is worth noting that the samples used to estimate the volume of tweets24 and top trends in each country were different to the samples used to estimate the Twitter populations. The former samples sizes are smaller - with certain countries25 having sample sizes of under 100, and therefore their results should be treated with caution.
24 The total volume of tweets was calculated using the estimated number of daily tweets for each region, rather than the sum of day-to-day volumes, which are approximations estimated from smaller samples and the data can be quite noisy.
25 Comoros, Iran, Libya, Mauritania, Palestine, Somalia, Syria, Yemen

27Civil Movements: The Impact of Facebook and Twitter
Annex 2
Data Tables on Facebook and Twitter in the Arab Region
Table 4: Facebook Users and Country Populations in the Arab World*2011 populations, from United Nations ILO Department of Statistics, http://laborsta.ilo.org/
See Figure 12 for rankings using official GCC population data
Country
Algeria
Bahrain
Comoros
Djibouti
Egypt
Iraq
Jordan
Kuwait
Lebanon
Libya
Mauritania
Morocco
Oman
Palestine
Qatar
Saudi Arabia
Somalia
Sudan
Syria
Tunisia
UAE
Yemen
Number of
Facebook users
(4/5/2011)
1,947,900
302,940
9,080
52,660
6,586,260
723,740
1,402,440
795,100
1,093,420
71,840
61,140
3,203,440
277,840
595,120
481,280
4,092,600
21,580
443,623
356,247
2,356,520
2,406,120
340,800
Population*
35,953,989
822,510
706,622
893,843
85,950,300
32,266,577
6,598,615
3,116,748
4,287,610
6,670,928
3,440,053
32,770,852
2,964,059
4,542,824
1,571,520
26,777,613
9,605,189
44,103,535
23,008,268
10,476,355
4,811,345
24,943,950
penetration
(%)
5.42
36.83
1.28
5.89
7.66
2.24
21.25
25.51
25.50
1.08
1.78
9.78
9.37
13.10
30.63
15.28
0.22
1.01
1.55
22.49
50.01
1.37
Number of New
Facebook users
since 1/5/2011
560,820
25,480
2,800
6,660
1,951,960
326,600
313,640
165,420
113,940
-182,300
22,300
724,500
65,010
124,720
-30,780
845,620
14,820
101,780
102,918
535,640
291,480
161,380
Growth in number
of Facebook users
since 1/5/2011 (%)
40.43
9.18
44.59
14.48
42.12
82.24
28.81
26.27
11.63
-71.73
57.42
29.23
30.55
26.51
-6.01
26.04
219.23
29.77
40.63
29.42
13.78
89.95
New Facebook users
since 1/5/2011 (as %
of population)
1.56
3.10
0.40
0.75
2.27
1.01
4.75
5.31
1.74
-2.73
0.65
2.21
2.19
2.75
-1.96
3.16
0.15
0.23
0.45
5.11
6.06
0.65

28 Arab Social Media Report Vol. 1, No. 2
Table 5: Volume of Tweets and Twitter users in the Arab region between Jan 1 and March 30*2011 populations, from United Nations ILO Department of Statistics, http://laborsta.ilo.org/
See Figure 22 for rankings using official GCC population data
Country
Algeria
Bahrain
Comoros
Djibouti
Egypt
Iraq
Jordan
Kuwait
Lebanon
Libya
Mauritania
Morocco
Oman
Palestine
Qatar
Saudi Arabia
Somalia
Sudan
Syria
Tunisia
UAE
Yemen
Estimated Number of
Twitter Users (Avg.
between Jan 1st and
March 30th, 2011)
13,235
61,896
834
4,046
131,204
21,625
55,859
113,428
79,163
63,919
1,407
17,384
6,679
11,369
133,209
115,084
4,244
9,459
40,020
35,746
201,060
29,422
Population*
35,953,989
822,510
706,622
893,843
85,950,300
32,266,577
6,598,615
3,116,748
4,287,610
6,670,928
3,440,053
32,770,852
2,964,059
4,542,824
1,571,520
26,777,613
9,605,189
44,103,535
23,008,268
10,476,355
4,811,345
24,943,950
Twitter penetration
(Avg. between Jan
1st and March
30th, 2011)
0.04
7.53
0.12
0.45
0.15
0.07
0.85
3.63
1.85
0.96
0.04
0.05
0.23
0.25
8.46
0.43
0.04
0.02
0.17
0.34
4.18
0.12
Estimated Twitter
Volume (cumulative:
Jan 1st through
March 30th, 2011)
252,000
1,350,000
10,800
61,200
2,160,000
342,000
639,000
3,690,000
990,000
1,890,000
10,800
252,000
81,900
639,000
3,060,000
2,250,000
79,200
89,100
783,000
576,000
2,790,000
729,000
Estimated Number
of Daily Tweets (Avg.
between Jan 1st and
March 30th, 2011)
2,800
15,000
120
680
24,000
3,800
7,100
41,000
11,000
21,000
120
2,800
910
7,100
34,000
25,000
880
990
8,700
6,400
31,000
8,100

29Civil Movements: The Impact of Facebook and Twitter
Table 6: Facebook, Twitter, Internet and Mobile Subscription Rates in the Arab Region*2011 populations,
from *2011 populations, from United Nations ILO Department of Statistics, http://laborsta.ilo.org/
See Figure 12 and Figure 21 for rankings using official GCC population data
** ITU statistics 2009 http://www.itu.int/ITU-D/ICTEYE/Indicators/Indicators.aspx
Country
Algeria
Bahrain
Comoros
Djibouti
Egypt
Iraq
Jordan
Kuwait
Lebanon
Libya
Mauritania
Morocco
Oman
Palestine
Qatar
Saudi Arabia
Somalia
Sudan
Syria
Tunisia
UAE
Yemen
Estimated Number of Active
Twitter Users (Avg. between
Jan 1st and March 30th, 2011)
13,235
61,896
834
4,046
131,204
21,625
55,859
113,428
79,163
63,919
1,407
17,384
6,679
11,369
133,209
115,084
4,244
9,459
40,020
35,746
201,060
29,422
penetration*
(%)
0.04
7.53
0.12
0.45
0.15
0.07
0.85
3.63
1.85
0.96
0.04
0.05
0.23
0.25
8.46
0.43
0.04
0.02
0.17
0.34
4.18
0.12
Number of
Facebook users
(4/5/2011)
1,947,900
302,940
9,080
52,660
6,586,260
723,740
1,402,440
795,100
1,093,420
71,840
61,140
3,203,440
277,840
595,120
481,280
4,092,600
21,580
443,623
356,247
2,356,520
2,406,120
340,800
penetration*
(%)
5.42
36.83
1.28
5.89
7.66
2.24
21.25
25.51
25.50
1.08
1.78
9.78
9.37
13.10
30.63
15.28
0.22
1.01
1.55
22.49
50.01
1.37
Internet
users per
100 **
13.47
53.00
3.59
3.00
24.26
1.06
26.00
36.85
23.68
5.51
2.28
41.30
51.50
32.23
40.00
38.00
1.16
9.19
20.40
34.07
75.00
9.96
Mobile
Subscriptions
per 100 **
93.79
177.13
18.49
14.90
66.69
64.14
95.22
129.85
56.59
77.94
66.32
79.11
139.54
28.62
175.40
174.43
7.02
36.29
45.57
95.38
232.07
35.25
30 Arab Social Media Report Vol. 1, No. 2
Dubai School of Government, Convention Tower, Level 13, P.O. Box 72229
Dubai, United Arab Emirates
Tel: 971-4-329-3290, Fax: 971-4-329-3291
Email: [email protected], www.dsg.ae
About Dubai School of GovernmentThe Dubai School of Government (DSG) is a research and teaching institution focusing on public policy in the Arab world. Established in 2005 under the patronage of HH Sheikh Mohammed Bin Rashid Al Maktoum, Vice President and Prime Minister of the United Arab Emirates and Ruler of Dubai, in cooperation with the Harvard Kennedy School, DSG aims to promote good governance through enhancing the region’s capacity for effective public policy.
Toward this goal, the Dubai School of Government also collaborates with regional and global institutions in delivering its research and training programs. In addition, the School organizes policy forums and international conferences to facilitate the exchange of ideas and promote critical debate on public policy in the Arab world.
The School is committed to the creation of knowledge, the dissemination of best practice and the training of policy makers in the Arab world. To achieve this mission, the School is developing strong capabilities to support research and teaching programs, including
• applied research in public policy and management;
• master’s degrees in public policy and public administration;
• executive education for senior officials and executives; and,
• knowledge forums for scholars and policy makers.
About DSG’s Governance and Innovation ProgramThe Governance and Innovation Program at DSG conducts research and programmatic activities focusing on policies for government innovation and development through information technologies in the Arab states. The objectives of the program are aligned with stated regional governments’ objectives towards nurturing a culture of innovation in society, promoting participatory, inclusive and transparent government models; and enabling more responsive and efficient governance through effective adoption of information technologies.
The program works on three tracks:
• Policy and Scholarly Research: Conducting research focusing on government policies and societal transformation through technological innovation in the Arab region.
• Policy Advisory: The ultimate objective of the Program is to inform present and future Arab policy makers in assessing the impact of the ongoing transformations in their societies and governments; and to help develop locally fitting policies for future governance initiatives.
• Regional Development Activities: The Program brings together a regional network of practitioners and scholars working in related areas through programmatic and educational activities, in order to encourage proactive regional knowledge sharing and bridge the gap between policy and research.
Readers are free to copy, distribute, transmit and adapt the work, on the following conditions: You must attribute ownership of the work to the Dubai School of Government; you must not use the work for commercial purposes; and, if you share, alter, transform or build upon the work, you must distribute the resulting work only under the same or similar conditions. These conditions may be waived if you obtain written permission from the Dubai School of Government. Where the work or any of its elements is in the public domain under applicable law, that status is in no way affected by the license.
Arab Social Media Report by Dubai School of Government - Governance and Innovation Program is licensed under a Creative Commons Attribution-NonCommercial-ShareAlike 3.0 Unported License.
Based on a work at www.arabsocialmediareport.com.
Permissions beyond the scope of this license may be available athttp://www.dsg.ae/NEWSANDEVENTS/UpcomingEvents/ASMRAcknowledgment2.aspx.
This report is produced by DSG’s Governance and Innovation Program and co-authored by Racha Mourtada and Fadi Salem:
Fadi Salem is a Fellow and Director of the Governance and Innovation Program in the Dubai School of Government.
Racha Mourtada is a Research Associate in the Governance and Innovation Program in the Dubai School of Government
Acknowledgements
The authors would like to acknowledge the efforts of the following individuals and entities in providing invaluable contributions, input and assistance into the report and its related materials:
Stephen Brannon, Saleha BuKattara, Jineesh M. Illath, Rakesh Kumar, Selma Nagbou, Daniel Winterstein & Joe Halliwel
The views expressed in this report are those of the authors and do not necessarily reflect those of the trustees, officers and other staff of the Dubai School of Government.