Embed Size (px)
Citation preview
TSX:AR
May 2018
CORPORATE PRESENTATION
2TSX:AR CORPORATE PRESENTATION – May 2018 | ARGONAUT GOLD
FORWARD LOOKING INFORMATION
This presentation contains certain “forward-looking statements” and “forward-looking information” under applicable Canadian securities laws concerning the proposed
transaction and the business, operations and financial performance and condition of Argonaut Gold Inc. (“Argonaut” or “Argonaut Gold”). Forward-looking statements and
forward-looking information include, but are not limited to, statements with respect to estimated production and mine life of the various mineral projects of Argonaut;
expectations with respect to future cash flows from operations, net debt and financial results; the successful completion of proposed acquisitions; metal or mineral
recoveries; synergies and financial impact of completed acquisitions; the benefits of the development potential of the properties of Argonaut; the future price of gold,
copper, and silver; the estimation of mineral reserves and resources; the realization of mineral reserve estimates; the timing and amount of estimated future production;
costs of production; success of exploration activities; and currency exchange rate fluctuations. Except for statements of historical fact relating to Argonaut, certain
information contained herein constitutes forward-looking statements. Forward-looking statements are frequently characterized by words such as “plan,” “expect,” “project,”
“intend,” “believe,” “anticipate”, “estimate” and other similar words, or statements that certain events or conditions “may” or “will” occur. Forward-looking statements are
based on the opinions and estimates of management at the date the statements are made, and are based on a number of assumptions and subject to a variety of risks
and uncertainties and other factors that could cause actual events or results to differ materially from those projected in the forward-looking statements. Many of these
assumptions are based on factors and events that are not within the control of Argonaut and there is no assurance they will prove to be correct.
Factors that could cause actual results to vary materially from results anticipated by such forward-looking statements include risks of the mining industry, failure of plant,
equipment or processes to operate as anticipated, changes in market conditions, variations in ore grade or recovery rates, risks relating to international operations,
fluctuating metal prices and currency exchange rates, changes in project parameters, the possibility of project cost overruns or unanticipated costs and expenses and
labour disputes.
These factors are discussed in greater detail in Argonaut's (i) most recent Annual Information Form, and (ii) most recent Management Discussion and Analysis, which are
each filed on SEDAR and provide additional general assumptions in connection with these statements. Argonaut cautions that the foregoing list of important factors is not
exhaustive. Investors and others who base themselves on forward-looking statements should carefully consider the above factors as well as the uncertainties they
represent and the risk they entail. Argonaut believes that the expectations reflected in those forward-looking statements are reasonable, but no assurance can be given
that these expectations will prove to be correct and such forward-looking statements included in this presentation should not be unduly relied upon. These statements
speak only as of the date of this presentation.
Although Argonaut has attempted to identify important factors that could cause actual actions, events or results to differ materially from those described in forward-looking
statements, there may be other factors that cause actions, events or results not to be anticipated, estimated or intended. There can be no assurance that forward-looking
statements will prove to be accurate, as actual results and future events could differ materially from those anticipated in such statements.
Argonaut undertakes no obligation to update forward-looking statements if circumstances or management’s estimates or opinions should change except as required by
applicable securities laws. The reader is cautioned not to place undue reliance on forward-looking statements. Statements concerning mineral reserve and resource
estimates may also be deemed to constitute forward-looking statements to the extent they involve estimates of the mineralization that will be encountered if the property is
developed. Comparative market information is as of a date prior to the date of this document.
References to dollars or “$” are to U.S. dollars unless specified otherwise.
3TSX:AR CORPORATE PRESENTATION – May 2018 | ARGONAUT GOLD
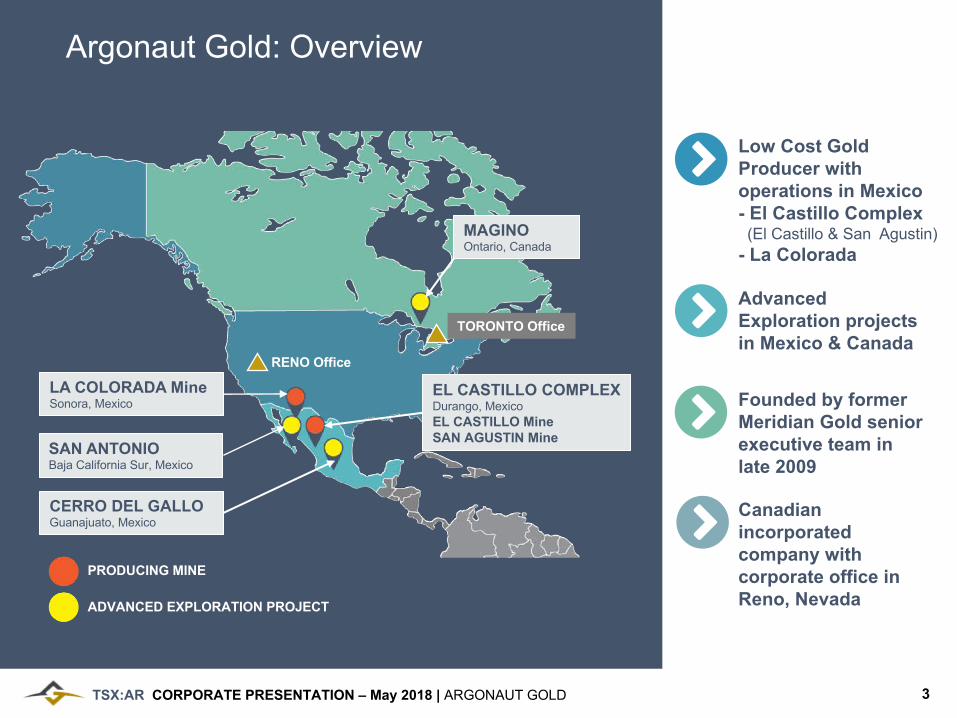
Argonaut Gold: Overview
Canadian incorporated company with corporate office in Reno, Nevada
Low Cost Gold Producer with operations in Mexico- El Castillo Complex
(El Castillo & San Agustin)- La Colorada
Advanced Exploration projects in Mexico & Canada
Founded by former Meridian Gold senior executive team in late 2009
LA COLORADA MineSonora, Mexico
CERRO DEL GALLO Guanajuato, Mexico
MAGINOOntario, Canada
EL CASTILLO COMPLEXDurango, MexicoEL CASTILLO MineSAN AGUSTIN Mine
PRODUCING MINE
ADVANCED EXPLORATION PROJECT
RENO Office
TORONTO Office
SAN ANTONIOBaja California Sur, Mexico
4TSX:AR CORPORATE PRESENTATION – May 2018 | ARGONAUT GOLD
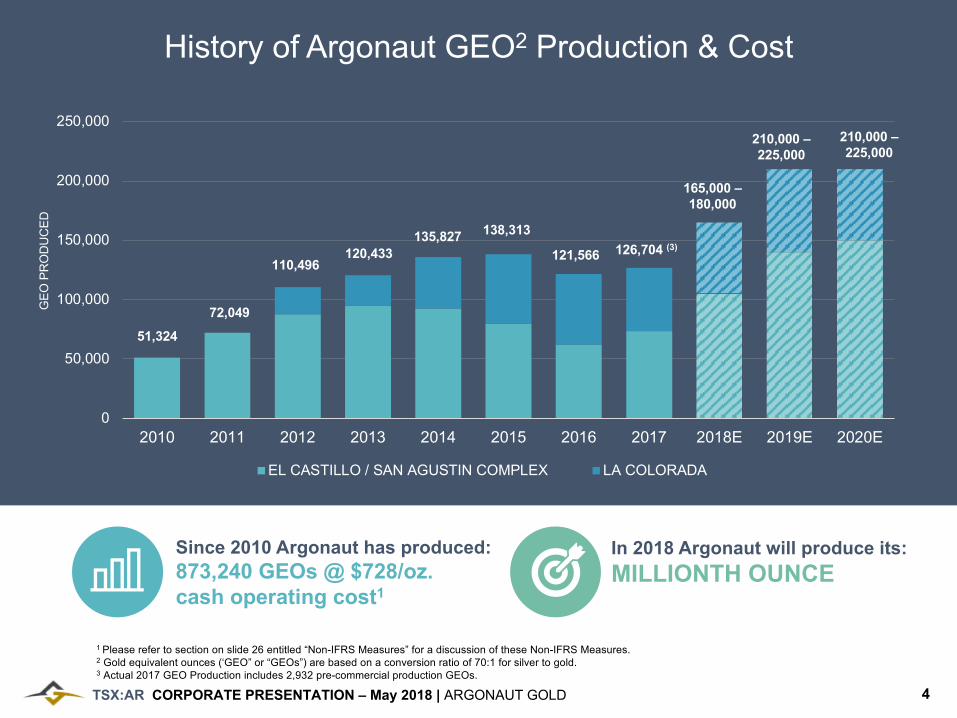
History of Argonaut GEO2 Production & Cost
0
50,000
100,000
150,000
200,000
250,000
2010 2011 2012 2013 2014 2015 2016 2017 2018E 2019E 2020E
EL CASTILLO / SAN AGUSTIN COMPLEX LA COLORADA
51,32472,049
110,496 120,433
135,827 138,313
121,566 126,704 (3)
Since 2010 Argonaut has produced:873,240 GEOs @ $728/oz.cash operating cost1
GEO
PR
OD
UC
ED
1 Please refer to section on slide 26 entitled “Non-IFRS Measures” for a discussion of these Non-IFRS Measures.2 Gold equivalent ounces (‘GEO” or “GEOs”) are based on a conversion ratio of 70:1 for silver to gold.3 Actual 2017 GEO Production includes 2,932 pre-commercial production GEOs.
165,000 –180,000
210,000 –225,000
210,000 –225,000
In 2018 Argonaut will produce its:MILLIONTH OUNCE
5TSX:AR CORPORATE PRESENTATION – May 2018 | ARGONAUT GOLD
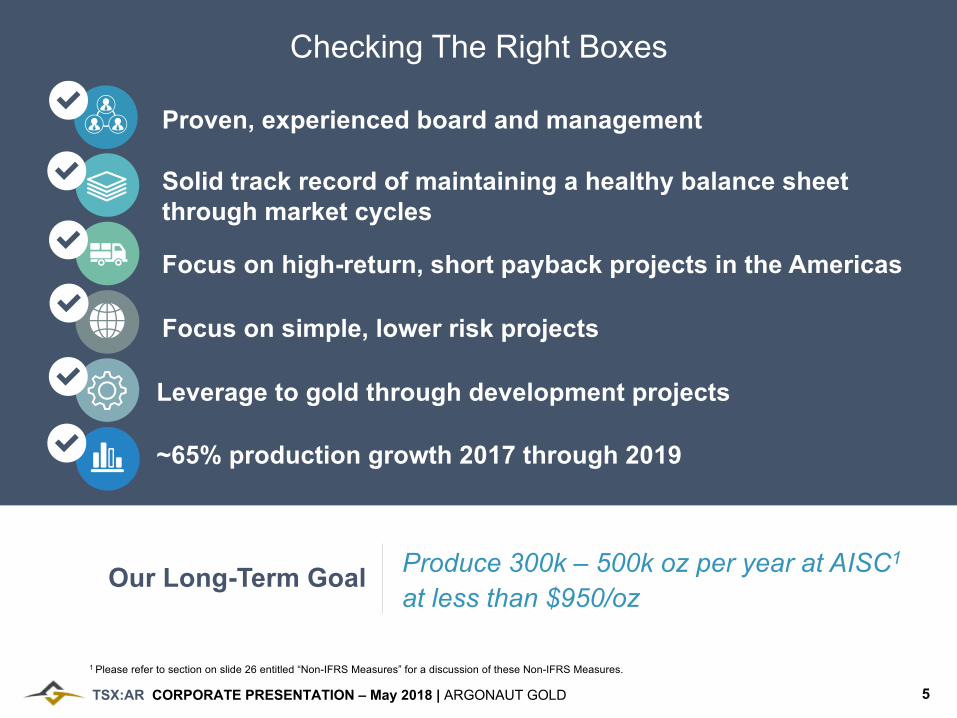
Checking The Right Boxes
Proven, experienced board and management
~65% production growth 2017 through 2019
Solid track record of maintaining a healthy balance sheet through market cycles
Focus on high-return, short payback projects in the Americas
Focus on simple, lower risk projects
Leverage to gold through development projects
Our Long-Term Goal Produce 300k – 500k oz per year at AISC1
at less than $950/oz
1 Please refer to section on slide 26 entitled “Non-IFRS Measures” for a discussion of these Non-IFRS Measures.
6TSX:AR CORPORATE PRESENTATION – May 2018 | ARGONAUT GOLD
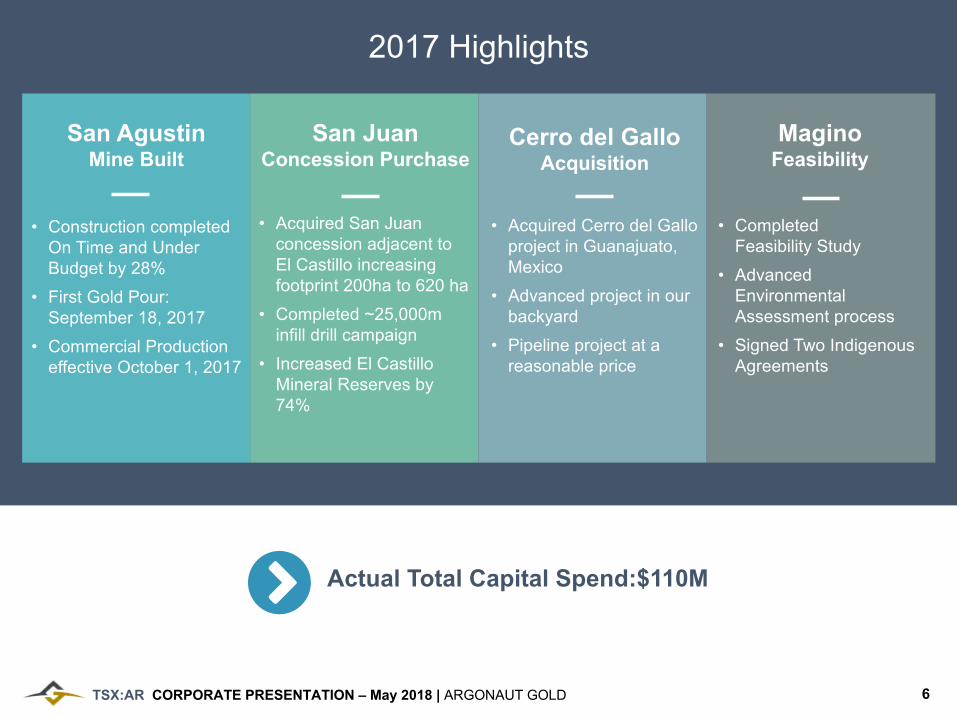
2017 Highlights
San AgustinMine Built
• Construction completed On Time and Under Budget by 28%
• First Gold Pour: September 18, 2017
• Commercial Production effective October 1, 2017
San JuanConcession Purchase
• Acquired San Juan concession adjacent toEl Castillo increasing footprint 200ha to 620 ha
• Completed ~25,000m infill drill campaign
• Increased El Castillo Mineral Reserves by 74%
Cerro del GalloAcquisition
• Acquired Cerro del Gallo project in Guanajuato, Mexico
• Advanced project in our backyard
• Pipeline project at a reasonable price
MaginoFeasibility
• CompletedFeasibility Study
• Advanced Environmental Assessment process
• Signed Two Indigenous Agreements
Actual Total Capital Spend:$110M
7TSX:AR CORPORATE PRESENTATION – May 2018 | ARGONAUT GOLD
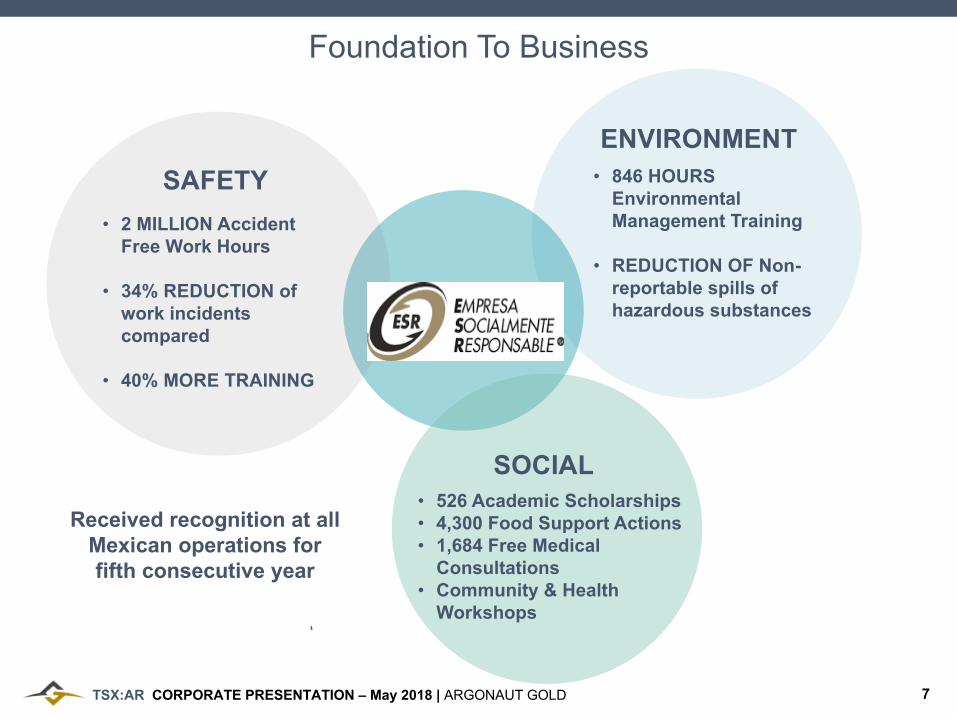
Foundation To Business
SAFETY• 2 MILLION Accident
Free Work Hours
• 34% REDUCTION of work incidentscompared
• 40% MORE TRAINING
• 846 HOURS EnvironmentalManagement Training
• REDUCTION OF Non-reportable spills of hazardous substances
ENVIRONMENT
SOCIAL• 526 Academic Scholarships• 4,300 Food Support Actions• 1,684 Free Medical
Consultations• Community & Health
Workshops
Received recognition at all Mexican operations forfifth consecutive year

8TSX:AR CORPORATE PRESENTATION – May 2018 | ARGONAUT GOLD
Achieving Our Objectives and Delivering Value
1 Please refer to section on slide 26 entitled “Non-IFRS Measures” for a discussion of these Non-IFRS Measures.2 Gold equivalent ounces (‘GEO” or “GEOs”) are based on a conversion ratio of 70:1 for silver to gold.
Solid Q1 2018Financial Performance
• Net income of $12.2 million • Earnings per share – basic of $0.07• Added $7 million net cash1 to the
balance sheet
40,853 Production GEOs2
• At cash cost of $650/oz Au sold & AISC of $781/oz Au sold1
• Higher production, lower costs compared to Q1 2017
Short Term Growth Initiatives
• San Agustin ramp-up• El Castillo throughput enhancement• Increased El Castillo Mineral Reserves
by 74%• Reported maiden Mineral Reserves at
San Agustin and La Colorada
Long Term Growth Initiatives• Magino
• Advanced EA process and permitting• Advanced Indigenous agreements
• Cerro del Gallo• Re-logged drill core and updated
geologic model
9TSX:AR CORPORATE PRESENTATION – May 2018 | ARGONAUT GOLD
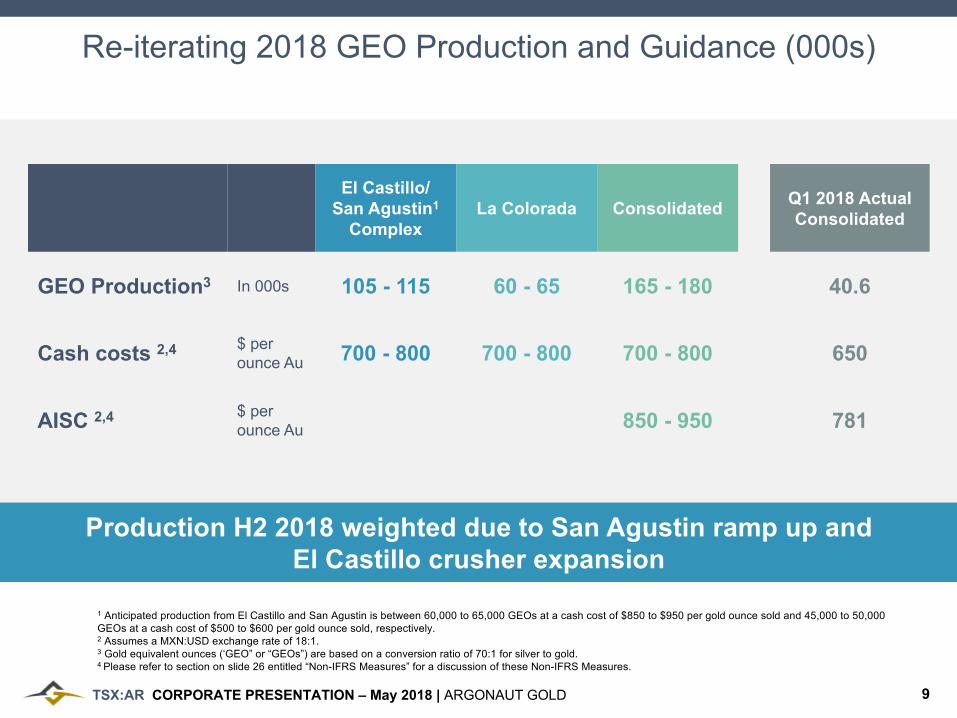
Re-iterating 2018 GEO Production and Guidance (000s)
El Castillo/San Agustin1
ComplexLa Colorada Consolidated Q1 2018 Actual
Consolidated
GEO Production3 In 000s 105 - 115 60 - 65 165 - 180 40.6
Cash costs 2,4 $ perounce Au 700 - 800 700 - 800 700 - 800 650
AISC 2,4 $ per ounce Au 850 - 950 781
1 Anticipated production from El Castillo and San Agustin is between 60,000 to 65,000 GEOs at a cash cost of $850 to $950 per gold ounce sold and 45,000 to 50,000 GEOs at a cash cost of $500 to $600 per gold ounce sold, respectively.2 Assumes a MXN:USD exchange rate of 18:1.3 Gold equivalent ounces (‘GEO” or “GEOs”) are based on a conversion ratio of 70:1 for silver to gold.4 Please refer to section on slide 26 entitled “Non-IFRS Measures” for a discussion of these Non-IFRS Measures.
Production H2 2018 weighted due to San Agustin ramp up and El Castillo crusher expansion
10TSX:AR CORPORATE PRESENTATION – May 2018 | ARGONAUT GOLD
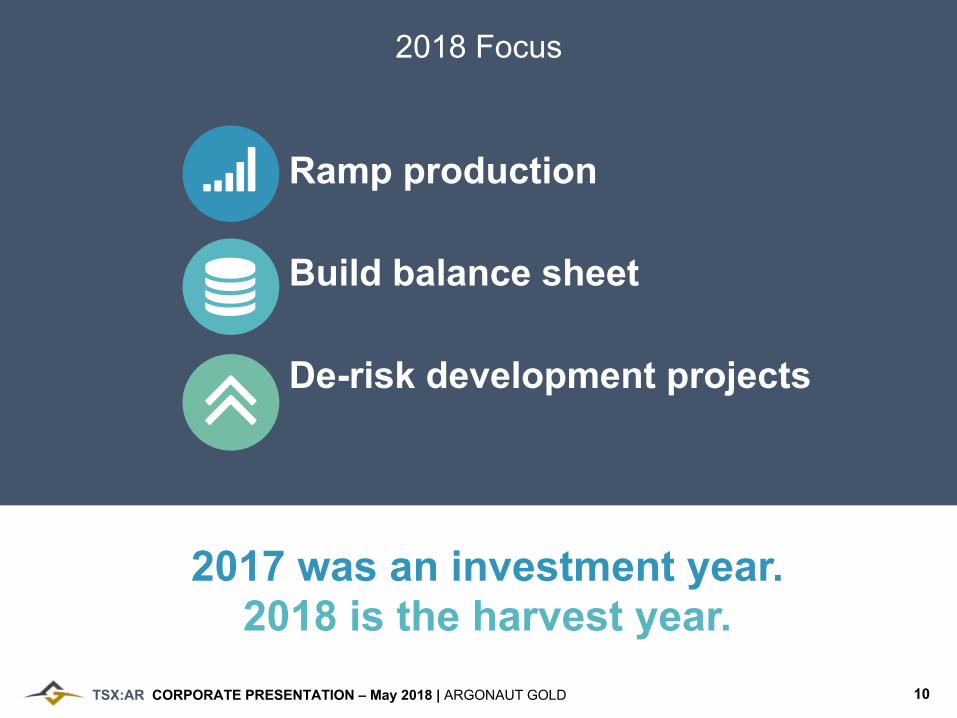
2018 Focus
2017 was an investment year.2018 is the harvest year.
Ramp production
Build balance sheet
De-risk development projects
11TSX:AR CORPORATE PRESENTATION – May 2018 | ARGONAUT GOLD
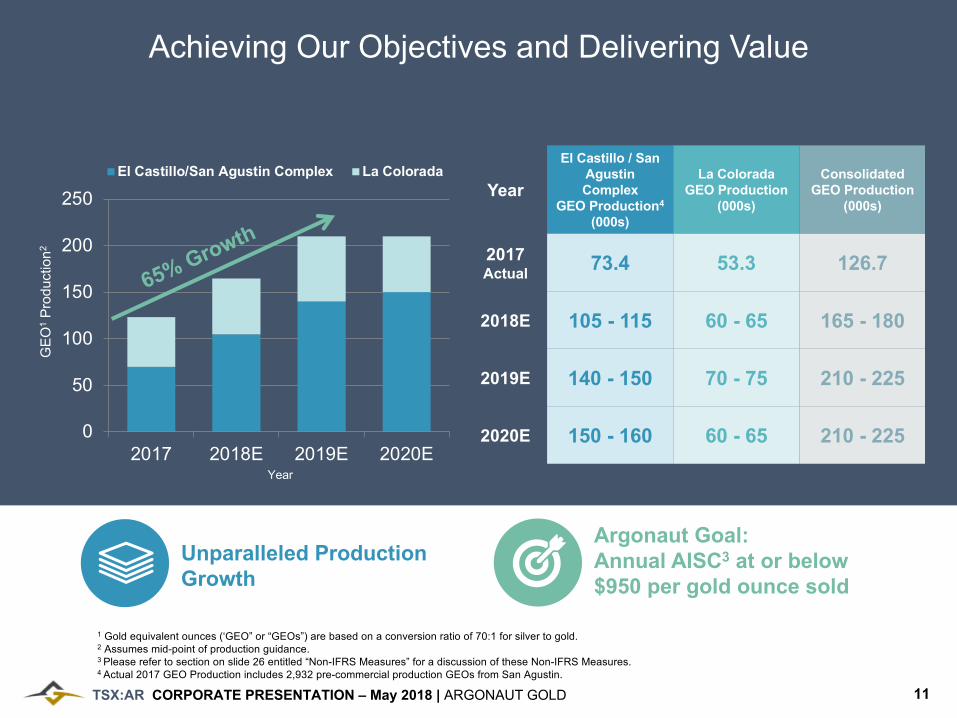
Achieving Our Objectives and Delivering Value
Unparalleled Production Growth
Argonaut Goal:Annual AISC3 at or below $950 per gold ounce sold
1 Gold equivalent ounces (‘GEO” or “GEOs”) are based on a conversion ratio of 70:1 for silver to gold.2 Assumes mid-point of production guidance.3 Please refer to section on slide 26 entitled “Non-IFRS Measures” for a discussion of these Non-IFRS Measures.4 Actual 2017 GEO Production includes 2,932 pre-commercial production GEOs from San Agustin.
0
50
100
150
200
250
2017 2018E 2019E 2020E
El Castillo/San Agustin Complex La Colorada
Year
GE
O1
Pro
duct
ion2
Year
El Castillo / San AgustinComplex
GEO Production4
(000s)
La ColoradaGEO Production
(000s)
ConsolidatedGEO Production
(000s)
2017Actual 73.4 53.3 126.7
2018E 105 - 115 60 - 65 165 - 180
2019E 140 - 150 70 - 75 210 - 225
2020E 150 - 160 60 - 65 210 - 225
65% Growth
12TSX:AR CORPORATE PRESENTATION – May 2018 | ARGONAUT GOLD
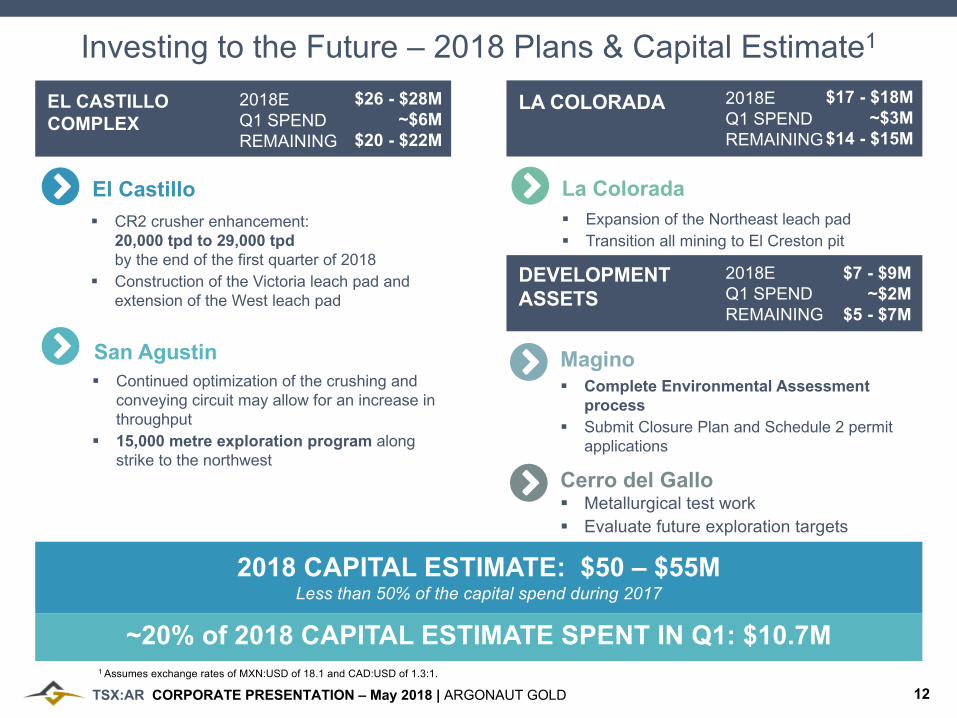
Investing to the Future – 2018 Plans & Capital Estimate1
1 Assumes exchange rates of MXN:USD of 18.1 and CAD:USD of 1.3:1.
El Castillo§ CR2 crusher enhancement:
20,000 tpd to 29,000 tpdby the end of the first quarter of 2018
§ Construction of the Victoria leach pad and extension of the West leach pad
San Agustin§ Continued optimization of the crushing and
conveying circuit may allow for an increase in throughput
§ 15,000 metre exploration program along strike to the northwest
La Colorada§ Expansion of the Northeast leach pad§ Transition all mining to El Creston pit
Magino§ Complete Environmental Assessment
process§ Submit Closure Plan and Schedule 2 permit
applications
Cerro del Gallo§ Metallurgical test work§ Evaluate future exploration targets
Less than 50% of the capital spend during 2017
EL CASTILLOCOMPLEX
$26 - $28M~$6M
$20 - $22M
LA COLORADA $17 - $18M~$3M
$14 - $15M
DEVELOPMENTASSETS
$7 - $9M~$2M
$5 - $7M
2018 CAPITAL ESTIMATE: $50 – $55M
2018EQ1 SPENDREMAINING
2018EQ1 SPENDREMAINING
2018EQ1 SPENDREMAINING
~20% of 2018 CAPITAL ESTIMATE SPENT IN Q1: $10.7M
13TSX:AR CORPORATE PRESENTATION – May 2018 | ARGONAUT GOLD
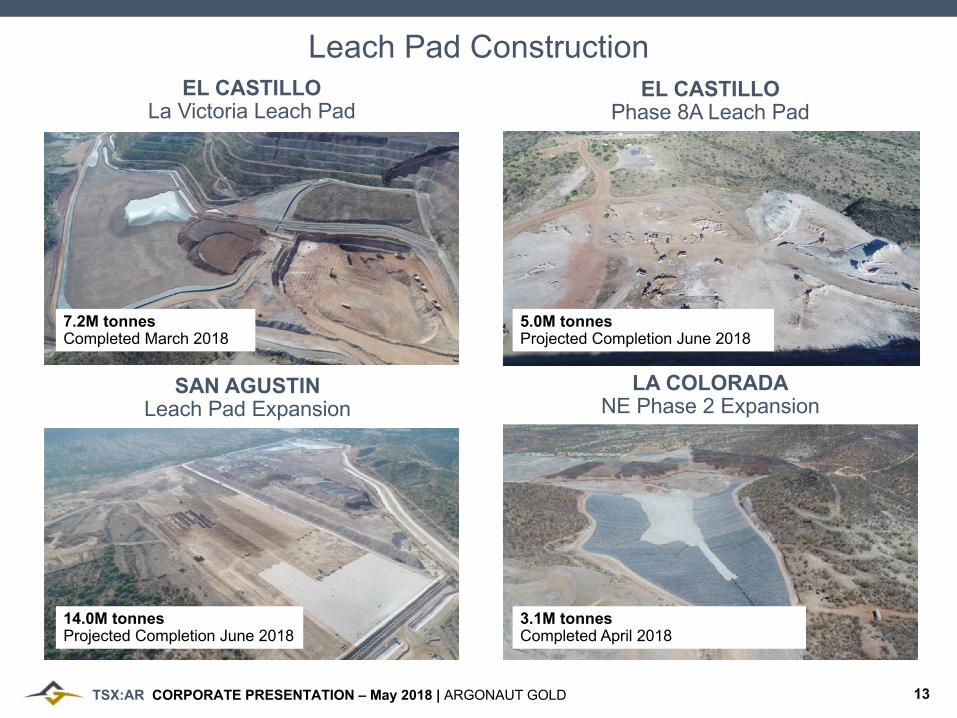
Leach Pad Construction
LA COLORADANE Phase 2 Expansion
EL CASTILLOLa Victoria Leach Pad
EL CASTILLOPhase 8A Leach Pad
SAN AGUSTINLeach Pad Expansion
7.2M tonnesCompleted March 2018
5.0M tonnesProjected Completion June 2018
14.0M tonnesProjected Completion June 2018
3.1M tonnesCompleted April 2018

14TSX:AR CORPORATE PRESENTATION – May 2018 | ARGONAUT GOLD
§ East crusher 15,000 TPD§ West Crusher 15,000 TPD§ Mid-year installed the
portable CR2 5,000 TPD
2016§ East crusher 15,000 TPD§ West crusher 15,000 TPD
relocated to San Agustin during Q1
§ Portable CR2 5,000 TPD
2017§ East Crusher 15,000 TPD§ Portable CR2 4,000 TPD
until end of Q1 2018§ CR2 expansion to 14,000
TPD start during Q2 2018
2018
RECOVERY (in oxides)
2017 Q2 2018
4”Crush Size 50% N/A
1 ½”Crush Size 68 - 70 % 68 - 70%
Throughput 5000 tpd 14,000 tpd
West CR2 Crusher Expansion
Increased throughput in 2018
§ Throughput increase§ Recovery gain§ Lower cost
Keys:
El Castillo Crushing Capacity ChangesOperations & Actions
15TSX:AR CORPORATE PRESENTATION – May 2018 | ARGONAUT GOLD
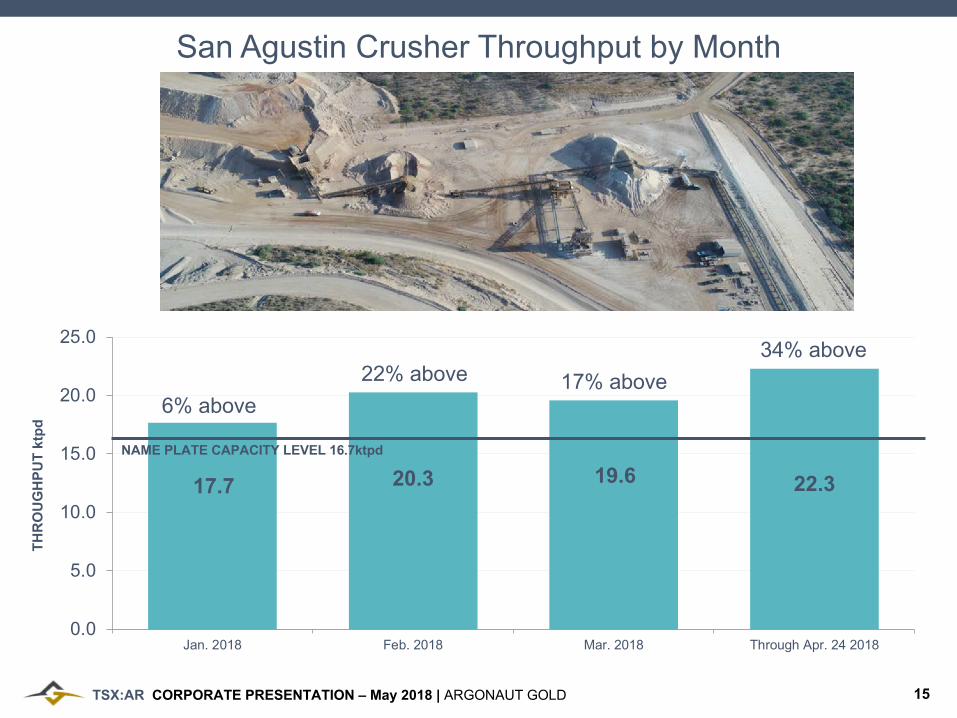
San Agustin Crusher Throughput by Month
17.7 20.3 19.6 22.3
0.0
5.0
10.0
15.0
20.0
25.0
Jan. 2018 Feb. 2018 Mar. 2018 Through Apr. 24 2018
THR
OU
GH
PUT
ktpd
NAME PLATE CAPACITY LEVEL 16.7ktpd
6% above22% above 17% above
34% above
16TSX:AR CORPORATE PRESENTATION – May 2018 | ARGONAUT GOLD
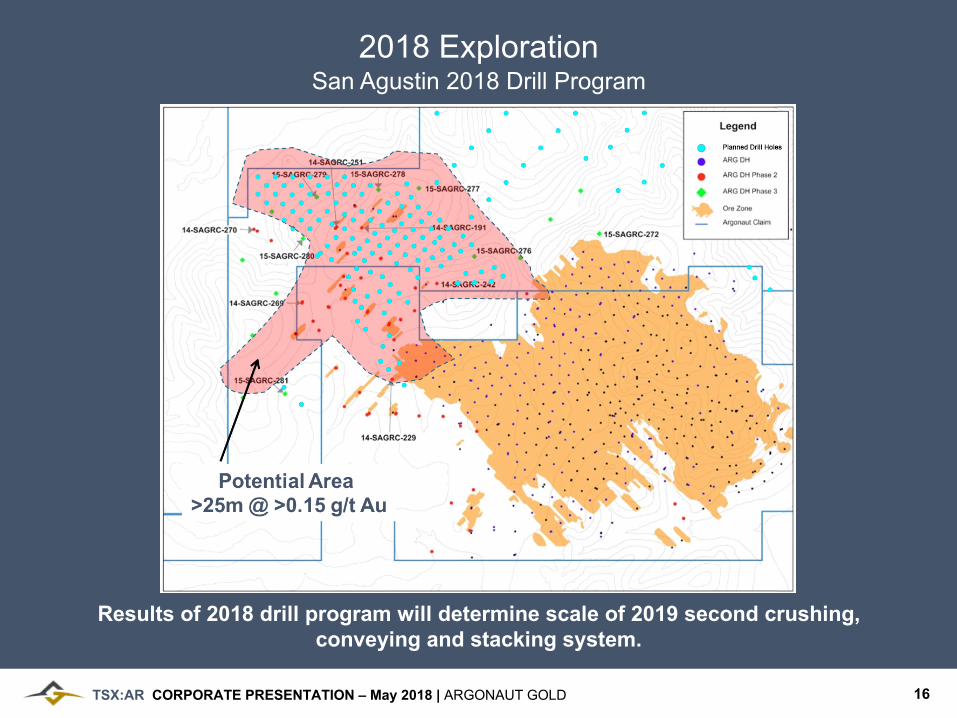
San Agustin 2018 Drill Program
Results of 2018 drill program will determine scale of 2019 second crushing, conveying and stacking system.
2018 Exploration
17TSX:AR CORPORATE PRESENTATION – May 2018 | ARGONAUT GOLD
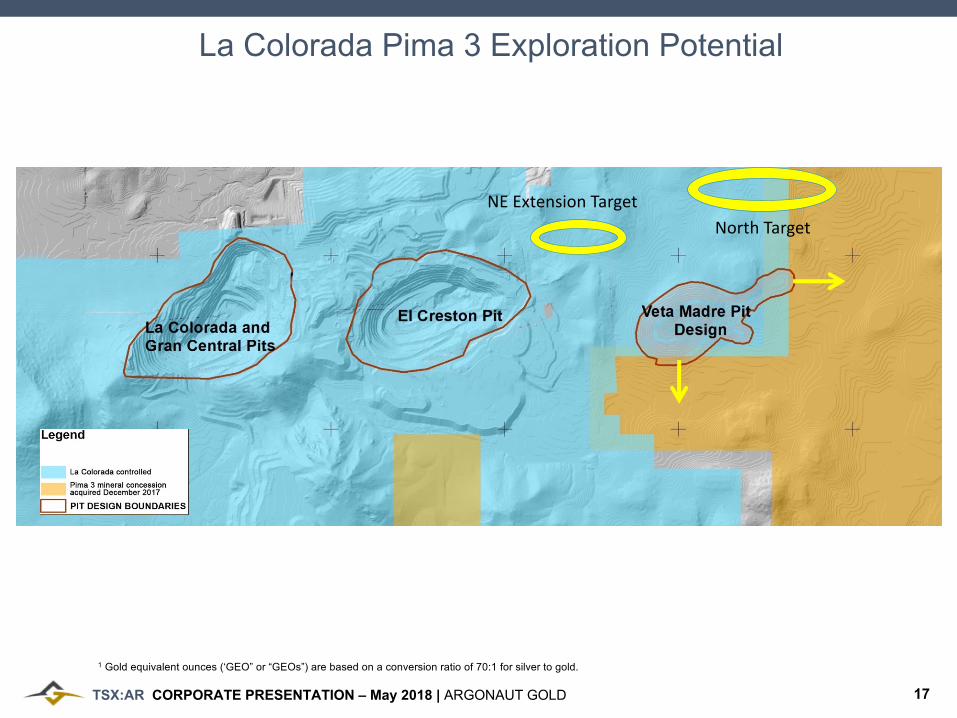
La Colorada Pima 3 Exploration Potential
1 Gold equivalent ounces (‘GEO” or “GEOs”) are based on a conversion ratio of 70:1 for silver to gold.
NE Extension TargetNorth Target
18TSX:AR CORPORATE PRESENTATION – May 2018 | ARGONAUT GOLD
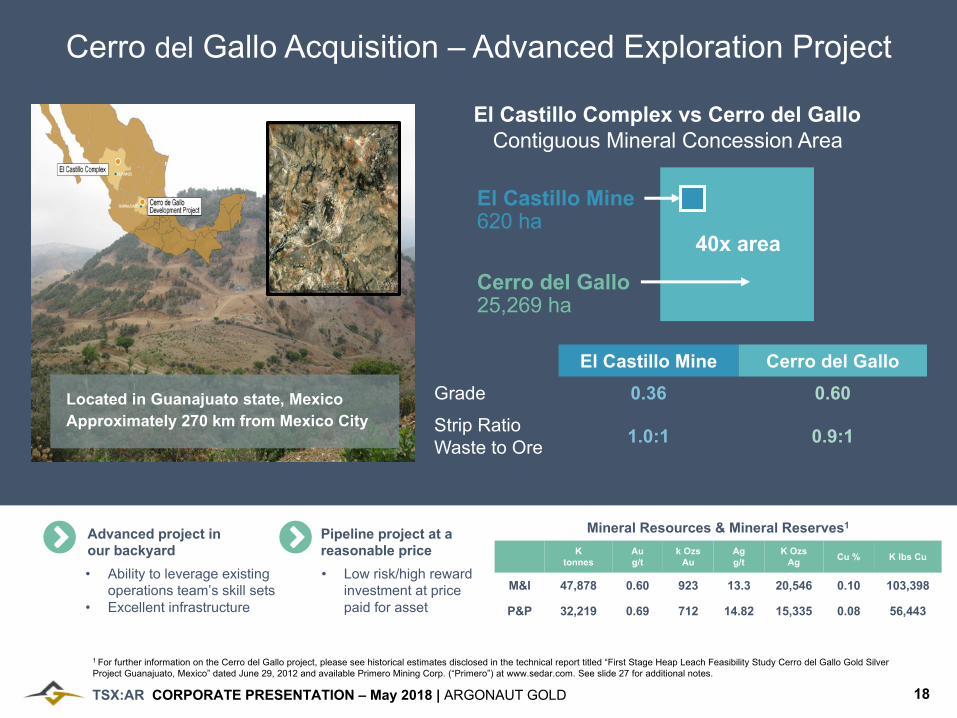
Located in Guanajuato state, MexicoApproximately 270 km from Mexico City
El Castillo Mine Cerro del GalloGrade 0.36 0.60Strip RatioWaste to Ore 1.0:1 0.9:1
El Castillo Complex vs Cerro del Gallo
Cerro del Gallo25,269 ha
El Castillo Mine620 ha
40x area
Contiguous Mineral Concession Area
Advanced project inour backyard
Pipeline project at a reasonable price
• Ability to leverage existing operations team’s skill sets
• Excellent infrastructure
• Low risk/high reward investment at price paid for asset
Ktonnes
Aug/t
k OzsAu
Agg/t
K Ozs Ag Cu % K lbs Cu
M&I 47,878 0.60 923 13.3 20,546 0.10 103,398
P&P 32,219 0.69 712 14.82 15,335 0.08 56,443
Mineral Resources & Mineral Reserves1
1 For further information on the Cerro del Gallo project, please see historical estimates disclosed in the technical report titled “First Stage Heap Leach Feasibility Study Cerro del Gallo Gold Silver Project Guanajuato, Mexico” dated June 29, 2012 and available Primero Mining Corp. (“Primero”) at www.sedar.com. See slide 27 for additional notes.
Cerro del Gallo Acquisition – Advanced Exploration Project

19TSX:AR CORPORATE PRESENTATION – May 2018 | ARGONAUT GOLD
Cerro del Gallo – Exploration Targets
Epithermal
Intrusive/PCD
Skarn
Cerro del Gallo
WMS-06
San Isidro
SillerosWMS-03
WMS-04
WMS-05
WMS-20
Cerro del GalloConceptual target
Conceptual targets
Infill
N
20TSX:AR CORPORATE PRESENTATION – May 2018 | ARGONAUT GOLD
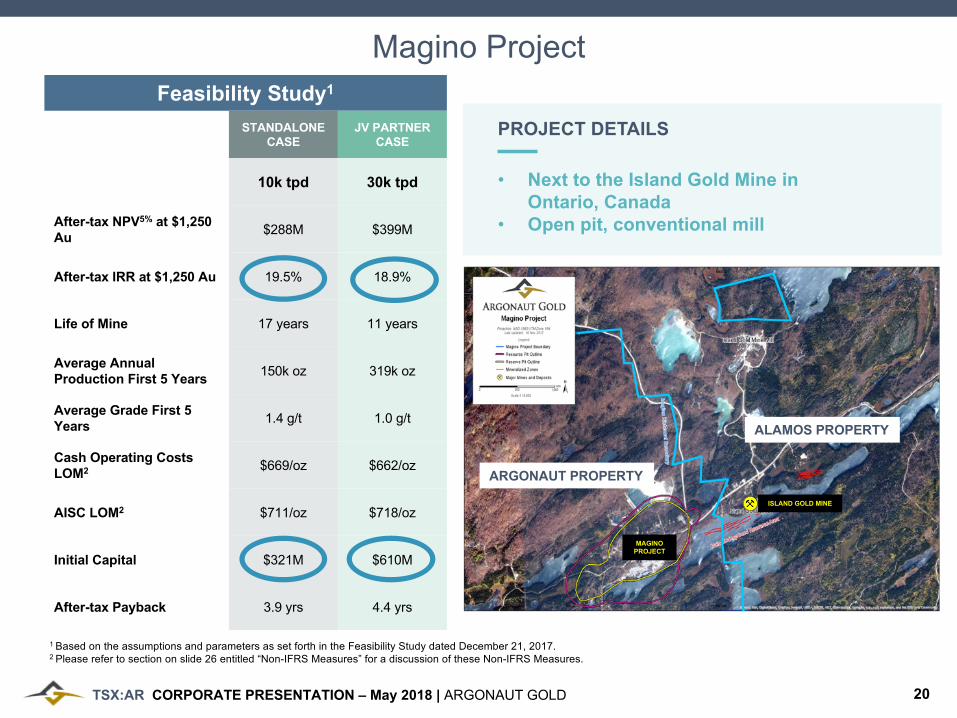
1 Based on the assumptions and parameters as set forth in the Feasibility Study dated December 21, 2017. 2 Please refer to section on slide 26 entitled “Non-IFRS Measures” for a discussion of these Non-IFRS Measures.
Magino Project
PROJECT DETAILS
• Next to the Island Gold Mine inOntario, Canada
• Open pit, conventional mill
Feasibility Study1
STANDALONE CASE
JV PARTNER CASE
10k tpd 30k tpd
After-tax NPV5% at $1,250 Au $288M $399M
After-tax IRR at $1,250 Au 19.5% 18.9%
Life of Mine 17 years 11 years
Average AnnualProduction First 5 Years 150k oz 319k oz
Average Grade First 5 Years 1.4 g/t 1.0 g/t
Cash Operating Costs LOM2 $669/oz $662/oz
AISC LOM2 $711/oz $718/oz
Initial Capital $321M $610M
After-tax Payback 3.9 yrs 4.4 yrs
ARGONAUT PROPERTY
ALAMOS PROPERTY
ISLAND GOLD MINE
MAGINOPROJECT
21TSX:AR CORPORATE PRESENTATION – May 2018 | ARGONAUT GOLD
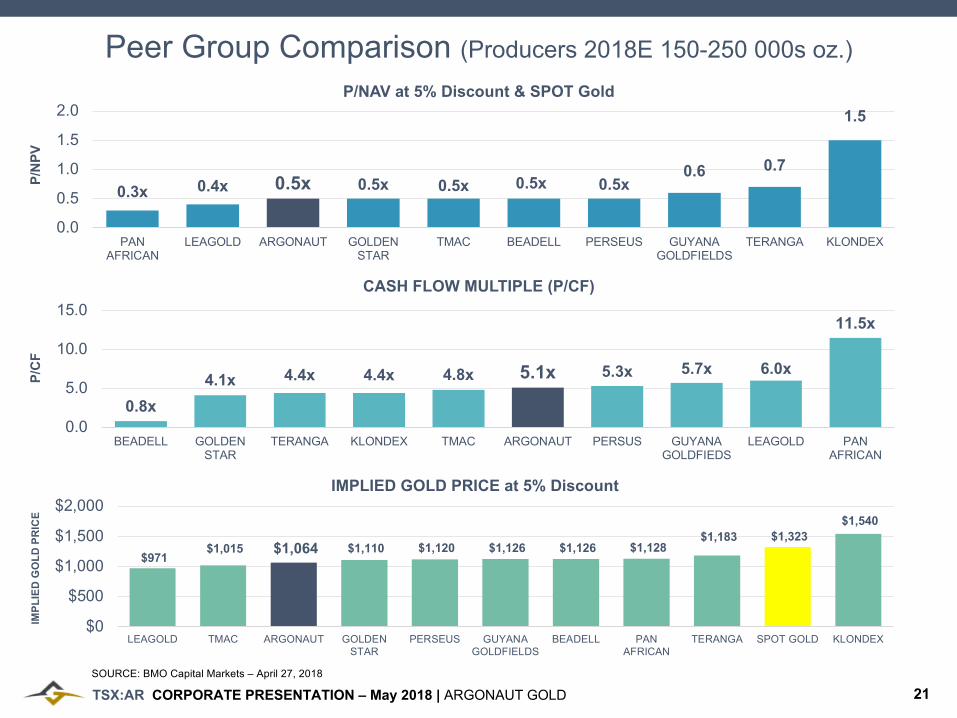
Peer Group Comparison (Producers 2018E 150-250 000s oz.)
0.3x 0.4x 0.5x 0.5x 0.5x 0.5x 0.5x0.6 0.7
1.5
0.0
0.5
1.0
1.5
2.0
PANAFRICAN
LEAGOLD ARGONAUT GOLDENSTAR
TMAC BEADELL PERSEUS GUYANAGOLDFIELDS
TERANGA KLONDEX
P/NAV at 5% Discount & SPOT Gold
P/N
PV
0.8x
4.1x 4.4x 4.4x 4.8x 5.1x 5.3x 5.7x 6.0x
11.5x
0.0
5.0
10.0
15.0
BEADELL GOLDENSTAR
TERANGA KLONDEX TMAC ARGONAUT PERSUS GUYANAGOLDFIEDS
LEAGOLD PANAFRICAN
CASH FLOW MULTIPLE (P/CF)
P/C
F
$971 $1,015 $1,064 $1,110 $1,120 $1,126 $1,126 $1,128
$1,183 $1,323 $1,540
$0
$500
$1,000
$1,500
$2,000
LEAGOLD TMAC ARGONAUT GOLDENSTAR
PERSEUS GUYANAGOLDFIELDS
BEADELL PANAFRICAN
TERANGA SPOT GOLD KLONDEX
IMPLIED GOLD PRICE at 5% Discount
IMP
LIE
D G
OLD
PR
ICE
SOURCE: BMO Capital Markets – April 27, 2018
22TSX:AR CORPORATE PRESENTATION – May 2018 | ARGONAUT GOLD
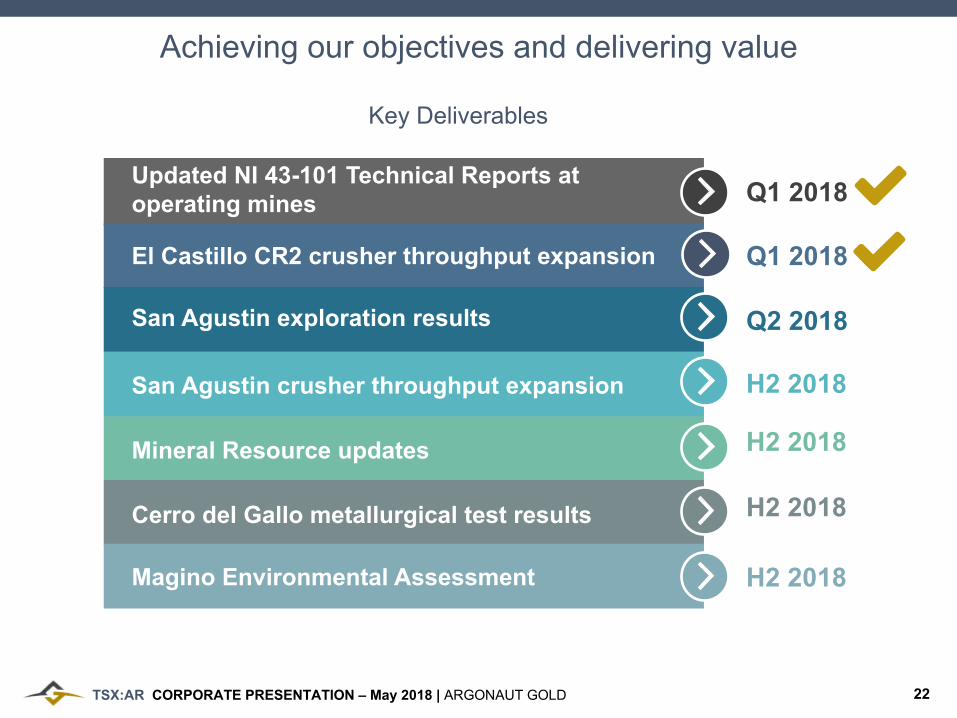
Achieving our objectives and delivering value
Updated NI 43-101 Technical Reports at operating mines
Mineral Resource updates
San Agustin crusher throughput expansion
H2 2018
El Castillo CR2 crusher throughput expansion
San Agustin exploration results
Key Deliverables
Magino Environmental Assessment
Cerro del Gallo metallurgical test results
Q1 2018
Q1 2018
Q2 2018
H2 2018
H2 2018
H2 2018
23TSX:AR CORPORATE PRESENTATION – May 2018 | ARGONAUT GOLD
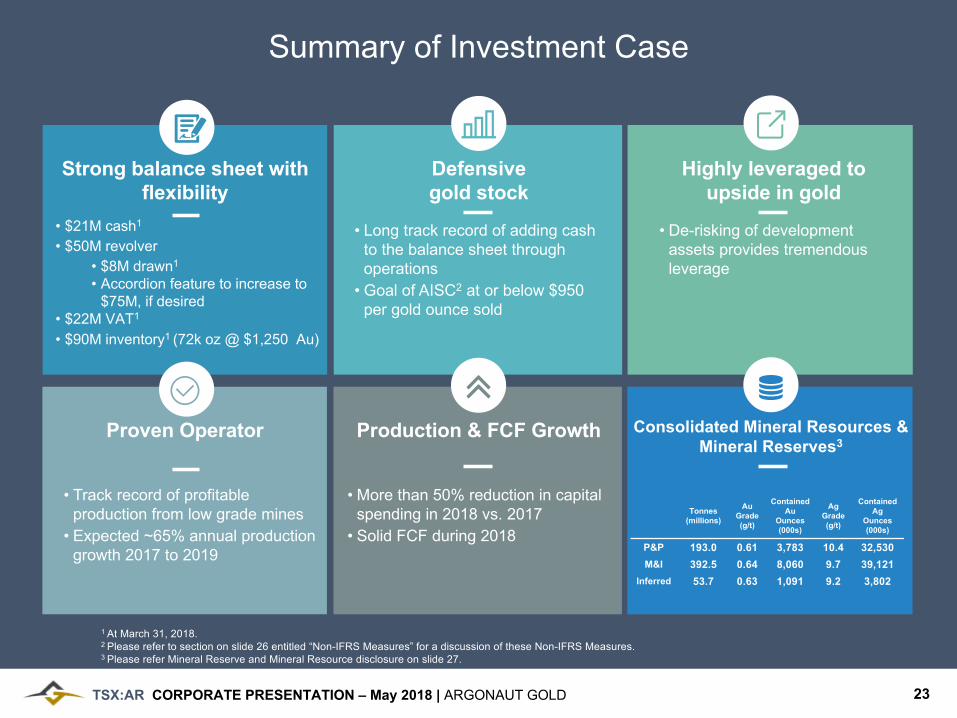
Summary of Investment Case
Defensivegold stock
• Long track record of adding cash to the balance sheet through operations
• Goal of AISC2 at or below $950 per gold ounce sold
Highly leveraged to upside in gold
• De-risking of development assets provides tremendous leverage
1 At March 31, 2018.2 Please refer to section on slide 26 entitled “Non-IFRS Measures” for a discussion of these Non-IFRS Measures.3 Please refer Mineral Reserve and Mineral Resource disclosure on slide 27.
Strong balance sheet with flexibility
• $21M cash1
• $50M revolver• $8M drawn1
• Accordion feature to increase to $75M, if desired
• $22M VAT1
• $90M inventory1 (72k oz @ $1,250 Au)
Production & FCF Growth Consolidated Mineral Resources & Mineral Reserves3
Proven Operator
• Track record of profitable production from low grade mines
• Expected ~65% annual production growth 2017 to 2019
• More than 50% reduction in capital spending in 2018 vs. 2017
• Solid FCF during 2018
Tonnes(millions)
AuGrade(g/t)
ContainedAu
Ounces(000s)
AgGrade(g/t)
Contained Ag
Ounces(000s)
P&P 193.0 0.61 3,783 10.4 32,530
M&I 392.5 0.64 8,060 9.7 39,121Inferred 53.7 0.63 1,091 9.2 3,802
24TSX:AR CORPORATE PRESENTATION – May 2018 | ARGONAUT GOLD
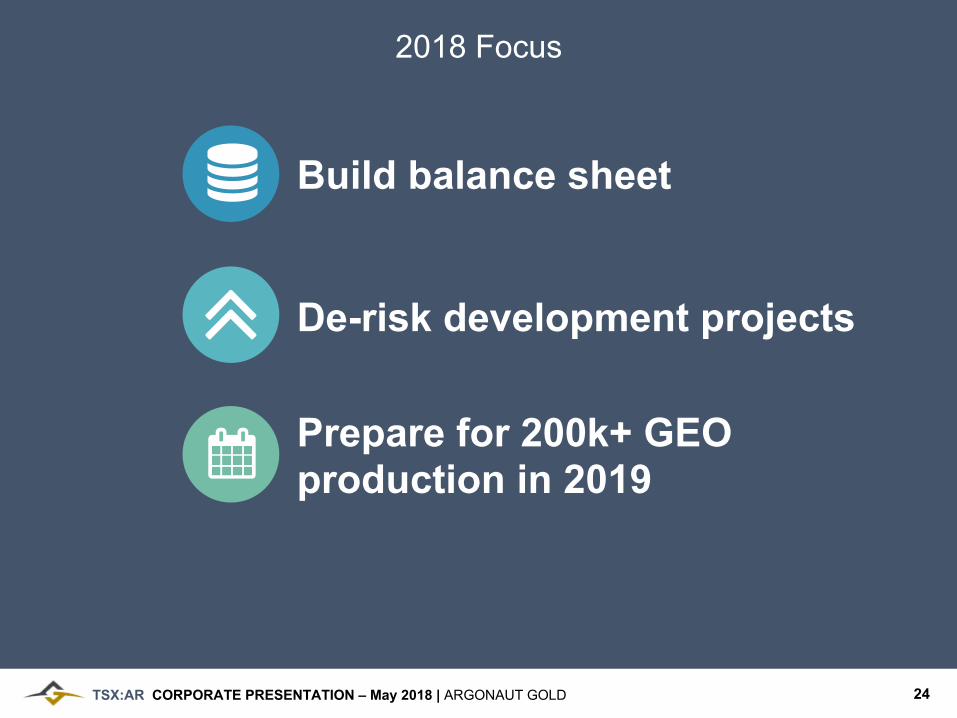
2018 Focus
Build balance sheet
De-risk development projects
Prepare for 200k+ GEO production in 2019
25TSX:AR CORPORATE PRESENTATION – May 2018 | ARGONAUT GOLD
Dan Symons
Vice President, Investor Relations
Argonaut Gold Inc.First Canadian Place 100 King St. West, Suite 5700 Toronto, ON M5X 1C7T: 416-915-3107Email: [email protected]
WWW.ARGONAUTGOLD.COM
ADDITIONAL INFORMATION
26TSX:AR CORPORATE PRESENTATION – May 2018 | ARGONAUT GOLD
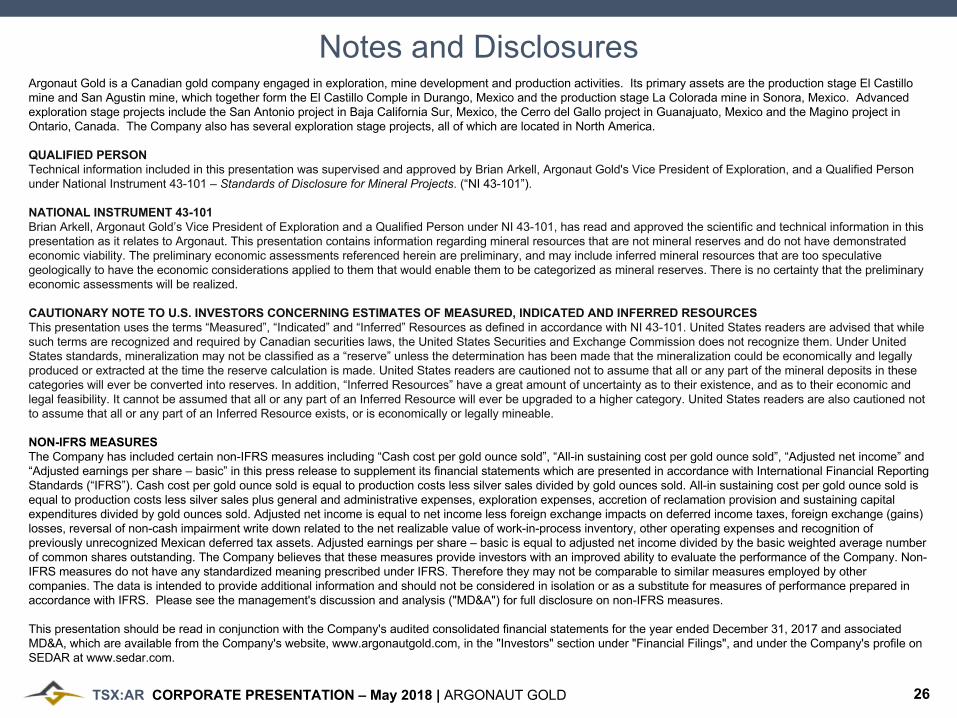
Argonaut Gold is a Canadian gold company engaged in exploration, mine development and production activities. Its primary assets are the production stage El Castillo mine and San Agustin mine, which together form the El Castillo Comple in Durango, Mexico and the production stage La Colorada mine in Sonora, Mexico. Advanced exploration stage projects include the San Antonio project in Baja California Sur, Mexico, the Cerro del Gallo project in Guanajuato, Mexico and the Magino project in Ontario, Canada. The Company also has several exploration stage projects, all of which are located in North America.
QUALIFIED PERSONTechnical information included in this presentation was supervised and approved by Brian Arkell, Argonaut Gold's Vice President of Exploration, and a Qualified Person under National Instrument 43-101 – Standards of Disclosure for Mineral Projects. (“NI 43-101”).
NATIONAL INSTRUMENT 43-101Brian Arkell, Argonaut Gold’s Vice President of Exploration and a Qualified Person under NI 43-101, has read and approved the scientific and technical information in this presentation as it relates to Argonaut. This presentation contains information regarding mineral resources that are not mineral reserves and do not have demonstrated economic viability. The preliminary economic assessments referenced herein are preliminary, and may include inferred mineral resources that are too speculative geologically to have the economic considerations applied to them that would enable them to be categorized as mineral reserves. There is no certainty that the preliminary economic assessments will be realized.
CAUTIONARY NOTE TO U.S. INVESTORS CONCERNING ESTIMATES OF MEASURED, INDICATED AND INFERRED RESOURCESThis presentation uses the terms “Measured”, “Indicated” and “Inferred” Resources as defined in accordance with NI 43-101. United States readers are advised that while such terms are recognized and required by Canadian securities laws, the United States Securities and Exchange Commission does not recognize them. Under United States standards, mineralization may not be classified as a “reserve” unless the determination has been made that the mineralization could be economically and legally produced or extracted at the time the reserve calculation is made. United States readers are cautioned not to assume that all or any part of the mineral deposits in these categories will ever be converted into reserves. In addition, “Inferred Resources” have a great amount of uncertainty as to their existence, and as to their economic and legal feasibility. It cannot be assumed that all or any part of an Inferred Resource will ever be upgraded to a higher category. United States readers are also cautioned not to assume that all or any part of an Inferred Resource exists, or is economically or legally mineable.
NON-IFRS MEASURESThe Company has included certain non-IFRS measures including “Cash cost per gold ounce sold”, “All-in sustaining cost per gold ounce sold”, “Adjusted net income” and “Adjusted earnings per share – basic” in this press release to supplement its financial statements which are presented in accordance with International Financial Reporting Standards (“IFRS”). Cash cost per gold ounce sold is equal to production costs less silver sales divided by gold ounces sold. All-in sustaining cost per gold ounce sold is equal to production costs less silver sales plus general and administrative expenses, exploration expenses, accretion of reclamation provision and sustaining capital expenditures divided by gold ounces sold. Adjusted net income is equal to net income less foreign exchange impacts on deferred income taxes, foreign exchange (gains) losses, reversal of non-cash impairment write down related to the net realizable value of work-in-process inventory, other operating expenses and recognition of previously unrecognized Mexican deferred tax assets. Adjusted earnings per share – basic is equal to adjusted net income divided by the basic weighted average number of common shares outstanding. The Company believes that these measures provide investors with an improved ability to evaluate the performance of the Company. Non-IFRS measures do not have any standardized meaning prescribed under IFRS. Therefore they may not be comparable to similar measures employed by other companies. The data is intended to provide additional information and should not be considered in isolation or as a substitute for measures of performance prepared in accordance with IFRS. Please see the management's discussion and analysis ("MD&A") for full disclosure on non-IFRS measures.
This presentation should be read in conjunction with the Company's audited consolidated financial statements for the year ended December 31, 2017 and associated MD&A, which are available from the Company's website, www.argonautgold.com, in the "Investors" section under "Financial Filings", and under the Company's profile on SEDAR at www.sedar.com.
Notes and Disclosures
27TSX:AR CORPORATE PRESENTATION – May 2018 | ARGONAUT GOLD
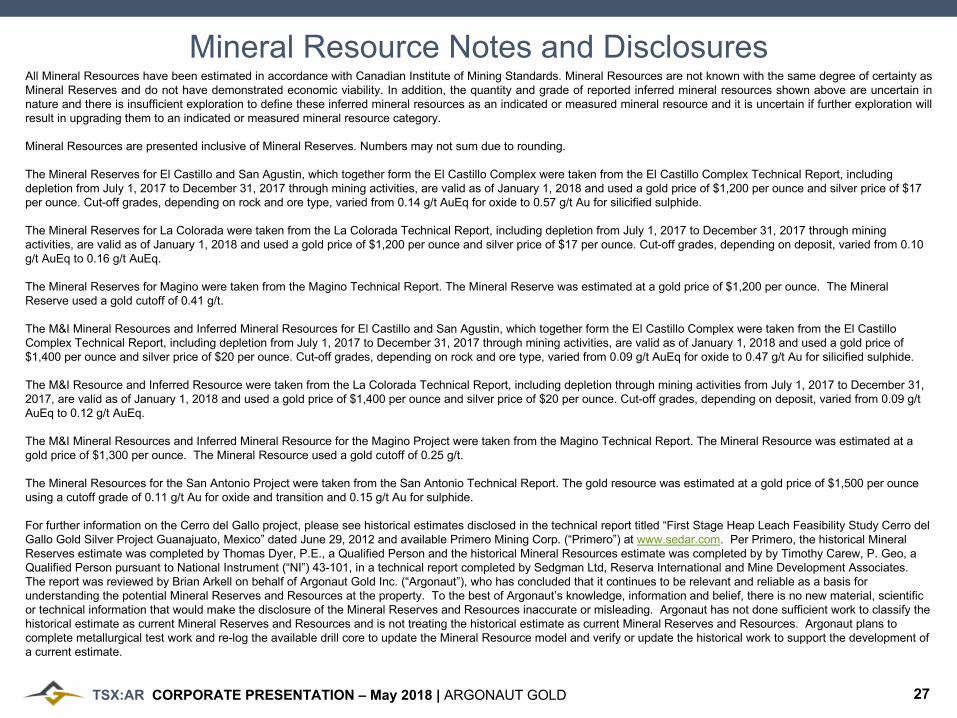
All Mineral Resources have been estimated in accordance with Canadian Institute of Mining Standards. Mineral Resources are not known with the same degree of certainty asMineral Reserves and do not have demonstrated economic viability. In addition, the quantity and grade of reported inferred mineral resources shown above are uncertain innature and there is insufficient exploration to define these inferred mineral resources as an indicated or measured mineral resource and it is uncertain if further exploration willresult in upgrading them to an indicated or measured mineral resource category.
Mineral Resources are presented inclusive of Mineral Reserves. Numbers may not sum due to rounding.
The Mineral Reserves for El Castillo and San Agustin, which together form the El Castillo Complex were taken from the El Castillo Complex Technical Report, including depletion from July 1, 2017 to December 31, 2017 through mining activities, are valid as of January 1, 2018 and used a gold price of $1,200 per ounce and silver price of $17 per ounce. Cut-off grades, depending on rock and ore type, varied from 0.14 g/t AuEq for oxide to 0.57 g/t Au for silicified sulphide.
The Mineral Reserves for La Colorada were taken from the La Colorada Technical Report, including depletion from July 1, 2017 to December 31, 2017 through mining activities, are valid as of January 1, 2018 and used a gold price of $1,200 per ounce and silver price of $17 per ounce. Cut-off grades, depending on deposit, varied from 0.10 g/t AuEq to 0.16 g/t AuEq.
The Mineral Reserves for Magino were taken from the Magino Technical Report. The Mineral Reserve was estimated at a gold price of $1,200 per ounce. The Mineral Reserve used a gold cutoff of 0.41 g/t.
The M&I Mineral Resources and Inferred Mineral Resources for El Castillo and San Agustin, which together form the El Castillo Complex were taken from the El Castillo Complex Technical Report, including depletion from July 1, 2017 to December 31, 2017 through mining activities, are valid as of January 1, 2018 and used a gold price of $1,400 per ounce and silver price of $20 per ounce. Cut-off grades, depending on rock and ore type, varied from 0.09 g/t AuEq for oxide to 0.47 g/t Au for silicified sulphide.
The M&I Resource and Inferred Resource were taken from the La Colorada Technical Report, including depletion through mining activities from July 1, 2017 to December 31, 2017, are valid as of January 1, 2018 and used a gold price of $1,400 per ounce and silver price of $20 per ounce. Cut-off grades, depending on deposit, varied from 0.09 g/t AuEq to 0.12 g/t AuEq.
The M&I Mineral Resources and Inferred Mineral Resource for the Magino Project were taken from the Magino Technical Report. The Mineral Resource was estimated at a gold price of $1,300 per ounce. The Mineral Resource used a gold cutoff of 0.25 g/t.
The Mineral Resources for the San Antonio Project were taken from the San Antonio Technical Report. The gold resource was estimated at a gold price of $1,500 per ounce using a cutoff grade of 0.11 g/t Au for oxide and transition and 0.15 g/t Au for sulphide.
For further information on the Cerro del Gallo project, please see historical estimates disclosed in the technical report titled “First Stage Heap Leach Feasibility Study Cerro del Gallo Gold Silver Project Guanajuato, Mexico” dated June 29, 2012 and available Primero Mining Corp. (“Primero”) at www.sedar.com. Per Primero, the historical Mineral Reserves estimate was completed by Thomas Dyer, P.E., a Qualified Person and the historical Mineral Resources estimate was completed by by Timothy Carew, P. Geo, a Qualified Person pursuant to National Instrument (“NI”) 43-101, in a technical report completed by Sedgman Ltd, Reserva International and Mine Development Associates. The report was reviewed by Brian Arkell on behalf of Argonaut Gold Inc. (“Argonaut”), who has concluded that it continues to be relevant and reliable as a basis for understanding the potential Mineral Reserves and Resources at the property. To the best of Argonaut’s knowledge, information and belief, there is no new material, scientific or technical information that would make the disclosure of the Mineral Reserves and Resources inaccurate or misleading. Argonaut has not done sufficient work to classify the historical estimate as current Mineral Reserves and Resources and is not treating the historical estimate as current Mineral Reserves and Resources. Argonaut plans to complete metallurgical test work and re-log the available drill core to update the Mineral Resource model and verify or update the historical work to support the development of a current estimate.
Mineral Resource Notes and Disclosures
28TSX:AR CORPORATE PRESENTATION – May 2018 | ARGONAUT GOLD
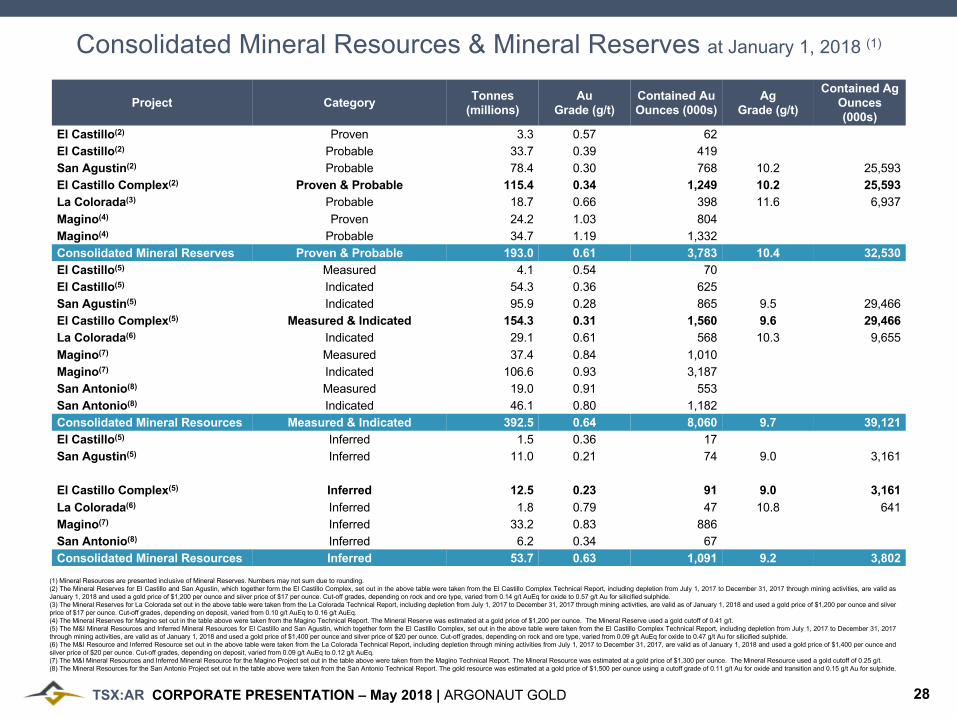
Consolidated Mineral Resources & Mineral Reserves at January 1, 2018 (1)
Project CategoryTonnes
(millions)
Au
Grade (g/t)
Contained Au
Ounces (000s)
Ag
Grade (g/t)
Contained Ag
Ounces
(000s)
El Castillo(2) Proven 3.3 0.57 62El Castillo(2) Probable 33.7 0.39 419San Agustin(2) Probable 78.4 0.30 768 10.2 25,593El Castillo Complex(2) Proven & Probable 115.4 0.34 1,249 10.2 25,593
La Colorada(3) Probable 18.7 0.66 398 11.6 6,937Magino(4) Proven 24.2 1.03 804Magino(4) Probable 34.7 1.19 1,332Consolidated Mineral Reserves Proven & Probable 193.0 0.61 3,783 10.4 32,530
El Castillo(5) Measured 4.1 0.54 70El Castillo(5) Indicated 54.3 0.36 625San Agustin(5) Indicated 95.9 0.28 865 9.5 29,466El Castillo Complex(5) Measured & Indicated 154.3 0.31 1,560 9.6 29,466
La Colorada(6) Indicated 29.1 0.61 568 10.3 9,655Magino(7) Measured 37.4 0.84 1,010Magino(7) Indicated 106.6 0.93 3,187San Antonio(8) Measured 19.0 0.91 553San Antonio(8) Indicated 46.1 0.80 1,182Consolidated Mineral Resources Measured & Indicated 392.5 0.64 8,060 9.7 39,121
El Castillo(5) Inferred 1.5 0.36 17San Agustin(5) Inferred 11.0 0.21 74 9.0 3,161
El Castillo Complex(5) Inferred 12.5 0.23 91 9.0 3,161
La Colorada(6) Inferred 1.8 0.79 47 10.8 641Magino(7) Inferred 33.2 0.83 886San Antonio(8) Inferred 6.2 0.34 67Consolidated Mineral Resources Inferred 53.7 0.63 1,091 9.2 3,802
(1) Mineral Resources are presented inclusive of Mineral Reserves. Numbers may not sum due to rounding.(2) The Mineral Reserves for El Castillo and San Agustin, which together form the El Castillo Complex, set out in the above table were taken from the El Castillo Complex Technical Report, including depletion from July 1, 2017 to December 31, 2017 through mining activities, are valid asJanuary 1, 2018 and used a gold price of $1,200 per ounce and silver price of $17 per ounce. Cut-off grades, depending on rock and ore type, varied from 0.14 g/t AuEq for oxide to 0.57 g/t Au for silicified sulphide.(3) The Mineral Reserves for La Colorada set out in the above table were taken from the La Colorada Technical Report, including depletion from July 1, 2017 to December 31, 2017 through mining activities, are valid as of January 1, 2018 and used a gold price of $1,200 per ounce and silverprice of $17 per ounce. Cut-off grades, depending on deposit, varied from 0.10 g/t AuEq to 0.16 g/t AuEq.(4) The Mineral Reserves for Magino set out in the table above were taken from the Magino Technical Report. The Mineral Reserve was estimated at a gold price of $1,200 per ounce. The Mineral Reserve used a gold cutoff of 0.41 g/t.(5) The M&I Mineral Resources and Inferred Mineral Resources for El Castillo and San Agustin, which together form the El Castillo Complex, set out in the above table were taken from the El Castillo Complex Technical Report, including depletion from July 1, 2017 to December 31, 2017through mining activities, are valid as of January 1, 2018 and used a gold price of $1,400 per ounce and silver price of $20 per ounce. Cut-off grades, depending on rock and ore type, varied from 0.09 g/t AuEq for oxide to 0.47 g/t Au for silicified sulphide.(6) The M&I Resource and Inferred Resource set out in the above table were taken from the La Colorada Technical Report, including depletion through mining activities from July 1, 2017 to December 31, 2017, are valid as of January 1, 2018 and used a gold price of $1,400 per ounce andsilver price of $20 per ounce. Cut-off grades, depending on deposit, varied from 0.09 g/t AuEq to 0.12 g/t AuEq.(7) The M&I Mineral Resources and Inferred Mineral Resource for the Magino Project set out in the table above were taken from the Magino Technical Report. The Mineral Resource was estimated at a gold price of $1,300 per ounce. The Mineral Resource used a gold cutoff of 0.25 g/t.(8) The Mineral Resources for the San Antonio Project set out in the table above were taken from the San Antonio Technical Report. The gold resource was estimated at a gold price of $1,500 per ounce using a cutoff grade of 0.11 g/t Au for oxide and transition and 0.15 g/t Au for sulphide.

29TSX:AR CORPORATE PRESENTATION – May 2018 | ARGONAUT GOLD
Strong Board, Management & Technical
ExperiencedBoard of Directors
StrongManagement & Technical Team
Peter C. Dougherty, President & CEOWork experience at Meridian Gold, FMC
William Zisch, COOWork experience at Midway Gold, Royal Gold, Newmont, FMC
David A. Ponczoch, CFOWork experience at Twin Metals Minnesota, Yamana Gold, Meridian Gold
W. Robert Rose, Vice President of Technical ServicesWork experience at Andina Minerals, Kappes, Cassiday & Associates
Daniel A. Symons, Vice President, Investor RelationsWork experience at Romarco Minerals, Renmark Financial
Brian Arkell, Vice President, ExplorationWork experience at Caza Gold Corp., Rio Novo Gold Inc. and Newmont Mining Co.
James E. Kofman, ChairmanVice Chairman, Cormark SecuritiesWork experience at UBS Securities, Osler, Hoskin & Harcourt
Peter C. DoughertyWork experience at Meridian Gold, FMC
Ian Atkinson Director of Kinross Gold and Globex MiningWork experience at Centerra, Hecla, Battle Mountain, Hemlo, Noranda
Christopher R. LattanziDirector of Teranga Gold, Spanish Mountain GoldWork experience at Micon
Peter MourdauntDirector at Ethos GoldWork experience at Stingray Copper, Corner Bay Silver
Dale PeniukDirector of Lundin Mining, Capstone MiningWork experience at KPMG
Audra B. WalshCEO of Minas de Aguas Tenidas, President & SEO of A2Z Mining, Director of Orvana MineralsWork experience at Sierra Metals, Minera, Barrick, Newmont
30TSX:AR CORPORATE PRESENTATION – May 2018 | ARGONAUT GOLD
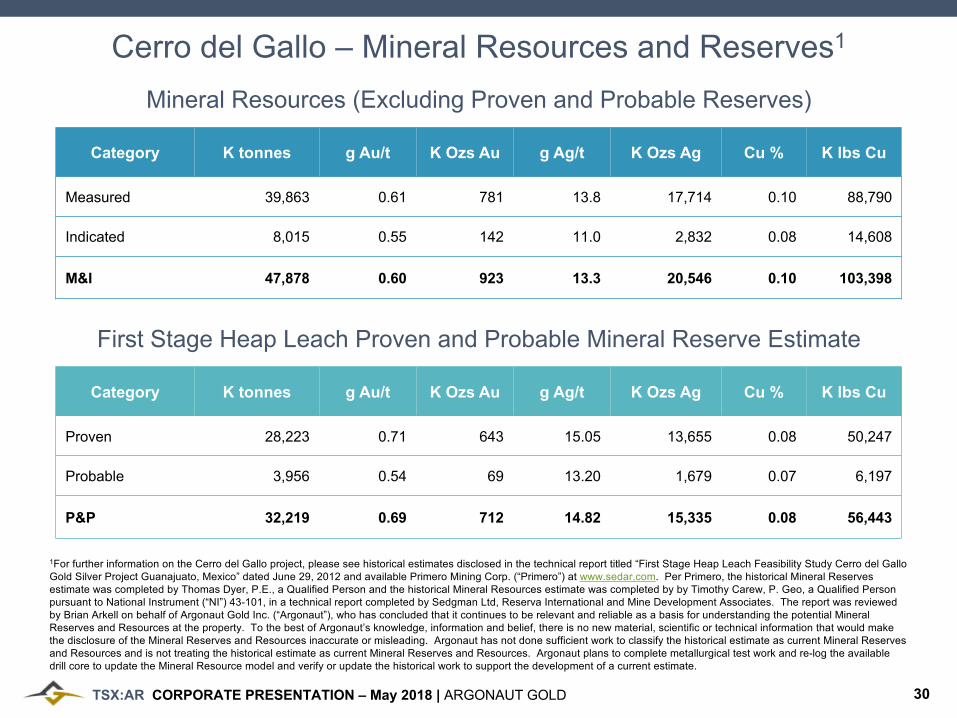
1For further information on the Cerro del Gallo project, please see historical estimates disclosed in the technical report titled “First Stage Heap Leach Feasibility Study Cerro del Gallo
Gold Silver Project Guanajuato, Mexico” dated June 29, 2012 and available Primero Mining Corp. (“Primero”) at www.sedar.com. Per Primero, the historical Mineral Reserves
estimate was completed by Thomas Dyer, P.E., a Qualified Person and the historical Mineral Resources estimate was completed by by Timothy Carew, P. Geo, a Qualified Person
pursuant to National Instrument (“NI”) 43-101, in a technical report completed by Sedgman Ltd, Reserva International and Mine Development Associates. The report was reviewed
by Brian Arkell on behalf of Argonaut Gold Inc. (“Argonaut”), who has concluded that it continues to be relevant and reliable as a basis for understanding the potential Mineral
Reserves and Resources at the property. To the best of Argonaut’s knowledge, information and belief, there is no new material, scientific or technical information that would make
the disclosure of the Mineral Reserves and Resources inaccurate or misleading. Argonaut has not done sufficient work to classify the historical estimate as current Mineral Reserves
and Resources and is not treating the historical estimate as current Mineral Reserves and Resources. Argonaut plans to complete metallurgical test work and re-log the available
drill core to update the Mineral Resource model and verify or update the historical work to support the development of a current estimate.
Cerro del Gallo – Mineral Resources and Reserves1
Category K tonnes g Au/t K Ozs Au g Ag/t K Ozs Ag Cu % K lbs Cu
Measured 39,863 0.61 781 13.8 17,714 0.10 88,790
Indicated 8,015 0.55 142 11.0 2,832 0.08 14,608
M&I 47,878 0.60 923 13.3 20,546 0.10 103,398
Category K tonnes g Au/t K Ozs Au g Ag/t K Ozs Ag Cu % K lbs Cu
Proven 28,223 0.71 643 15.05 13,655 0.08 50,247
Probable 3,956 0.54 69 13.20 1,679 0.07 6,197
P&P 32,219 0.69 712 14.82 15,335 0.08 56,443
Mineral Resources (Excluding Proven and Probable Reserves)
First Stage Heap Leach Proven and Probable Mineral Reserve Estimate

31TSX:AR CORPORATE PRESENTATION – May 2018 | ARGONAUT GOLD
Capitalization Summary
Exchange / Symbol TSX:AR
Share Price (1) C$2.47
Shares Outstanding (2) 177M
FD Shares Outstanding (2) 183M
Market Capitalization (1) C$437M
52 Week High / Low (1) C$2.92 / C$1.76
Cash Balance (2) ~US$21M
1 At April 30, 20182 At March 31, 2018