Embed Size (px)
Citation preview

Aquion Energy, Inc. DE-0000226 Final Report
1
Recipient: Aquion Energy, Inc. Award Number: DE-0000226 Title: “Recovery Act – Demonstration of Sodium Ion Battery for Grid Level Applications” Project Period: 07/30/2010 – 8/31/2012 Principal Investigator: Ted Wiley Team Members: Jay Whitacre, CTO; Eric Weber – Chief Systems Engineer; Michael Eshoo - Sr. Director, Systems Engineering and Program Management; James Noland – Senior Electrical Engineer; David Blackwood – Industrial Designer; William Campbell – Industrial Designer; Eric Sheen – Mechanical Engineer; Christopher Spears – Battery Test Engineer; Christopher Smith – Process Engineer

Aquion Energy, Inc. DE-0000226 Final Report
2
Table of Contents
Section 1 - Executive Summary ............................................................................................ 3
Section 2 - Project Goals Table ............................................................................................. 4
Section 3 - Project Narrative ................................................................................................. 4 Company description ........................................................................................................................ 4 Company History ................................................................................................................................ 5
Section 4 – Project Overview ................................................................................................ 8 Recipients and Sub-Recipients ...................................................................................................... 8 Project Objectives ............................................................................................................................... 9 System Design ...................................................................................................................................... 9 Milestones .......................................................................................................................................... 10 Applications and Functions ......................................................................................................... 11
Section 5 – Analysis and Methodologies ........................................................................ 11
Section 6 – Technology Performance Results .............................................................. 12
Section 7 – Major Findings and Conclusions ................................................................ 29
Section 8 – Future Plans and Risks .................................................................................. 30 8.1 – Future Plans ............................................................................................................................ 30
8.1.1 – Manufacturing Facility................................................................................................................ 30 8.1.2 – Possible Applications .................................................................................................................. 32 8.1.3 – Markets and Costs ........................................................................................................................ 33
8.2 – Risks ........................................................................................................................................... 34 8.2.1 – Potential Financial Risks ........................................................................................................... 34 8.2.3 – Technology/Manufacturing Risks ......................................................................................... 35 8.2.4 – Sales/Market/Industry Risks .................................................................................................. 36
Appendix 1 - Table of Figures ............................................................................................ 39
Appendix 2 - List of Abbreviations Used ....................................................................... 41
Aquion Energy, Inc. DE-0000226 Final Report
3
Section 1 - Executive Summary Aquion Energy received a $5.179 million cooperative research agreement under the Department of Energy’s Smart Grid Demonstration Program – Demonstration of Promising Energy Storage Technologies (Program Area 2.5) of FOA DE-FOE-0000036. The main objective of this project was to demonstrate Aquion’s low cost, grid-scale, ambient temperature sodium ion energy storage device. The centerpiece of the technology is a novel hybrid energy storage chemistry that has been proven in a laboratory environment. The objective was to translate these groundbreaking results from the small-batch, small-cell test environment to the pilot scale to enable significant numbers of multiple ampere-hour cells to be manufactured and assembled into test batteries. Aquion developed a proof of concept demonstration unit that showed similar performance and major cost improvement over existing technologies. Beyond minimizing cell and system cost, Aquion built a technology that is safe, environmentally benign and durable over many thousands of cycles as used in a variety of grid support roles. As outlined in the Program documents, the original goals of the project were to demonstrate a unit that:
1. Has a projected capital cost of less than $250/kWh at the pack level 2. A deep discharge cycle life of > 10,000 cycles 3. A volumetric energy density of >20 kWh/m3 4. Projected calendar life of over 10 years 5. A device that contains no hazardous materials and retains best in class safety
characteristics. Through the course of this project Aquion developed its aqueous electrolyte electrochemical energy storage device to the point where large demonstration units (> 10 kWh) were able to function in grid-supporting functions detailed by their collaborators. Aquion’s final deliverable was an ~15 kWh system that has the ability to perform medium to long duration (> 2 hours) charge and discharge functions approaching 95% DC-DC efficiency. The system has functioned, and continues to function as predicted with no indication that it will not tolerate well beyond 10 calendar years and 10,000 cycles. It has been in continuous operation for more than 1 year with 1,000 cycles (of varying depth of discharge, including 100% depth of discharge) and no identifiable degradation to the system. The final thick electrode cell structure has shown an energy density of 25 kWh/m3 at a five hour (or greater) discharge time. The primary chemistry has remained non-toxic, containing no acids or other corrosive chemicals, and the battery units have passed numerous safety tests, including flame resistance testing. These tests have verified the claim that the device is safe to use and contains no hazardous materials. Current projections show costs at the pack level to offer best in class value and are competitive with lead-acid batteries, factoring in LCOE.

Aquion Energy, Inc. DE-0000226 Final Report
4
Section 2 - Project Goals Table
Target Demonstrated
>5000 Cycle Life >5000 in prototype cells, 1200 Cycles in production style cells – testing ongoing
10 years projected calendar life No evidence to show <10 years – testing ongoing
<10% capacity degradation Demonstrated through a variety of tests
Low capital cost Competitive with PbA over lifetime
>10 kWh storage unit fabricated and demonstrated to be able to give/take from grid
Achieved – with a 16.5 kWh, >1000 V battery pack at Aquion Energy HQ
Section 3 - Project Narrative
Company description Aquion Energy (aquionenergy.com) is energy storage start-up company located in Pittsburgh, PA. Our product offering consists of energy storage installations that are
Aquion Energy, Inc. DE-0000226 Final Report
5
made of batteries that have a novel water electrolyte sodium-ion functional chemistry. We were spun out of Carnegie Mellon University (CMU) in 2010 and have been working to prove out a pilot manufacturing line that is currently functional. Our products consist of large-scale battery packs or modules that are made of many smaller battery units (each of which are ~100 Wh in energy). These units can be connected electronically in series and parallel to meet the various needs of any stationary application.
Company History
Origins: In 2007 Dr. Jay Whitacre used R&D funding from Carnegie Mellon University to start a project aimed at discovering novel ultra low cost electrochemical couples for the stationary electricity storage application. Dr. Whitacre observed that most advanced electrochemical storage systems target mobile applications, where size and weight are key value drivers. He surmised that for stationary applications, lower energy density is acceptable if the total cost of implementation is disruptively low and the usable device lifetime is extremely long. In the spring of 2008, Dr. Whitacre had promising results that led him to write a patent application and contact David Wells of Kleiner Perkins Caufield and Byers, who had cultivated an ongoing dialog with Dr. Whitacre. Wells, Whitacre, and KPCB senior partner Bill Joy (Co-Founder of Sun Microsystems) subsequently worked to found a venture called 44 Tech Inc, which licensed from CMU exclusive rights to the core invention. Fundamental R&D work then continued as an incubation at CMU under a sponsored research agreement.
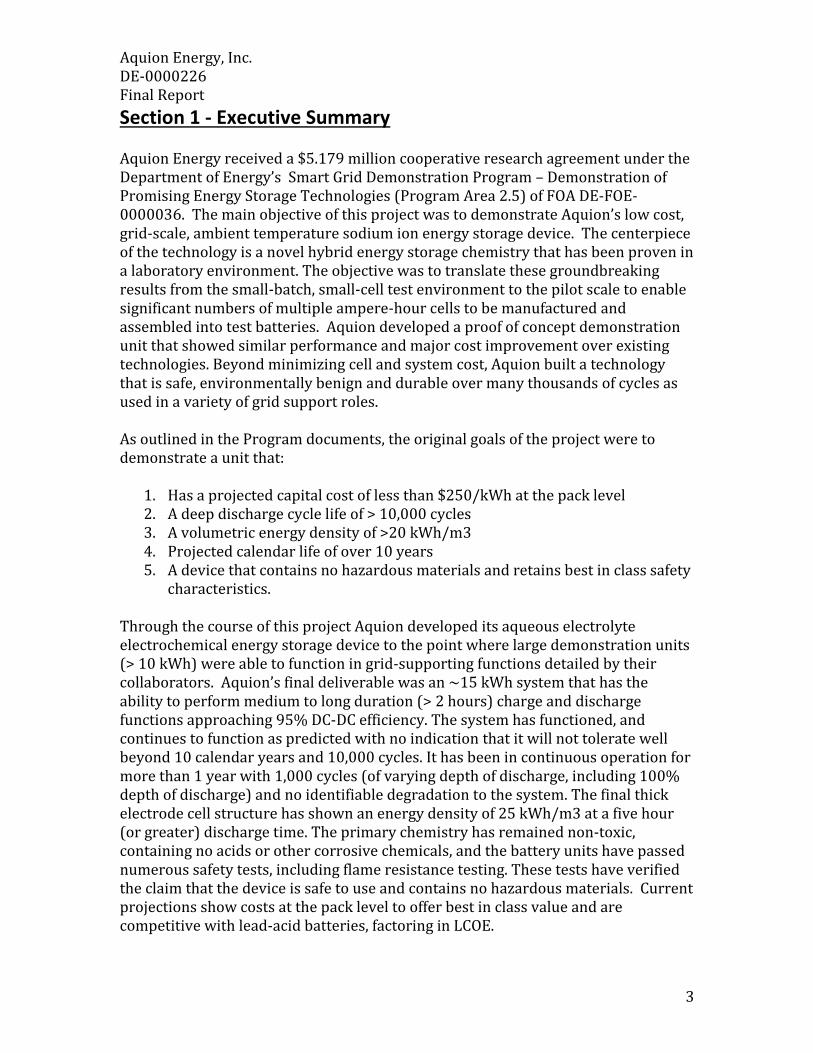
Moving Out of the Lab: In the spring of 2009, Dr. Whitacre’s lab results had demonstrated commercial potential. 44 Tech hired its first employees, and brought on board an interim CEO. In the fall of 2009, 44 Tech raised a round of venture funding and was awardeda $5M Department of Energy cooperative research agreement (from the American Recovery and Reinvestment Act -funded Energy Storage Demonstration Program). In January 2010, the company was renamed Aquion Energy, moved into its R&D headquarters in Pittsburgh, and began building a team to commercialize the technology. Initially this space consisted of an approximately 5,000 sq. ft. building containing offices and early laboratory space. The Department of Energy Award was instrumental in the early and continued success of Aquion. The Award allowed Aquion to hire early key hires in Engineering and Manufacturing, as well as managerial roles. Aquion’s early team was extremely cross-functional, with every staff member and employee participating in the generation of materials, the pressing of anode and cathode pellets, and the generation of the earliest coin cell batteries as in Figure 1.
Aquion Energy, Inc. DE-0000226 Final Report
6
Figure 1- Earliest Aquion Battery, A Small Coin Cell
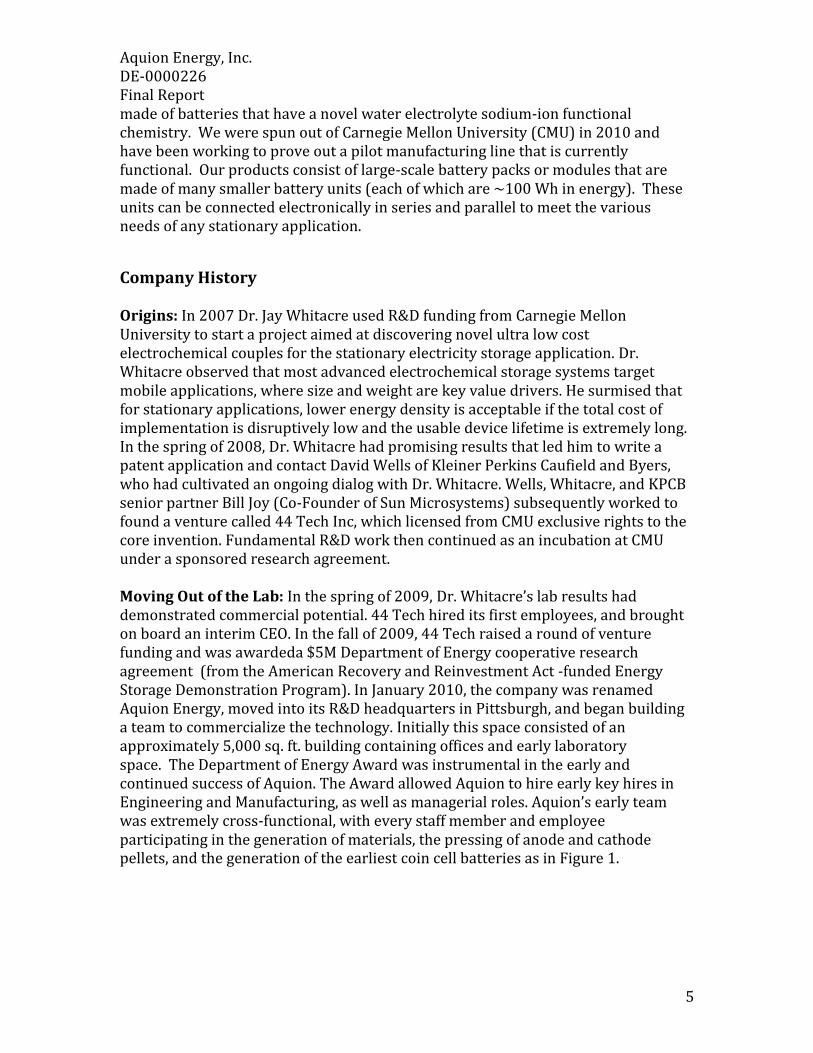
Early Pilot Production In early 2010, Aquion began leasing a large unoccupied warehouse space located immediately adjacent to the Aquion offices. It was decided that this facility would house the early Pilot line, related manufacturing and materials processing equipment, and the final deliverable battery system for the Department of Energy project. Having suffered a fire prior to Aquion taking over the lease, the building required some general repair as well as the installation of significant fire safety equipment, which took of most of the first half of 2010. The pilot line build up began in earnest in late 2010 and early 2011. Modular office space was built in the facility to house the engineering and technology operations team, as well as the manufacturing team. These were are also two of the earliest teams to get built up, in order to begin the quick scale up of both materials processing and assembly lines required for the DOE project. During this time period the construction of coin cells and some larger format batteries continued in the older lab space. Research also showed during this period that thicker format cells performed vastly superior to the thin format electrodes which had been in use previously. This led the engineering team to begin assessing the requirements for casing for the DOE deliverable. Settling on a design approximately the size of a breadbox and dubbed Battery 0, a waffle patterned, stackable, modular, polypropylene case was chosen as an early, inexpensive method to appropriately house the battery.
Figure 2 - Battery 0 Case
Pilot Line Operation After settling on the case design, attention returned to the internal components of the batteries. After hiring additional team members for the Supply Chain
Aquion Energy, Inc. DE-0000226 Final Report
7
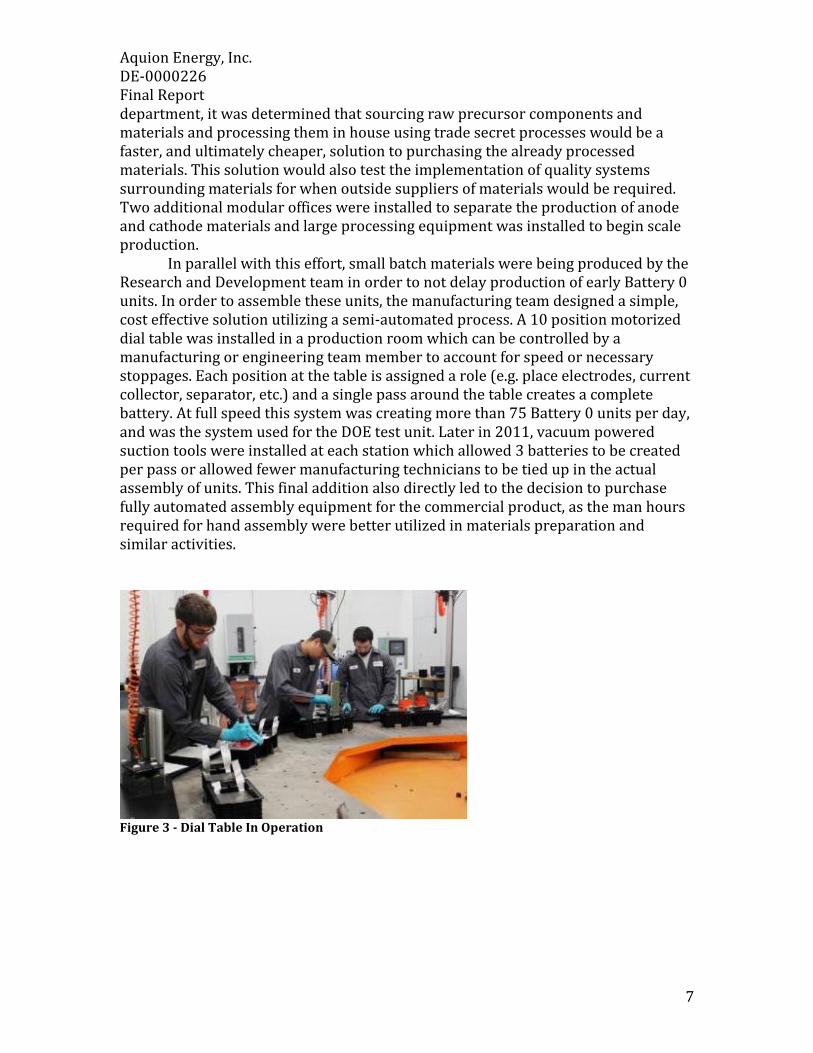
department, it was determined that sourcing raw precursor components and materials and processing them in house using trade secret processes would be a faster, and ultimately cheaper, solution to purchasing the already processed materials. This solution would also test the implementation of quality systems surrounding materials for when outside suppliers of materials would be required. Two additional modular offices were installed to separate the production of anode and cathode materials and large processing equipment was installed to begin scale production. In parallel with this effort, small batch materials were being produced by the Research and Development team in order to not delay production of early Battery 0 units. In order to assemble these units, the manufacturing team designed a simple, cost effective solution utilizing a semi-automated process. A 10 position motorized dial table was installed in a production room which can be controlled by a manufacturing or engineering team member to account for speed or necessary stoppages. Each position at the table is assigned a role (e.g. place electrodes, current collector, separator, etc.) and a single pass around the table creates a complete battery. At full speed this system was creating more than 75 Battery 0 units per day, and was the system used for the DOE test unit. Later in 2011, vacuum powered suction tools were installed at each station which allowed 3 batteries to be created per pass or allowed fewer manufacturing technicians to be tied up in the actual assembly of units. This final addition also directly led to the decision to purchase fully automated assembly equipment for the commercial product, as the man hours required for hand assembly were better utilized in materials preparation and similar activities.
Figure 3 - Dial Table In Operation

Aquion Energy, Inc. DE-0000226 Final Report
8
Figure 4 - Final Pilot Line Configuration In Operation
DOE Test System The final deliverable system for the DOE award was assembled in late 2011 and testing began shortly thereafter. This system consists of 270 Battery 0 units connected in series, with a footprint of 45 x 58 x 60 (LxWxH) and weighing approximately 2800 lbs. It should be noted that a significant portion of this weight and footprint is a temporary racking system that allows for varying pressure to be placed on the batteries to test for gassing and a conductivity issues. The system has been in continuous operation since early 2012, and continues in operation to this day with no performance degradation in the chemistry.
Figure 5 - DOE Test System at Aquion Headquarters
Section 4 – Project Overview
Recipients and Sub-Recipients Prime Recipient: Aquion Energy, Inc. Role: Advanced battery manufacturer developing sodium ion battery technology for use in both grid-tied and off-grid applications.

Aquion Energy, Inc. DE-0000226 Final Report
9
Sub-Recipient: Carnegie Mellon University
Role: Carnegie Mellon University is where the fundamental technology was developed by Aquion founder Professor Jay Whitacre. On this project, CMU provided support services including laboratory space, equipment, and graduate student assistance. CMU’s role in the project was focused on understanding the materials science and electrochemistry of the technology with the main goal of optimizing the current materials system. The CMU team focused on understanding and exploiting materials properties to create efficient, long life, low cost energy storage and generation technologies such as:
Alkali-ion intercalation and alloy materials
High surface area/nano-structured materials Catalyst/membrane materials and structures for fuel cells (PEM systems)
Solid State Ion conductors for batteries and photoelectrochemical cells The group also studied the economic and policy implications involved with:
Scaled energy storage for grid applications
Distributed energy generation and storage technologies
The development and entrepreneurship processes used to bring new technologies to Market
Project Objectives The main objective of this project was to demonstrate Aquion’s low cost, grid-scale, ambient temperature sodium ion energy storage device. The centerpiece of the technology is a novel hybrid energy storage chemistry that has been proven in a laboratory environment. The objective was to translate these groundbreaking results from the small-batch, small-cell test environment to the pilot scale to enable significant numbers of multiple ampere-hour cells to be manufactured and assembled into test batteries. Aquion developed a proof of concept demonstration unit that showed similar performance and major cost improvement over existing technologies. Beyond minimizing cell and system cost, Aquion built a technology that is safe, environmentally benign and durable over many thousands of cycles as used in a variety of grid support roles. Through the course of this project the Aquion developed their aqueous electrolyte electrochemical energy storage device to the point where large demonstration units (> 10 kWh) were able to function in grid-supporting functions detailed by their collaborators. Aquion’s final deliverable was an ~15 kWh system that has the ability to perform medium to long duration (> 2 hours) charge and discharge functions with greater than 95% DC-DC efficiency.
System Design

Aquion Energy, Inc. DE-0000226 Final Report
10
See system architecture below.
Figure 6 – Diagram showing system architecture for Aquion’s high voltage Department of Energy test system
Milestones
Milestone Title
Milestone Description Milestone Status
Milestone Completion
PMP Update Revised PMP per discussions with NETL staff Complete 8/31/10
Low Volume Can Process Qualified
Hand assembled coin cell line implemented for cell testing.
Complete 6/10/10 Advanced Cell Concept Specified
Multiple cell stack configurations developed and put on test. Complete 7/15/10
Can Cell Design Qualified
Multi-stack architecture implemented. Complete 2/1/11
Advanced Battery Design
Prototype casing finalized and 3rd party connectors selected. Complete 4/1/11
480 -> 240 VAC3 PHASE X-FORMER
ABB PQFIBESS_LINK FIRMWARE
90 SERIES BATTERY0 PALLET
90 SERIES BATTERY0 PALLET
90 SERIES BATTERY0 PALLET
90 SERIES BATTERY0 PALLET
90 SERIES BATTERY0 PALLET
90 SERIES BATTERY0 PALLET
1
2
3
4
5
6
- +
-
+++
+++
- -
- - - BMS DATA ACQUISITION
ESTOP SAFETY RELAY
24VDC PWR SUPPLY
PQFI DIGITAL INTERFACE
LINUX PC (DELL LAPTOP)BMS
PQFI INTERFACE
PROCESS CONTROLLER
GUI WEB SERVER
DATALOGGER
WINDOWS PC (IBM THINKPAD) PQFI INTERFACE CONSOLE
10
/10
0/1
00
0 B
ASE
-T E
THER
NET
SW
ITC
H (
NET
GEA
R G
S10
8)
MODBUS/TCP
CANBUS
RS-232
240 VAC
480 VAC
MAIN DISCONNECT
SWITCH
Internet
WIFI

Aquion Energy, Inc. DE-0000226 Final Report
11
Qualified
Cell Format Decision
Prismatic stack design selected. Complete 5/1/11
Full Pilot Production Qualified
Dial table production started, multiple shifts operational preparing batteries for DOE test Complete 7/25/11
Prototype Battery Demonstrated
DOE high voltage test system operational for 6+ months
Complete 6/30/12 Figure 7 - Milestones and Completion Dates
Applications and Functions For analysis of applications please see Section 3 – Technology Performance. The primary applications demonstrated in this project:
Grid Capable – System was charged via grid and discharged locally, which also demonstrates UPS capability and T&D savings. A number of different cycle tests were run (again, see Section 3 for in depth analysis and explanation of tests) demonstrating efficiencies at various charge-discharge cycle lengths, with optimal efficiencies appearing at >4 hour cycle times.
Off-grid capable – Models were developed to simulate the load profile of an off-grid PV system, further detail in Section 3.
Section 5 – Analysis and Methodologies Analysis Objectives: The main objective of the testing performed was to assess the capability of the battery technology in terms of energy storage metrics. Analyses were first conducted on a series of small test articles that were gradually scaled up. The final deliverable was a >1000 V battery system – and in this case testing was conducted to show that the system was fully functional through a wide voltage range in support of a variety of use cases. Methodologies for determining technical performance: Electrochemical energy storage testing was performed using test equipment capable of providing variable (or constant) charge/discharge currents to the battery cells/systems. The voltage of the cell(s) was then recorded and analysis of the data allowed us to determined power and energy inflow/outflow from the test articles. Through the course of the work conducted, test systems obtained from Arbin,
Aquion Energy, Inc. DE-0000226 Final Report
12
Maccor, MTI, and Aerovironment were all used. These are all standard test units and there was nothing unusual about the way they were applied throughout the technical performance assessment exercises. Typical testing consisted of (for smaller cells) constant current charging/discharging through a set voltage window. For higher voltage battery strings, constant power charge/discharge testing was also used, as well as application-specific duty profiles in the form of power vs. time signals imparted onto the batteries through the testing equipment. For the final deliverable, a 1100 V (max) ABB power conditioning inverter was used to demonstrate the performance of 540 batteries connected in series. The high voltage test bed was set up in Aquion’s Pittsburgh headquarters, and was computer controlled and was also tied to the local grid through a customer side of the grid interface (thereby proving the practicality of the batteries assembled).
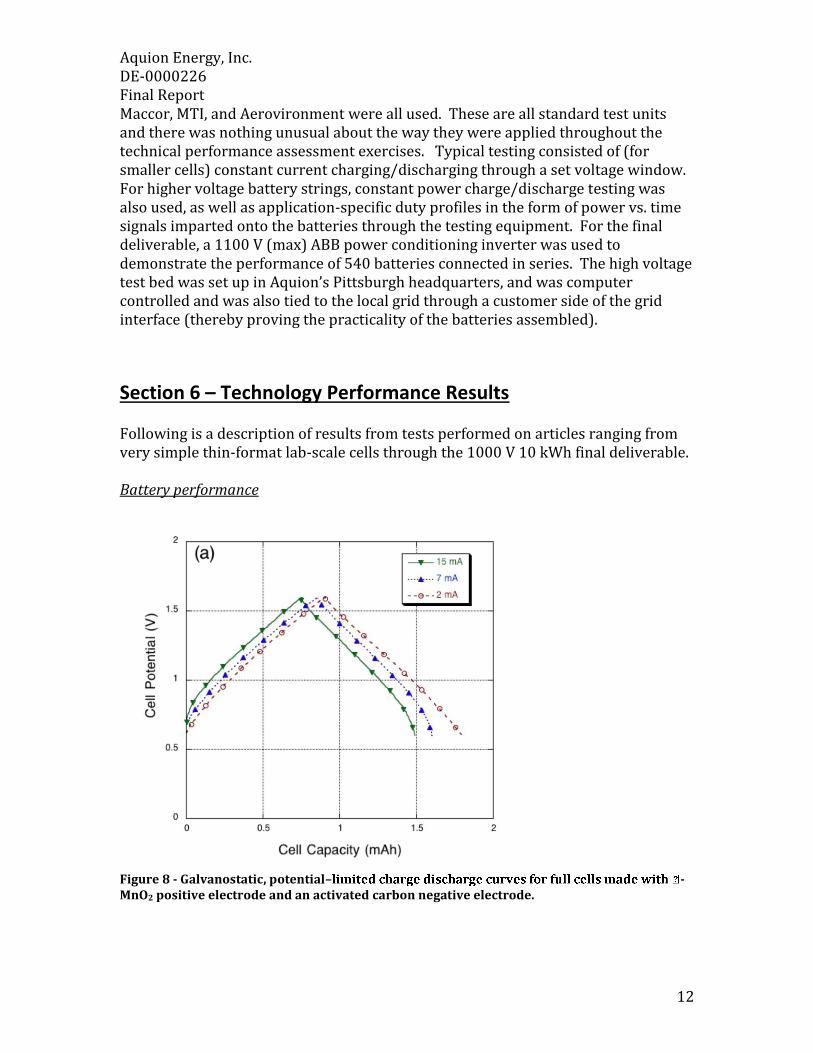
Section 6 – Technology Performance Results Following is a description of results from tests performed on articles ranging from very simple thin-format lab-scale cells through the 1000 V 10 kWh final deliverable. Battery performance
Figure 8 - Galvanostatic, potential– -MnO2 positive electrode and an activated carbon negative electrode.

Aquion Energy, Inc. DE-0000226 Final Report
13
Figure 9 - Round trip energy efficiency as a function of cycle and C-rate for thin electrode cells. Efficiencies of up to 95% were document for a cycling rate of 2C.
Thin Format cell performance. Coin cell format devices with electrodes less than 100 µm in thickness were produced with anode/cathode active materials mass ratios of approximately 1.2 to 1. Electrodes with this dimensionality will exhibit very little potential loss to electronic and ionic polarization, thus allowing for the absolute potential of the active material to be assessed. Figure 8 shows characteristic charge/discharge voltage profiles under potential-limited galvanostatic charge and discharge cycling between 1.6 and 0.6 V. The potential responses under three different current loadings are plotted in figure 9, while figure 10 shows the round trip columbic and total energy efficiency (% of charge energy retained during discharge). The current loading in terms of C-rate1 is indicated at the bottom of the plot. The round trip energy efficiency was excellent in this case: greater than 95% for a 2C cycling rate and in excess of 90% for current loadings as high as 6C.
1The C-rate number is the value by which the capacity value, (in Ah), is multiplied by to
arrive at the magnitude of the applied current (in A) – so a 2C rate on 1 Ah battery is 2 A
and so on.

Aquion Energy, Inc. DE-0000226 Final Report
14
Figure 10 - Charge/discharge curve recorded from a thick electrode cell made. Total cell thickness approached 1 cm, and an electrode-level energy density of 25 Wh l-1 (kWh m-3) could be reversibly extracted in less than 5 hours of discharge.
Thick format cell performance To minimize device cost, it is imperative that the electrodes employed be as thick as possible. This allows for the greatest amount of active material to be used per unit mass of ancillary materials (packaging, current collection, etc.). However, there are inherent limits to practical electrode thicknesses due to the physics of electronic and ionic transport through electrolyte and porous bodies. The ionic conductivity of alkali ions in water-based electrolytes is typically at least an order of magnitude better than that observed in solvent-based electrolytes as used in Li-ion systems. In principle, this allows for electrodes that are much thicker than those typically used in Li-ion batteries. Figure 10 shows that it is possible to extract substantial energy density values from thick-format electrodes (multi-millimeter). In this case, a glucose-derived activated carbon anode (6 mm thick) was paired with a Li-MnO2 cathode (3 mm thick) in an approximate 1:1 mass ratio. The electrodes were 15 mm diameter pellets that were tested in a Teflon swage-style cell with stainless steel current collectors. In a 1 M Na2SO4 electrolyte, the device was able to deliver an energy density of 25 Wh/liter in under 5 hours. While this value is lower than many existing battery chemistries, it is also significantly higher than many stationary storage solutions under consideration such as some flow batteries, fly wheels, and compressed gas based approaches. This same device attained a total specific energy of 23 Wh kg-1 for the test shown.
Aquion Energy, Inc. DE-0000226 Final Report
15
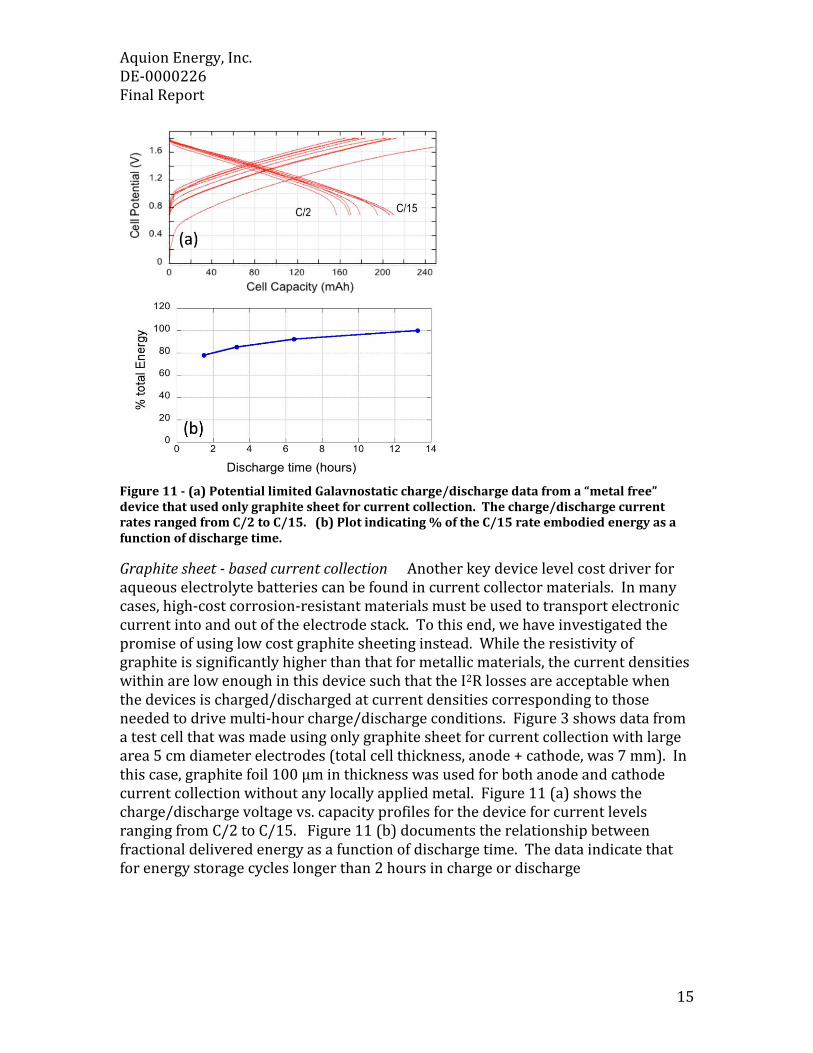
Figure 11 - (a) Potential limited Galavnostatic charge/discharge data from a “metal free” device that used only graphite sheet for current collection. The charge/discharge current rates ranged from C/2 to C/15. (b) Plot indicating % of the C/15 rate embodied energy as a function of discharge time.
Graphite sheet - based current collection Another key device level cost driver for aqueous electrolyte batteries can be found in current collector materials. In many cases, high-cost corrosion-resistant materials must be used to transport electronic current into and out of the electrode stack. To this end, we have investigated the promise of using low cost graphite sheeting instead. While the resistivity of graphite is significantly higher than that for metallic materials, the current densities within are low enough in this device such that the I2R losses are acceptable when the devices is charged/discharged at current densities corresponding to those needed to drive multi-hour charge/discharge conditions. Figure 3 shows data from a test cell that was made using only graphite sheet for current collection with large area 5 cm diameter electrodes (total cell thickness, anode + cathode, was 7 mm). In this case, graphite foil 100 µm in thickness was used for both anode and cathode current collection without any locally applied metal. Figure 11 (a) shows the charge/discharge voltage vs. capacity profiles for the device for current levels ranging from C/2 to C/15. Figure 11 (b) documents the relationship between fractional delivered energy as a function of discharge time. The data indicate that for energy storage cycles longer than 2 hours in charge or discharge
Aquion Energy, Inc. DE-0000226 Final Report
16
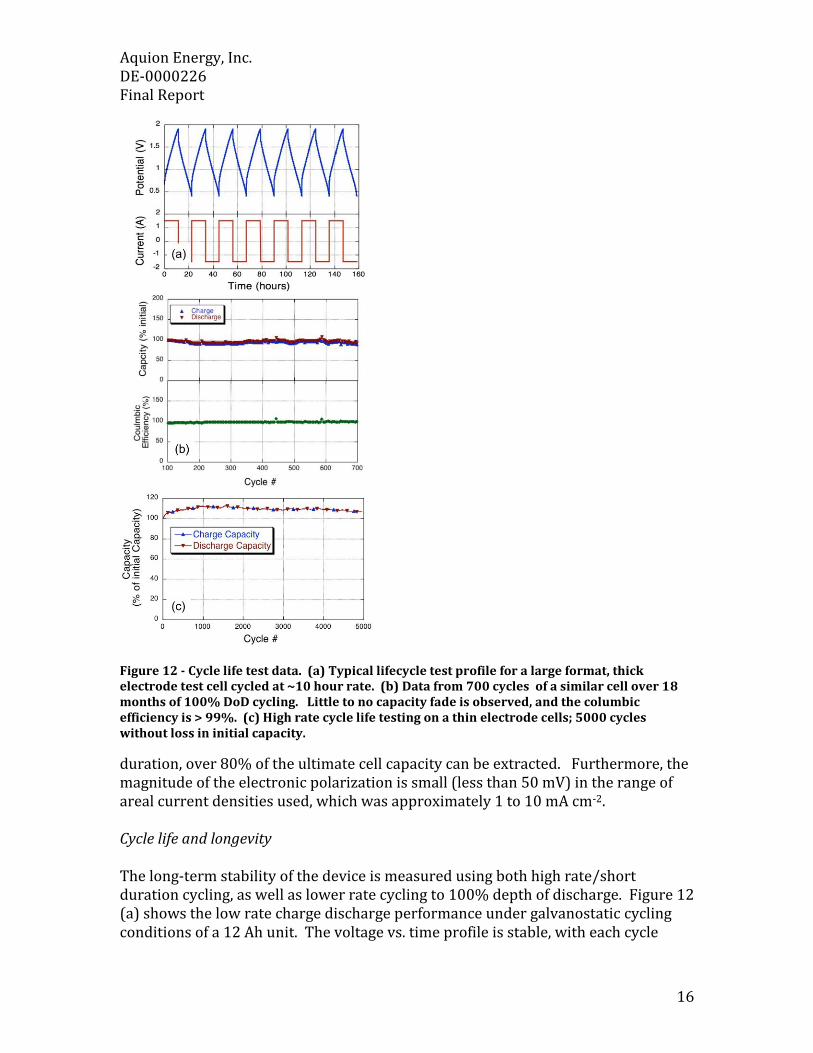
Figure 12 - Cycle life test data. (a) Typical lifecycle test profile for a large format, thick electrode test cell cycled at ~10 hour rate. (b) Data from 700 cycles of a similar cell over 18 months of 100% DoD cycling. Little to no capacity fade is observed, and the columbic efficiency is > 99%. (c) High rate cycle life testing on a thin electrode cells; 5000 cycles without loss in initial capacity.
duration, over 80% of the ultimate cell capacity can be extracted. Furthermore, the magnitude of the electronic polarization is small (less than 50 mV) in the range of areal current densities used, which was approximately 1 to 10 mA cm-2. Cycle life and longevity The long-term stability of the device is measured using both high rate/short duration cycling, as well as lower rate cycling to 100% depth of discharge. Figure 12 (a) shows the low rate charge discharge performance under galvanostatic cycling conditions of a 12 Ah unit. The voltage vs. time profile is stable, with each cycle

Aquion Energy, Inc. DE-0000226 Final Report
17
essentially identical to the previous even under very deep discharge, low rate testing conditions. Figure 12 (b) shows the performance of a fully sealed 200 mAh cell cycled under similar conditions for 12 months at a ~6 hour charge/discharge rate (approximately 2 galvanostatic charge/discharge cycles per day). Beyond seasonal thermal variation, no loss in capacity was observed throughout the test. Furthermore, the columbic efficiency of the cell was >99% for each cycle. To test the electrochemical junction’s tolerance to repeated rapid cycling, a coin cell was made with electrodes < 100 µm in thickness. Data from 10 min duration charge/discharge cycling (20 minutes per cycles) over is shown for 5000 cycles in figure 12 (c). At these current rates, for electrodes with this form factor, it is estimated that approximately 70% of the active material is participating in the charge/discharge reaction. Again, no loss in capacity is observed, showing that active materials can be exercised extensively without significant materials degradation.
Figure 13 - Data indicating the performance of a typical device at 60˚C over 900 hours. (a) The cell was cycled 202 times, and then left to stand at open circuit at a partial state of charge for 40 hours, followed by resumed cycling. (b) Very little to no self-discharge was observed, and no loss in function occurred as a result of the stand at partial state of charge.

Aquion Energy, Inc. DE-0000226 Final Report
18
Self Discharge To be viable, a bulk energy storage technology must demonstrate the ability to hold charge over extended periods with little or no self-discharge. To examine the self-discharge characteristics of this device, an elevated temperature stand at open circuit test was performed. Specifically, a 1.4 Ah cell was deep cycled 200 times over 845 hours of testing at a temperature of 60˚C. The cell was then left to stand at open circuit for 40 hours, and then the cycling was resumed. The data plotted in figure 5 indicate that the cell potential rose to a steady-state open circuit value of 1 V, and held this potential constant for 10’s of hours. No loss in cell potential was observed, and there was no evidence of self-discharge, and the cell showed no loss of function as a result of this extended rest. Furthermore, cells with initial potentials of 1.4 to 1.5 V that have been placed on long term observation have been found to have open circuit potentials of over 1.1 V after a year of storage at ambient temperatures, indicating an extremely slow rate of self-discharge (2% of total capacity self-discharge per month). Multi-cell Prototype Performance The vast majority of applications require DC bus potentials of tens or hundreds of Volts, many electrochemical cells must be connected electronically in series. In this configuration, most battery chemistries require cell-to-cell (or grouped parallel) electronic battery management systems (BMS) that monitor each cell voltage and

Aquion Energy, Inc. DE-0000226 Final Report
19
routinely correct cells that diverge in state of charge or ability to deliver necessary
Figure 14 - Data showing performance of a string of ten 0.35 Ah cells connected in series. (a) The
charge discharge voltage profile under galvanostatic conditions (C/6 rate). (b) Plot showing the
uniformity of the 10 cells during testing. (c) Capacity as function of cycle, with increasing maximum
state of charge potential. The string was fully stable up to at least 2 V per cell.
capacity. For scaled low-cost stationary storage, the use of cell-level BMS would be cumbersome and too costly. We find, however, that the hybrid/asymmetric configuration used in this battery does not require a BMS to be stable over extended periods of use. As a case in point, the charge/discharge curve in figure 14 (a) is for a 350 mAh, 10-cell battery galvanostatically cycled between 8 and 18 V (0.8 and 1.8 V per cell, on average), while figure 14 (b) shows the potentials of the individual cells plotted together. Each cell in this battery is stable and there is no divergence in cell
Aquion Energy, Inc. DE-0000226 Final Report
20
or string performance over multiple cycles. Figure 14 (c) is a plot of the discharge capacity as a function of cycle of this 10-cell battery when charged to 18, 19, and 20 V. The Battery was completely stable when the battery was charged to both 18 and 19 volts; in this case the cells were each charged to approximately 1.9 V. Large Format Prototype Performance
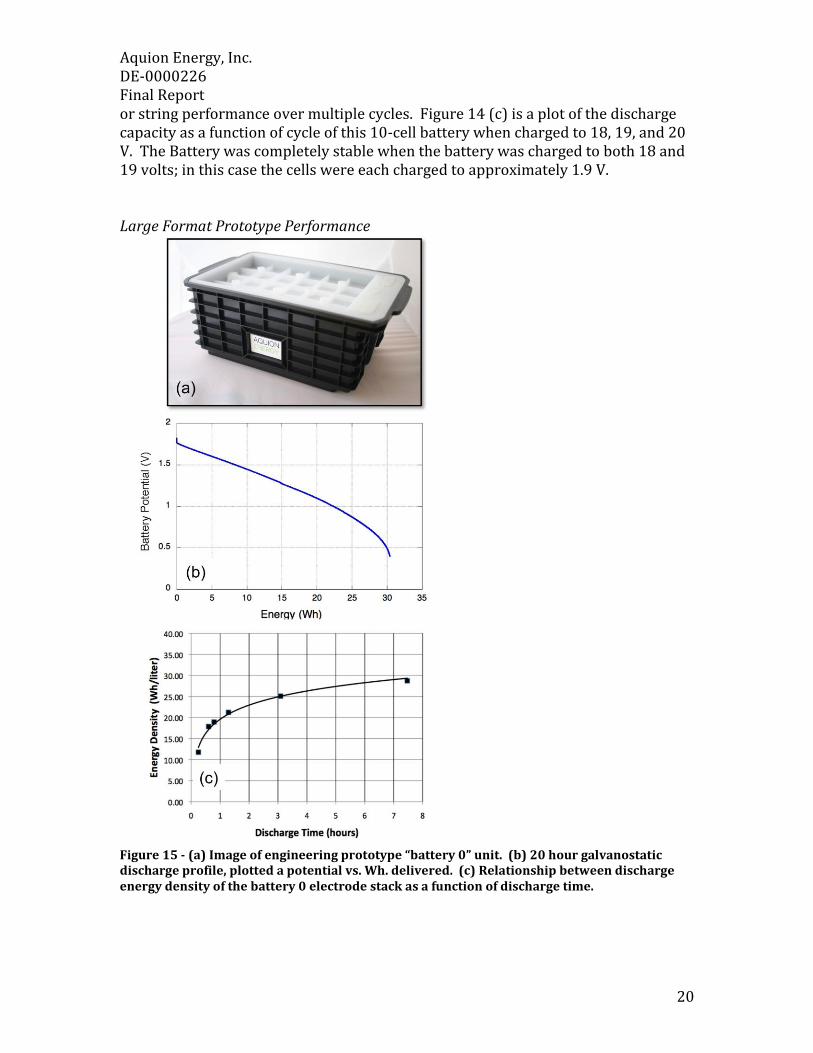
Figure 15 - (a) Image of engineering prototype “battery 0” unit. (b) 20 hour galvanostatic discharge profile, plotted a potential vs. Wh. delivered. (c) Relationship between discharge energy density of the battery 0 electrode stack as a function of discharge time.

Aquion Energy, Inc. DE-0000226 Final Report
21
Practical and manufacturable large-format cells of this chemistry must be designed. To this end, we have developed a proof-of-concept, pre-product prototype, the Aquion Energy “Battery 0” hybrid ion battery (HIB). This unit has approximately 1 liter of open volume inside its casing and houses 10 to 14 layers of anode/cathode pairs. The internal configuration consists of individual electrode layers assembled in opposing sheets that are then connected internally in parallel in a true prismatic geometry. This device is not optimized to minimize mass or external envelope volume, but is instead designed to allow a range of manufacturing and performance parameters to be probed as the first product-class battery is designed. Figure 15 (a) is an image of the unit, and figure 15 (b) is a potential vs. discharged energy for a low-current galvanostatic discharge. Figure 15 (c) is a plot indicating the Wh/liter delivered from the electrode pairs used to make the cell. Ongoing cycle life studies on these units indicate similar stability and performance as observed in smaller prototype units. A 2.4 kWh, 80 V (max voltage) battery pack using two strings of 40 battery 0 units connected in parallel. There was no cell-level or string-level battery management electronics. After qualification, the pack was placed on a long-term application-specific 24-hour duty profile provided by a company that designs and installs off-grid diesel/photovoltaic hybrid energy installations. Figure 16 shows power demand as a function of time imparted on a lead-acid battery pack used in the field. In this case, the magnitude of the load was scaled to the size of the pack such that a 75% state of charge swing would be encountered through each cycle. The maximum power was approximately 0.5 kW, and the total energy processed per day was 1.8 kWh. The voltage vs. time data shows that the system was extremely stable.

Aquion Energy, Inc. DE-0000226 Final Report
22
Figure 16 - System - level application-specific data showing the performance of a 60 V nominal, 2.4 kWh battery pack made of battery 0 units. This is a support profile for a diesel/PV/battery hybrid system (a) The power vs. time profile recorded from a lead-acid pack used in the field. (b) The resulting performance of the pack over 10 days of use.
Final deliverable: 10 kWh, 1000 V energy storage system demonstration
Figure 17 - High Voltage test system battery stacks and inverter setup
Figure 17 is an image of the high voltage test bed system showing both the battery bank as well as the inverter system. Figure 18 shows data from the first several charge/discharge events on this test system, and figure 19 shows constant current discharge data from the fully charged system. On the second of these discharge events, the battery band delivered just under 11 kWh, thereby demonstrating that
Aquion Energy, Inc. DE-0000226 Final Report
23
we have produced a >10 kWh battery system. In this case, the discharge rate was approximately C/10 – it should be noted that the energy of the battery approaches 15 kWh when discharged over 20 or more hours. Figure 16 is data showing the performance of the system when an application specific duty profile is imparted on it. In this case, a PV + Diesel hybrid profile provided by a partner is used, and both the current and voltage response to this profile is plotted here as a function of time. The system is able to support this use case and delivers over of 8 kWh through a cycle. Figure 17 shows the voltage and current responses to this same application specific power vs. time profile over a week of use. It can be seen that the system is extremely stable, as the current and voltage responses are nearly identical for each of daily cycles. One of the key efforts undertaken by this project was to develop a model that can accurately assess state of charge of the system and also predict performance. The model is based on a multi-variable fit on known equilibrium V vs. capacity behavior of the battery and is then modified based on systems-level impedance and capacitance values as entered into an equivalent circuit model. Results from this modeling effort are shown in figure 18, where actual data, the calculated actual state of charge of the battery and the predicted performance of the battery though an application specific use profile are all shown. Analyses of this model show that the battery performance can be predicted within 2 to 5% of real performance, which is sufficient resolution for a large portion of the key techno-economic analyses that must be performed. Root cause analysis (RCA) and corrective actions taken Throughout the course of this project a number of key root RCA events occurred and appropriate reactions were made. These include down selecting the battery geometry to a stacked prismatic configuration (not a series/bipolar), selecting the correct materials to use in the system, and understanding the best ways to package the batteries. Forecasts/extrapolations of long term performance Thus far, the cycle life performance we have observed for our pre-production alpha units are consistent with our previous strong results from single cells and from early large-format prototypes (including the engineering prototype Battery 0). The following data show the progression from cycle life tests on thin electrode format coin cell through our current alpha units in support of the cycle life claims. SINGLE CELL, THIN ELECTRODES – Initially Built 2009
The first step in proving that the battery product will offer stable cycle life is to establish that the functional materials themselves are able to be cycled through a
Aquion Energy, Inc. DE-0000226 Final Report
24
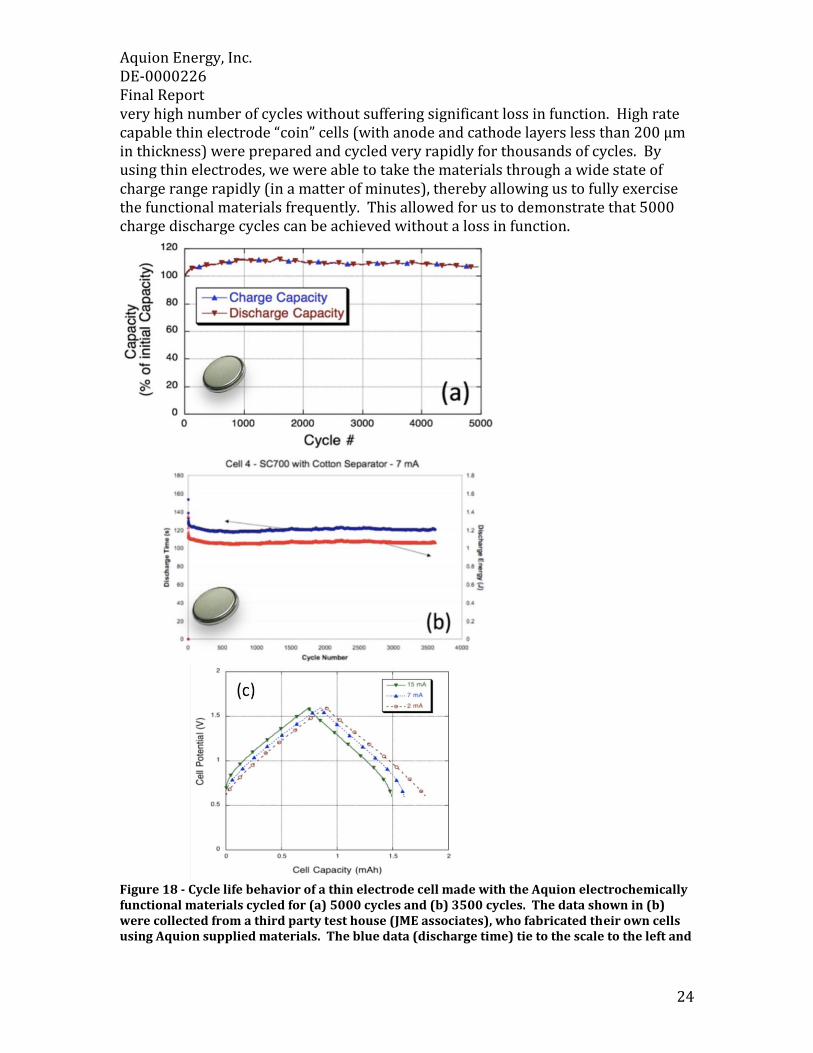
very high number of cycles without suffering significant loss in function. High rate capable thin electrode “coin” cells (with anode and cathode layers less than 200 µm in thickness) were prepared and cycled very rapidly for thousands of cycles. By using thin electrodes, we were able to take the materials through a wide state of charge range rapidly (in a matter of minutes), thereby allowing us to fully exercise the functional materials frequently. This allowed for us to demonstrate that 5000 charge discharge cycles can be achieved without a loss in function.
Figure 18 - Cycle life behavior of a thin electrode cell made with the Aquion electrochemically functional materials cycled for (a) 5000 cycles and (b) 3500 cycles. The data shown in (b) were collected from a third party test house (JME associates), who fabricated their own cells using Aquion supplied materials. The blue data (discharge time) tie to the scale to the left and
Aquion Energy, Inc. DE-0000226 Final Report
25
the red data (discharge energy) tie to the scale to the right. The inset image shows the test fixture: a 2 cm diameter coin cell. (c) Typical charge/discharge voltage vs. capacity data for these tests showing excellent round trip columbic and energy efficiency.
Figure 18 shows that thin electrode format lab-scale test cells (with total capacities on the order of 2 to 5 mAh) have extremely good cycle life through many thousands of cycles. In both cases, the cells were cycled through a wide voltage range (~1.7 to 0.7 V) rapidly. It should also be noted that both of these experiments were stopped arbitrarily, not because of a functional failure.
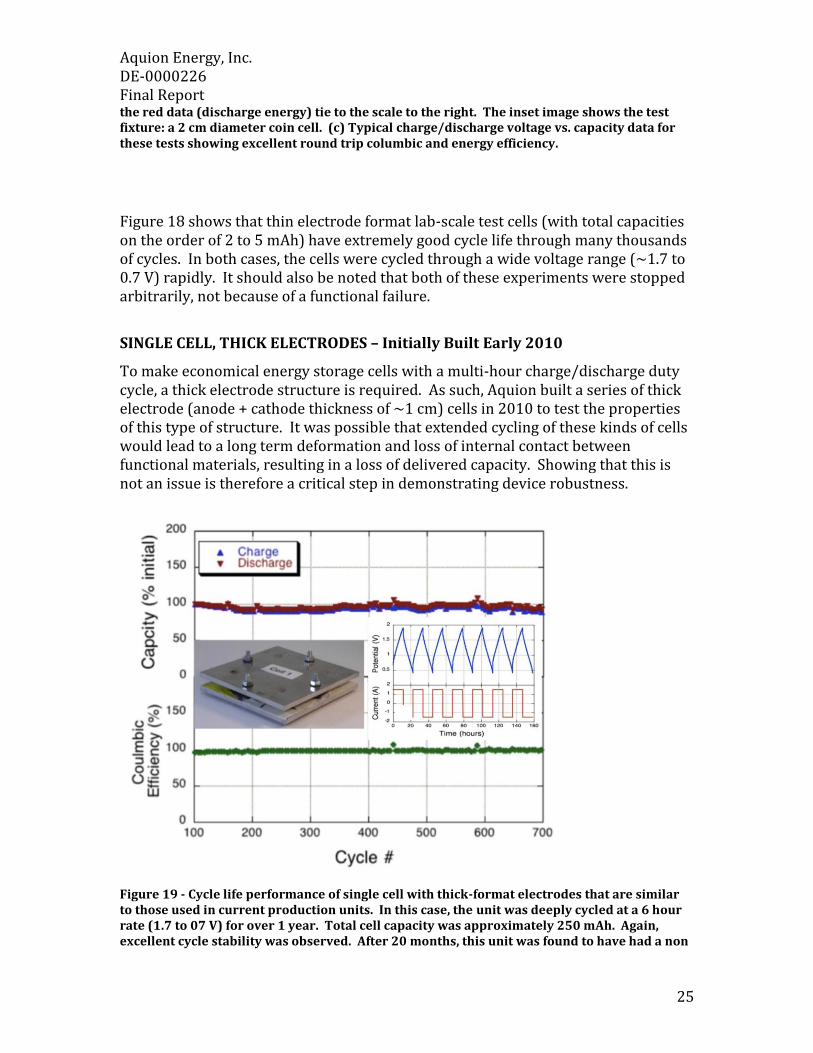
SINGLE CELL, THICK ELECTRODES – Initially Built Early 2010
To make economical energy storage cells with a multi-hour charge/discharge duty cycle, a thick electrode structure is required. As such, Aquion built a series of thick electrode (anode + cathode thickness of ~1 cm) cells in 2010 to test the properties of this type of structure. It was possible that extended cycling of these kinds of cells would lead to a long term deformation and loss of internal contact between functional materials, resulting in a loss of delivered capacity. Showing that this is not an issue is therefore a critical step in demonstrating device robustness.
Figure 19 - Cycle life performance of single cell with thick-format electrodes that are similar to those used in current production units. In this case, the unit was deeply cycled at a 6 hour rate (1.7 to 07 V) for over 1 year. Total cell capacity was approximately 250 mAh. Again, excellent cycle stability was observed. After 20 months, this unit was found to have had a non

Aquion Energy, Inc. DE-0000226 Final Report
26
air-tight seal that resulted in electrolyte dry out and loss of function. The total thickness of the electrodes in this cell was 1 cm (anode + cathode). The inset image shows the test fixture: a 10 x 10 cm area by 1 cm thick format single cell. The right inset shows the cell voltage vs. time profile for this device.
Figure 19 shows that good cycle life is retained when the electrode structures are produced in a thick format (of multiple mm for both anode and cathode). This is a key finding since one possible cause of capacity loss in the Aquion device could be long-term disassociation of active materials inside thick electrodes due to mechanical relaxation of the electrode structure and concurrent loss of electronic connectivity.
MULTI-CELL, THICK ELECTRODES – Initially Built 2nd Half 2010
Figure 20 - (a) Long term cycle life test of large format “2x1” prototype cell made with production intent electrode pellets arranged in production intent “stacked prismatic” configuration encased in a custom polypropylene fixture. Some capacity loss was observed over the first few hundred cycles, however performance has been stable since. This test is ongoing and has been underway for approximately 20 months. A white line has been overlayed onto the data from cycle 550 to 1000 to aid the eye in seeing that there was essentially no net loss in delivered capacity through these cycles. The inset image shows the test fixture: a custom-designed and machined polypropylene casing that contains multiple layers of electrode pellets connected in a true prismatic configuration. The external dimensions of this unit are approximately 10 x 5 x 7 cm. (b) Voltage vs. time profile typical for this device under long term test.
Aquion Energy, Inc. DE-0000226 Final Report
27
The next step in proving long term durability is to test cell fixtures with thick format electrodes that are organized a true stacked prismatic configuration that is representative of that used in our product-class units. This was achieved using the “2 x 1” device, which had multiple layers of electrodes produced using our high throughput electrode press technology.
Figure 20 shows the performance of a large format prototype battery with 2.5 Ah in capacity that contains many thick format electrodes connected in a stacked prismatic format. This configuration is consistent with the internal structure and electrochemistry of our current production-intent Alpha unit. This test has been ongoing for approximately 20 months. The testing show that the capacity retention as a function of cycle is as expected from previous results and is stable. It should be noted that in multi-cell configurations (these units as well all units following), we see a loss of 5 to 15% of initial capacity during early use – typically between start-up and a few hundred full cycles. After this point, the capacity of a good Aquion battery system will be flat or extremely close to flat. Our quoted or nameplate capacity will be tied to this “settled down” capacity value. We believe that this initial break-in period of the battery system is tied to the system reaching a mechanical/electrochemical equilibrium after several hundred cycles. The fundamental causes of this are under investigation and, based on findings to date, we expect to eliminate this initial fade phenomenon in 2013/2014.
BATTERY “0” / ENGINEERING PROTOTYPE – Initially Built H1 2011
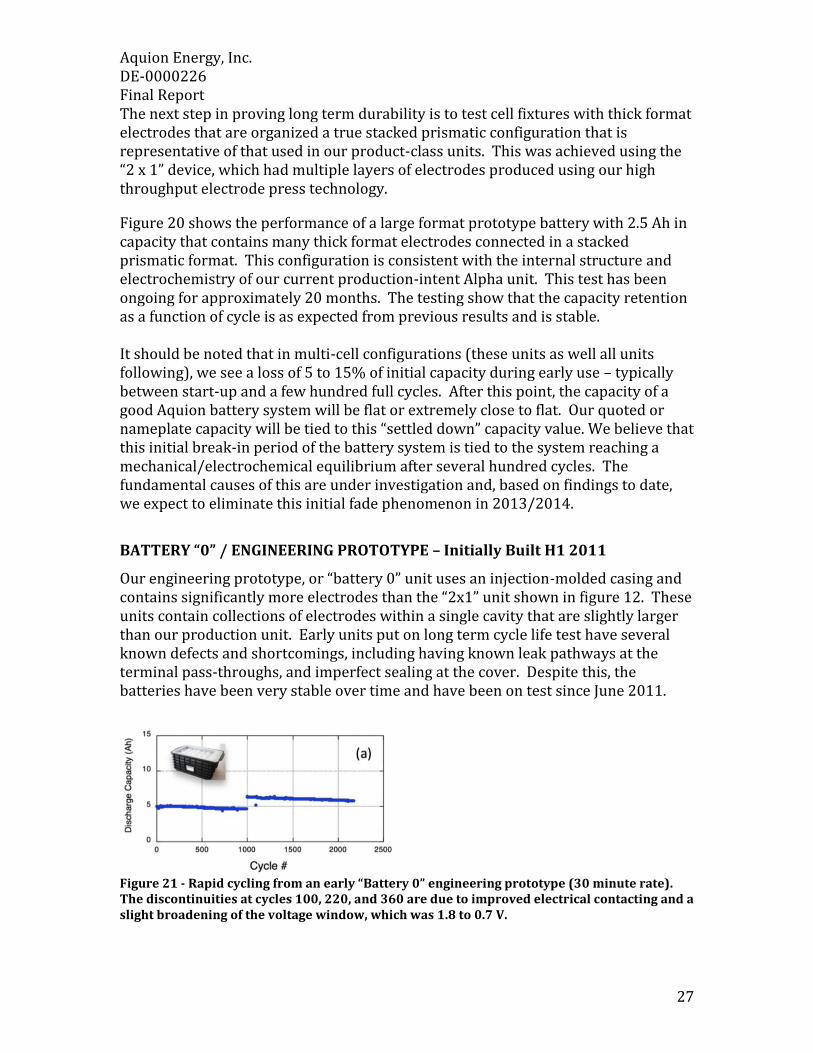
Our engineering prototype, or “battery 0” unit uses an injection-molded casing and contains significantly more electrodes than the “2x1” unit shown in figure 12. These units contain collections of electrodes within a single cavity that are slightly larger than our production unit. Early units put on long term cycle life test have several known defects and shortcomings, including having known leak pathways at the terminal pass-throughs, and imperfect sealing at the cover. Despite this, the batteries have been very stable over time and have been on test since June 2011.
Figure 21 - Rapid cycling from an early “Battery 0” engineering prototype (30 minute rate). The discontinuities at cycles 100, 220, and 360 are due to improved electrical contacting and a slight broadening of the voltage window, which was 1.8 to 0.7 V.
Aquion Energy, Inc. DE-0000226 Final Report
28
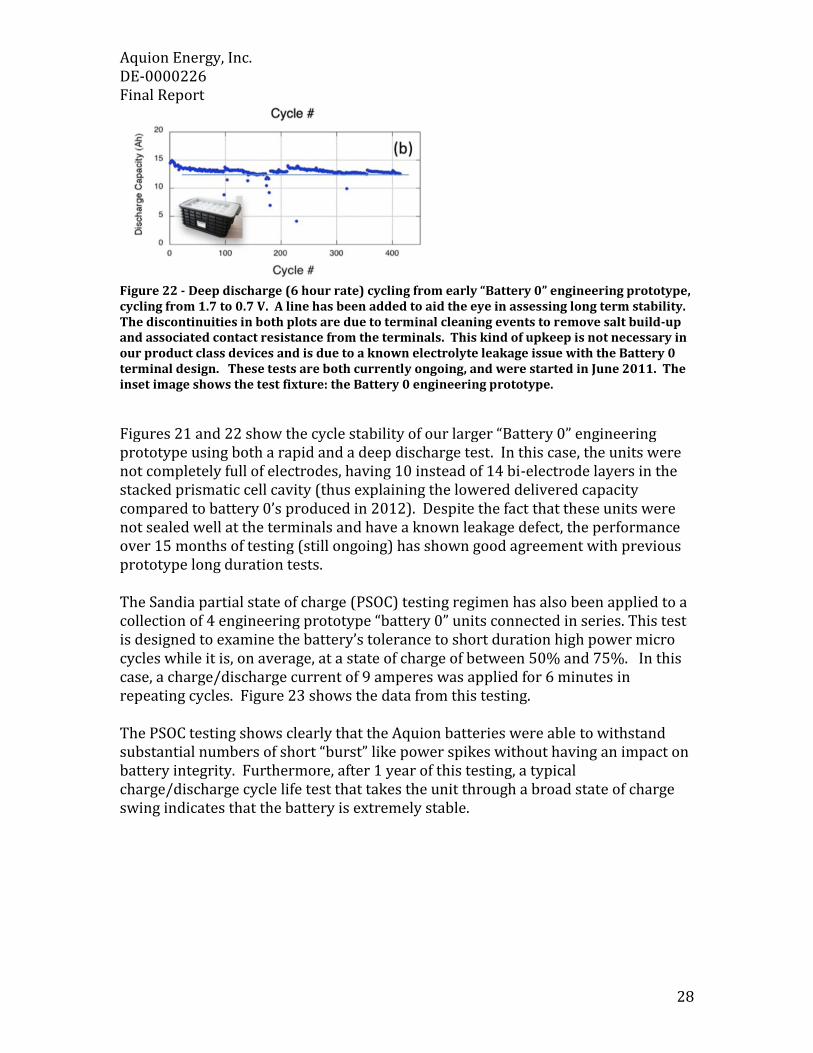
Figure 22 - Deep discharge (6 hour rate) cycling from early “Battery 0” engineering prototype, cycling from 1.7 to 0.7 V. A line has been added to aid the eye in assessing long term stability. The discontinuities in both plots are due to terminal cleaning events to remove salt build-up and associated contact resistance from the terminals. This kind of upkeep is not necessary in our product class devices and is due to a known electrolyte leakage issue with the Battery 0 terminal design. These tests are both currently ongoing, and were started in June 2011. The inset image shows the test fixture: the Battery 0 engineering prototype.
Figures 21 and 22 show the cycle stability of our larger “Battery 0” engineering prototype using both a rapid and a deep discharge test. In this case, the units were not completely full of electrodes, having 10 instead of 14 bi-electrode layers in the stacked prismatic cell cavity (thus explaining the lowered delivered capacity compared to battery 0’s produced in 2012). Despite the fact that these units were not sealed well at the terminals and have a known leakage defect, the performance over 15 months of testing (still ongoing) has shown good agreement with previous prototype long duration tests. The Sandia partial state of charge (PSOC) testing regimen has also been applied to a collection of 4 engineering prototype “battery 0” units connected in series. This test is designed to examine the battery’s tolerance to short duration high power micro cycles while it is, on average, at a state of charge of between 50% and 75%. In this case, a charge/discharge current of 9 amperes was applied for 6 minutes in repeating cycles. Figure 23 shows the data from this testing. The PSOC testing shows clearly that the Aquion batteries were able to withstand substantial numbers of short “burst” like power spikes without having an impact on battery integrity. Furthermore, after 1 year of this testing, a typical charge/discharge cycle life test that takes the unit through a broad state of charge swing indicates that the battery is extremely stable.

Aquion Energy, Inc. DE-0000226 Final Report
29
Figure 23 - (a) the voltage vs. time response to the PSOC test profile consisting of 6 minute constant current pulses of +/- 9 A imposed on 4 battery 0 units connected in series. A high degree of polarization is observed, however the profile is extremely stable. (b) Constant current (4) reference discharge cycle performed prior to the PSOC testing and after approximately 3200 PSOC cycles. There is virtually no difference between the before and after tests; the 4 battery 0 units did not significantly degrade as a result of the PSOC cycling. (c) Cycle life performance of this unit (4 battery 0’s in series) after a year of rapid PSOC cycling. The unit is very stable and delivers consistent capacity.
Section 7 – Major Findings and Conclusions
The above data give us confidence in saying that our production units will have excellent cycle life stability when they are produced. The correlation between small lab-scale single cell test units and our pre-production prototypes are clearly shown in figures 1 through 5. Aquion is currently constructing a dedicated lifetime performance test lab in Pittsburgh. This facility will be able to test over 300 units under many different
Aquion Energy, Inc. DE-0000226 Final Report
30
environmental and cycling conditions. By mid-2013 there will be a very large dataset showing with significant resolution the performance of our production intent batteries. Analysis of possible improvements There are many ways to further improve the energy density of this battery chemistry. We are currently examining the possibility of introducing a novel higher energy density composite anode system that will increase the total energy of the battery system by 25% or more. We are also looking to reduce the amount of non-functional material in the actual electrode structures as much as possible. Specifically new low mass content binders that are not needed beyond 2 to 5% are under study. Longer-term design efforts are also under way to reduce the bulk of the packaging and to increase the amount of control of the structural forces used to keep large format battery stacks intact.
Section 8 – Future Plans and Risks
8.1 – Future Plans
8.1.1 – Manufacturing Facility Having obtained its first purchase orders and customers in 2011, Aquion is now beginning the scale-up of commercial manufacturing and is seeking to use available funding from a variety of sources. These funds will be primarily used for the purchase of manufacturing equipment. The project is expected to create 341 new jobs (up to 500 combined) supporting the manufacture of 500 MWh of batteries per year at full capacity through the first phase ending in 2015. Aquion is currently anticipating a second phase expected to begin in the second half of 2015. This project phase will be comparable in job creation and output numbers to the first phase, as well as being located at the same site. Purpose This facility will lead the initial rollout of Aquion’s product offering, and will be located in Westmoreland County, Pennsylvania. Currently, a pilot line is operating out of Aquion’s Pittsburgh headquarters, which is manufacturing limited quantities of pre-commercial battery units for testing and demonstration. While the batteries are mostly hand-assembled, the line has been partially automated over the past year. Additionally, Aquion’s management team has experience in manufacturing ramp-up and build-out, including further factories in the United States. This will be the first project of its kind for Aquion.
Aquion Energy, Inc. DE-0000226 Final Report
31
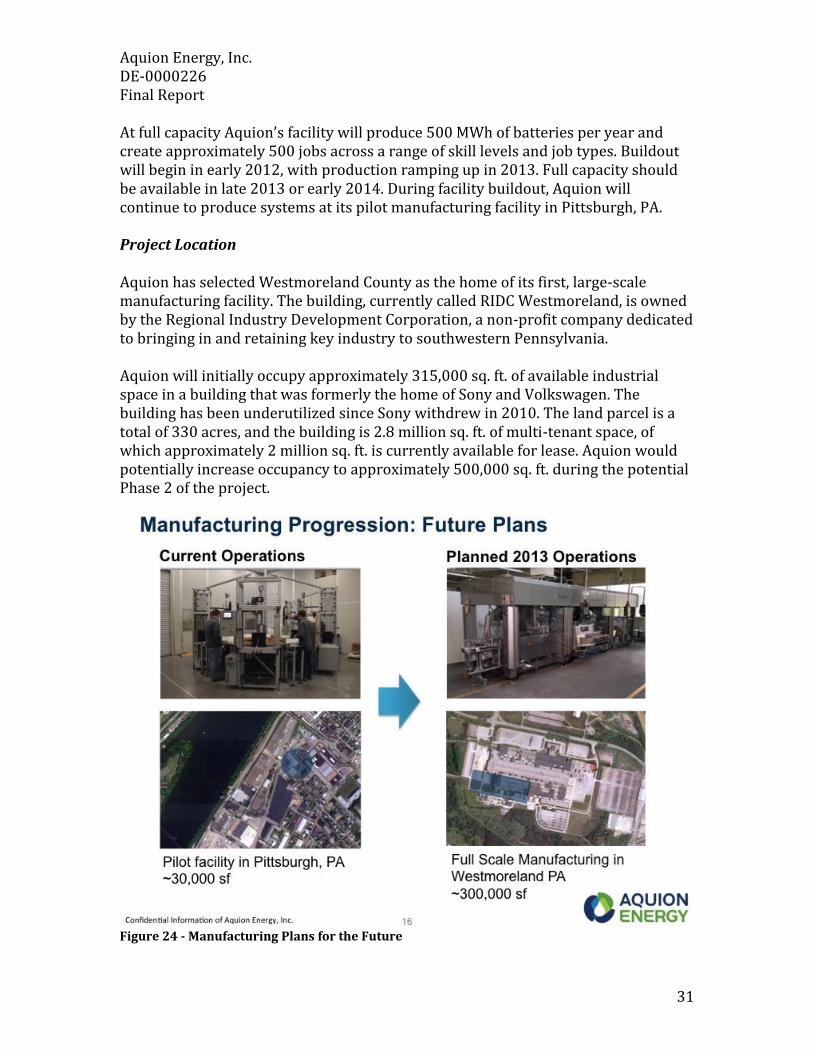
At full capacity Aquion’s facility will produce 500 MWh of batteries per year and create approximately 500 jobs across a range of skill levels and job types. Buildout will begin in early 2012, with production ramping up in 2013. Full capacity should be available in late 2013 or early 2014. During facility buildout, Aquion will continue to produce systems at its pilot manufacturing facility in Pittsburgh, PA. Project Location Aquion has selected Westmoreland County as the home of its first, large-scale manufacturing facility. The building, currently called RIDC Westmoreland, is owned by the Regional Industry Development Corporation, a non-profit company dedicated to bringing in and retaining key industry to southwestern Pennsylvania. Aquion will initially occupy approximately 315,000 sq. ft. of available industrial space in a building that was formerly the home of Sony and Volkswagen. The building has been underutilized since Sony withdrew in 2010. The land parcel is a total of 330 acres, and the building is 2.8 million sq. ft. of multi-tenant space, of which approximately 2 million sq. ft. is currently available for lease. Aquion would potentially increase occupancy to approximately 500,000 sq. ft. during the potential Phase 2 of the project.
Figure 24 - Manufacturing Plans for the Future

Aquion Energy, Inc. DE-0000226 Final Report
32
8.1.2 – Possible Applications
Application Benefits
End-Use • Power Quality and Reliability
• Peak Load Reduction
• Distributed Generation and Smart Grid
Support
Renewable Penetration • Reduced Variability
• Ramp Rate Control
• Load Time Shifting
• Reserves
• Dispatchability
Transmission and Distribution • Line and Transformer Deferral
• Stability
• Voltage / Frequency Regulation
Generation • Capacity Deferral
• Voltage / Frequency Regulation
• Load Leveling
Aquion Energy, Inc. DE-0000226 Final Report
33
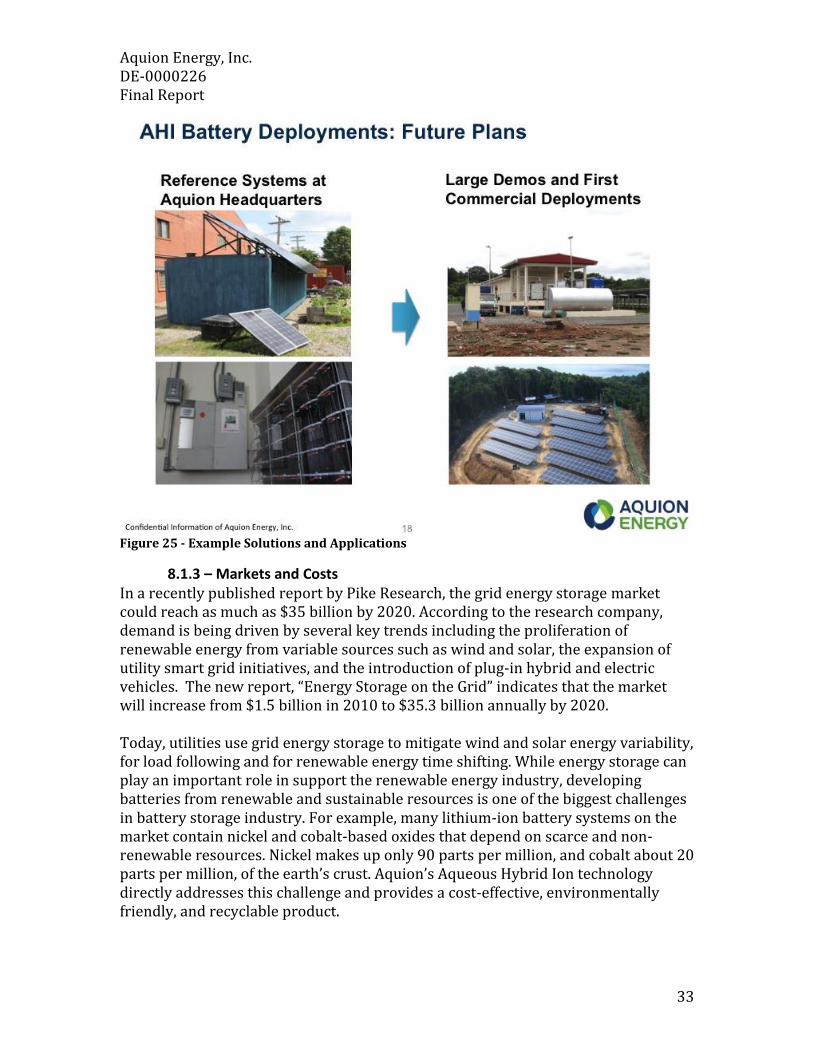
Figure 25 - Example Solutions and Applications
8.1.3 – Markets and Costs In a recently published report by Pike Research, the grid energy storage market could reach as much as $35 billion by 2020. According to the research company, demand is being driven by several key trends including the proliferation of renewable energy from variable sources such as wind and solar, the expansion of utility smart grid initiatives, and the introduction of plug-in hybrid and electric vehicles. The new report, “Energy Storage on the Grid” indicates that the market will increase from $1.5 billion in 2010 to $35.3 billion annually by 2020. Today, utilities use grid energy storage to mitigate wind and solar energy variability, for load following and for renewable energy time shifting. While energy storage can play an important role in support the renewable energy industry, developing batteries from renewable and sustainable resources is one of the biggest challenges in battery storage industry. For example, many lithium-ion battery systems on the market contain nickel and cobalt-based oxides that depend on scarce and non-renewable resources. Nickel makes up only 90 parts per million, and cobalt about 20 parts per million, of the earth’s crust. Aquion’s Aqueous Hybrid Ion technology directly addresses this challenge and provides a cost-effective, environmentally friendly, and recyclable product.

Aquion Energy, Inc. DE-0000226 Final Report
34
In the coming years, the number of applications for energy storage on the grid will expand to include the opportunity for utilities to defer transmission and distribution (T&D) capital upgrades, time of use energy cost management for the commercial and industrial (C&I) segments, and conventional energy time shifting. The grid-scale stationary energy storage market is currently dominated by pumped hydro, compressed air energy storage (CAES), Sodium Sulfur (NAS) batteries and Li-ion batteries. Aquion’s technology offers strong performance and cost advantages over all incumbent technologies for energy storage applications in the >4 hour duration range. This is the length of time required to replace the energy services currently provided by peaking natural gas turbines and is the duration expected to account for the bulk of the market growth identified by the Pike report.
8.2 – Risks
8.2.1 – Potential Financial Risks
Risk Project Mitigation
Miscalculation of Hard Capital Costs Cost of equipment and raw materials are
either higher or lower when ported into a
mass production environment. Aquion
Energy will make reserve equity available
for cost overruns.
Equity Pledge Withdrawn Aquion’s equity investors have provided
support letters pledging commitment to the
project.
Plant Construction Takes Longer than
Expected to Achieve Commercial
Operations
The site and location for the plant are
managed and currently controlled by the
Pennsylvania State authorized entity.
Aquion Energy has taken all the necessary
steps and commitment letters from
equipment providers for on-time delivery
and setup of production equipment and
supplies.
Plant Operating Costs are Higher than
Expected
All costs such as labor, maintenance, and
general operating and administrative costs
move with inflation and are very stable and
predictable.
Environmental Risks Any hazardous material that find their way
into the equipment or if they are present in
the raw materials will be quarantined and
removed from the facility in a safe manner.

Aquion Energy, Inc. DE-0000226 Final Report
35
Technology Suppliers and Partners Fail to
Perform
Performance guarantees are provided under
the technology suppliers’ contracts.
8.2.3 – Technology/Manufacturing Risks
Factor Discussion Sales Volume – Units sold and price per
unit
There are several variables under this
category including the uncertainty of
whether:
The factory that will be able to
manufacture the product volume
needed to fulfill the sales target at
the cost per unit assumed in the
forecast
The pricing assumed be accepted by
our new customers
Aquion intends to incrementally scaleup
production as customer demand increases.
Variable Cost of Goods Sold (COGS) –
Cost of materials and labor to manufacture
the assembled battery systems
The primary issue in this category is that
the actual cost of manufacturing the
assembling battery systems could deviate
from the assumptions used in creating the
bill of materials (BOM) and labor costs
involved. Aquion has used conservative
estimates in its project costs to mitigate
major price changes. Aquion’s battery
design continues to evolve; however,
Aquion continually strives to utilize the
most cost-effective materials in the
production of its technology.
Capacity Utilization – Selling all available
capacity at the predicted price point
The goal for Aquion is to add plant
capacity (lines 2-10) to meet the
anticipated demand. As capacity utilization
is driven by sales volume, there is some
risk that sales volume targets will not be
met. Aquion is minimizing that risk by
only adding additional lines as sales
volume builds.
Aquion Energy, Inc. DE-0000226 Final Report
36
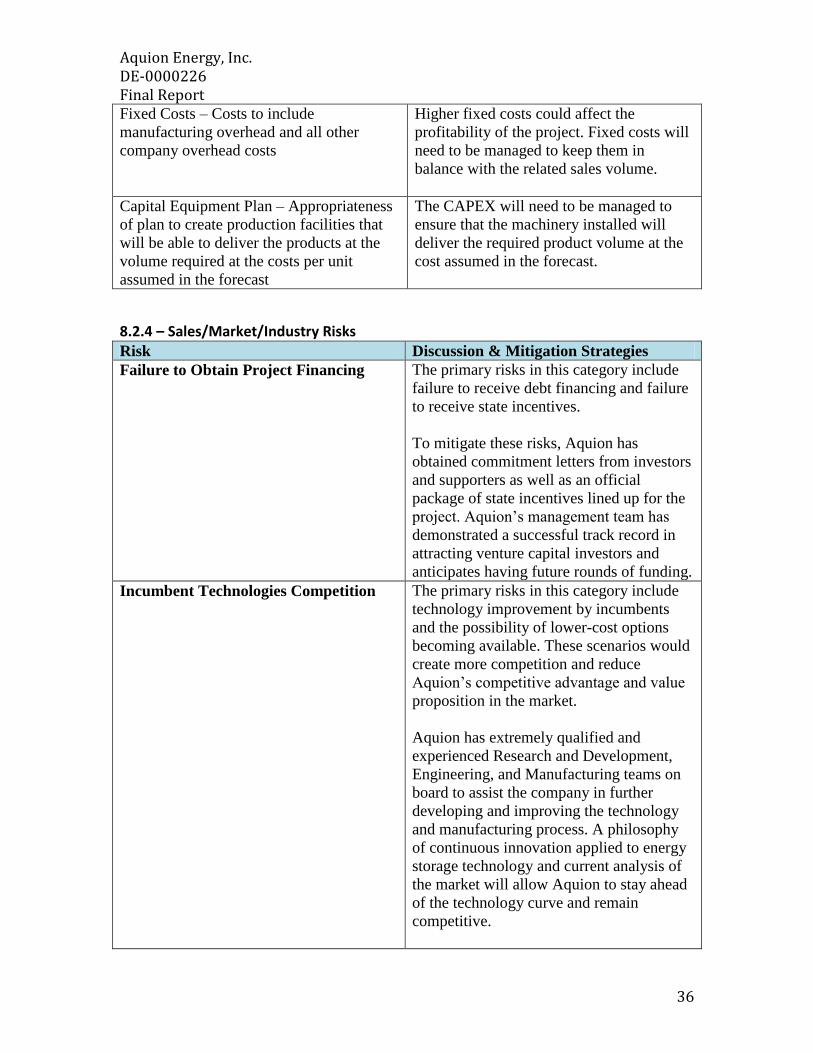
Fixed Costs – Costs to include
manufacturing overhead and all other
company overhead costs
Higher fixed costs could affect the
profitability of the project. Fixed costs will
need to be managed to keep them in
balance with the related sales volume.
Capital Equipment Plan – Appropriateness
of plan to create production facilities that
will be able to deliver the products at the
volume required at the costs per unit
assumed in the forecast
The CAPEX will need to be managed to
ensure that the machinery installed will
deliver the required product volume at the
cost assumed in the forecast.
8.2.4 – Sales/Market/Industry Risks Risk Discussion & Mitigation Strategies
Failure to Obtain Project Financing The primary risks in this category include
failure to receive debt financing and failure
to receive state incentives.
To mitigate these risks, Aquion has
obtained commitment letters from investors
and supporters as well as an official
package of state incentives lined up for the
project. Aquion’s management team has
demonstrated a successful track record in
attracting venture capital investors and
anticipates having future rounds of funding.
Incumbent Technologies Competition The primary risks in this category include
technology improvement by incumbents
and the possibility of lower-cost options
becoming available. These scenarios would
create more competition and reduce
Aquion’s competitive advantage and value
proposition in the market.
Aquion has extremely qualified and
experienced Research and Development,
Engineering, and Manufacturing teams on
board to assist the company in further
developing and improving the technology
and manufacturing process. A philosophy
of continuous innovation applied to energy
storage technology and current analysis of
the market will allow Aquion to stay ahead
of the technology curve and remain
competitive.
Aquion Energy, Inc. DE-0000226 Final Report
37
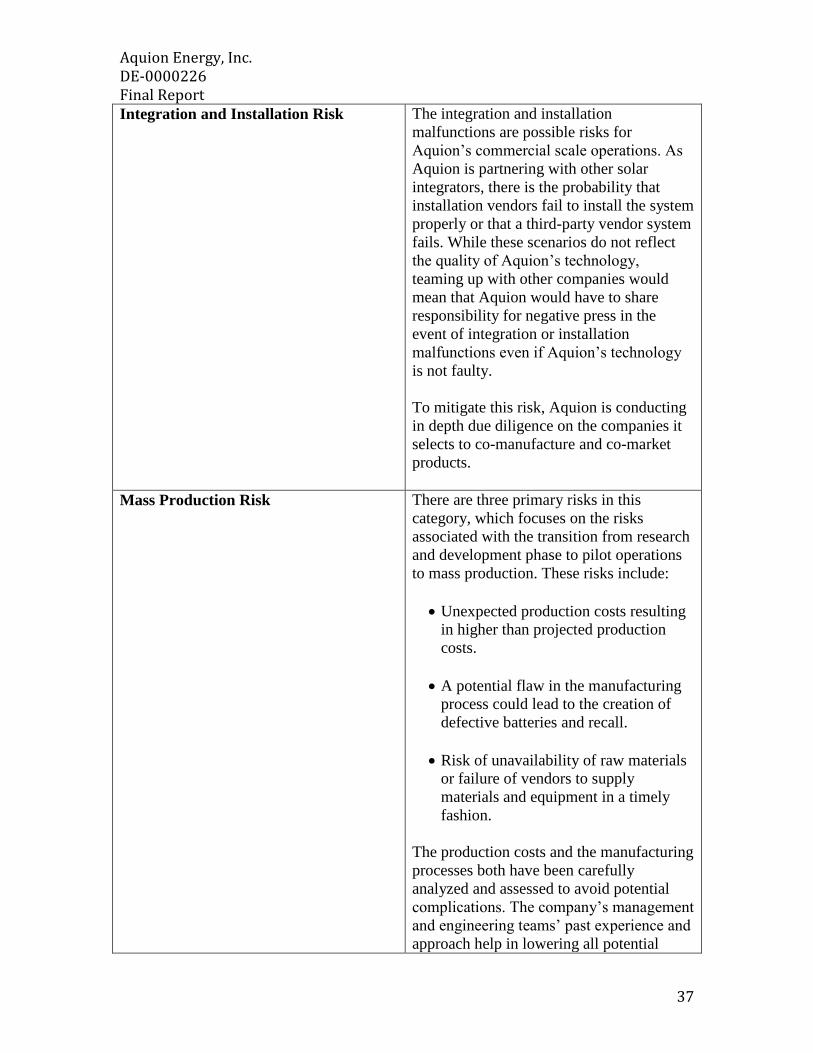
Integration and Installation Risk The integration and installation
malfunctions are possible risks for
Aquion’s commercial scale operations. As
Aquion is partnering with other solar
integrators, there is the probability that
installation vendors fail to install the system
properly or that a third-party vendor system
fails. While these scenarios do not reflect
the quality of Aquion’s technology,
teaming up with other companies would
mean that Aquion would have to share
responsibility for negative press in the
event of integration or installation
malfunctions even if Aquion’s technology
is not faulty.
To mitigate this risk, Aquion is conducting
in depth due diligence on the companies it
selects to co-manufacture and co-market
products.
Mass Production Risk There are three primary risks in this
category, which focuses on the risks
associated with the transition from research
and development phase to pilot operations
to mass production. These risks include:
Unexpected production costs resulting
in higher than projected production
costs.
A potential flaw in the manufacturing
process could lead to the creation of
defective batteries and recall.
Risk of unavailability of raw materials
or failure of vendors to supply
materials and equipment in a timely
fashion.
The production costs and the manufacturing
processes both have been carefully
analyzed and assessed to avoid potential
complications. The company’s management
and engineering teams’ past experience and
approach help in lowering all potential

Aquion Energy, Inc. DE-0000226 Final Report
38
risks.
Raw materials risk is also low as the project
will have multiple purchase orders and
guaranteed supply agreements in place for
the procurement of raw materials and
equipment.

Aquion Energy, Inc. DE-0000226 Final Report
39
Appendix 1 - Table of Figures Figure 1- Earliest Aquion Battery, A Small Coin Cell ________________________________________________________ 6 Figure 2 - Battery 0 Case ______________________________________________________________________________________ 6 Figure 3 - Dial Table In Operation ____________________________________________________________________________ 7 Figure 4 - Final Pilot Line Configuration In Operation ______________________________________________________ 8 Figure 5 - DOE Test System at Aquion Headquarters ________________________________________________________ 8 Figure 6 – Diagram showing system architecture for Aquion’s high voltage Department of Energy test system _________________________________________________________________________________________________________ 10 Figure 7 - Milestones and Completion Dates ________________________________________________________________ 11 Figure 8 - Galvanostatic, potential– -MnO2 positive electrode and an activated carbon negative electrode. ___________________________________________ 12 Figure 9 - Round trip energy efficiency as a function of cycle and C-rate for thin electrode cells. Efficiencies of up to 95% were document for a cycling rate of 2C. _________________________________________ 13 Figure 10 - Charge/discharge curve recorded from a thick electrode cell made. Total cell thickness approached 1 cm, and an electrode-level energy density of 25 Wh l-1 (kWh m-3) could be reversibly extracted in less than 5 hours of discharge. _________________________________________________________________ 14 Figure 11 - (a) Potential limited Galavnostatic charge/discharge data from a “metal free” device that used only graphite sheet for current collection. The charge/discharge current rates ranged from C/2 to C/15. (b) Plot indicating % of the C/15 rate embodied energy as a function of discharge time. ________ 15 Figure 12 - Cycle life test data. (a) Typical lifecycle test profile for a large format, thick electrode test cell cycled at ~10 hour rate. (b) Data from 700 cycles of a similar cell over 18 months of 100% DoD cycling. Little to no capacity fade is observed, and the columbic efficiency is > 99%. (c) High rate cycle life testing on a thin electrode cells; 5000 cycles without loss in initial capacity. _________________________ 16 Figure 13 - Data indicating the performance of a typical device at 60˚C over 900 hours. (a) The cell was cycled 202 times, and then left to stand at open circuit at a partial state of charge for 40 hours, followed by resumed cycling. (b) Very little to no self-discharge was observed, and no loss in function occurred as a result of the stand at partial state of charge. _____________________________________________________________ 17 Figure 14 - Data showing performance of a string of ten 0.35 Ah cells connected in series. (a) The charge
discharge voltage profile under galvanostatic conditions (C/6 rate). (b) Plot showing the uniformity of the
10 cells during testing. (c) Capacity as function of cycle, with increasing maximum state of charge
potential. The string was fully stable up to at least 2 V per cell. ____________________________________________ 19 Figure 15 - (a) Image of engineering prototype “battery 0” unit. (b) 20 hour galvanostatic discharge profile, plotted a potential vs. Wh. delivered. (c) Relationship between discharge energy density of the battery 0 electrode stack as a function of discharge time. _________________________________________________ 20 Figure 16 - System - level application-specific data showing the performance of a 60 V nominal, 2.4 kWh battery pack made of battery 0 units. This is a support profile for a diesel/PV/battery hybrid system (a) The power vs. time profile recorded from a lead-acid pack used in the field. (b) The resulting performance of the pack over 10 days of use. _______________________________________________________________ 22 Figure 17 - High Voltage test system battery stacks and inverter setup ___________________________________ 22 Figure 18 - Cycle life behavior of a thin electrode cell made with the Aquion electrochemically functional materials cycled for (a) 5000 cycles and (b) 3500 cycles. The data shown in (b) were collected from a third party test house (JME associates), who fabricated their own cells using Aquion supplied materials. The blue data (discharge time) tie to the scale to the left and the red data (discharge energy) tie to the scale to the right. The inset image shows the test fixture: a 2 cm diameter coin cell. (c) Typical charge/discharge voltage vs. capacity data for these tests showing excellent round trip columbic and energy efficiency. _____________________________________________________________________________________________ 24 Figure 19 - Cycle life performance of single cell with thick-format electrodes that are similar to those used in current production units. In this case, the unit was deeply cycled at a 6 hour rate (1.7 to 07 V) for over 1 year. Total cell capacity was approximately 250 mAh. Again, excellent cycle stability was observed. After 20 months, this unit was found to have had a non air-tight seal that resulted in electrolyte dry out and loss of function. The total thickness of the electrodes in this cell was 1 cm (anode

Aquion Energy, Inc. DE-0000226 Final Report
40
+ cathode). The inset image shows the test fixture: a 10 x 10 cm area by 1 cm thick format single cell. The right inset shows the cell voltage vs. time profile for this device. ______________________________________ 25 Figure 20 - (a) Long term cycle life test of large format “2x1” prototype cell made with production intent electrode pellets arranged in production intent “stacked prismatic” configuration encased in a custom polypropylene fixture. Some capacity loss was observed over the first few hundred cycles, however performance has been stable since. This test is ongoing and has been underway for approximately 20 months. A white line has been overlayed onto the data from cycle 550 to 1000 to aid the eye in seeing that there was essentially no net loss in delivered capacity through these cycles. The inset image shows the test fixture: a custom-designed and machined polypropylene casing that contains multiple layers of electrode pellets connected in a true prismatic configuration. The external dimensions of this unit are approximately 10 x 5 x 7 cm. (b) Voltage vs. time profile typical for this device under long term test. _ 26 Figure 21 - Rapid cycling from an early “Battery 0” engineering prototype (30 minute rate). The discontinuities at cycles 100, 220, and 360 are due to improved electrical contacting and a slight broadening of the voltage window, which was 1.8 to 0.7 V. ________________________________________________ 27 Figure 22 - Deep discharge (6 hour rate) cycling from early “Battery 0” engineering prototype, cycling from 1.7 to 0.7 V. A line has been added to aid the eye in assessing long term stability. The discontinuities in both plots are due to terminal cleaning events to remove salt build-up and associated contact resistance from the terminals. This kind of upkeep is not necessary in our product class devices and is due to a known electrolyte leakage issue with the Battery 0 terminal design. These tests are both currently ongoing, and were started in June 2011. The inset image shows the test fixture: the Battery 0 engineering prototype. _______________________________________________________________________________________ 28 Figure 23 - (a) the voltage vs. time response to the PSOC test profile consisting of 6 minute constant current pulses of +/- 9 A imposed on 4 battery 0 units connected in series. A high degree of polarization is observed, however the profile is extremely stable. (b) Constant current (4) reference discharge cycle performed prior to the PSOC testing and after approximately 3200 PSOC cycles. There is virtually no difference between the before and after tests; the 4 battery 0 units did not significantly degrade as a result of the PSOC cycling. (c) Cycle life performance of this unit (4 battery 0’s in series) after a year of rapid PSOC cycling. The unit is very stable and delivers consistent capacity. _____________________________ 29 Figure 24 - Manufacturing Plans for the Future ____________________________________________________________ 31 Figure 25 - Example Solutions and Applications ____________________________________________________________ 33
Aquion Energy, Inc. DE-0000226 Final Report
41
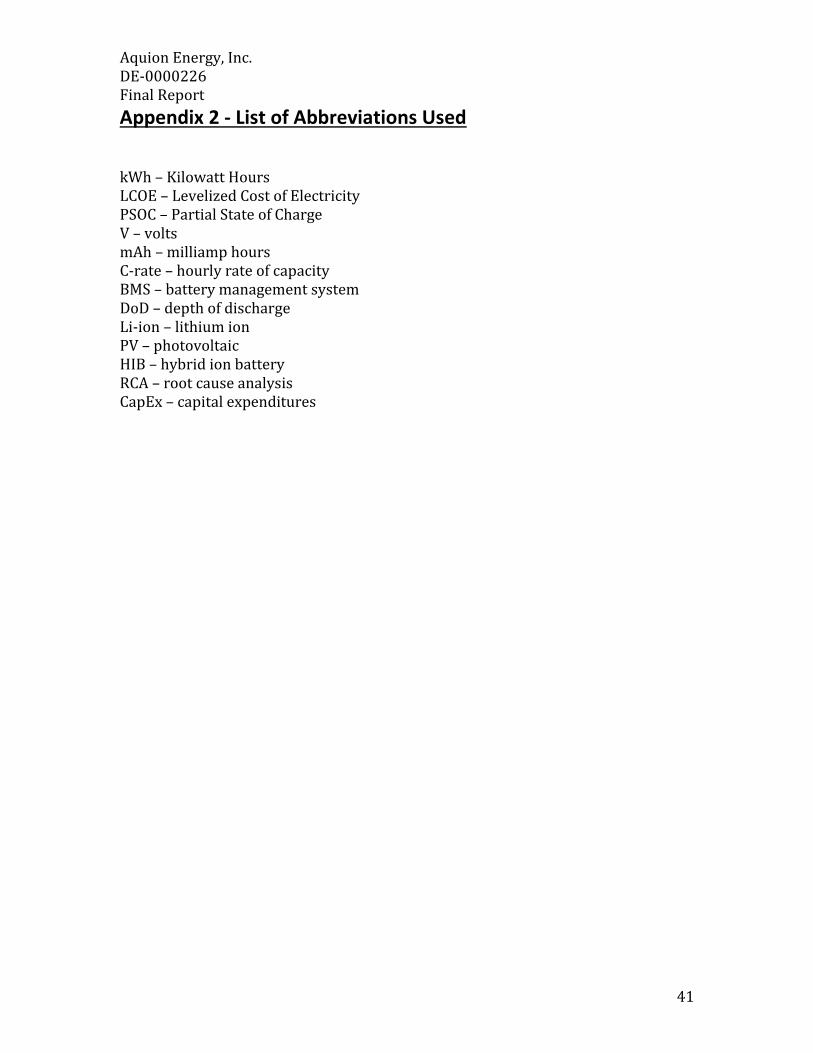
Appendix 2 - List of Abbreviations Used kWh – Kilowatt Hours LCOE – Levelized Cost of Electricity PSOC – Partial State of Charge V – volts mAh – milliamp hours C-rate – hourly rate of capacity BMS – battery management system DoD – depth of discharge Li-ion – lithium ion PV – photovoltaic HIB – hybrid ion battery RCA – root cause analysis CapEx – capital expenditures