Embed Size (px)
Citation preview
AQUEOUS PHASE BASE-FACILITATED REFORMING (BFR) OF RENEWABLE FUELS
Brian D. James (PI) and Julie PerezDirected Technologies, Inc.
2010 DOE Hydrogen Program Annual Merit Review
7 June 2010
1
Project ID # PD063
This presentation does not contain any proprietary, confidential, or otherwise restricted information
PROJECT OVERVIEW
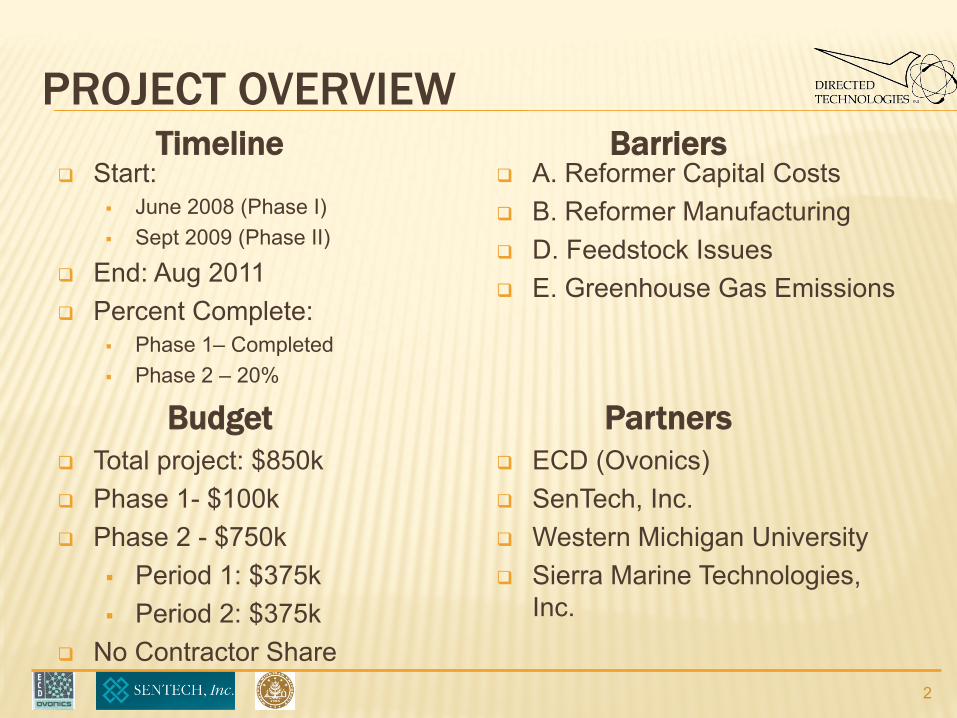
Start: June 2008 (Phase I) Sept 2009 (Phase II)
End: Aug 2011 Percent Complete:
Phase 1– Completed Phase 2 – 20%
A. Reformer Capital Costs B. Reformer Manufacturing D. Feedstock Issues E. Greenhouse Gas Emissions
2
Total project: $850k Phase 1- $100k Phase 2 - $750k
Period 1: $375k Period 2: $375k
No Contractor Share
Timeline Barriers
Budget Partners ECD (Ovonics) SenTech, Inc. Western Michigan University Sierra Marine Technologies,
Inc.
OBJECTIVES & RELEVANCE
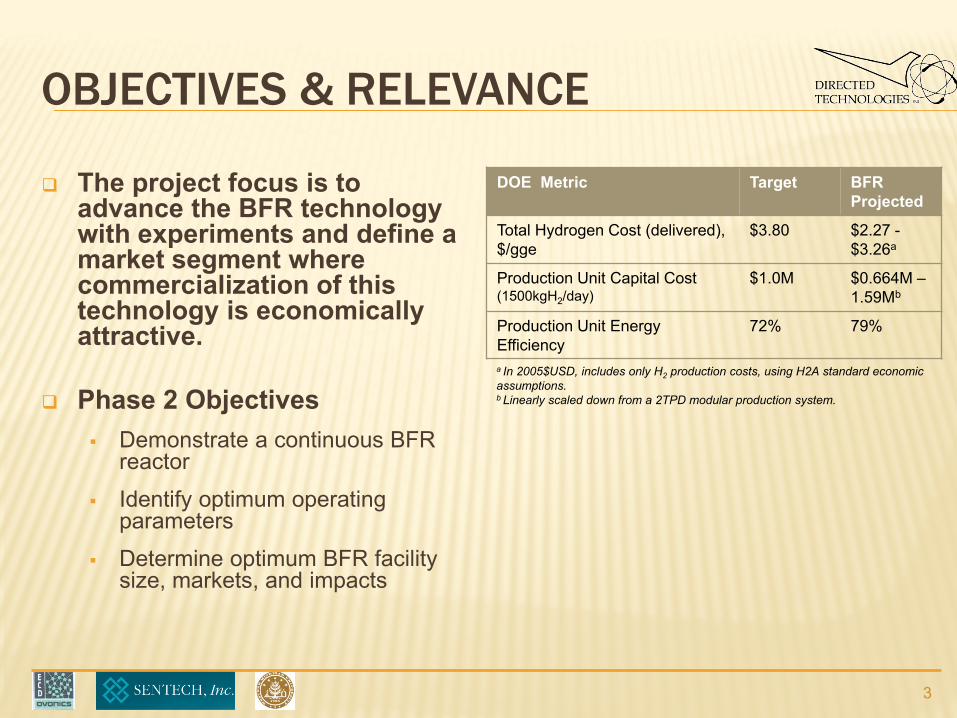
The project focus is to advance the BFR technology with experiments and define a market segment where commercialization of this technology is economically attractive.
Phase 2 Objectives Demonstrate a continuous BFR
reactor
Identify optimum operating parameters
Determine optimum BFR facility size, markets, and impacts
DOE Metric Target BFR Projected
Total Hydrogen Cost (delivered), $/gge
$3.80 $2.27 -$3.26a
Production Unit Capital Cost(1500kgH2/day)
$1.0M $0.664M –1.59Mb
Production Unit Energy Efficiency
72% 79%
3
a In 2005$USD, includes only H2 production costs, using H2A standard economic assumptions.b Linearly scaled down from a 2TPD modular production system.
ADDRESSING BARRIERS
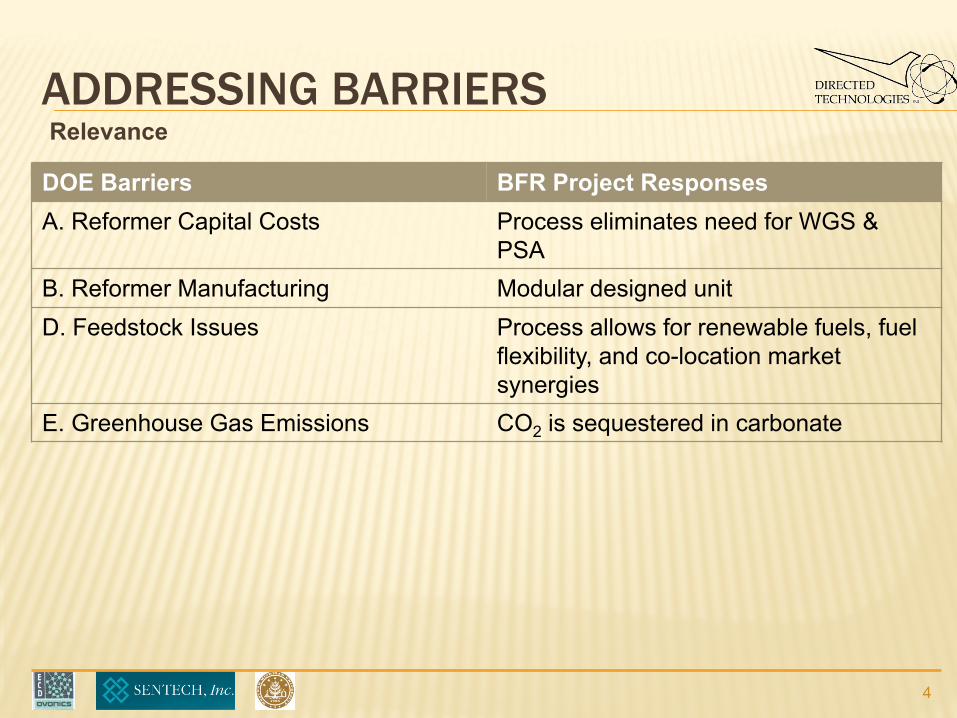
DOE Barriers BFR Project ResponsesA. Reformer Capital Costs Process eliminates need for WGS &
PSAB. Reformer Manufacturing Modular designed unitD. Feedstock Issues Process allows for renewable fuels, fuel
flexibility, and co-location market synergies
E. Greenhouse Gas Emissions CO2 is sequestered in carbonate
4
Relevance
BFR PROCESS MAIN FEATURES
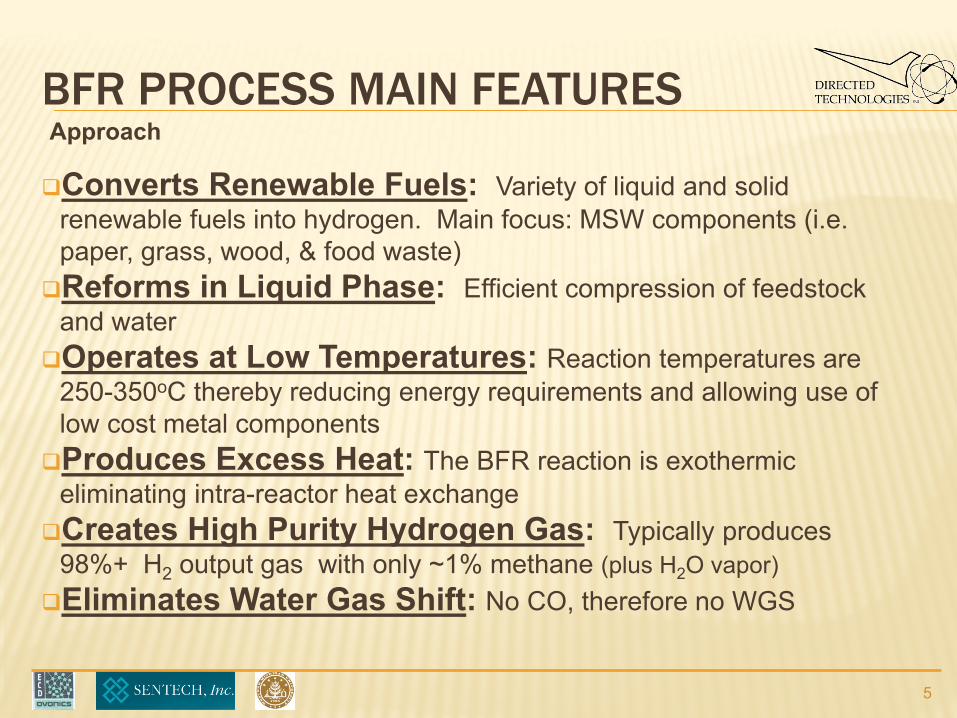
Converts Renewable Fuels: Variety of liquid and solid renewable fuels into hydrogen. Main focus: MSW components (i.e. paper, grass, wood, & food waste)Reforms in Liquid Phase: Efficient compression of feedstock
and water Operates at Low Temperatures: Reaction temperatures are
250-350oC thereby reducing energy requirements and allowing use of low cost metal components Produces Excess Heat: The BFR reaction is exothermic
eliminating intra-reactor heat exchangeCreates High Purity Hydrogen Gas: Typically produces
98%+ H2 output gas with only ~1% methane (plus H2O vapor)Eliminates Water Gas Shift: No CO, therefore no WGS
5
Approach
BASIC REACTIONS
6
Approach
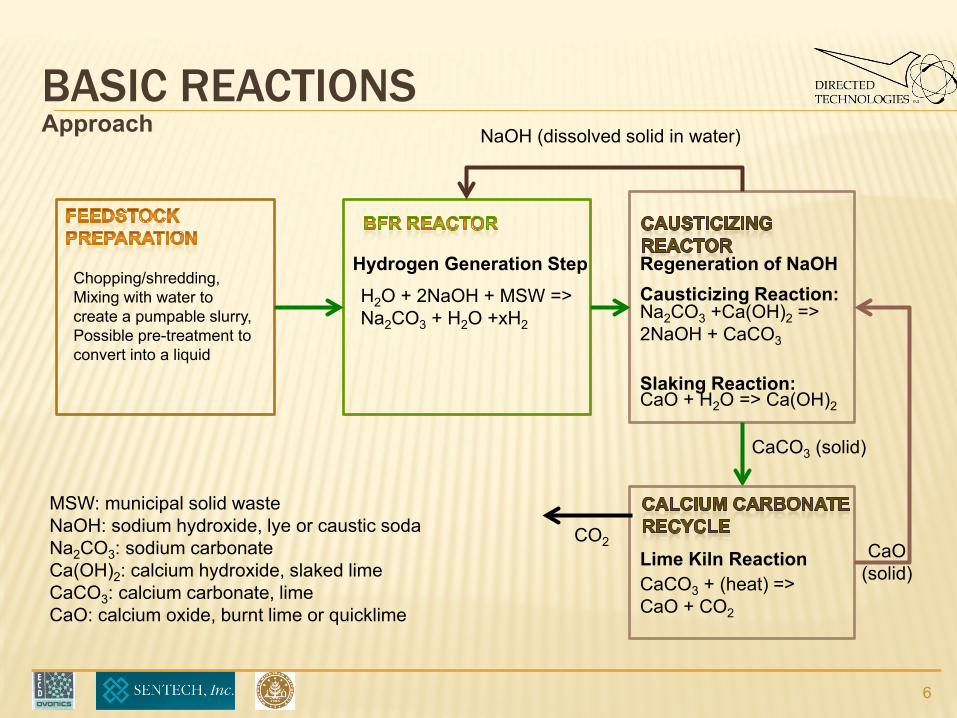
Hydrogen Generation Step
Lime Kiln Reaction
Regeneration of NaOHCausticizing Reaction:
Slaking Reaction:
H2O + 2NaOH + MSW => Na2CO3 + H2O +xH2
CaO(solid)
CO2
CaCO3 + (heat) => CaO + CO2
CaO + H2O => Ca(OH)2
Na2CO3 +Ca(OH)2 => 2NaOH + CaCO3
CaCO3 (solid)
NaOH (dissolved solid in water)
Chopping/shredding,Mixing with water to create a pumpable slurry,Possible pre-treatment to convert into a liquid
MSW: municipal solid wasteNaOH: sodium hydroxide, lye or caustic sodaNa2CO3: sodium carbonateCa(OH)2: calcium hydroxide, slaked limeCaCO3: calcium carbonate, limeCaO: calcium oxide, burnt lime or quicklime
UNIQUENESS & CHALLENGES
UNIQUE ATTRIBUTES PROCESS CHALLENGES AT PROJECT START
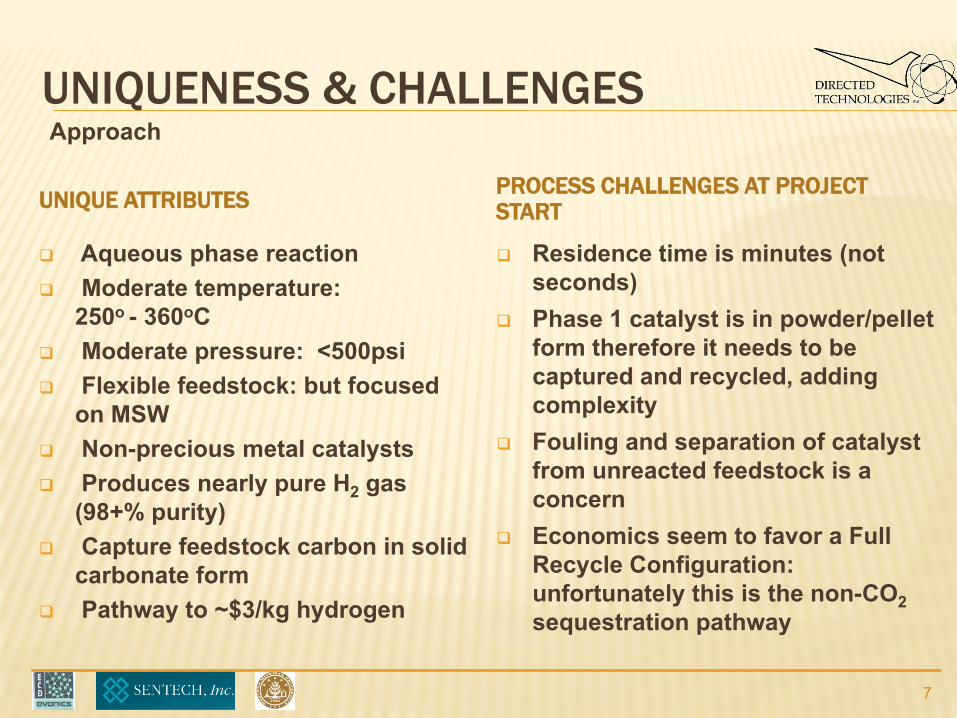
Aqueous phase reaction Moderate temperature:
250o - 360oC Moderate pressure: <500psi Flexible feedstock: but focused
on MSW Non-precious metal catalysts Produces nearly pure H2 gas
(98+% purity) Capture feedstock carbon in solid
carbonate form Pathway to ~$3/kg hydrogen
Residence time is minutes (not seconds)
Phase 1 catalyst is in powder/pellet form therefore it needs to be captured and recycled, adding complexity
Fouling and separation of catalyst from unreacted feedstock is a concern
Economics seem to favor a Full Recycle Configuration: unfortunately this is the non-CO2sequestration pathway
7
Approach
APPROACH
8
Task 8Prototype Separation System
Task 9Precipitator Design Studies
Task 12Catalyst Lifetime & Rejuvenation Studies
Task 10 Analysis of Potential Markets
Task 11Commercial BFR Process Scale Up
Task 7Prototype Reactor System
Task 6BenchtopContinuous Reactor
Task dependencies ( )
Period 1 Milestones
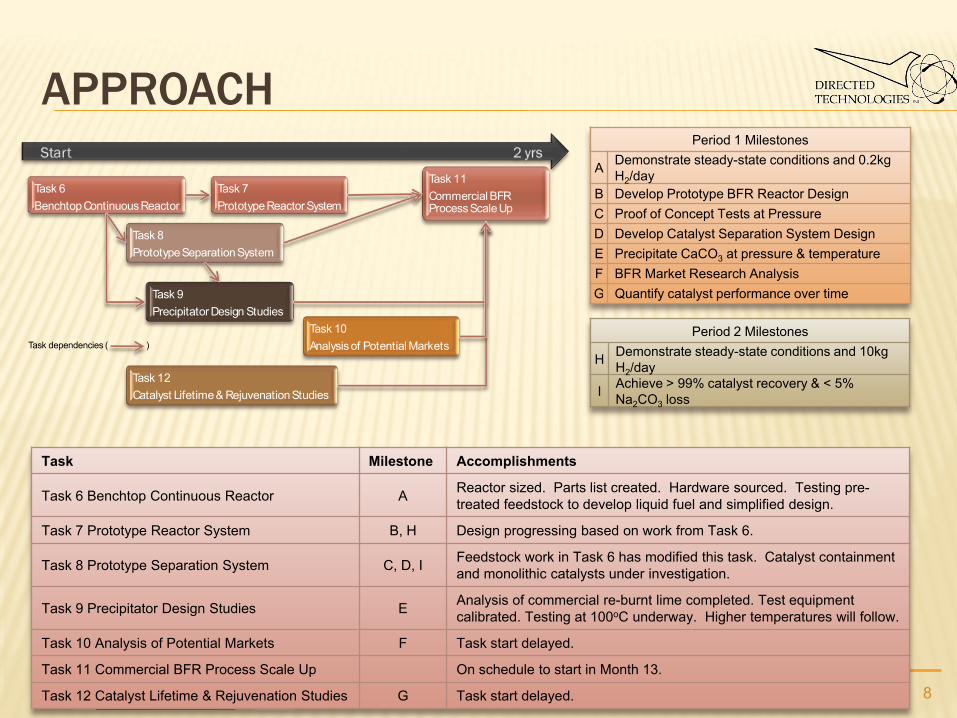
A Demonstrate steady-state conditions and 0.2kg H2/day
B Develop Prototype BFR Reactor DesignC Proof of Concept Tests at PressureD Develop Catalyst Separation System DesignE Precipitate CaCO3 at pressure & temperatureF BFR Market Research AnalysisG Quantify catalyst performance over time
Period 2 Milestones
H Demonstrate steady-state conditions and 10kg H2/day
I Achieve > 99% catalyst recovery & < 5% Na2CO3 loss
Task Milestone Accomplishments
Task 6 Benchtop Continuous Reactor A Reactor sized. Parts list created. Hardware sourced. Testing pre-treated feedstock to develop liquid fuel and simplified design.
Task 7 Prototype Reactor System B, H Design progressing based on work from Task 6.
Task 8 Prototype Separation System C, D, I Feedstock work in Task 6 has modified this task. Catalyst containment and monolithic catalysts under investigation.
Task 9 Precipitator Design Studies E Analysis of commercial re-burnt lime completed. Test equipment calibrated. Testing at 100oC underway. Higher temperatures will follow.
Task 10 Analysis of Potential Markets F Task start delayed.
Task 11 Commercial BFR Process Scale Up On schedule to start in Month 13.
Task 12 Catalyst Lifetime & Rejuvenation Studies G Task start delayed.
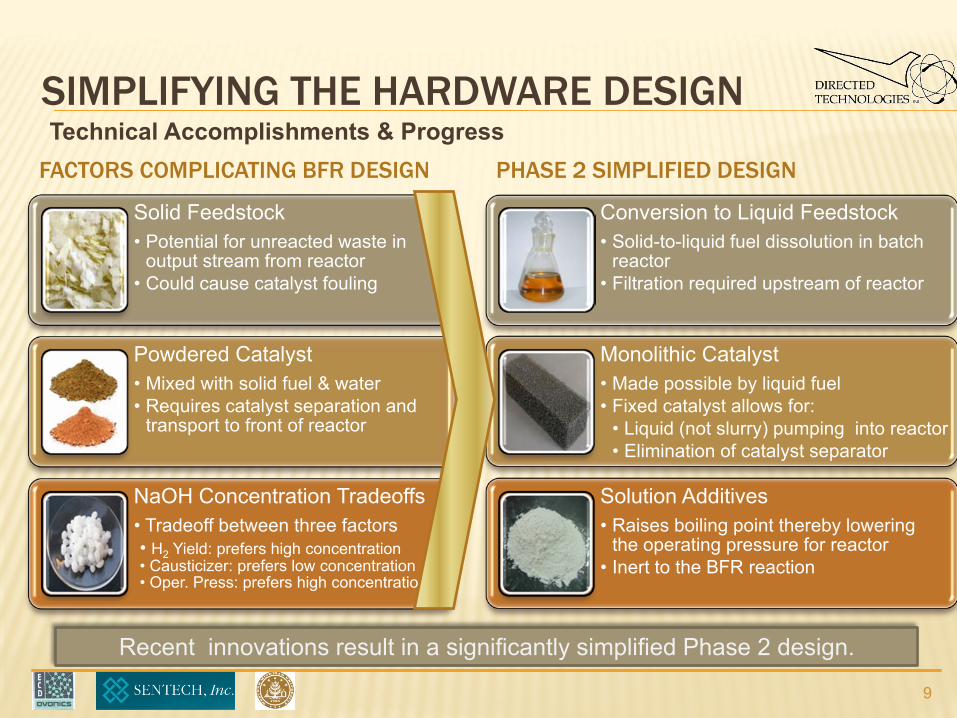
SIMPLIFYING THE HARDWARE DESIGN
FACTORS COMPLICATING BFR DESIGN PHASE 2 SIMPLIFIED DESIGN
Solid Feedstock• Potential for unreacted waste in
output stream from reactor• Could cause catalyst fouling
Powdered Catalyst• Mixed with solid fuel & water• Requires catalyst separation and
transport to front of reactor
NaOH Concentration Tradeoffs• Tradeoff between three factors• H2 Yield: prefers high concentration• Causticizer: prefers low concentration• Oper. Press: prefers high concentration
Conversion to Liquid Feedstock• Solid-to-liquid fuel dissolution in batch
reactor• Filtration required upstream of reactor
Monolithic Catalyst• Made possible by liquid fuel• Fixed catalyst allows for:• Liquid (not slurry) pumping into reactor• Elimination of catalyst separator
Solution Additives• Raises boiling point thereby lowering
the operating pressure for reactor• Inert to the BFR reaction
9
Technical Accomplishments & Progress
Recent innovations result in a significantly simplified Phase 2 design.
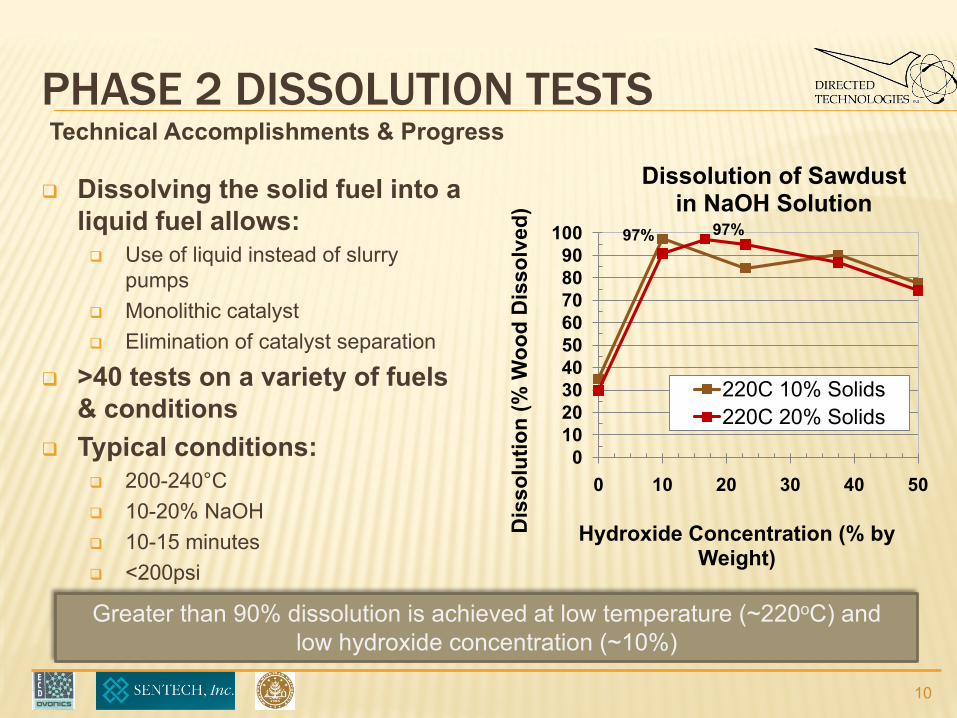
PHASE 2 DISSOLUTION TESTS
Dissolving the solid fuel into a liquid fuel allows: Use of liquid instead of slurry
pumps Monolithic catalyst Elimination of catalyst separation
>40 tests on a variety of fuels & conditions
Typical conditions: 200-240°C 10-20% NaOH 10-15 minutes <200psi
10
Greater than 90% dissolution is achieved at low temperature (~220oC) and low hydroxide concentration (~10%)
Technical Accomplishments & Progress
97% 97%
0102030405060708090
100
0 10 20 30 40 50
Dis
solu
tion
(% W
ood
Dis
solv
ed)
Hydroxide Concentration (% by Weight)
Dissolution of Sawdust in NaOH Solution
220C 10% Solids220C 20% Solids
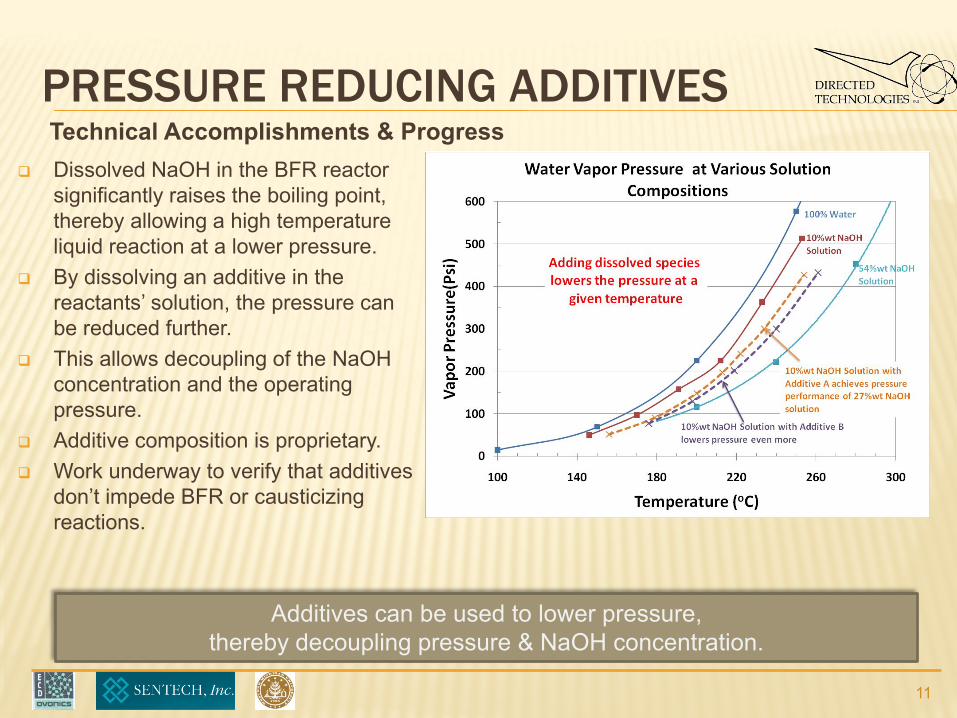
PRESSURE REDUCING ADDITIVES
11
Technical Accomplishments & Progress
Additives can be used to lower pressure, thereby decoupling pressure & NaOH concentration.
Dissolved NaOH in the BFR reactor significantly raises the boiling point, thereby allowing a high temperature liquid reaction at a lower pressure.
By dissolving an additive in the reactants’ solution, the pressure can be reduced further.
This allows decoupling of the NaOHconcentration and the operating pressure.
Additive composition is proprietary. Work underway to verify that additives
don’t impede BFR or causticizingreactions.
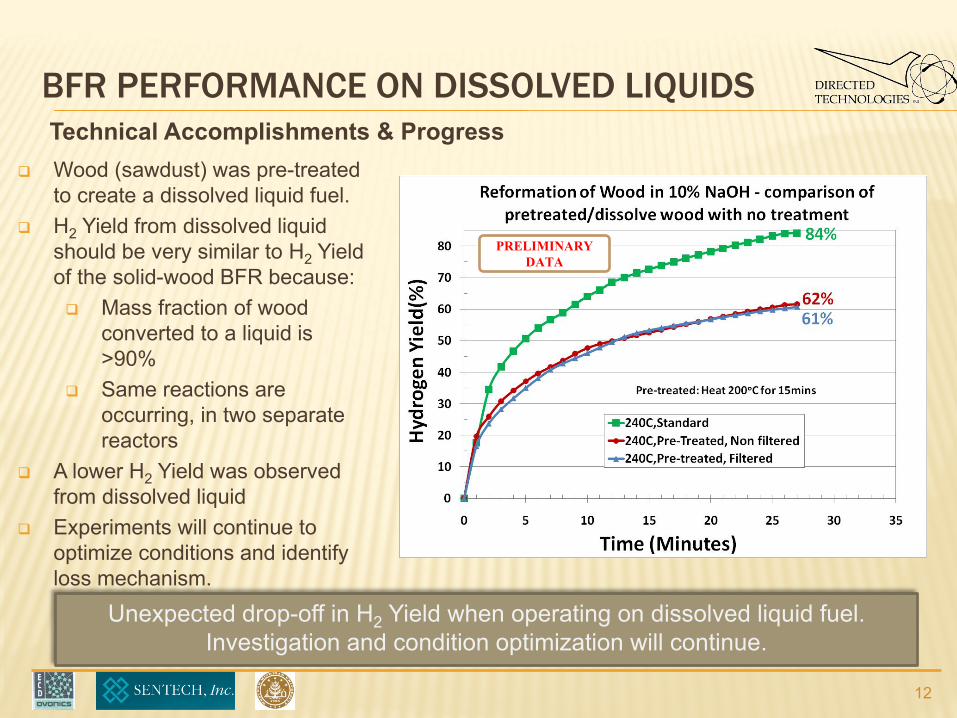
BFR PERFORMANCE ON DISSOLVED LIQUIDS
12
Technical Accomplishments & Progress
Unexpected drop-off in H2 Yield when operating on dissolved liquid fuel. Investigation and condition optimization will continue.
Wood (sawdust) was pre-treated to create a dissolved liquid fuel.
H2 Yield from dissolved liquid should be very similar to H2 Yield of the solid-wood BFR because: Mass fraction of wood
converted to a liquid is >90%
Same reactions are occurring, in two separate reactors
A lower H2 Yield was observed from dissolved liquid
Experiments will continue to optimize conditions and identify loss mechanism.
PRELIMINARY DATA
65%
70%
75%
80%
85%
90%
95%
100 150 200
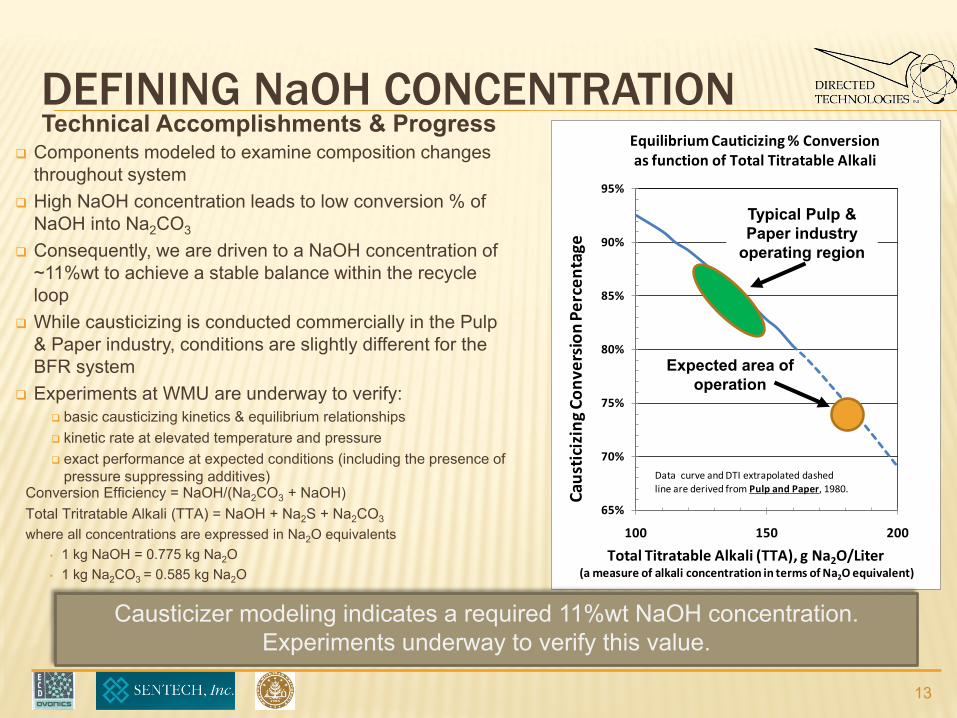
Data curve and DTI extrapolated dashed line are derived from Pulp and Paper, 1980.
Equilibrium Cauticizing % Conversion as function of Total Titratable Alkali
Total Titratable Alkali (TTA), g Na2O/Liter(a measure of alkali concentration in terms of Na2O equivalent)
Caus
tici
zing
Con
vers
ion
Perc
enta
ge
DEFINING NaOH CONCENTRATION
13
Causticizer modeling indicates a required 11%wt NaOH concentration.Experiments underway to verify this value.
Technical Accomplishments & Progress Components modeled to examine composition changes
throughout system High NaOH concentration leads to low conversion % of
NaOH into Na2CO3
Consequently, we are driven to a NaOH concentration of ~11%wt to achieve a stable balance within the recycle loop
While causticizing is conducted commercially in the Pulp & Paper industry, conditions are slightly different for the BFR system
Experiments at WMU are underway to verify: basic causticizing kinetics & equilibrium relationships kinetic rate at elevated temperature and pressure exact performance at expected conditions (including the presence of
pressure suppressing additives)Conversion Efficiency = NaOH/(Na2CO3 + NaOH)Total Tritratable Alkali (TTA) = NaOH + Na2S + Na2CO3
where all concentrations are expressed in Na2O equivalents• 1 kg NaOH = 0.775 kg Na2O• 1 kg Na2CO3 = 0.585 kg Na2O
Expected area of operation
Typical Pulp & Paper industry
operating region
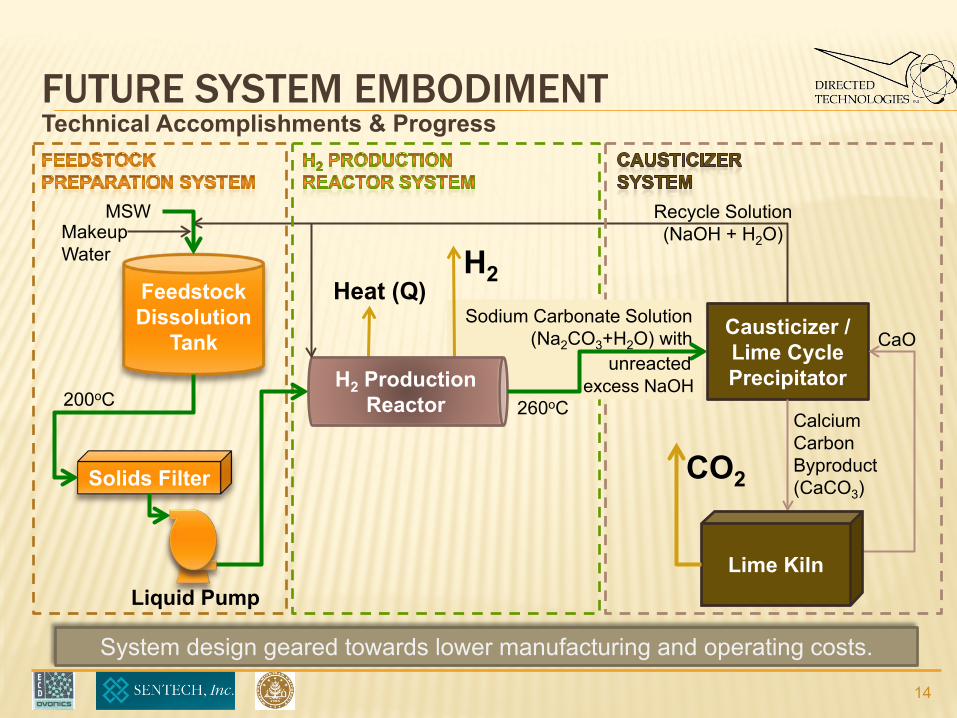
FUTURE SYSTEM EMBODIMENT
System design geared towards lower manufacturing and operating costs.
Feedstock Dissolution
TankCausticizer / Lime Cycle Precipitator
Liquid Pump
MSW Recycle Solution (NaOH + H2O)
CaO
Calcium Carbon Byproduct (CaCO3)
Sodium Carbonate Solution(Na2CO3+H2O) with
excess NaOH
H2Heat (Q)
200oC
Solids Filter
260oC H2 Production
Reactor
Makeup Water
Lime Kiln
CO2
14
Technical Accomplishments & Progress
unreacted
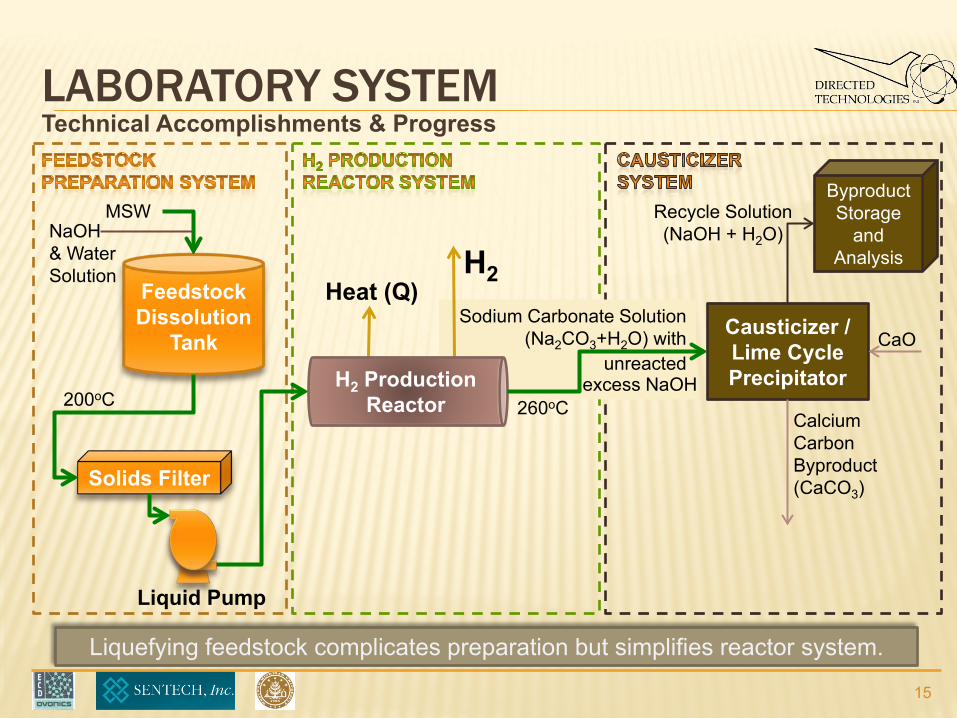
LABORATORY SYSTEM
Liquefying feedstock complicates preparation but simplifies reactor system.
Feedstock Dissolution
TankCausticizer / Lime Cycle Precipitator
Liquid Pump
MSW Recycle Solution (NaOH + H2O)
CaO
Calcium Carbon Byproduct (CaCO3)
Sodium Carbonate Solution(Na2CO3+H2O) with
unreactedexcess NaOH
H2Heat (Q)
200oC
Solids Filter
260oC H2 Production
Reactor
Byproduct Storage
and Analysis
NaOH& Water Solution
15
Technical Accomplishments & Progress
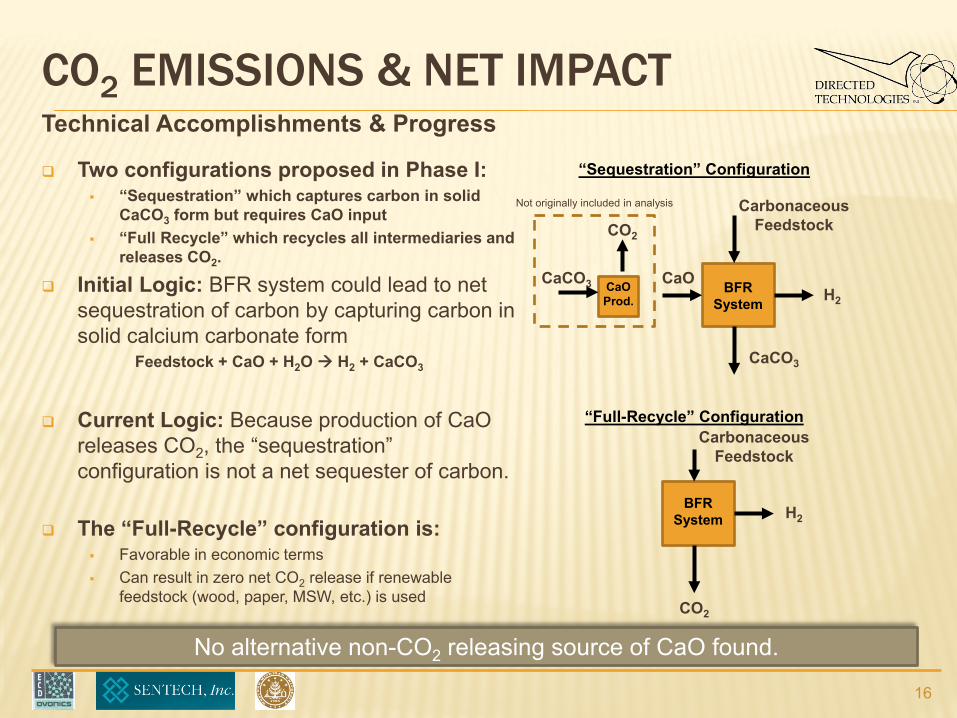
CO2 EMISSIONS & NET IMPACT
Two configurations proposed in Phase I: “Sequestration” which captures carbon in solid
CaCO3 form but requires CaO input “Full Recycle” which recycles all intermediaries and
releases CO2.
Initial Logic: BFR system could lead to net sequestration of carbon by capturing carbon in solid calcium carbonate form
Feedstock + CaO + H2O H2 + CaCO3
Current Logic: Because production of CaOreleases CO2, the “sequestration” configuration is not a net sequester of carbon.
The “Full-Recycle” configuration is: Favorable in economic terms Can result in zero net CO2 release if renewable
feedstock (wood, paper, MSW, etc.) is used
No alternative non-CO2 releasing source of CaO found.
16
Technical Accomplishments & Progress
Carbonaceous Feedstock
H2
CaO
CaCO3
CaCO3
CO2
“Sequestration” Configuration
H2
CO2
Carbonaceous Feedstock
“Full-Recycle” Configuration
BFRSystem
BFRSystem
CaOProd.
Not originally included in analysis
COLLABORATIONS
FOR BOTH PHASE I AND PHASE II: NEW FOR PHASE II:
ECD/Ovonics Subcontractor ECD is technology originator/patent-holder
Ben Reichman/Willy Mays BFR concept development BFR experiments Fabrication
Sentech, Inc. Subcontractor Elvin Yuzugullu lead Marketplace analysis Macroeconomic analysis
Western Michigan University Subcontractor Prof. John Cameron Pulp & Paper expertise Causticizer configuration design Causticizer operating conditions
Sierra Marine Technologies Subcontractor Prototyping Custom fabrication
17
PROPOSED FUTURE WORK
FY10 FY11
H2 generation experiments in a continuous flow-through reactor Produce 0.2kg H2/day
Design fixed catalyst bed Study other causticizer options Begin evaluation of catalyst lifetime Investigate design option where
NaOH concentration can be changed between reactor and causticizer
Increase scale of continuous reactor Produce 10kg H2/day
Study commercial and market options
Optimize causticizer design Develop commercial integrated
system design
18
SUMMARY Relevance
Project aims at reducing petroleum use by developing and validating a hydrogen production method using renewable feedstock (e.g. MSW)
Approach Design and test a continuous aqueous reactor based on Base Facilitated Reforming
(BFR) and determine optimum operating conditions Technical Accomplishments & Progress
Developed conceptual process designs Conducted feedstock dissolution experiments (pre-treatment to dissolve solid fuel into a liquid fuel)
Improved/Simplify system to reflect feedstock dissolution to liquid fuel Overall process and operating conditions optimization Modeling of causticizer system and initiation of bench-top experiments
Collaborations Active partnership with ECD, SenTech, WMU, and Sierra Marine Technologies
Proposed Future Research (2nd year of Phase 2 SBIR grant) Fabricate and assemble continuous-flow BFR reactor and test at various operating
parameters (10kg H2/day)
19
SUPPLEMENTAL SLIDES(AND PHASE 1 RESULTS)
20
MYPP MILESTONES
Task 2: Distributed Reforming of Renewable Liquid Feedstocks
4 Down-select research for distributed production from distributed renewable liquids. (4Q, 2010)
5 Verify feasibility of achieving $3.80/gge (delivered) from distributed renewable liquids. (4Q, 2012)
6 Verify feasibility of achieving less than $3.00/gge (delivered) from bio-derived renewable liquid fuels (4Q, 2017)
21
BFR AND KRAFT PROCESS SIMILARITIES
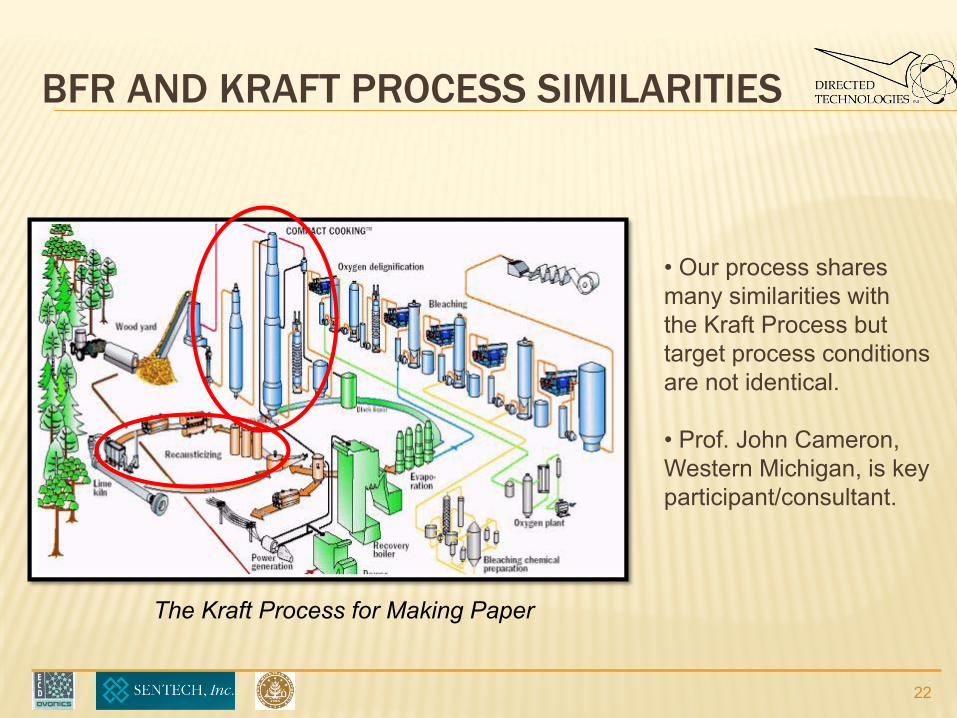
The Kraft Process for Making Paper
22
• Our process shares many similarities with the Kraft Process but target process conditions are not identical.
• Prof. John Cameron, Western Michigan, is key participant/consultant.
PHASE 2 FEEDSTOCK PREPARATION EXPERIMENTS
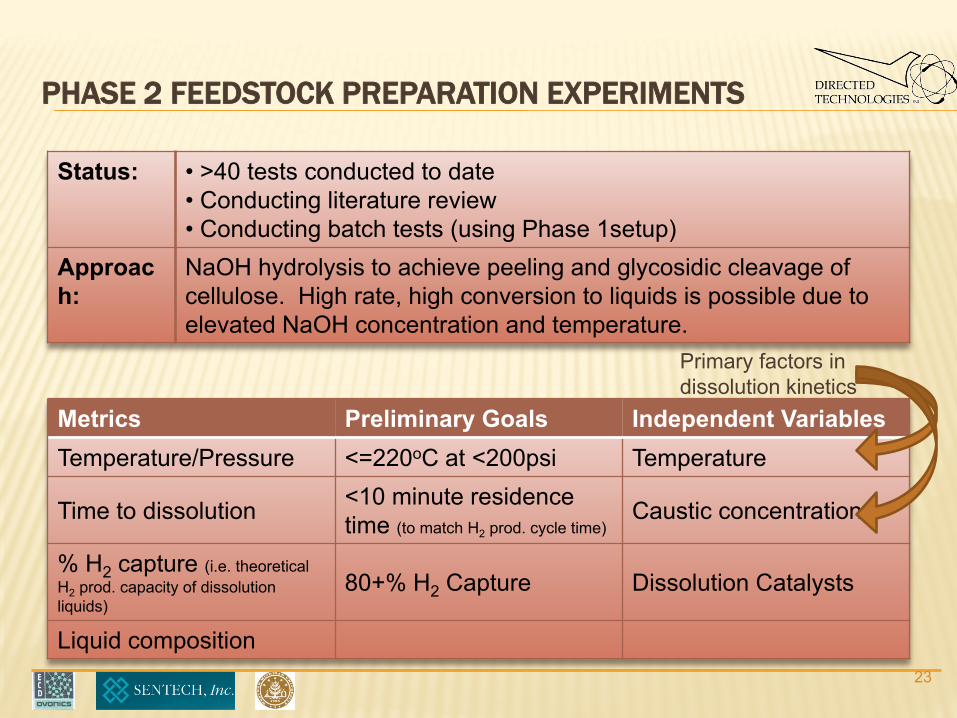
Status: • >40 tests conducted to date• Conducting literature review• Conducting batch tests (using Phase 1setup)
Approach:
NaOH hydrolysis to achieve peeling and glycosidic cleavage of cellulose. High rate, high conversion to liquids is possible due to elevated NaOH concentration and temperature.
Metrics Preliminary Goals Independent VariablesTemperature/Pressure <=220oC at <200psi Temperature
Time to dissolution <10 minute residence time (to match H2 prod. cycle time)
Caustic concentration
% H2 capture (i.e. theoretical H2 prod. capacity of dissolution liquids)
80+% H2 Capture Dissolution Catalysts
Liquid composition
Primary factors in dissolution kinetics
23
PHASE 2 FEEDSTOCK DISSOLUTION
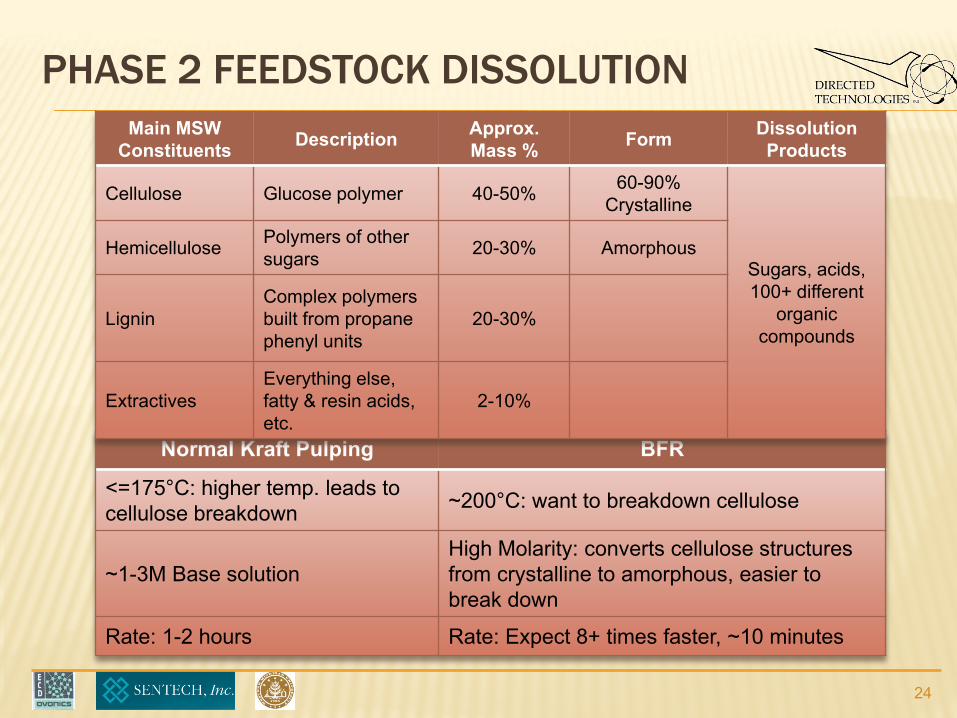
Normal Kraft Pulping BFR
<=175°C: higher temp. leads to cellulose breakdown ~200°C: want to breakdown cellulose
~1-3M Base solutionHigh Molarity: converts cellulose structures from crystalline to amorphous, easier to break down
Rate: 1-2 hours Rate: Expect 8+ times faster, ~10 minutes
24
Main MSW Constituents Description Approx.
Mass % Form Dissolution Products
Cellulose Glucose polymer 40-50% 60-90% Crystalline
Sugars, acids,100+ different
organic compounds
Hemicellulose Polymers of othersugars 20-30% Amorphous
LigninComplex polymers built from propane phenyl units
20-30%
ExtractivesEverything else, fatty & resin acids, etc.
2-10%
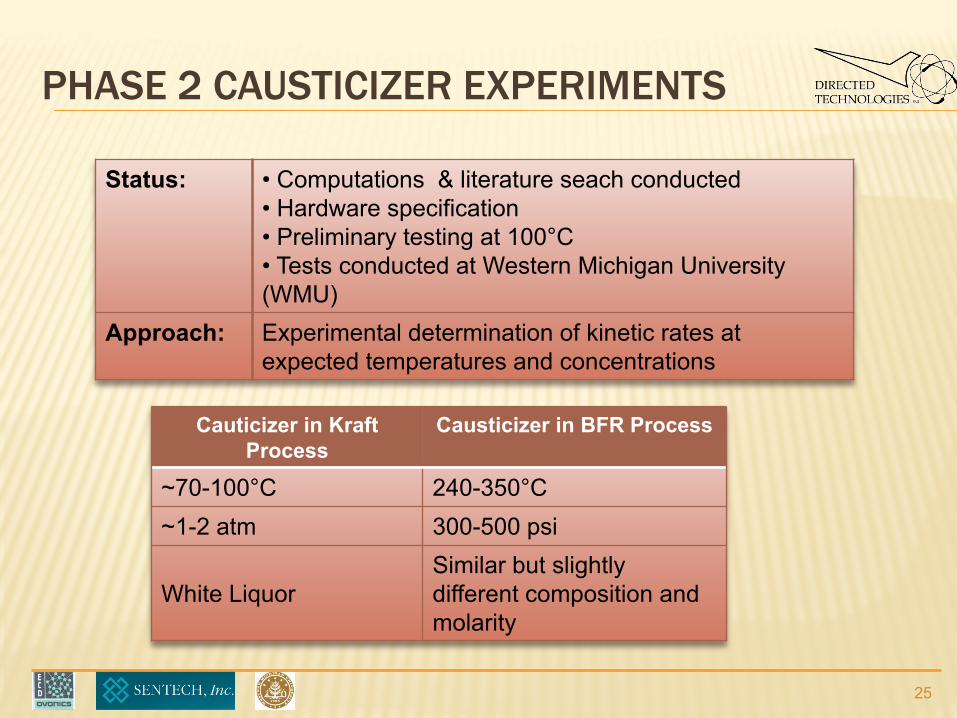
PHASE 2 CAUSTICIZER EXPERIMENTS
Status: • Computations & literature seach conducted• Hardware specification• Preliminary testing at 100°C• Tests conducted at Western Michigan University (WMU)
Approach: Experimental determination of kinetic rates at expected temperatures and concentrations
Cauticizer in Kraft Process
Causticizer in BFR Process
~70-100°C 240-350°C~1-2 atm 300-500 psi
White LiquorSimilar but slightly different composition and molarity
25
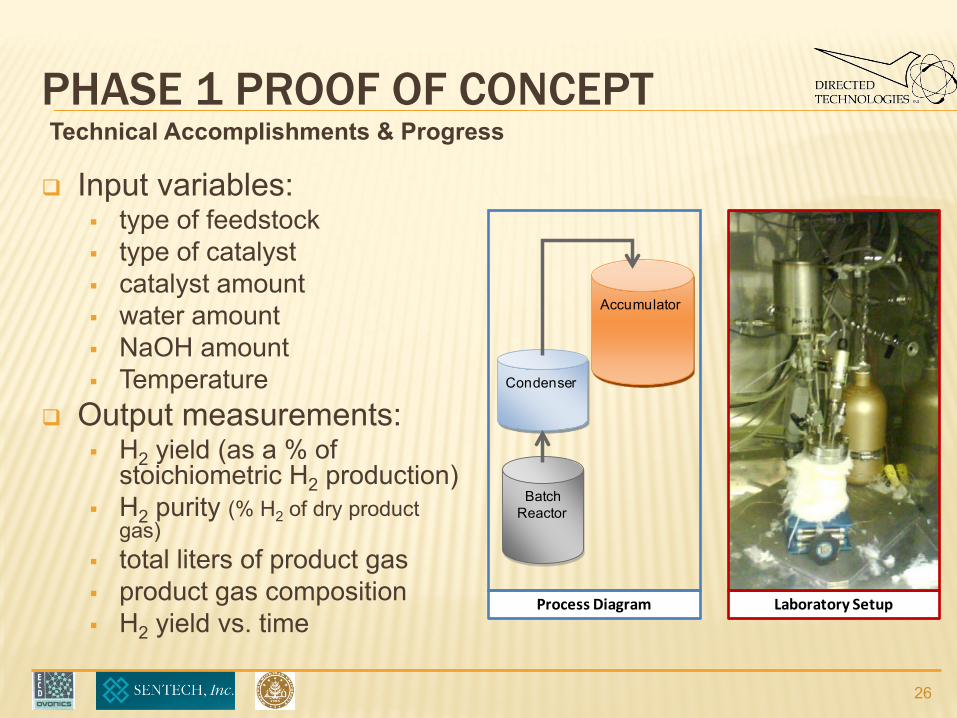
PHASE 1 PROOF OF CONCEPT
Input variables: type of feedstock type of catalyst catalyst amount water amount NaOH amount Temperature
Output measurements: H2 yield (as a % of
stoichiometric H2 production) H2 purity (% H2 of dry product
gas) total liters of product gas product gas composition H2 yield vs. time
Process Diagram Laboratory Setup
BatchReactor
Accumulator
Condenser
26
Technical Accomplishments & Progress
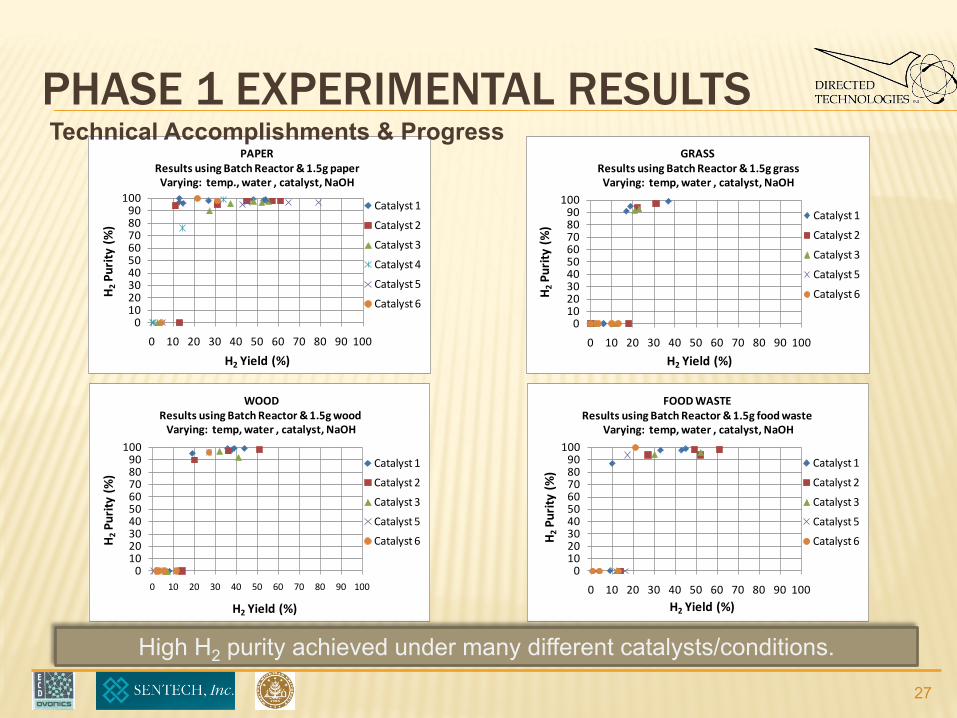
PHASE 1 EXPERIMENTAL RESULTS
0102030405060708090
100
0 10 20 30 40 50 60 70 80 90 100
Catalyst 1
Catalyst 2
Catalyst 3
Catalyst 4
Catalyst 5
Catalyst 6
H2 Yield (%)
H2
Puri
ty (
%)
PAPERResults using Batch Reactor & 1.5g paperVarying: temp., water , catalyst, NaOH
0102030405060708090
100
0 10 20 30 40 50 60 70 80 90 100
Catalyst 1
Catalyst 2
Catalyst 3
Catalyst 5
Catalyst 6
H2 Yield (%)
H2
Puri
ty (
%)
GRASS Results using Batch Reactor & 1.5g grassVarying: temp, water , catalyst, NaOH
27
0102030405060708090
100
0 10 20 30 40 50 60 70 80 90 100
Catalyst 1
Catalyst 2
Catalyst 3
Catalyst 5
Catalyst 6
H2 Yield (%)
H2
Puri
ty (
%)
WOODResults using Batch Reactor & 1.5g wood
Varying: temp, water , catalyst, NaOH
0102030405060708090
100
0 10 20 30 40 50 60 70 80 90 100
Catalyst 1
Catalyst 2
Catalyst 3
Catalyst 5
Catalyst 6
H2 Yield (%)
H2
Puri
ty (
%)
FOOD WASTE Results using Batch Reactor & 1.5g food waste
Varying: temp, water , catalyst, NaOH
High H2 purity achieved under many different catalysts/conditions.
Technical Accomplishments & Progress
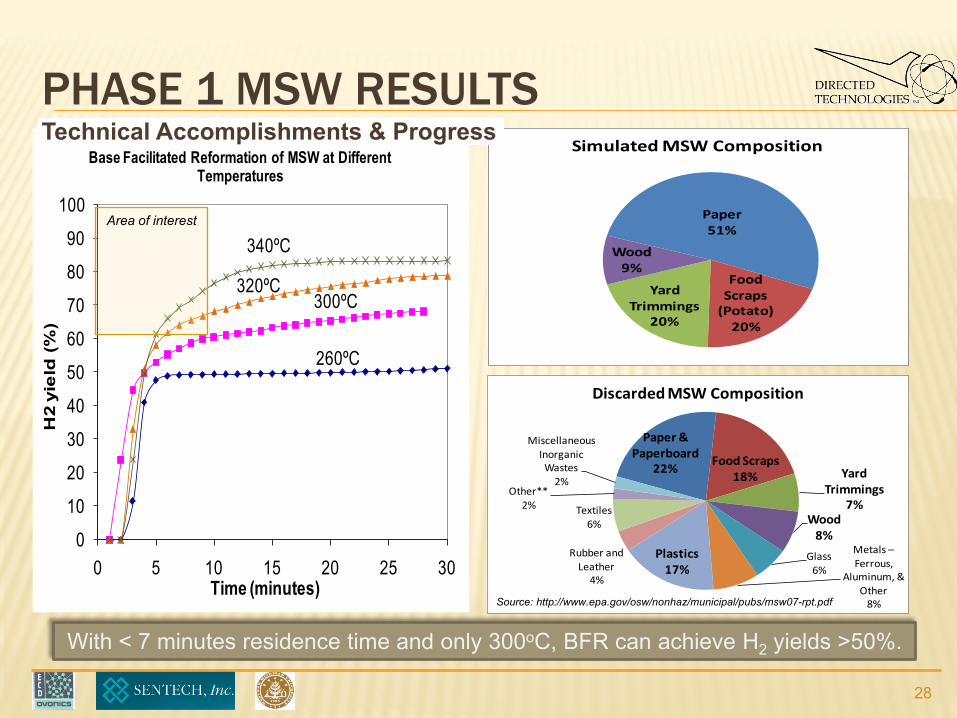
PHASE 1 MSW RESULTS
0
10
20
30
40
50
60
70
80
90
100
0 5 10 15 20 25 30
H2
yie
ld (
%)
Time (minutes)
Base Facilitated Reformation of MSW at Different Temperatures
260ºC
300ºC320ºC
340ºC
Paper51%
Food Scraps
(Potato)20%
Yard Trimmings
20%
Wood 9%
Simulated MSW Composition
28
Paper & Paperboard
22%Food Scraps
18% Yard Trimmings
7%Wood
8%
Glass 6%
Metals –Ferrous,
Aluminum, & Other
8%
Plastics 17%
Rubber and Leather
4%
Textiles 6%
Other** 2%
Miscellaneous Inorganic Wastes
2%
Discarded MSW Composition
Source: http://www.epa.gov/osw/nonhaz/municipal/pubs/msw07-rpt.pdf
With < 7 minutes residence time and only 300oC, BFR can achieve H2 yields >50%.
Area of interest
Technical Accomplishments & Progress
BASE-FACILITATED REFORMING (BFR)
NaOH SolutionRecycle
Ca(OH)2 Solution Recycle
Feedstock Preparation
Reactor
Precipitator
Biomass / MSWBiomass /
MSWFeedstock Preparation
Precipitator
NaOH Solution Recycle
H2 H2
CO2
Solid Carbonate Byproduct (CaCO3)
Feedstock Preparation
Reactor
Dissolved Carbonate Byproduct (Na2CO3)
H2
Recycling
Reactor
Biomass / MSW
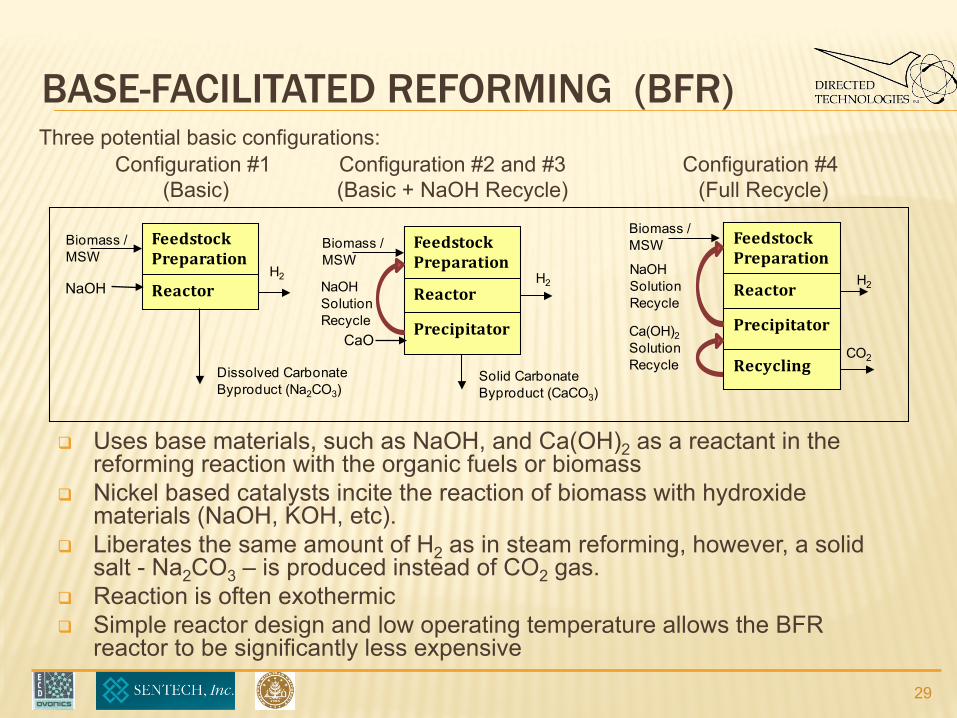
Uses base materials, such as NaOH, and Ca(OH)2 as a reactant in the reforming reaction with the organic fuels or biomass
Nickel based catalysts incite the reaction of biomass with hydroxide materials (NaOH, KOH, etc).
Liberates the same amount of H2 as in steam reforming, however, a solid salt - Na2CO3 – is produced instead of CO2 gas.
Reaction is often exothermic Simple reactor design and low operating temperature allows the BFR
reactor to be significantly less expensive
Three potential basic configurations:Configuration #1
(Basic)Configuration #2 and #3(Basic + NaOH Recycle)
Configuration #4 (Full Recycle)
NaOH
CaO
29
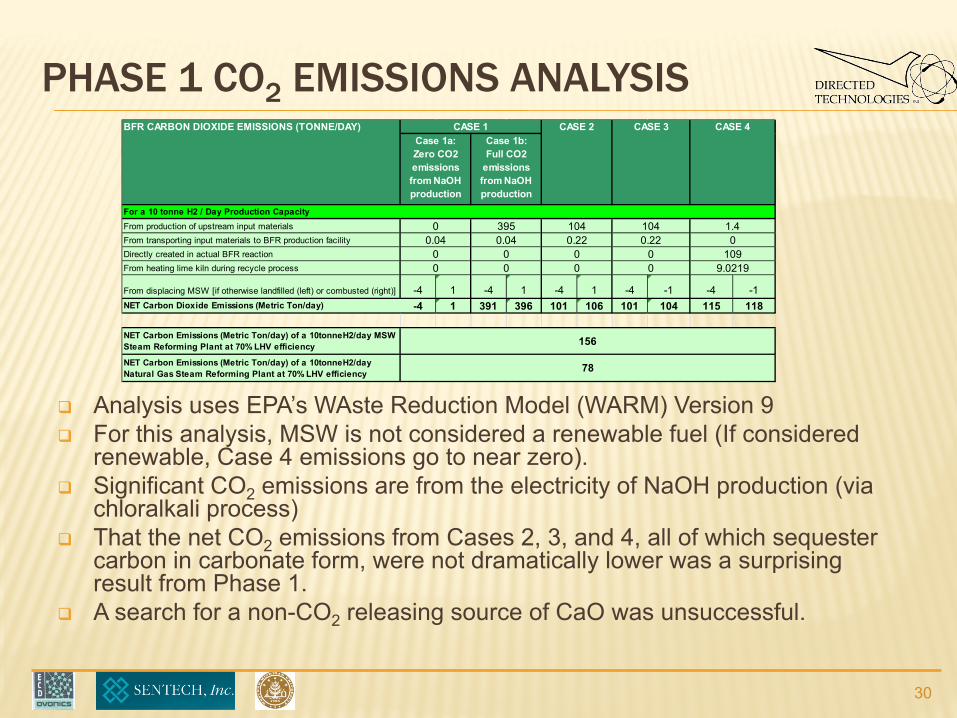
PHASE 1 CO2 EMISSIONS ANALYSISBFR CARBON DIOXIDE EMISSIONS (TONNE/DAY)
From production of upstream input materials From transporting input materials to BFR production facility Directly created in actual BFR reactionFrom heating lime kiln during recycle process
From displacing MSW [if otherwise landfilled (left) or combusted (right)] -4 1 -4 1 -4 1 -4 -1 -4 -1NET Carbon Dioxide Emissions (Metric Ton/day) -4 1 391 396 101 106 101 104 115 118
NET Carbon Emissions (Metric Ton/day) of a 10tonneH2/day MSW Steam Reforming Plant at 70% LHV efficiency
NET Carbon Emissions (Metric Ton/day) of a 10tonneH2/day Natural Gas Steam Reforming Plant at 70% LHV efficiency
0.040
CASE 4
For a 10 tonne H2 / Day Production Capacity
395 104 104 1.4
CASE 2 CASE 3CASE 1Case 1a:Zero CO2 emissions from NaOH production
Case 1b:Full CO2
emissions from NaOH production
00.04 0.22 0.22 0
0 0 0 109
156
78
0 0 0 9.02190
Analysis uses EPA’s WAste Reduction Model (WARM) Version 9 For this analysis, MSW is not considered a renewable fuel (If considered
renewable, Case 4 emissions go to near zero). Significant CO2 emissions are from the electricity of NaOH production (via
chloralkali process) That the net CO2 emissions from Cases 2, 3, and 4, all of which sequester
carbon in carbonate form, were not dramatically lower was a surprising result from Phase 1.
A search for a non-CO2 releasing source of CaO was unsuccessful.
30
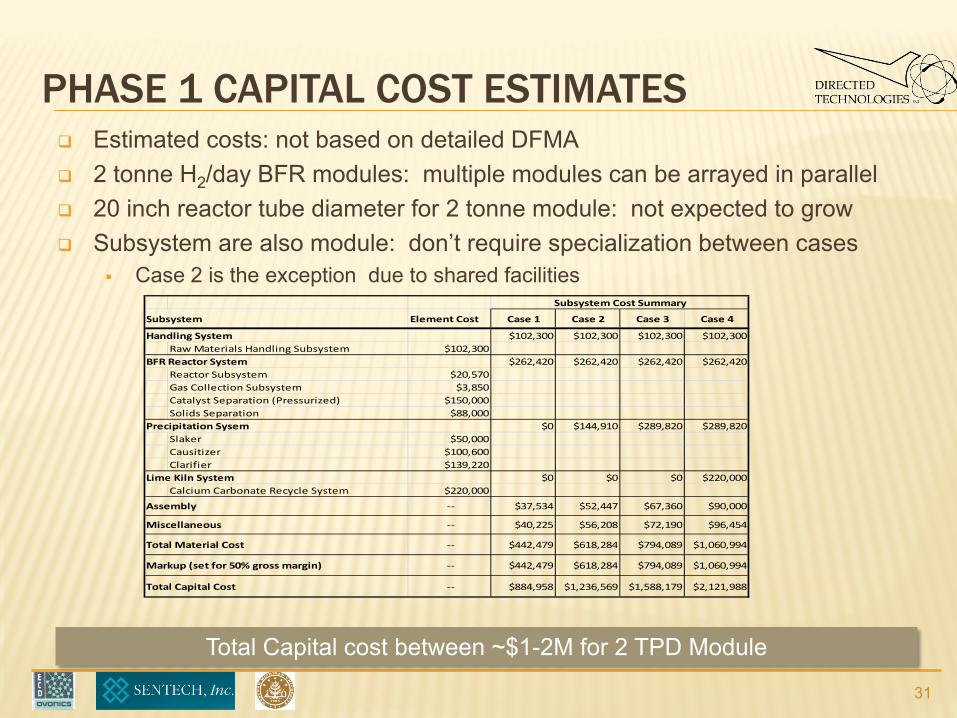
PHASE 1 CAPITAL COST ESTIMATES Estimated costs: not based on detailed DFMA 2 tonne H2/day BFR modules: multiple modules can be arrayed in parallel 20 inch reactor tube diameter for 2 tonne module: not expected to grow Subsystem are also module: don’t require specialization between cases
Case 2 is the exception due to shared facilities
Subsystem Element Cost Case 1 Case 2 Case 3 Case 4
Handling System $102,300 $102,300 $102,300 $102,300Raw Materials Handling Subsystem $102,300
BFR Reactor System $262,420 $262,420 $262,420 $262,420Reactor Subsystem $20,570Gas Collection Subsystem $3,850Catalyst Separation (Pressurized) $150,000Solids Separation $88,000
Precipitation Sysem $0 $144,910 $289,820 $289,820Slaker $50,000Causitizer $100,600Clarifier $139,220
Lime Kiln System $0 $0 $0 $220,000Calcium Carbonate Recycle System $220,000
Assembly -- $37,534 $52,447 $67,360 $90,000
Miscellaneous -- $40,225 $56,208 $72,190 $96,454
Total Material Cost -- $442,479 $618,284 $794,089 $1,060,994
Markup (set for 50% gross margin) -- $442,479 $618,284 $794,089 $1,060,994
Total Capital Cost -- $884,958 $1,236,569 $1,588,179 $2,121,988
Subsystem Cost Summary
Total Capital cost between ~$1-2M for 2 TPD Module
31
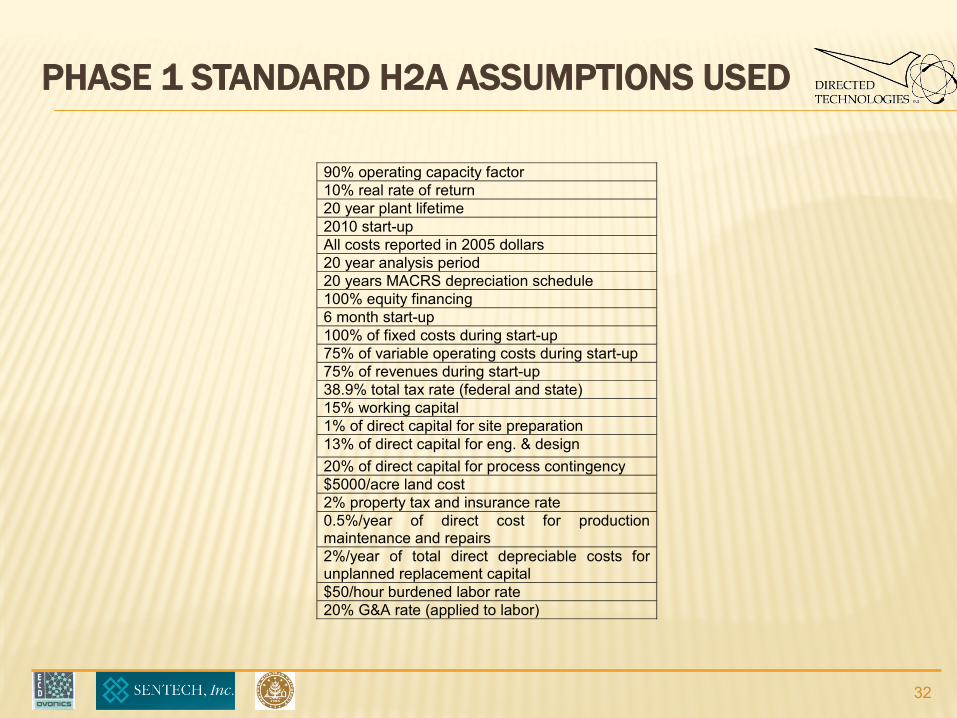
PHASE 1 STANDARD H2A ASSUMPTIONS USED
90% operating capacity factor 10% real rate of return 20 year plant lifetime 2010 start-up All costs reported in 2005 dollars 20 year analysis period 20 years MACRS depreciation schedule 100% equity financing 6 month start-up 100% of fixed costs during start-up 75% of variable operating costs during start-up 75% of revenues during start-up 38.9% total tax rate (federal and state) 15% working capital 1% of direct capital for site preparation 13% of direct capital for eng. & design 20% of direct capital for process contingency $5000/acre land cost 2% property tax and insurance rate 0.5%/year of direct cost for production maintenance and repairs 2%/year of total direct depreciable costs for unplanned replacement capital $50/hour burdened labor rate 20% G&A rate (applied to labor)
32
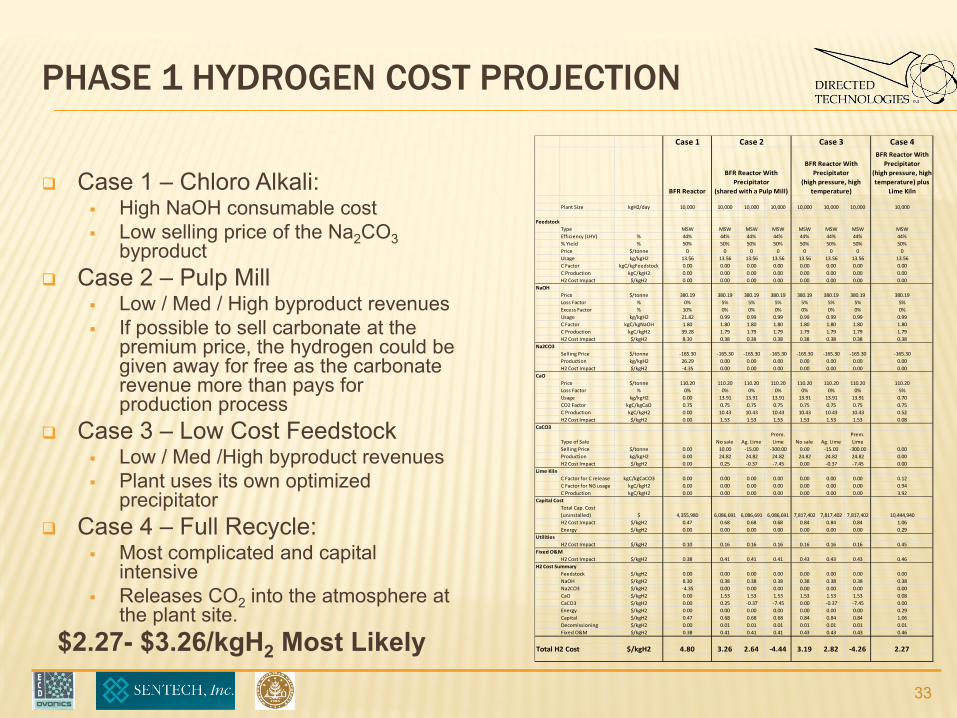
PHASE 1 HYDROGEN COST PROJECTION
Case 1 – Chloro Alkali: High NaOH consumable cost Low selling price of the Na2CO3
byproduct Case 2 – Pulp Mill
Low / Med / High byproduct revenues If possible to sell carbonate at the
premium price, the hydrogen could be given away for free as the carbonate revenue more than pays for production process
Case 3 – Low Cost Feedstock Low / Med /High byproduct revenues Plant uses its own optimized
precipitator Case 4 – Full Recycle:
Most complicated and capital intensive
Releases CO2 into the atmosphere at the plant site.
Case 1 Case 4
BFR Reactor
BFR Reactor With Precipitator
(high pressure, high temperature) plus
Lime Kiln
Plant Size kgH2/day 10,000 10,000 10,000 10,000 10,000 10,000 10,000 10,000
FeedstockType MSW MSW MSW MSW MSW MSW MSW MSWEfficiency (LHV) % 44% 44% 44% 44% 44% 44% 44% 44%% Yield % 50% 50% 50% 50% 50% 50% 50% 50%Price $/tonne 0 0 0 0 0 0 0 0Usage kg/kgH2 13.56 13.56 13.56 13.56 13.56 13.56 13.56 13.56C Factor kgC/kgFeedstock 0.00 0.00 0.00 0.00 0.00 0.00 0.00 0.00C Production kgC/kgH2 0.00 0.00 0.00 0.00 0.00 0.00 0.00 0.00H2 Cost Impact $/kgH2 0.00 0.00 0.00 0.00 0.00 0.00 0.00 0.00
NaOHPrice $/tonne 380.19 380.19 380.19 380.19 380.19 380.19 380.19 380.19Loss Factor % 0% 5% 5% 5% 5% 5% 5% 5%Excess Factor % 10% 0% 0% 0% 0% 0% 0% 0%Usage kg/kgH2 21.82 0.99 0.99 0.99 0.99 0.99 0.99 0.99C Factor kgC/kgNaOH 1.80 1.80 1.80 1.80 1.80 1.80 1.80 1.80C Production kgC/kgH2 39.28 1.79 1.79 1.79 1.79 1.79 1.79 1.79H2 Cost Impact $/kgH2 8.30 0.38 0.38 0.38 0.38 0.38 0.38 0.38
Na2CO3Selling Price $/tonne -165.30 -165.30 -165.30 -165.30 -165.30 -165.30 -165.30 -165.30Production kg/kgH2 26.29 0.00 0.00 0.00 0.00 0.00 0.00 0.00H2 Cost Impact $/kgH2 -4.35 0.00 0.00 0.00 0.00 0.00 0.00 0.00
CaOPrice $/tonne 110.20 110.20 110.20 110.20 110.20 110.20 110.20 110.20Loss Factor % 0% 0% 0% 0% 0% 0% 0% 5%Usage kg/kgH2 0.00 13.91 13.91 13.91 13.91 13.91 13.91 0.70CO2 Factor kgC/kgCaO 0.75 0.75 0.75 0.75 0.75 0.75 0.75 0.75C Production kgC/kgH2 0.00 10.43 10.43 10.43 10.43 10.43 10.43 0.52H2 Cost Impact $/kgH2 0.00 1.53 1.53 1.53 1.53 1.53 1.53 0.08
CaCO3
Type of Sale No sale Ag. LimePrem. Lime No sale Ag. Lime
Prem. Lime
Selling Price $/tonne 0.00 10.00 -15.00 -300.00 0.00 -15.00 -300.00 0.00Production kg/kgH2 0.00 24.82 24.82 24.82 24.82 24.82 24.82 0.00H2 Cost Impact $/kgH2 0.00 0.25 -0.37 -7.45 0.00 -0.37 -7.45 0.00
Lime KilnC Factor for C release kgC/kgCaCO3 0.00 0.00 0.00 0.00 0.00 0.00 0.00 0.12C Factor for NG usage kgC/kgH2 0.00 0.00 0.00 0.00 0.00 0.00 0.00 0.94C Production kgC/kgH2 0.00 0.00 0.00 0.00 0.00 0.00 0.00 3.92
Capital CostTotal Cap. Cost (uninstalled) $ 4,355,980 6,086,691 6,086,691 6,086,691 7,817,402 7,817,402 7,817,402 10,444,940H2 Cost Impact $/kgH2 0.47 0.68 0.68 0.68 0.84 0.84 0.84 1.06Energy $/kgH2 0.00 0.00 0.00 0.00 0.00 0.00 0.00 0.29
UtilitiesH2 Cost Impact $/kgH2 0.10 0.16 0.16 0.16 0.16 0.16 0.16 0.45
Fixed O&MH2 Cost Impact $/kgH2 0.38 0.41 0.41 0.41 0.43 0.43 0.43 0.46
H2 Cost SummaryFeedstock $/kgH2 0.00 0.00 0.00 0.00 0.00 0.00 0.00 0.00NaOH $/kgH2 8.30 0.38 0.38 0.38 0.38 0.38 0.38 0.38Na2CO3 $/kgH2 -4.35 0.00 0.00 0.00 0.00 0.00 0.00 0.00CaO $/kgH2 0.00 1.53 1.53 1.53 1.53 1.53 1.53 0.08CaCO3 $/kgH2 0.00 0.25 -0.37 -7.45 0.00 -0.37 -7.45 0.00Energy $/kgH2 0.00 0.00 0.00 0.00 0.00 0.00 0.00 0.29Capital $/kgH2 0.47 0.68 0.68 0.68 0.84 0.84 0.84 1.06Decomissioning $/kgH2 0.00 0.01 0.01 0.01 0.01 0.01 0.01 0.01Fixed O&M $/kgH2 0.38 0.41 0.41 0.41 0.43 0.43 0.43 0.46
Total H2 Cost $/kgH2 4.80 3.26 2.64 -4.44 3.19 2.82 -4.26 2.27
Case 2 Case 3
BFR Reactor With Precipitator
(shared with a Pulp Mill)
BFR Reactor With Precipitator
(high pressure, high temperature)
$2.27- $3.26/kgH2 Most Likely
33