Embed Size (px)
Citation preview

Aquatic Plants in Lake Simcoe
2011
Aquatic Plants in Lake Simcoe: Distribution, Environmental Controls and Utility as Ecological Indicators Technical Progress Series in Lake Monitoring: Report No. 1
Lake Simcoe Region Conservation Authority
1


Aquatic Plants in Lake Simcoe
Results of this research are also published:
Ginn, B.K. 2011. Distribution and limnological drivers of submerged aquatic plant communities in Lake Simcoe (Ontario, Canada): Utility of macrophytes as bioindicators of lake trophic status. Journal of Great Lakes Research 37: 83-89.
Lake Simcoe Region Conservation Authority. 2011. Aquatic plants in Lake Simcoe. LSRCA Newsletters in Lake Science No. 1.
This research was funded by Environment Canada’s Lake Simcoe Clean-up Fund, Lake Simcoe Conservation Foundation, and the Lake Simcoe Region Conservation Authority with its municipal partners.
Lake Simcoe Region Conservation Authority 1

Aquatic Plants in Lake Simcoe
SUMMARY Species composition, distribution, and biomass of submerged aquatic plants (or
macrophytes) were studied in Lake Simcoe (Ontario, Canada) as was the use of aquatic plants
as indicators of lake trophic status. While previous studies in this lake targeted eutrophic Cook’s
Bay, this study covered the entire lake area, identified other areas of high plant biomass, and
recorded 16 macrophyte species; the community was dominated by Ceratophyllum demersum
(39% of the total biomass), the invasive species Myriophyllum spicatum (27%), Elodea
canadensis (11%) and Chara spp. (10%). Canonical correspondence analysis (CCA) identified
four significant limnological variables related to plant biomass: (a) depth, likely a proxy for light
levels; (b) substrate type, related to nutrient availability, stability, and wave exposure; (c)
phosphorus loading from the closest tributary; and (d) subwatershed area. Since initial (1971)
macrophyte surveys on Lake Simcoe, the community has been dramatically altered by expansion
of an invasive species (i.e. M. spicatum) resulting in declines of native shallow-water species
(particularly Chara spp.). The arrival of invasive zebra mussels (Dreissenia polymorpha) ~1995
and reductions in phosphorus loading have increased water clarity, extending the maximum
depth of plant colonization (6.0 m in 1984 to 10.5 m in 2008), and almost tripled macrophyte
biomass (1.2 kg · m-2 in 1984 to 3.1 kg · m-2 in 2008). Increased plant biomass, and a loss of
species diversity, due to the spread of M. spicatum are interpreted by macrophyte indices as a
decrease in lake ecological status, which likely explains why these indices did not follow recorded
trends in reduced phosphorus loading.
RECOMMENDATIONS: In order to monitor for changes in species distribution, maximum depth of colonization,
and further develop the use of macrophytes as environmental indicators, it is recommended that
limited surveys in target locations be carried out twice during the ice-free season in late spring
(e.g. June) and autumn (e.g. late September) to capture both seasonal changes in species
composition and plant biomass. A full survey of Lake Simcoe on the scale of this project should
be carried out every five years to monitor for critical ecological changes in the aquatic plant
community and future invasions by exotic plant species.
Lake Simcoe Region Conservation Authority 2
Aquatic Plants in Lake Simcoe
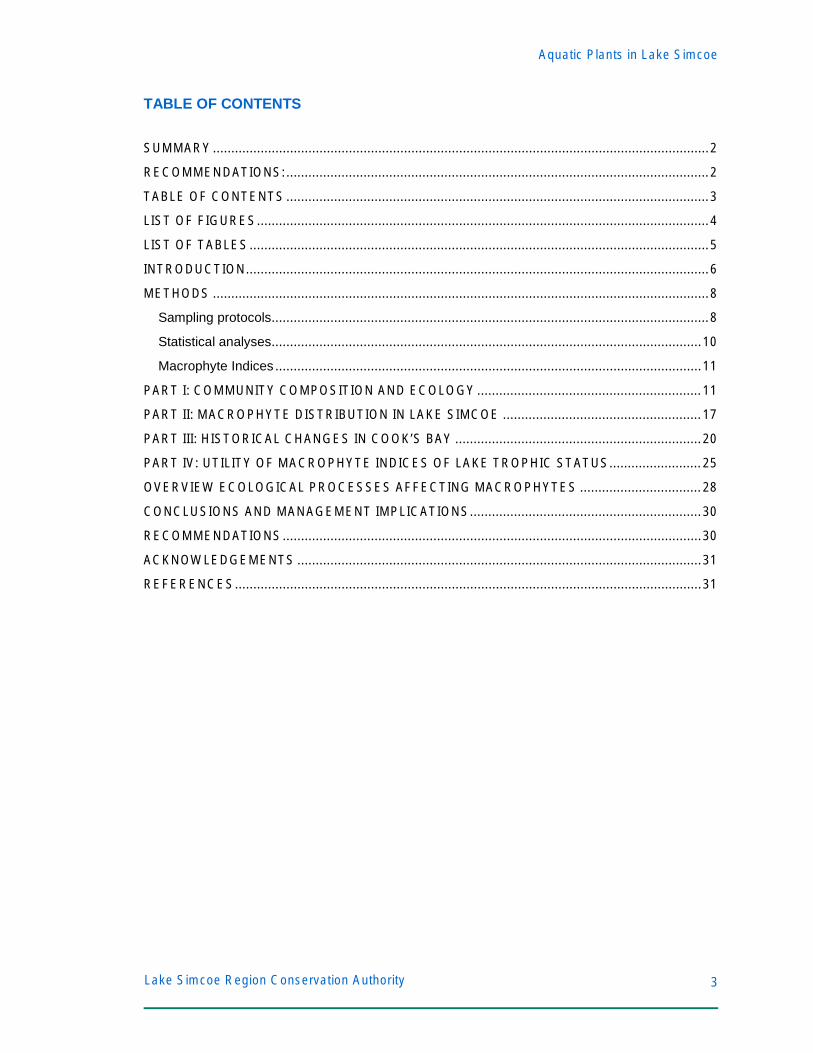
TABLE OF CONTENTS
SUMMARY ....................................................................................................................................... 2
RECOMMENDATIONS: ................................................................................................................... 2
TABLE OF CONTENTS ................................................................................................................... 3
LIST OF FIGURES........................................................................................................................... 4
LIST OF TABLES ............................................................................................................................. 5
INTRODUCTION.............................................................................................................................. 6
METHODS ....................................................................................................................................... 8
Sampling protocols....................................................................................................................... 8
Statistical analyses..................................................................................................................... 10
Macrophyte Indices .................................................................................................................... 11
PART I: COMMUNITY COMPOSITION AND ECOLOGY ............................................................. 11
PART II: MACROPHYTE DISTRIBUTION IN LAKE SIMCOE ...................................................... 17
PART III: HISTORICAL CHANGES IN COOK’S BAY ................................................................... 20
PART IV: UTILITY OF MACROPHYTE INDICES OF LAKE TROPHIC STATUS......................... 25
OVERVIEW ECOLOGICAL PROCESSES AFFECTING MACROPHYTES ................................. 28
CONCLUSIONS AND MANAGEMENT IMPLICATIONS............................................................... 30
RECOMMENDATIONS .................................................................................................................. 30
ACKNOWLEDGEMENTS .............................................................................................................. 31
REFERENCES............................................................................................................................... 31
Lake Simcoe Region Conservation Authority 3

Aquatic Plants in Lake Simcoe
LIST OF FIGURES
Figure 1. Map showing the locations of 215 sample sites for aquatic plants in Lake Simcoe, September – November 2008.
Figure 2. Photographs of the three most common aquatic plant species recorded (2008) in Lake Simcoe: (a) Ceratophyllum demersum, coontail (photo: Friends of Chorlton Meadows); (b) Myriophyllum spicatum, Eurasian watermilfoil (photo: Wisconsin Dept. Nat. Res.); (c) Elodea canadensis, common (or Canadian) waterweed (photo: Wisconsin Dept. Nat. Res.); (d) Chara spp., muskgrass (photo: Alabama Dept. Conserv. Nat. Res.).
Figure 3. Canonical Correspondence Analysis (CCA) ordination showing distribution of 16 aquatic plant species (triangle symbols) recorded in Lake Simcoe in relation to environmental variables (indicated by black and purple arrows). Asterix (*) and black arrows identify the four statistically significant variables.
Figure 4. Frequency diagram shoring change in relative abundance of four most common recorded aquatic plant species in Lake Simcoe, along with total aquatic plant biomass with respect to depth.
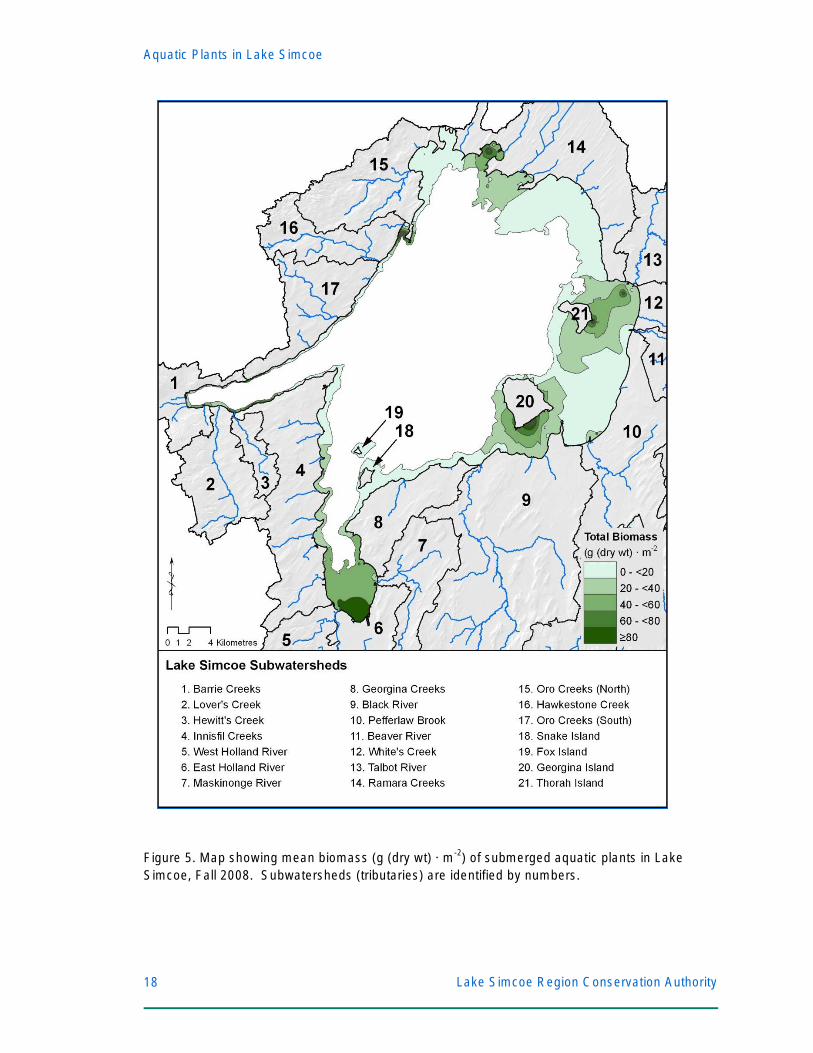
Figure 5. Map showing mean biomass (g (dry wt) · m-2) of submerged aquatic plants in Lake Simcoe, Fall 2008. Subwatersheds (tributaries) are identified by numbers.
Figure 6. Map comparing aquatic plant coverage in Cook’s Bay (Lake Simcoe) between the 1984 (Neil et al. 1985) and 2008 studies.
Figure 7. Map comparing the distribution of most common plant species in Cook’s Bay (Lake Simcoe) between (a) 1984 (modified after Neil et al. 1985) and (b) 2008. Note that in 2008, the “Other spp.” designation represents co-dominance of habitat by M. spicatum and V. americana.
Figure 8. Conceptual diagram illustrating how aquatic plant distribution in Lake Simcoe is connected to phosphorus inputs, substrate type, available light, as well as amount of wind and wave exposure.
Lake Simcoe Region Conservation Authority 4

Aquatic Plants in Lake Simcoe
LIST OF TABLES
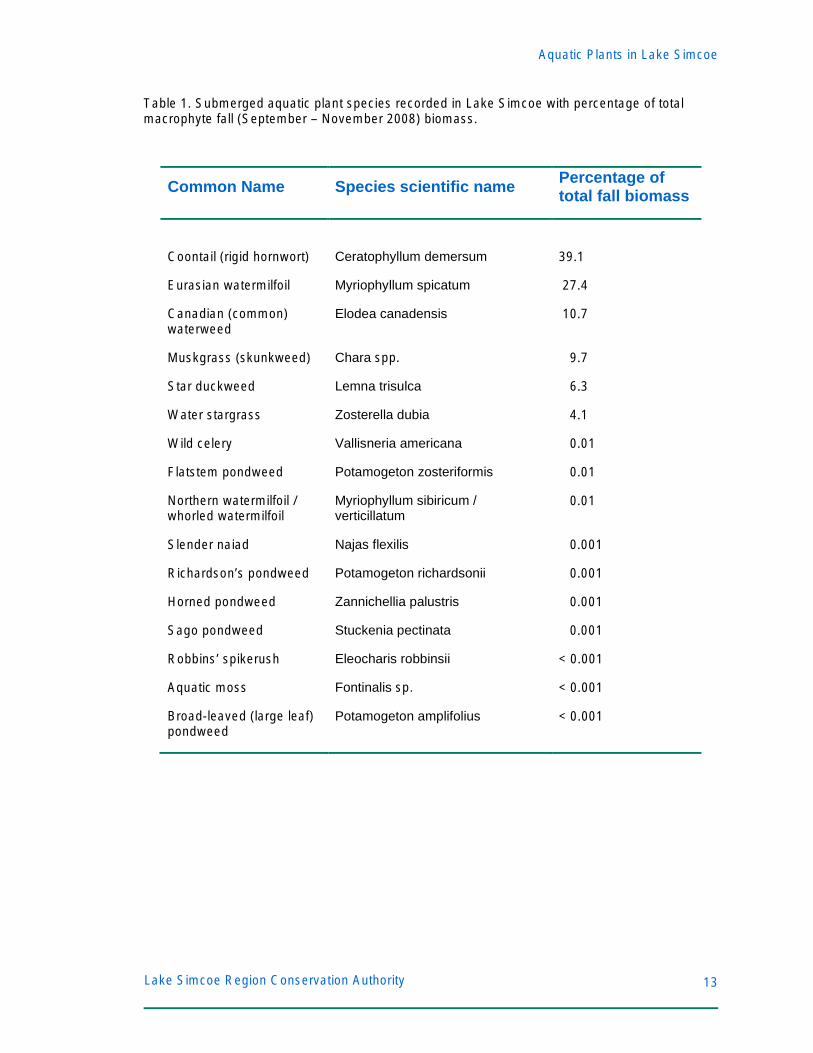
Table 1. List of submerged aquatic plant species recorded in Lake Simcoe with percentage of total macrosphyte fall (September – November 2008) biomass.
Table 2. Surface area and mean annual phosphorus load (2004-2007) from tributaries entering Lake Simcoe (data courtesy of E. O’Connor and J. W inter, unpublished). Numbers (1 – 21) refer to tributary / subwatersheds labeled on Figure 5.
Table 3. Comparison of aquatic plant studies in Cook’s Bay (Lake Simcoe) for 1984 (Neil et al. 1987), 1987 (Neil et al. 1991), 2006 (Stantec 2007), and 2008.
Table 4. Comparison of mean annual total phosphorus (TP), mean annual Secchi depth, and three macrophyte indices: Trophic Ranking Score, or TRS (Palmer et al. 1992); Macrophyte Index, MI (Melzer 1999), and Aquatic Macrophyte Community Index, AMCI (Nichols et al. 2000) for Cook’s Bay (Lake Simcoe) calculated using data from surveys in 1984 (Neil et al. 1985), 1987 (Neil et al. 1991), 2006 (Stantec 2007), and 2008 (current study).
Lake Simcoe Region Conservation Authority 5

Aquatic Plants in Lake Simcoe
INTRODUCTION
Lake Simcoe (44o25’N, 79o24’W) is a large (surface area 722 km2; maximum depth 42 m; mean
depth 15 m) currently mesotrophic (total phosphorus (TP) ~14 µg L-1) lake in southern Ontario
which has undergone environmental changes consistent with increased phosphorus (P) inputs
due to human activites and has experienced a subsequent loss of coldwater fish habitat (Evans et
al. 1996). W hile many studies have focused on the pelagic zone of this lake (e.g. Evans et al.
1996; W inter et al. 2007, 2011), the nearshore zone (0-20 m depth, covering 67% of the lake
area) has been relatively ignored. Yet, it is the nearshore zone that exhibits the most visible
effects of both aquatic and terrestrial environmental changes: zebra mussel (Dreissenia
polymorpha) colonization; increased nutrient flow due to altered terrestrial surface run-off,
removal of natural vegetative cover, and changes in land use; habitat loss resulting from
shoreline hardening; dense patches of aquatic plants; loss of species diversity; and higher
nutrient concentrations.
Development within the Lake Simcoe watershed was primarily agricultural until 1960-70’s
when urbanization rapidly increased. Currently, agricultural use dominates the watershed (47%
of catchment area), urban areas and roadways occupy ~12%, and the remainder is highly
fragmented natural cover (forests, wetlands, grasslands) (LSRCA 2008). Phosphorus (P) loading
to Lake Simcoe increased from a model-estimated, pre-settlement (pre-1800), 32 t · y-1 (Nicholls
1997) to a peak 100 t · y-1 (Winter et al. 2011) ~1990 resulting in ecological changes consistent
with cultural eutrophication (algal blooms, dense macrophyte biomass, hypoxic – anoxic bottom
waters, etc.) and the concurrent recruitment failures for many coldwater fish species (lake trout,
Salvelinus namaycush; lake whitefish, Coregonus clupeaformis; and lake herring, Coregonus
artedii). Since 1990, mitigation efforts have reduced P-loading to ~72 t · y-1 (Winter et al. 2011),
although this varies with annual precipitation. The Lake Simcoe Protection Plan (2009) has set a
P-loading target of 44 t · y-1 for recovery to an ecologically sustainable state. One of the most
significant environmental changes in Lake Simcoe was the ~1995 establishment of invasive
zebra mussels (D. polymorpha) which, as in other locations and combined with P-reductions,
have resulted in increased water clarity (Secchi depth: 1.0 – 4.5 m, 1972-1985; 2.5 – 8.0 m,
Lake Simcoe Region Conservation Authority 6

Aquatic Plants in Lake Simcoe
2000-2008) (Eimers et al. 2005, W inter et al. 2011) from removal of algae and suspended
particles. Currently, Lake Simcoe is meso-eutrophic with offshore areas having a mean (2008)
total phosphorus (TP) concentration of ~14 µg · L-1 (W inter et al. 2011), whereas nearshore areas
have a higher mean TP ~ 21.9 µg · L-1 (range: 12.0 - 48.0 µg · L-1).
While macrophytes are found in almost all lakes, and create an important habitat for fish
and invertebrates (predominantly as feeding and nursery areas), they can rapidly increase in
density and biomass under increased nutrient inputs (especially P); interfering with nutrient and
biogeochemical cycling, water and sediment chemistry, dissolved oxygen concentrations, lake
productivity, alter biological communities (e.g. fish, invertebrates, plankton, waterfowl), and
recreational activities (Barko et al. 1986, Carpenter and Lodge 1986, Alexander et al. 2008),
quickly reaching what lake users consider “nuisance levels” (see Chambers et al. 1999). As
macrophyte biomass and species composition show quantifiable changes in response to lake
trophic status, plants can dominate many lake habitats, and they can be surveyed at a relatively
low cost, macrophytes can serve as an important indicator of environmental status; although this
practice is more widely used in Europe than in North America (Palmer et al. 1992, Melzer 1999,
Nichols et al. 2000). As bioindicators, macrophytes emphasize ecological conditions of the
nearshore zone, which drives lake productivity, is heavily impacted by ecological degradation,
and receives the most interaction / attention from lake users (Vadeboncoeur et al. 2002, Clayton
and Edwards 2006). Macrophyte indices of ecological status often incorporate aspects such as
trends in native and invasive plant species, trends in lake trophic status, nutrient levels, and water
clarity (Thiebault et al. 2002, Schneider 2007). Given the importance of macrophytes to the entire
lake ecosystem, management is an important issue and plants are often the most common
environmental complaint received from lake users (Chambers et al. 1999).
In Lake Simcoe, previous studies on macrophytes (Millard and Veal 1971; Neil et al.
1985, 1991; Stantec 2007) have targeted Cook’s Bay, and area with a high P loading (from
agricultural and urban run-off), high macrophyte biomass, and large diurnal changes in
hypolimnetic dissolved oxygen (1.3 mg · L-1 just before sunrise to 15.7 mg · L-1 in late afternoon)
Lake Simcoe Region Conservation Authority 7

Aquatic Plants in Lake Simcoe
(Stantec 2007). Management concerns in this area are based on aesthetic complaints by owners
of lakefront properties and the potential for plants to increase the release of sediment-bound P
(see Stephen et al. 1997). Presumed increases in macrophyte biomass are likely related to
increased water clarity, changes in P cycling (cf. Hecky et al. 2004) since the invasion of D.
polymorpha (~1995), expansion of M. spicatum and other invasive species, and reductions in
nutrient inputs (W inter et al. 2011).
The objectives of this study were to: examine long-term trends in macrophyte abundance
and community composition in relation to trophic status and water clarity; test the utility of plants
as bioindicators of lake trophic status; and present new baseline data for long-term monitoring,
bioassessment, and management of Lake Simcoe.
METHODS
Sampling protocols
Submerged macrophytes were collected 17 September – 6 November 2008 from 43
transects situated perpendicular to the shoreline at 5 km intervals in Lake Simcoe (Figure 1). At
each transect, five depths (1, 3, 5, 10, and 20 m) were sampled (a total of 215 sites, not all
transects reached 20 m depth) using a W ildco® Lake Rake in shallow sites and a Wildco® Petite
Ponar Grab in both shallow and deeper locations. As two different sampling strategies were
employed, quality control efforts were taken to ensure a reasonable correlation (r = 0.71) between
methods and redundancy in shallow sample sites. Areas sampled were normalized to 1 m2 and
the sampling protocol was selected to compare as closely as possible to the 2006 survey
(Stantec 2007). At each site collected plants were placed in Ziploc® bags and kept on ice before
being identified to species in the lab, weighed (wet weight biomass), dried at 105oC for 24 hours
in a gravity convection oven, and weighed again (dry weight biomass). Macrophyte data was
expressed as percentage of total dry weight plant biomass except for comparison to previous
studies which mostly relied on the less accurate wet weight biomass. Plants were identified using
Newmaster et al. (1997), Crow and Hellquist (2000a, b), and Lui et al. (2008).
Lake Simcoe Region Conservation Authority 8

Aquatic Plants in Lake Simcoe
Figure 1. Map showing the locations of 215 sample sites for aquatic plants in Lake Simcoe, September - November 2008.
Lake Simcoe Region Conservation Authority 9

Aquatic Plants in Lake Simcoe
Sixteen environmental variables were included in data analyses. Physical variables were:
depth of sample site, substrate type (classed by particle size as silt/mud, sand, gravel, cobble,
boulder, and hard substrates), surface area of catchment drained by inflow (subwatershed), and
phosphorus loading of inflow (tributary). Water chemistry variables included were: water colour,
specific conductance, dissolved inorganic carbon, dissolved organic carbon, total Kjeldahl
nitrogen (TKN), pH, TP, turbidity, alkalinity, aluminium, and calcium. Other chemical variables
(e.g. metals) were of very low levels, did not vary significantly between sites, and thus were not
included in these analyses. Water chemistry analyses were carried out by Maxxam Analytics
(Mississauga, Canada) which used the colourmetric technique for TP and inductively-coupled
plasma mass spectrometry (ICP-MS) for metals. Latitude and longitude were included as
variables to give a spatial aspect in the analyses.
Statistical analyses
Multivariate statistical techniques were used to determine the relationship between
aquatic plant biomass and key limnological variables. Detrended correspondence analysis (DCA)
was used to determine the species turnover (i.e. gradient length) in this dataset. Canonical
correspondence analysis (CCA), a unimodal direct gradient analysis technique, was used to
determine the main environmental variables that were related to aquatic plant species in these
sites. In the CCA, forward selection was used to select the minimum number of environmental
variables that significantly (P < 0.05) accounted for additional variation. Fifteen of sixteen
environmental variables were log transformed prior to this analysis to normalize skewed data (pH
was not transformed). DCA and CCA analyses were carried out using CANOCO for Windows
(version 4.5) (Lepš and Šmilauer 2007). A GIS-based kriging technique was used solely to
construct a map of plant biomass distribution (no analyses using kriging) using the Geostatistical
Analyst extension of ArcGIS 9.3.1.
Lake Simcoe Region Conservation Authority 10

Aquatic Plants in Lake Simcoe
Macrophyte Indices
In order to give an applied aspect to our study, and test the utility of macrophytes as
indicators of environmental status in Lake Simcoe, wet weight plant biomass data from this study
(2008) was used with wet weight plant biomass data from previous studies: 1984 (Neil et al.
1985), 1987 (Neil et al. 1991), and 2006 (Stantec 2007). Three widely used macrophyte indices
were calculated: Trophic Ranking Score (TRS) (Palmer et al. 1992), Aquatic Macrophyte
Community Index (AMCI) (Nichols et al. 2000), and the Macrophyte Index (MI) (Melzer 1999).
TRS values were calculated using the mean cumulative trophic ranking score assigned to each
species observed at each sample site (see Palmer et al. 1992). AMCI values were calculated as
directed in Nichols et al. (2000) with the sum of: maximum depth of plant colonization; percentage
of sites containing plants; relative frequencies of submerged, ecologically sensitive, and exotic
species; Simpson’s Diversity Index, and total number of species observed. MI values were
calculated by summing the products of a species’ indicator group value multiplied by quantity of
each species, then dividing the sum of species quantities (Melzer 1999).
PART I: COMMUNITY COMPOSITION AND ECOLOGY Sixteen species were recorded in this study of submerged aquatic plants in Lake Simcoe
(Table 1) with four species (Figure 2) comprising over 86% of the total biomass: Ceratophyllum
demersum (39% of total biomass), the invasive species Myriophyllum spicatum (27%), Elodea
canadensis (11%), and the green macro-alga Chara spp. (10%). In several cases (i.e. Fontinalis
sp., Myriophyllum sibiricum / verticillatum) definitive species-level identification was not possible
due to a lack of reproductive structures. While the community composition recorded was similar
to records from previous studies (Millard and Veal 1971; Neil et al. 1985, 1991; Stantec 2007),
some species with short life cycles, known to be present earlier in the season (e.g. Potamogeton
crispus) were not recorded due to the autumn sampling strategy, used to capture total (or peak)
plant biomass data, and the remote sampling methods (rake and grab sampling) which are less
ideal than snorkelers or SCUBA (better for recording species with encrusting or low growth
Lake Simcoe Region Conservation Authority 11

Aquatic Plants in Lake Simcoe
Figure 2. Photographs of the four most common aquatic plant species recorded (2008) in Lake Simcoe: (a) Ceratophyllum demersum, coontail (photo: Friends of Chorlton Meadows); (b) Myriophyllum spicatum, Eurasian watermilfoil (photo: Wisconsin Dept. Nat. Res.); (c) Elodea canadensis, common (or Canadian) waterweed (photo: Wisconsin Dept. Nat. Res.); (d) Chara spp., muskgrass (photo: Alabama Dept. Conserv. Nat. Res.)
Lake Simcoe Region Conservation Authority 12
Aquatic Plants in Lake Simcoe
Table 1. Submerged aquatic plant species recorded in Lake Simcoe with percentage of total macrophyte fall (September – November 2008) biomass.
Percentage of Common Name Species scientific name total fall biomass
Coontail (rigid hornwort) Ceratophyllum demersum 39.1
Eurasian watermilfoil Myriophyllum spicatum 27.4
Canadian (common) Elodea canadensis 10.7 waterweed
Muskgrass (skunkweed) Chara spp. 9.7
Star duckweed Lemna trisulca 6.3
Water stargrass Zosterella dubia 4.1
Wild celery Vallisneria americana 0.01
Flatstem pondweed Potamogeton zosteriformis 0.01
Northern watermilfoil / Myriophyllum sibiricum / 0.01 whorled watermilfoil verticillatum
Slender naiad Najas flexilis 0.001
Richardson’s pondweed Potamogeton richardsonii 0.001
Horned pondweed Zannichellia palustris 0.001
Sago pondweed Stuckenia pectinata 0.001
Robbins’ spikerush Eleocharis robbinsii < 0.001
Aquatic moss Fontinalis sp. < 0.001
Broad-leaved (large leaf) Potamogeton amplifolius < 0.001 pondweed
Lake Simcoe Region Conservation Authority 13

Aquatic Plants in Lake Simcoe
morphologies). The dominant species recorded (C. demersum and M. spicatum) are typical of
eutrophic systems (Lacoul and Freedman 2006) and are often associated with Lemna spp. which,
while only comprising 6.3% of the biomass in this study, is a floating macrophyte and recorded
here as a “by-catch” of sampling; although it is frequently observed floating in large mats,
especially in Cook’s Bay and the Holland River.
DCA results suggest macrophyte species changed across the limnological gradients
included in this study and the gradient length (3.2 units of standard deviation, DCA λ axis-1 = 0.7)
was sufficient to use unimodal direct gradient statistical methods. In this study CCA was used to
determine the variation in species that could be ‘directly’ related to the measured environmental
variables. In the CCA, forward selection determined four of the 16 environmental variables were
significant: depth of sample site (p = 0.001), P load from tributary (p = 0.003), substrate type (p =
0.01), and subwatershed area (p = 0.02). Eigenvalues associated with the canonical axes are
relatively high (λ axis-1 = 0.37; λ axis-2 = 0.13). It is not surprising that several of these
significant variables are correlated as the amount of P exported from a subwatershed is related to
the surface area of the subwatershed, and fine-grained substrates (e.g. mud or silt) are found in
areas of higher sedimentation / P loading. The four significant limnological variables (depth,
substrate type, phosphorus loading, and tributary drainage area) were similar to those reported
by other studies (Chambers et al. 1999, Lacoul and Freeman 2006) and reflect well-studied
attributes of aquatic plant ecology: depth likely incorporates water clarity or available light, which
can govern plant distribution, depth of colonization, and depth of maximum biomass (Chambers
and Kalff 1985, Istvánovics et al. 2008); substrate type would account for stability of attachment,
nutrient availability, and shelter from wave action (Anderson and Kalff 1988, French and
Chambers 1996); phosphorus loading and size of drainage area are evidence of potential nutrient
availability and deposition of fine sediments near the shoreline, an ideal environment for a large
biomass of canopy-forming macrophytes (Chambers and Kalff 1987).
Lake Simcoe Region Conservation Authority 14

Aquatic Plants in Lake Simcoe
-1.0
1.
0
Ceratophyllum demersum
Chara spp.
Eleocharis robbinsii
Elodea spp.
Fontinalis spp.
Lemna trisulca
M. sibiricum / verticillatum
Myriophyllum spicatum
Naja flexilis
P. amplifolius
P. richardsonii
P. zosteriformis
Stuckenia pectinata
Vallisneria americana
Zannichellia palustris Zosterella dubia
Colour
Sp. Conductance
DIC TKN
DOC
pH Total P
Alkalinity
Calcium
Depth
Substrate
P loading
Subwatershed Area
* *
*
*
-1.0 1.0
Figure 3. Canonical Correspondence Analysis (CCA) ordination showing distribution of 16 aquatic plant species (triangle symbols) recorded in Lake Simcoe in relation to environmental variables (indicated by black and purple arrows). Asterix (*) and black arrows identify the four statistically significant variables.
Lake Simcoe Region Conservation Authority 15

Aquatic Plants in Lake Simcoe
Lake Simcoe Region Conservation Authority
Figure 4. Frequency diagram showing change in relative abundance of four most common recorded aquatic plant species in Lake Simcoe, along with total aquatic plant biomass with respect to depth.
16

Aquatic Plants in Lake Simcoe
Distribution of aquatic plant species with respect to environmental variables (Figure 3)
indicate C. demersum tends to occupy deeper sites and was dominant below ~ 3.5 m depth
(Figure 4), whereas M. spicatum and Chara spp. were dominant at shallower ( 1 -3 m depth) sites
(Figure 4). Currently in Lake Simcoe, shallow (e.g. < 3.5 m) depths are dominated by M.
spicatum (silt substrates) or a combination of M. spicatum and Chara spp. (sand substrates),
likely due to M. spicatum’s its high light requirement, high photosynthetic and growth rates, rapid
dispersal through fragmentation, and ability to outcompete other shallow-water species by
shading the substrate with thick canopies and quickly using sediment nutrients (Smith and Adams
1986; Madsen et al. 1991a, 1991b). Likely as a result of this high light requirement, M. spicatum
is replaced at deeper sites (below ~3 m) in Lake Simcoe by C. demersum, a species more
tolerant of lower light levels. No aquatic plants were recorded below a depth of 10.5 m – currently
the 1% light level in Lake Simcoe is ~14 m.
PART II: MACROPHYTE DISTRIBUTION IN LAKE SIMCOE In addition to describing the current Lake Simcoe macrophyte community and key
limnological drivers, baselines for future monitoring studies (i.e. how will these plant communities
change at 5-year intervals?) require information on locations of high plant biomass and
populations of invasive species. Such information enables lake managers to evaluate restoration
targets and focus their efforts on the most environmentally impacted areas. As such, the total (all
species combined) biomass of macrophytes was plotted for each of the 215 sample sites in Lake
Simcoe (Figure 5), identified by contour lines of mean total biomass, and a gradient of green
colour. Southern areas of Cook’s Bay (outlet of the East and W est Holland rivers) had the
highest plant biomass (mean: 1118.5 g(dry) · m-2; range: 45.1 – 11262.7 g(dry) · m-2), followed by
northern Cook’s Bay (mean: 307.0 g(dry) · m-2; range: 21.4 – 2304.3 g(dry) · m-2).
Previous studies of aquatic plants in Lake Simcoe were limited to Cook’s Bay (Neil et al.
1985, 1991; Stantec 2007), which has the highest nutrient loading (combined annual P-loading
16,923 kg · y-1), sheltered location, and silt substrates. This study, for the first time, recorded
other areas of high plant biomass: south of Georgina Island at the outlet of the Black River (50.0
Lake Simcoe Region Conservation Authority 17
Aquatic Plants in Lake Simcoe
Figure 5. Map showing mean biomass (g (dry wt) · m-2) of submerged aquatic plants in Lake Simcoe, Fall 2008. Subwatersheds (tributaries) are identified by numbers.
Lake Simcoe Region Conservation Authority 18

Aquatic Plants in Lake Simcoe
Table 2. Surface area and mean annual phosphorus load (2004-2007) from tributaries entering Lake Simcoe (data courtesy of E. O’Connor and J. W inter, unpublished). Numbers (1 – 21) refer to tributary / subwatersheds labeled on Figure 5.
Surface Phosphorus Area Export
Tributary (km2) (kg · yr-1)
1 Barrie Creeks 37.5 8059
2 Lover’s Creek 60.0 813
3 Hewitt’s Creek 17.5 398
4 Innisfil Creeks 107.2 3760
5 West Holland River 351.9 7917
6 East Holland River 247.2 9006
7 Maskinonge River 63.5 1118
8 Georgina Creeks 49.3 2477
9 Black River 375.4 4428
10 Pefferlaw Brook 446.2 3550
11 Beaver River 327.2 3293
12 White’s Creek 105.0 1075
13 Talbot River 367.8 2091
14 Ramara Creeks 143.5 1931
15 Oro Creeks (North) 75.3 4261
16 Hawkestone Creek 47.8 505
17 Oro Creeks (South) 57.4 1061
18 Snake Island 1.4 9
19 Fox Island 0.2 1
20 Georgina Island 12.9 86
21 Thorah Island 4.4 45
Lake Simcoe Region Conservation Authority 19

Aquatic Plants in Lake Simcoe
g(dry) · m-2; range: 2.7 – 274.6 g(dry) · m-2), at the outlet of the Talbot River (44.2 g(dry) · m-2;
range: 10.9 – 154.0 g(dry) · m-2), the Ramara shoreline, particularly at McPhee Bay (60.0 g(dry) ·
m -2; range: 20.1 – 174.8 g(dry) · m-2), the Oro shoreline at Carhew Bay (88.3 g(dry) · m-2; range:
4.4 – 247.6 g(dry) · m-2), and at Barrie near Minet’s Point (mean = 77.7 g(dry) · m-2; range: 25.8 –
319.3 g (dry) · m-2) (Figure 5). No plants were recorded below a depth of 10.5 m (white area on
Figure 5). All areas of high macrophyte biomass correspond to sheltered shorelines with soft
substrates (silt, mud, or sand) and high P exports from tributaries which drain the largest or most
urbanized subwatersheds (Table 2).
Most of Lake Simcoe’s sediments have a very high TP load (mean 855 µg · g-1; range
875-1400 µg · g-1), but high macrophyte biomass correspond to areas of reduced sediment TP
(e.g. ~340 µg · g-1 in southern Cook’s Bay) likely indicating high P uptake by plants. Carignan
and Kalff (1980) concluded macrophytes obtain ~75% of their nutrient requirements from
sediments. Other locations of relatively high plant biomass, although with recorded values greatly
lower than Cook’s Bay, correspond to P inputs from rivers (Black, Pefferlaw, Talbot), increased
surface run- off from land clearance and development (Ramara and Oro shorelines), or urban
run-off and outputs from water pollution control facilities (Barrie).
PART III: HISTORICAL CHANGES IN COOK’S BAY In order to track temporal changes to the submerged macrophyte community, the results
of the current study from Cook’s Bay were compared with previous investigations from 1971
(Millard and Veal 1971); 1984, which include the first biomass records of M. spicatum in Lake
Simcoe (Neil et al. 1985); 1987 (Neil et al. 1991); and 2006 (Stantec 2007). Unfortunately the
initial plant survey on Lake Simcoe (Millard and Veal 1971) did not contain biomass data, instead
using “density classifications” (e.g. heavy, moderate, or scattered growth based on estimated
areal coverage) so direct comparison was not possible. However, the authors do describe
southern Cook’s Bay as having up to 80% areal coverage by plants with other “abundant” to
“heavy” areas being Barrie (up to 80%) and the Ramara and Oro shorelines (up to 51.4 % cover)
Lake Simcoe Region Conservation Authority 20

Aquatic Plants in Lake Simcoe
Figure 6. Map comparing aquatic plant coverage in Cook’s Bay (Lake Simcoe) between the 1984 (Neil et al. 1985) and 2008 studies.
Lake Simcoe Region Conservation Authority 21

Aquatic Plants in Lake Simcoe
Table 3. Comparsion of aquatic plant studies in Cook’s Bay, Lake Simcoe for 1984 (Neil et al.
1985), 1987 (Neil et al. 1991), 2006 (Stantec 2007), and 2008 (current study).
Variable 1984 1987 2006 2008
Total Number of Species 11 14 14 13
Maximum depth of plants (m) 6.0 6.0 8.5 10.5
Maximum wet weight 1.2 2.4 1.4 3.1
(kg (wet) · m-2)
% of sites with:
Myriophyllum spicatum 11.9 40.5 39.4 60.7
Chara spp. 69.0 52.4 29.4 32.1
Ceratophyllum demersum 38.1 42.9 68.8 85.7
Lake Simcoe Region Conservation Authority 22

Aquatic Plants in Lake Simcoe
Figure 7. Map comparing the distribution of most common plant species in Cook’s Bay (Lake Simcoe) between (a) 1984 (modified after Neil et al. 1985) and (b) 2008. Note that in 2008, the “Other spp.” designation represents co-dominance of habitat by M. spicatum and V. americana.
Lake Simcoe Region Conservation Authority 23
Aquatic Plants in Lake Simcoe
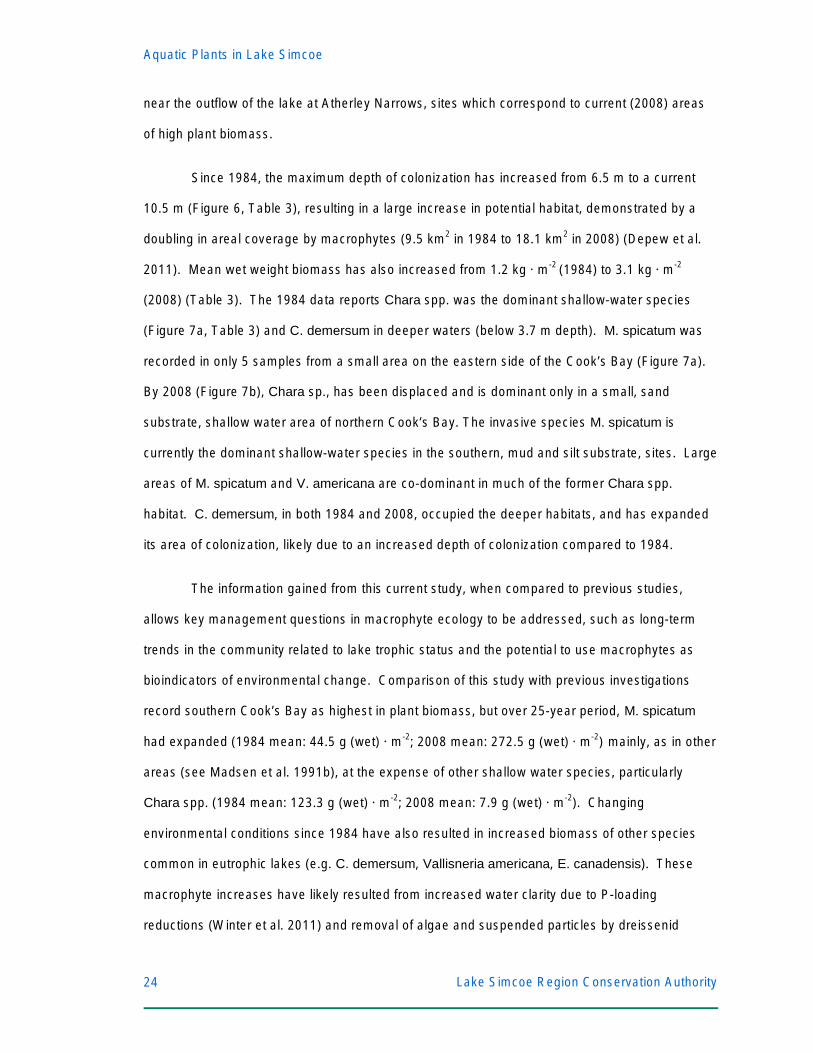
near the outflow of the lake at Atherley Narrows, sites which correspond to current (2008) areas
of high plant biomass.
Since 1984, the maximum depth of colonization has increased from 6.5 m to a current
10.5 m (Figure 6, Table 3), resulting in a large increase in potential habitat, demonstrated by a
doubling in areal coverage by macrophytes (9.5 km2 in 1984 to 18.1 km2 in 2008) (Depew et al.
2011). Mean wet weight biomass has also increased from 1.2 kg · m-2 (1984) to 3.1 kg · m-2
(2008) (Table 3). The 1984 data reports Chara spp. was the dominant shallow-water species
(Figure 7a, Table 3) and C. demersum in deeper waters (below 3.7 m depth). M. spicatum was
recorded in only 5 samples from a small area on the eastern side of the Cook’s Bay (Figure 7a).
By 2008 (Figure 7b), Chara sp., has been displaced and is dominant only in a small, sand
substrate, shallow water area of northern Cook’s Bay. The invasive species M. spicatum is
currently the dominant shallow-water species in the southern, mud and silt substrate, sites. Large
areas of M. spicatum and V. americana are co-dominant in much of the former Chara spp.
habitat. C. demersum, in both 1984 and 2008, occupied the deeper habitats, and has expanded
its area of colonization, likely due to an increased depth of colonization compared to 1984.
The information gained from this current study, when compared to previous studies,
allows key management questions in macrophyte ecology to be addressed, such as long-term
trends in the community related to lake trophic status and the potential to use macrophytes as
bioindicators of environmental change. Comparison of this study with previous investigations
record southern Cook’s Bay as highest in plant biomass, but over 25-year period, M. spicatum
had expanded (1984 mean: 44.5 g (wet) · m-2; 2008 mean: 272.5 g (wet) · m-2) mainly, as in other
areas (see Madsen et al. 1991b), at the expense of other shallow water species, particularly
Chara spp. (1984 mean: 123.3 g (wet) · m-2; 2008 mean: 7.9 g (wet) · m-2). Changing
environmental conditions since 1984 have also resulted in increased biomass of other species
common in eutrophic lakes (e.g. C. demersum, Vallisneria americana, E. canadensis). These
macrophyte increases have likely resulted from increased water clarity due to P-loading
reductions (W inter et al. 2011) and removal of algae and suspended particles by dreissenid
Lake Simcoe Region Conservation Authority 24

Aquatic Plants in Lake Simcoe
filtering capacity (Evans et al. 2011), changes which are observed in other lakes across the
Laurentian – Great Lakes Region (Skubinna et al. 1995, Zhu et al. 2006). Evidence of increased
water clarity and light penetration, allowing an increase in potential habitat for macrophyte
colonization is demonstrated by a large increase in Secchi depth. In 1972-1985 (pre-dreissenid
invasion, P-loading ~100 t · y-1) Secchi depth was 1.0 – 3.5 m in Cook’s Bay, 1.8 – 4.5 m in other
areas of the lake (Eimers et al. 2005). Currently (2008 – 2011), with reduced P-loading and
dreissenid populations, the Secchi depth is 2.5 – 5.7 m in Cook’s Bay and 6.3 – 8.0 m in other
areas (B.K. Ginn, unpublished). Current Secchi depths are similar to records of 7.0 m from 1926
(Rawson 1928).
PART IV: UTILITY OF MACROPHYTE INDICES OF LAKE TROPHIC STATUS In order to assess the applicability of macrophytes as indicators of lake trophic status,
and more fully compare environmental trends for a lake management perspective, biomass data
from three previous studies 1984 (Neil et al. 1985), 1987 (Neil et al. 1991), and 2006 (Stantec
2007) were used with the current (2008) data to determine index values from three macrophyte
indices: the Trophic Ranking Score (TRS) developed by Palmer et al. (1992) for British waters;
the Macrophyte Index (MI) for Europe (Melzer 1999); and the Aquatic Macrophyte Community
Index (AMCI) for W isconsin, USA lakes (Nichols et al. 2000). In addition, the scores were
compared to measured TP and Secchi depth values to test the accuracy of index scores
calculated. In general, all three models failed to capture recorded trends in either phosphorus
concentration or water clarity (Table 4), but there may be several reasons for this inaccuracy that
may enable future use of plants as biological indicators.
The AMCI was the only model developed for North American species and was also the
most comprehensive, accounting for: maximum plant depth; percentage of sites vegetated;
frequency of submerged, sensitive, and invasive species, and included the Simpson Diversity
Index. While it was the only index to include all 16 species recorded by this study, and account for
macrophyte biomass and influence of invasive species, it poorly followed the trend in water
column TP through time (r = -0.66) but was more accurate with water clarity (r = 0.58). Rather
Lake Simcoe Region Conservation Authority 25

Aquatic Plants in Lake Simcoe
Table 4. Comparison of recorded mean annual total phosphorus (TP), mean annual Secchi depth, and three macrophytes indices: Trophic Ranking Score, or TRS (Palmer et al. 1992); Macrophyte Index, MI (Melzer 1999), and Aquatic Macrophyte Community Index, AMCI (Nichols et al. 2000) for Cook’s Bay (Lake Simcoe) calculated using data from surveys in 1984 (Neil et al. 1985), 1987 (Neil et al. 1991), 2006 (Stantec 2007), and 2008 (current study).
TP Secchi TRS MI AMCI
(µg · L-1) (m)
1984 23.4 2.2 9.03 2.90 42
1987 15.7 2.6 8.58 3.36 43
2006 22.6 4.3 9.25 3.01 43
2008 16.4 3.8 8.76 4.07 45
Scale 1 – 10 1 – 5 7 – 70
“Good” value 1 1 7
“Poor” value 10 5 70
Lake Simcoe Region Conservation Authority 26

Aquatic Plants in Lake Simcoe
than following the trends in distinct limnological variables, AMCI likely takes into account the
overall impacts of plants to environmental status, diversity of the macrophyte community, and the
impacts of exotic species. AMCI records increases of invasive M. spicatum biomass (such as in
Cook’s Bay) and the loss of native species and diversity as a decline in ecological status (Nichols
et al. 2000).
The MI model also performed poorly for reconstructing water column TP (r = -0.79) but
most closely followed the trend in clarity (r = 0.95). In fact, MI inferred a change from “low”
nutrient enrichment in 1984 to “massive” nutrient enrichment in 2008 (Melzer 1999), an opposite
trend from measured TP. MI may be responding to relatively high nearshore phosphorus
concentrations (up to 48 µg · L-1). While MI, like AMCI, does account for changes in macrophyte
biomass, it is based on 45 European species lumped into nine subjective indicator groups, does
not account for exotic species (M. spicatum is indicative of high nutrients but is native to
European waters) and ignores some prominent species in the Lake Simcoe community (e.g.
Vallisneria americana and Zosterella dubia).
The TRS model performed best of the three tested in terms of water column TP (r = 0.91)
and reasonably well for water clarity (r = 0.41). The adequate performance of this model may be
linked to its simplicity as it relies on species presence or absence (not accounting for biomass)
combines species into four broad trophic categories, and the final index is a mean of individual
species trophic scores.
The unreliability of these macrophyte indices as environmental indicators in Lake Simcoe
is likely related to macrophyte biomass and diversity being driven by non-nutrient variables (e.g.
depth, wave exposure, substrate stability) (suggested by Thiebault et al. 2002), and the dramatic
ecosystem changes (increased water clarity and decreased TP) following the establishment of D.
polymorpha ~1995 (which have a high filtering rate and very effective suspended particle removal
efficiency), as well as concurrent P-loading reductions as part of lake management strategies. In
addition, it should be noted that macrophytes obtain most of their phosphorus from sediments. In
Cook’s Bay, a previous study of sediment phosphorus (Johnson and Nicholls 1989) report
Lake Simcoe Region Conservation Authority 27

Aquatic Plants in Lake Simcoe
sediment TP ~ 1040 µg · g-1 compared with a (2008) mean value of 518 µg · g-1 (~300 µg · g-1 in
area of highest plant biomass in southern Cook’s Bay). This reduced sediment TP is likely the
result of macrophyte biomass increases between studies.
OVERVIEW ECOLOGICAL PROCESSES AFFECTING MACROPHYTES In Lake Simcoe, the distribution of the plant community was driven by several key
environmental variables (Figure 8). Available light and the increase in transmission through the
water column due to increased water clarity following zebra mussel (D. polymorpha) invasion
enables plants to grow deeper, thus providing more habitat for expansion and increases in plant
biomass. These changes in water clarity point to two regime shifts in Lake Simcoe as a lake with
high water clarity (7.0 m Secchi depth in 1926) (Rawson 1928) changed to the alternative
ecological state of an algal-dominated, turbid lake due to increasing P-loading by the 1970-80’s
(Secchi depth 1.0 – 4.5 m) (Eimers et al. 2005). W ith P-reduction and invasive dreissenids
resulting in less algae and suspended particles in the water column, the lake shifted to a
dreissenid-supported clearwater state which enabled increases in macrophyte depth of
colonization and areal coverage, similar to that observed in other nutrient-rich lakes in the
Laurentian Great Lakes Region with significant dreissenid populations (Scheffer et al. 1993, Zhu
et al. 2006, Scheffer and Jeppesen 2007).
In terms of substrate, plants are typically found on mud or silt substrates which hold large
amounts of bioavailable P, enable stable attachment for shallow water species (e.g. M. spicatum)
and are found in locations sheltered from wind and wave exposure. Sand and shell substrates
are found in slightly more exposed locations and have lower macrophyte biomass due to wind
and waves which can fragment large branching forms (M. spicatum), substrate movement
provides less stability for attachment, and less P is contained in sediment. Cobble, boulder, and
hard substrates have the least plant biomass due to little attachment (except my aquatic moss)
and have the highest amount of physical exposure.
.
Lake Simcoe Region Conservation Authority 28

Aquatic Plants in Lake Simcoe
Figure 8. Conceptual diagram illustrating how aquatic plant distribution in Lake Simcoe is connected to phosphorus inputs, substrate type, available light, as well as amount of wind and wave exposure.
Lake Simcoe Region Conservation Authority 29

Aquatic Plants in Lake Simcoe
Phosphorus loading and subwatershed size have a role in influencing plant biomass in
the larger subwatershed typically have a higher percentage of cleared land (i.e. less natural
vegetative cover) and allow the release of P into receiving waters. Wetland and natural
vegetation typically retain nutrient-rich runoff, whereas hard surfaces (urban areas), cleared
terrain (agriculture, construction, and quarries) facilitate surface run-off or the uptake and
deposition of nutrient-rich dust. In addition, P from offshore areas are pulled inshore by
dreissenid beds resulting the deposition of P-rich flocs in shallow areas with soft substrates
CONCLUSIONS AND MANAGEMENT IMPLICATIONS This investigation of macrophyte community changes in a nutrient-rich, dreissenid
colonized lake presents an examination of long-term trends in macrophyte abundance and
community composition. Despite modest nutrient reductions, the increase in water clarity and a
high loading of sediment-phosphorus presents an environment which can support a large
increase in macrophyte biomass. In such cases, likely repeated in nutrient-rich lakes across the
Laurentian Great Lakes Region, macrophytes may not be sufficient bioindicators of trophic status
as they receive up to 72 % of their phosphorus requirements from sediment and as such
changing environmental conditions are not reflected in common plant-based index values.
Macrophytes are, however, an important and often criticized aspect of an aquatic ecosystem and
baseline data collected in studies such as this are vital to monitoring the progress of lake
management plans (e.g. the Lake Simcoe Protection Plan) for recovery to sustainable states.
RECOMMENDATIONS In order to assess the environmental impact of macrophytes in Lake Simcoe, and assess
critical changes, a monitoring program should include the following records: change in maximum
depth of colonization, changes in sediment nutrient concentrations, increases in plant abundance
/ biomass, critical shifts in plant distribution and species composition of the community. A full
survey of Lake Simcoe should be undertaken at five-year intervals with a sampling strategy to
target depth changes and expansion of habitat area, as well as introduction and changing role of
invasive species. In addition, seasonal sampling should be carried out a five key areas across
Lake Simcoe Region Conservation Authority 30
Aquatic Plants in Lake Simcoe
Lake Simcoe to account for seasonal /annual changes in biomass, species composition, and
invasive species.
ACKNOWLEDGEMENTS I wish to thank those who have assisted in carrying out this project: T. French, E.
O’Connor, and B. Longstaff for their helpful and insightful comments; the assistance of L.
Bennett, D. Lembcke, and R. W ilson with field sampling; and D. Campbell and M. Dennis with
kriging analysis for maps. This project was funded by Environment Canada’s Lake Simcoe
Clean-up Fund with contributions from the Lake Simcoe Region Conservation Authority, it’s
municipal partners, as well as the Lake Simcoe Conservation Foundation and it’s donors.
REFERENCES Alexander ML, W oodford MP, Hotchkiss SC. 2008. Freshwater macrophyte communities in lakes of variable landscape position and development in northern Wisconsin, U.S.A. Aquat. Bot. 88:7786.
Anderson MR, Kalff J.1988. Submerged aquatic macrophyte biomass in relation to sediment characteristics in ten temperate lakes. Freshwater Biol. 19:115-121.
Barko JW, Adams MS, Clesceri NL. 1986. Environmental factors and their consideration in the management of submersed aquatic vegetation: a review. J Aquat. Plant Manag. 24:1-10.
Carignan R, Kalff J. 1980. Phosphorus sources for aquatic weeds: water or sediments? Science 207: 987-989.
Carpenter SR, Lodge DM. 1986. Effects of submersed macrophytes on ecosystem processes. Aquat. Bot. 26:341-370.
Chambers PA, DeWreede RE, Irlandi EA, Vandermeulen H.1999. Management issues in macrophyte ecology: a Canadian perspective. Can. J Bot. 77:471-487.
Chambers PA, Kalff J. 1985. Depth distribution and biomass of submersed aquatic macrophyte communities in realation to secchi depth. Can. J Fish. Aquat. Sci. 42:701-709.
Chambers PA, Kalff J. 1987. Light and nutrients in the control of aquatic plant community structure. I. In situ experiments. J Ecol. 75:611-619.
Clayton J, Edwards T. 2006. Aquatic plants as environmental indicators of ecological condition in New Zealand lakes. Hydrobiol. 570:147-151.
Crow GE, Hellquist CB. 2000a. Aquatic and wetland plants of northeastern North America Volume 1: pteridophytes, gymnosperms, and angiosperms: dicotyledons. Madison WI: University of Wisconsin Press.
Lake Simcoe Region Conservation Authority 31

Aquatic Plants in Lake Simcoe
Crow GE, Hellquist CB. 2000b. Aquatic and wetland plants of northeastern North America Volume 2: angiosperms: monocotyledons. Madison WI: University of Wisconsin Press.
Depew DC, Houben AJ, Ozersky T, Hecky RE, Guilford SJ. 2011. Submerged aquatic vegetation in Cook’s Bay, Lake Simcoe: assessment of changes in response to increased water transparency. J Great Lakes Res. doi: 10.1016/j/jglr.2010.07.009.
Eimers MC, W inter JG, Schedier W A, Watmough SA, Nicholls KH. 2005. Recent changes and patterns in the water chemistry of Lake Simcoe. J Great Lakes Res. 31:322-332.
Evans DO, Nicholls KH, Allen YC, McMurtry MJ. 1996. Historical land use, phosphorus loading, and loss of fish habitat in Lake Simcoe, Canada. Can. J Fish Aquat. Sci. 53 (Suppl. 1):94-218.
Evans DO, Skinner AJ, Allen R, McMurtry MJ. 2011. Invasion of the zebra mussel, Dreissenia polymorpha, in Lake Simcoe. J Great Lakes Res. In press.
French TD, Chambers PA. 1996. Habitat partitioning in riverine macrophyte communities. Freshwater Biol. 36:509-520.
Hecky RE, Smith REH, Barton DR, Guildford SJ, Taylor WD, Charlton MN, Howell T. 2004. The nearshore phosphorus shunt: a consequence of ecosystem engineering by dreissenids in the Laurentian Great Lakes. Can. J Fish Aquat. Sci. 61:1285-1293.
Istvánovics V, Honti M, Kovács Á, Osztoics A. 2008. Distribution of submerged macrophytes along environmental gradients in large, shallow Lake Balaton (Hungary). Aquat. Bot. 88:317-330.
Johnson MG, Nicholls KH. 1989. Temporal and spatial variability in sediment and phosphorus loads to Lake Simcoe, Ontario. J Great Lakes Res. 15: 265-282.
Lacoul P, Freedman B. 2006. Environmental influences on aquatic plants in freshwater ecosystems. Environ. Rev. 14:89-136.
Lake Simcoe Protection Plan. Toronto: Government of Ontario; 2009
Lake Simcoe Region Conservation Authority (LSRCA). 2008. Watershed report card 2008: a report on the health of the Lake Simcoe watershed. Lake Simcoe Region Conservation Authority.
Lepš J, Šmilauer P. 2007. Multivariate analysis of ecological data using CANOCO. Cambridge: Cambridge University Press.
Lui K., Butler M, Allen M, daSliva J, Brownson B. 2008. Field guide to aquatic invasive species. Toronto: Ontario Ministry of Natural Resources.
Madsen JD, Hartleb CF, Boylen CW. 1991a. Photosynthetic characteristics of Myriophyllum spicatum and six submersed macrophyte species native to Lake George, New York. Freshwater Biol. 26:233-240.
Madsen JD, Sutherland JW, Bloomfield JA, Eichler LW, Boylen CW. 1991b. The decline of native vegetation under dense Eurasian milfoil canopies. J Aquat. Plant Manag. 29:94-99.
Melzer A. 1999. Aquatic macrophytes as tools for lake management. Hydrobiol. 395/396:181-190
Lake Simcoe Region Conservation Authority 32

Aquatic Plants in Lake Simcoe
Millard ES, Veal DM. 1971. Aquatic weed growths in Lake Simcoe. Toronto: Ontario W ater Resources Commission.
Neil JH, Kamaitas GA, Robinson GW. 1985. Aquatic plant assessment in Cook Bay, Lake Simcoe. Lake Simcoe Environmental Management Strategy. Technical Report B.4.
Neil J, Graham J, Warren J. 1991. Aquatic plants of Cook Bay, Lake Simcoe, 1987. Lake Simcoe Environmental Management Strategy. Technical Report B.4.
Newmaster SG, Harris AG, Kershaw LJ. 1997. Wetland plants of Ontario. Vancouver: Lone Pine Publishing.
Nicholls KH. 1997. A limnological basis for a Lake Simcoe phosphorus loading objective. J Great Lakes Res. 13:189-198
Nichols S, Weber S, Shaw B. 2000. A proposed aquatic plant community biotic index for Wisconsin lakes. Enviro Manag. 26:491-502.
Palmer MA, Bell SL, Butterfield I. 1992. A botanical classification of standing waters in Britain: applications for conservation and monitoring. Aquat. Conserv. Mar. Freshwater Sys. 2:125-143.
Rawson DS. 1928. Preliminary studies on the bottom fauna of Lake Simcoe, Ontario. Pub. Ontario Fish Res. Lab 36:75-102.
Scheffer M, Jeppesen E. 2007. Regime shifts in shallow lakes. Ecosystems 10:1-3.
Scheffer M, Hosper SH, Meijer M-L, Moss B, Jeppesen E. 1993. Alternative equilibria in shallow lakes. Trends in Ecol. Evol. 8:275-279.
Schneider S. 2007. Macrophyte trophic indicator values from a European perspective. Limnologica 37: 281-289.
Skubinna JP, Coon TG, Batterson TR. 1995. Increased abundance and depth of submersed macrophytes in response to decreased turbidity in Saginaw Bay, Lake Huron. J Great Lakes Res. 21:476-488.
Smith CS, Adams MS. 1986. Phosphorus transfer from sediments by Myriophyllum spicatum. Limnol. Oceanogr. 31:1312-1321.
Stantec. 2007. Aquatic macrophyte survey of Cook’s Bay, Lake Simcoe, August 2006. Ottawa: Stantec Consulting Ltd.
Stephen D, Moss B, Phillips G. 1997. Do rooted macrophytes increase sediment phosphorus release? Hydobiol. 342/343: 27-34.
Thiebault G, Guérold F, Mueller S. 2002. Are trophic and diversity indices based on macrophyte communities pertinent tools to monitor water quality? Water Research 36:3602-3610.
Vadeboncoeur Y, Vander Zanden MJ, Lodge DM. 2002. Putting the lake back together: reintegrating benthic pathways into lake food web models. BioScience 52: 44-54.
Lake Simcoe Region Conservation Authority 33
Aquatic Plants in Lake Simcoe
Winter JG, Eimers MC, Dillon PJ, Scott LD, Scheider WA, Willox CC. 2007. Phosphorus inputs to Lake Simcoe from 1990 to 2003: declines in tributary loads and observations on lake water quality. J Great Lakes Res. 33:381-396.
Winter JG, Young JD, Landre A, Stainsby E, Jarjanazi H. 2011. Changes in phytoplankton community composition from 1980 to 2007 and relationships with multiple stressors. J Great Lakes Res. doi: 10.1016/j.jglr.2010.05.002.
Zhu B, Fitzgerald DG, Mayer CM, Rudstam LG, Mills EL. 2006. Alteration of ecosystem function by zebra mussels on Oneida Lake: impacts on submerged macrophytes. Ecosystems 9:10171028.
Lake Simcoe Region Conservation Authority 34

Aquatic Plants in Lake Simcoe
Lake Simcoe Region Conservation Authority 35