Embed Size (px)
Citation preview

Aquaculture: With Special Reference to Developments in Asia.2
Aquaculture in Asia
Sena S. De SilvaNetwork of Aquaculture Centers in Asia Pacific, Bangkok, Thailand
andSchool of Life and Environmental Sciences, Deakin University, Australia
Network of Aquaculture Centres in Asia-Pacific

The topics covered
• What is aquaculture• Current production trends in Asian
aquaculture• Aquaculture practices
– Farming systems– New practices
• Constraints to aquaculture development

Asian aquaculture: historical aspects
• Aquaculture: – FAO definition
• A farming practice• Increased production through intervention in
the life cycle• Ownership of the stock
• Asia:aquaculture, in one form or the other, practiced for >2 millennia
• First publication on Aquaculture >1500 years old:

Asian aquaculture: historical aspects
• Aquaculture was practiced by boat people; perhaps the origin of cage culture practices
• Was integrated with agriculture from time immemorial– Still practiced widely– Many modern challenges
• Rice cum fish-culture equally old

Asian aquaculture: production trends• Globally, 350 species belonging to 245 are cultured
– Asia & the Pacific 204 species; 84 families– Perhaps a disadvantage
– However, about 12 species produced in excess of 1 million tonnes
– China’s dominance in production volume and value is most obvious
Leading Nations in Aquaculture Production
05
1015202530354045
China
IndiaPhilip
pinesIndon
esia
Japan
VietNam
Thailan
d
ROKBan
glades
h
Chile
Prod
uctio
n/ V
alue Production (t) Value (x 1000 US$)
Percent Contribution in Volume and Value to Global
01020304050607080
China
IndiaPhilip
pinesIndon
esia
Japan
VietNam
Thailan
d
ROKBan
glades
h
Chile
Perc
ent
Production (%) Value (%)
Drawn from FAO, 2007, based on 2004 statistics
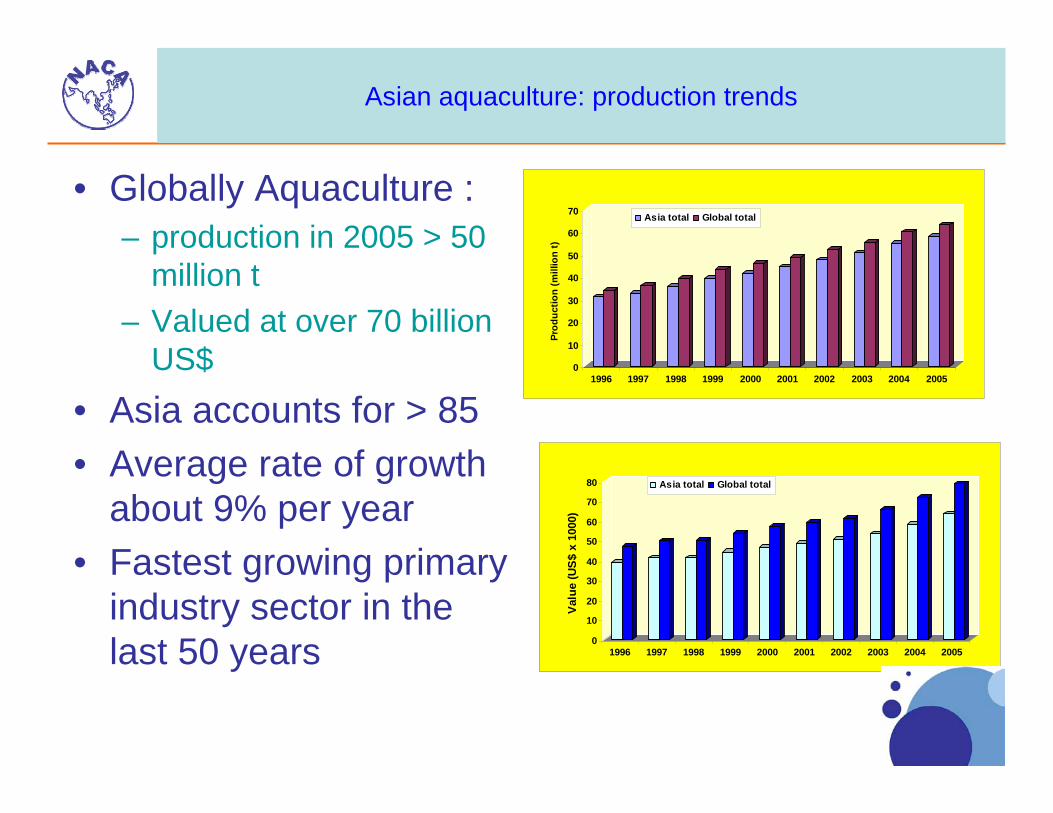
Asian aquaculture: production trends
• Globally Aquaculture :– production in 2005 > 50
million t– Valued at over 70 billion
US$• Asia accounts for > 85• Average rate of growth
about 9% per year• Fastest growing primary
industry sector in the last 50 years 0
10
20
30
40
50
60
70
80
Valu
e (U
S$ x
100
0)
1996 1997 1998 1999 2000 2001 2002 2003 2004 2005
Asia total Global total
0
10
20
30
40
50
60
70
Prod
uctio
n (m
illio
n t)
1996 1997 1998 1999 2000 2001 2002 2003 2004 2005
Asia total Global total
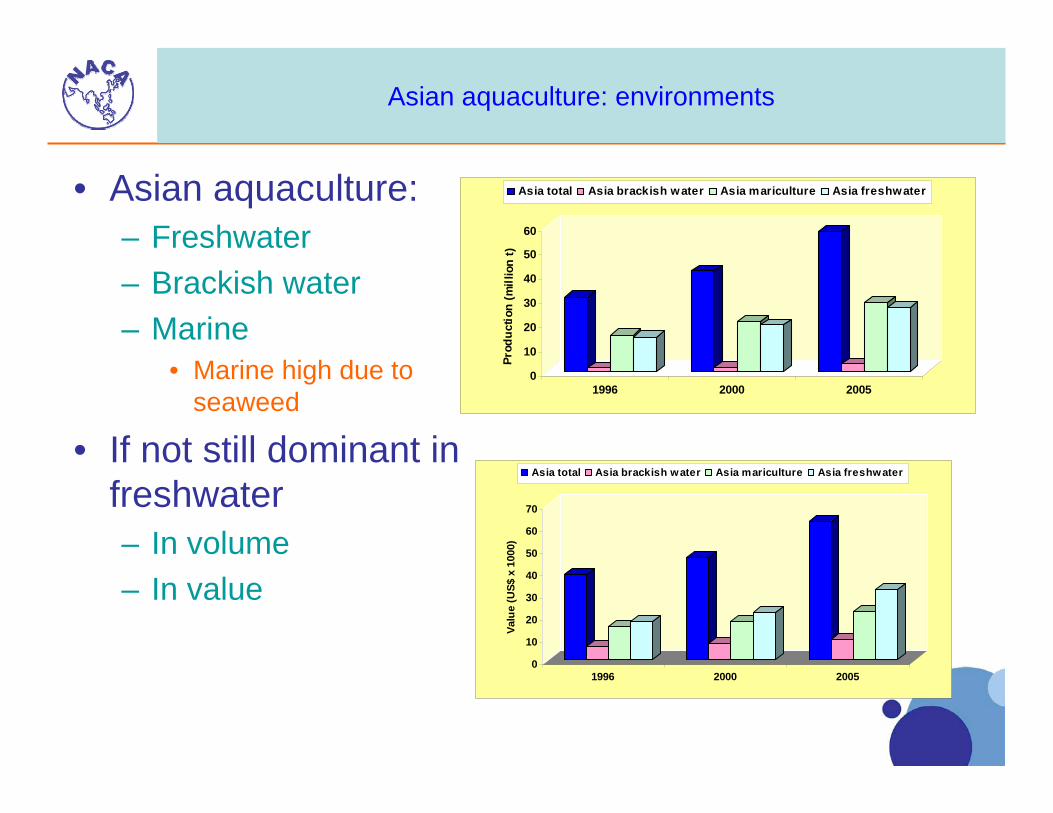
Asian aquaculture: environments
• Asian aquaculture:– Freshwater– Brackish water– Marine
• Marine high due to seaweed
• If not still dominant in freshwater– In volume– In value
0
10
20
30
40
50
60
Prod
uctio
n (m
il lio
n t)
1996 2000 2005
Asia total Asia brackish water Asia mariculture Asia freshwater
0
10
20
30
40
50
60
70Va
lue
(US$
x 1
000)
1996 2000 2005
Asia total Asia brackish water Asia mariculture Asia freshwater

In Asia: the main commodities
• Commodity wise– Finfish most important
• Seaweeds• Molluscs
• Almost the same production trends– Slight increase in
crustacean
0
5
10
15
20
25
30
Prod
uctio
n (t)
1996 2000 2005
Finfish Crustaceans Molluscs Seaweeds Others
Finfish47%
Crustaceans6%
Molluscs21%
Seaweeds25%
Others1%
2005
Fi nf i sh4 9 %
Cr ust a c e a ns3 %
M ol l usc s2 5 %
S e a we e ds2 3 %
Ot he r s0 %
1996

In Asia: the main commodities- Value
• Value;– Minor changes– The proportionate
contributions have remain almost unchanged
1996
Finf ish, 15,13 8 ,4 78 ,
4 9 %
C rust aceans, 9 2 5,0 10 , 3 %
M olluscs, 7,54 5,152 , 2 5%
Seaweeds, 7,0 79 ,59 7, 2 3 %
Ot hers, 6 1,9 78 , 0 %
2005
Finfish, 26,757,552,
47%
Crustaceans, 3,644,151, 6%
Molluscs, 12,355,967,
21%
Seaweeds, 14,760,825,
25%
Others, 453,987.90, 1%

Marine/ Brackish water farming systems: Production trends
• Relatively new development in Asia• Still restricted to
– a few countries in the region– a few “high valued species’
• Groupers (Epinephalus spp.)• Seabass (Lates calcarifer)• Cobia (Rachycentron canadum)• Crab fattening• Babylon culture
• Investment costs relatively high
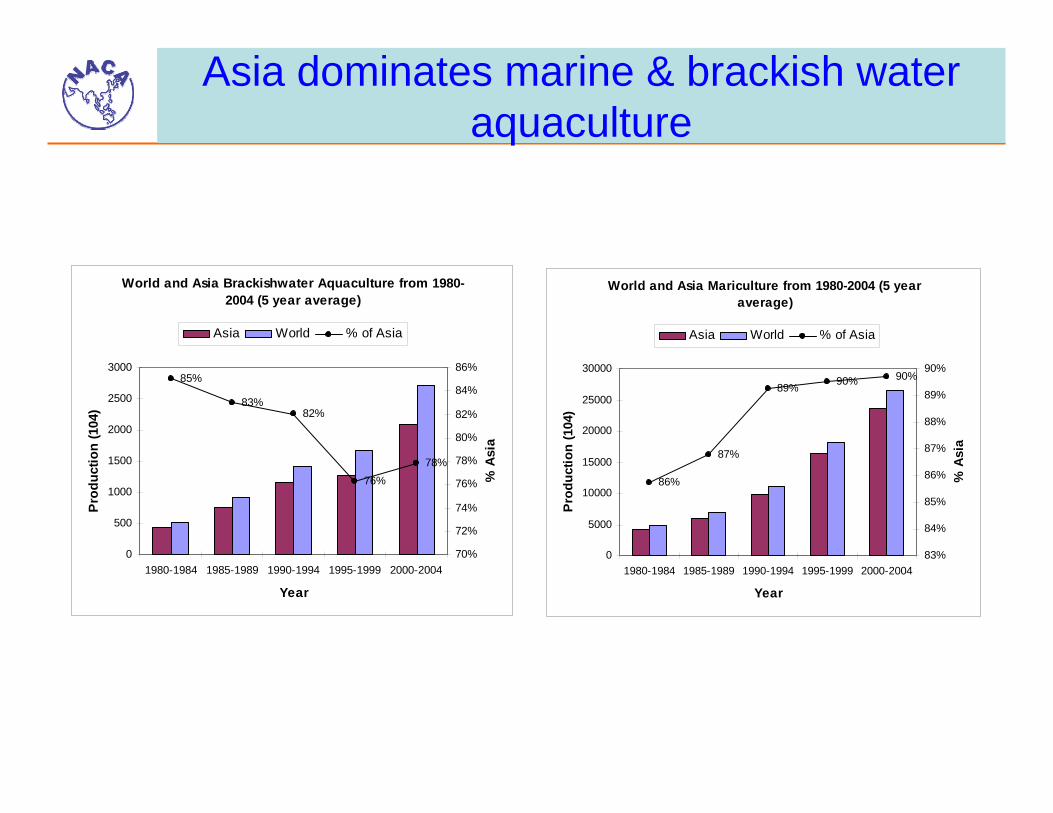
Asia dominates marine & brackish water aquaculture
World and Asia Brackishwater Aquaculture from 1980-2004 (5 year average)
85%
83%82%
76%78%
0
500
1000
1500
2000
2500
3000
1980-1984 1985-1989 1990-1994 1995-1999 2000-2004
Year
Prod
uctio
n (1
04)
70%
72%
74%
76%
78%
80%
82%
84%
86%
% A
sia
Asia World % of Asia
World and Asia Mariculture from 1980-2004 (5 year average)
86%
87%
89% 90% 90%
0
5000
10000
15000
20000
25000
30000
1980-1984 1985-1989 1990-1994 1995-1999 2000-2004
Year
Prod
uctio
n (1
04)
83%
84%
85%
86%
87%
88%
89%
90%
% A
sia
Asia World % of Asia

Marine/ Brackish water farming systems: Production trends
0
5
10
15
20
25
30
1992 1993 1994 1995 1996 1997 1998 1999 2000 2001 2002 2003 2004
Year
Prod
uctio
n (x
106 t)
0
5
10
15
20
25
Valu
e (x
109 U
S$)
Production Brackish Production Marine
Value Brackish Value Marine• Production and value of brackish & marine increased steadily
• Brackish water more value compared to production proportion

Marine/ Brackish water farming systems: Production trends
• Marine fin fish – 1.021x10⁶ t; 0.33x10⁶ t in
1992– Accounts for 38% of global
• Brackish water:– 0.713x10⁶ t; 0.393 x10⁶ in
1992– Accounts for 62% of global
• Assumptions– Marine finfish- cage– 50% of brackish w. cages;
• Total cage Asian production– 1.378x10⁶ t– 4.052 x10⁹US$
Marine
0
2000
4000
6000
8000
10000
12000
14000
1992 1993 1994 1995 1996 1997 1998 1999 2000 2001 2002 2003 2004
Year
Prod
uctio
n (x
103 t
)
0
10
20
30
40
50
60
70
80
90
100
Perc
enta
ge
Finfish CrustaceansMolluscs % Finfish% Crustaceans % Molluscs
Brackish water
0
500
1,000
1,500
2,000
2,500
1992 1993 1994 1995 1996 1997 1998 1999 2000 2001 2002 2003 2004
Year
Prod
uctio
n (x
103 t
)
0
10
20
30
40
50
60
70
80
90
100
Per
cent
age
Finfish CrustaceansMolluscs %Finfish%Crustaceans %Molluscs

Commodity groups in Asian marine & brackish water aquaculture
Asian Brackishwater and Mariculture Production by Species Group based on FAO Classification from 1980-
2004 (5 year average)
Pelagic Fish8%
Crustaceans4%
Demersal Marine Fish1%
Freshw ater & Diadromous Fish
17%
Misc Aquatic Animal
1%
Molluscs68%
Marine Fish Nei1%

Aquaculture at a glance: the farming systems
Extensive
Semi-intensive
Intensive
Continuum
SD
Natural food
External feedSusceptibility /Disease
Basic distinction :
In intensive culture all nutrition for the stock has to be provided for externally:
Management inputs
Capital lay out

Features of Asian aquaculture
• The great bulk of Asian aquaculture production
– Is through small scale, individual holdings
– Holdings clustered together • generate synergies
– Easier for dissemination of • Technologies• best management practices
XinCun Bay, PR ChinaCirata Reservoir, Indonesia Shrimp farms in Thailand
Shrimp farm size distribution in India. Total acreage 0.152 x10⁶ ha (Jyaraman, 2007)
<2ha 91%
2-5 ha 6%
>5 ha 3%

Features of Asian aquaculture 2. What is small scale?
– Difficult to define!!– Limited land or water area– Family sized operations/businesses– Often using family labor– Often based on family land– Maybe diffused through a local area– Or highly concentrated around specific resource
(e.g. water supply)– Often with limited access to technical financial and
market services

The importance of small-scale farming in Asia:
– Largest group of aquaculture farmers in Asia– Major contributor to production in many countries
• over 80% in some countries (eg Vietnam)– Therefore major contributor to global fish supplies!– Highly innovative sector– Critical for rural development, employment and poverty
reduction– Large numbers of farmers, but difficult to regulate– Individual farms not particularly impacting, when aggregated
their impact may be significant

Asian aquaculture: its future
Can Asian aquaculture grow unabated?
Or can it be sustained at the current levels?
What are the constraints?
Can these be overcome?
y = -0.3719x2 + 6.1379x + 44.466R2 = 0.8681
0
10
20
30
40
50
60
70
80
5 10 15 20
Five year blocks
Perc
ent c
hang
e

Freshwaters limited:What is the way foreword?
• Intensification– Improved management– Genetic improvement of
suitable species– Increased efficacy of farm
made feeds– More integration with animal
production– Improved marketing; better
profits– Still be low cost

Asian aquaculture: how has it reached this level?
• Increase in culture area– Freshwater– Marine (relatively new)– Brackish water
• Improved technologies– Hatchery technologies– Reduced dependence on wild caught fry
• Better quality and availability of seed stocks– Better health/ feed management– Intensification– Diversification
• Culture systems:– Cage– Pond– Pens
• Integrated farming• Rice-fish culture

Constraints to aquaculture developments:
Freshwater aquaculture
• Freshwater resources limiting;– Increases in production through
intensification– Improved
• Husbandry• Feeds• Genetically, etc.

Constraints to aquaculture developments:freshwaters: useable fw on the planet very limited
Water resources; freshwater is very limiting on earth (from Shiklomanov, 1990; Smith, 1998)
• World’s total water (1,385 ,984 ,000 km3)
saline ocean & seas97.5%
Worlds freshwater (35,029,000 km3)
Freshwater2.5% Ice caps & glaciers
76.0%
Groundwater23.5%
Surface, soil, atmosp.
Soil & surface fw lakes-54%
0.5% (94578 km3)
soil moist.38%
• World’s total water (1,385 ,984 ,000 km3)
saline ocean & seas97.5%
Worlds freshwater (35,029,000 km3)
Freshwater2.5% Ice caps & glaciers
76.0%
Groundwater23.5%
Surface, soil, atmosp.
Soil & surface fw lakes-54%
0.5% (94578 km3)
soil moist.38%
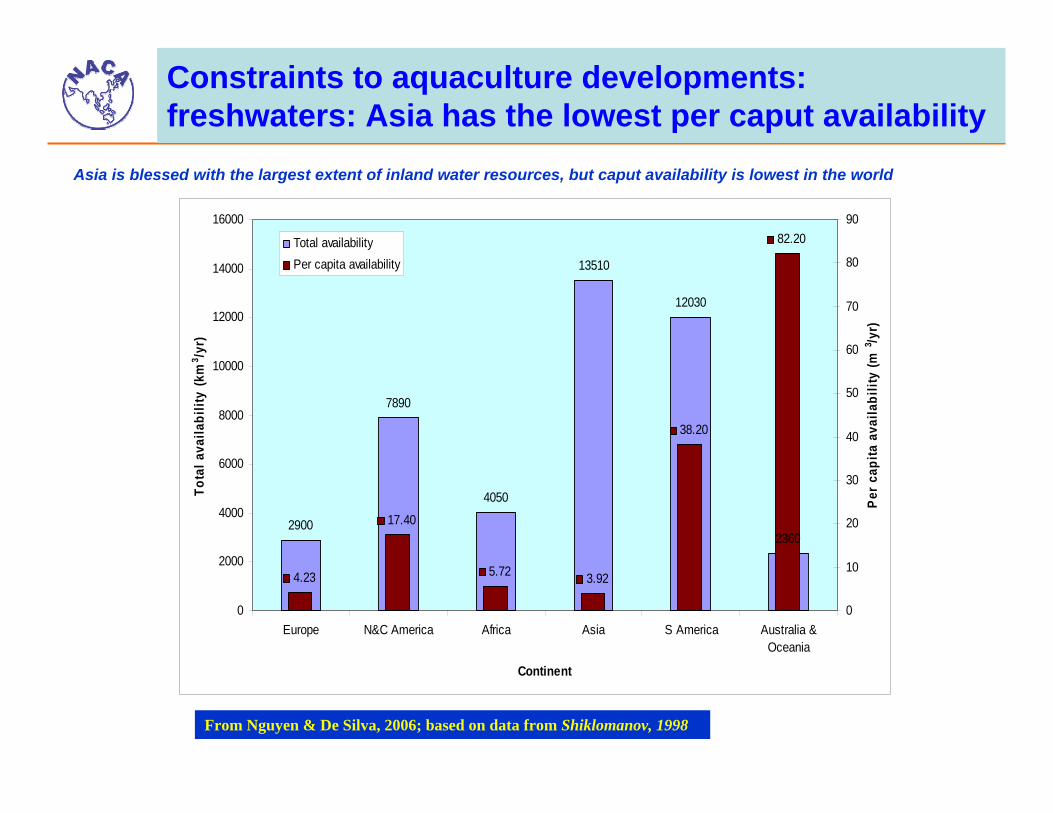
Constraints to aquaculture developments:freshwaters: Asia has the lowest per caput availability
2900
7890
4050
13510
12030
2360
4.23
17.40
5.72 3.92
38.20
82.20
0
2000
4000
6000
8000
10000
12000
14000
16000
Europe N&C America Africa Asia S America Australia &Oceania
Continent
Tota
l ava
ilabi
lity (k
m3 /y
r)
0
10
20
30
40
50
60
70
80
90
Per
cap
ita a
vaila
bilit
y (m
3 /yr)
Total availabilityPer capita availability
From Nguyen & De Silva, 2006; based on data from Shiklomanov, 1998
Asia is blessed with the largest extent of inland water resources, but caput availability is lowest in the world

300
200
100
Incr
ease
in p
rodu
ctiv
ity(%
)
1940 1950 1960 1970 1980 1990 2000
poultry
milk
pork
salmon
1945 1985
Egg production 120 egg/year 320 egg/year
Milk production 2000 l/year 5000 l/year
Adaptet from Aquagen / Eknath et al., 1999
Freshwaters limited: What is the way foreword?Genetic improvement (not specific to fw)

Intensification
• Has limits• Needs to be based on the carrying capacity of the water
body– Often exceeded
• Proneness to diseases increased• Fish kills• Conflicts with other users• Economically disastrous
Abandoned cages
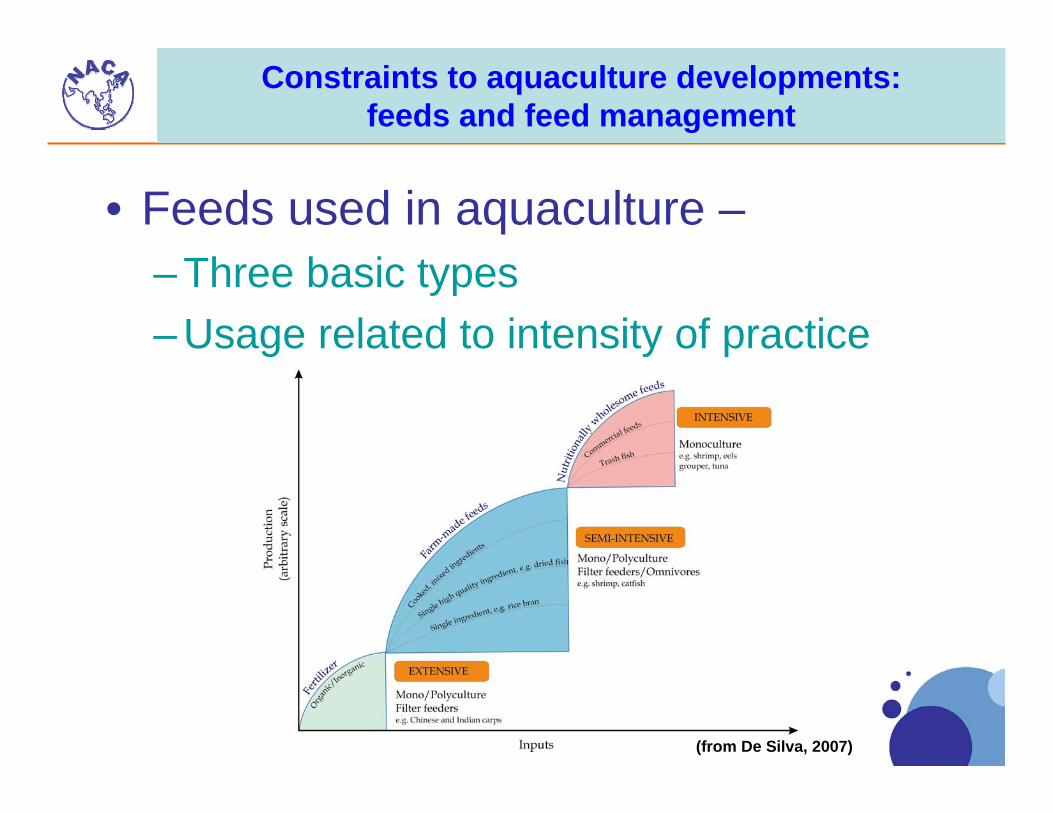
Constraints to aquaculture developments:feeds and feed management
• Feeds used in aquaculture –– Three basic types– Usage related to intensity of practice
(from De Silva, 2007)

Feeds and feed management: some generalizations
– Great bulk of carp culture e.g. India• Mix of ingredients• farm-made feeds
– Freshwater carnivores• Farm-made feeds; use trash/ low value fish
– Commercial feeds• Carps, tilapias, shrimp, brackish water fin fish
– Bulk of marine fin fish culture• trash/ low value fish

Feeds
• Commercial feeds– One main ingredient
• Fish meal/ fish oil: – finite biological resources (5 kg raw fish1 kg fish meal) – Almost a peak in traditional production– Amounts used varies from feed to feed
» Tilapia feeds on average 15-20%» Marine fish feeds on average 40-50%» Eel feeds on average 40-45%
– Global, controversial issue » Environmental» Resource limitations» Moral & ethical; Improper resource usage
• Needs to look for new alternatives

Types of feeds used
• Commercial, pelleted feeds– Marine and diadromous
species• Sea bass, grouper, milk fish
– Crustaceans• shrimp
– Freshwater species• e.g. eels, tilapias
• Farm- made feeds – Marine and brackish water
species– Extensive crustacean culture– Carp culture
• Trash fish– Marine fish
• grouper– Crustaceans
• mud crabs– Molluscs
• Babylon

Constraints to aquaculture developments:feeds and feed management
• The main bone of contention is:– Fish meal / fish oil availability/ price
• Limited resource• Ethical issues on use of a biological
resource – Animal feeds– Potential direct human consumption
• Extensive use by the aquaculture sector– Trash fish/ low value fish direct usage in
aquaculture(from De Silva, 2007)

Fish meal production: Global perspective
0
200
400
600
800
1000
1200
1400
1600
1800
1998 1999 2000 2001 2002 2003 2004
Fish
mea
l - C
hina
(x
1000
t)
Production Consumption
Global production trends (from IFFM web site)
Production and consumption in China (from GAIN report, 2005)
China currently uses18% of fish global fish meal production

Feeds: Global perspective
Aquafeeds 1994 : 963.000 tonn2003 : 2.936.000 tonn
1994 : 234.000 tonn2003 : 802.000 tonn
52,6% (2003)
86,8% (2003)

Fish meal usage - global (based on data from Pike & Barlow, 2003)
• Use of fish meal in poultry and pig industries is destined to decline
– Not because of a reduction in production volume
– But because of improved feeds - less fishmeal but equally effective
– Can the aquaculture industry achieve likewise?
2002
Aquaculture34%
Poultry27%
Pigs29%
Ruminants1%
Others9%
9
2715
2010
Aquaculture48%
Poultry15%
Pigs22%
Ruminants0%
Others15%

Fish meal usage in AsiaEstimations based on production
• Based on production values for 1990, 2000, 2004 (FAO statistics)
• Species groups considered– Crustaceans– Marine diadromous finfish
• Milk fish• Freshwater fish
– Catfish– Cichlids– Anguillids
• Different criteria– % production based on fish
feeds – Amount of fish meal in feeds– CE
0
500,000
1,000,000
1,500,000
2,000,000
2,500,000
Fish
mea
l usa
ge in
feed
s in
Asi
a (t)
1990 2000 2004 2010/a 2010/b 2010/c
2010/a - 10% increase in production from 2004 level
2010/b - 15% increase in production from 2004 level
2010/c - 20% increase in production from 2004 level

Fish oil usage - global (based on data from Pike & Barlow, 2003)
2010
2002
95
2 1 2
2010
56
2
30
12
Aquaculture Industrial Edible Pharmaceutical
79
2
14
5

Fish meal usage in Asian aquaculture
• Asia uses nearly 84% of fishmeal that is globally used in aquaculture
• But Asia produces only about 17%
• Silver lining– FM usage is
expected to decline in spite of production increases
– Is this decline sufficient to attain long term sustainability?
– What is needed to be done?
0
1,000,000
2,000,000
3,000,000
4,000,000
5,000,000
6,000,000
7,000,000
Fish
mea
l (to
nnes
)
Production Usage/Aquac. % Usage
World Asia
0
500,000
1,000,000
1,500,000
2,000,000
2,500,000
Fish
mea
l usa
ge in
feed
s in
Asi
a (t)
1990 2000 2004 2010/a 2010/b 2010/c

Trash fish/ low valued species used in Asian aquaculture:single species/ mixed specious lots
Atule spp.
Nemipterus sppSardinella spp
Selar spp
Rasterlliger spp.
Mixed spp

Trash fish usage in Asian aquaculture
• The term trash fish/ low value used rather loosely• Often fish destined for human consumption is used as trash fish;
– even bought from the normal market in some small scale mariculture practices
• Trash fish usage increased with increased mariculture activities• Primarily used for species such as grouper, seabass (also for catfish
culture - Vietnam)• Estimated use of trash fish in Asian aquaculture about 2 to 3x10⁶ t
year-1

Trash fish usage in Asian aquaculture: the need for level playing field-globally
Schematic diagram indicating the different channels of usage of fish as feed in the
Asia- Pacific region
Indirect(Trash fish fishery)
Direct
Farm made feedsCommercial feeds
Processed Forms
Raw materials (10.3 m.t.)
Fish meal(2.4 m.t.)
Fish oil(tonnage usage?)
Raw Forms
Live e.g. Chinese
Mandarin fish(676,000 t)
Used for Human Food Production
By-catchesTrash fish / low
valued fish(2.167-3.862 m.t.)
May be suitable for human consumption
Unsuitable for humanconsumption
Fish as Feed
Pet Food Industry
Cat feed(2.319 m.t.)
Fish meal ?
Gourmet feeds?

Trash fish usage- also need fro a global level playing field
The proportion of global trash fish/ low valued fish by different sectors (from De
Silva et al., 2007b)
Aquaculture 44.8%(4 million t as raw fish and 13.4 million
tonne reduced into fish meal)
Poultry 22.5%(8.8 million t reduced into fish meal)
Pigs 18.4%(7.1 million t reduced into fish meal)
Ruminants 0.8%(0.3 million t reduced into fish meal)
Domestic cats 6.0%(2.3 million t as raw fish )
Others (fur animal and pet) 7.5%(2.9 million t reduced into fish meal)
260.1 million t of meat, 626.4 million t of milk and 63.3 million t of eggs, produced globally
32.2 million t of finfish and crustaceans
produced by aquaculture globally
5.2 million t of wild catch fish exploited for
hedonist needs satisfaction
Animal protein ashuman food
13.2 million t of molluscs produced by aquaculture globally
56.1 million t of wild finfish, crustaceans and
molluscs caught globally used for human
consumption
38.9 million t of wild catch fish globally not directly exploited as
human food

Trash fish usage in Asian aquaculture
• Trash fish used mostly due to:– Farmer perception that it is more
effective– Pellet feeds more costlier
• Ignores the fact that CE – 8-16:1 with trash fish – 1.5 to 1.7 with pellet feeds
• Needs farmer education• A step wise transformation to pellet
feeds– Trash fish + ingredients; farm made
feed– Wean gradually to pellet feed– Demonstration units
– Often farmers collect their own trash fish

Trash fish usage in Asian aquaculture
• Trash fish many disadvantages– Availability highly seasonal– Quality variable– Very low conversion
efficiency• Nutrient discharge to the
environment greater– High wastage
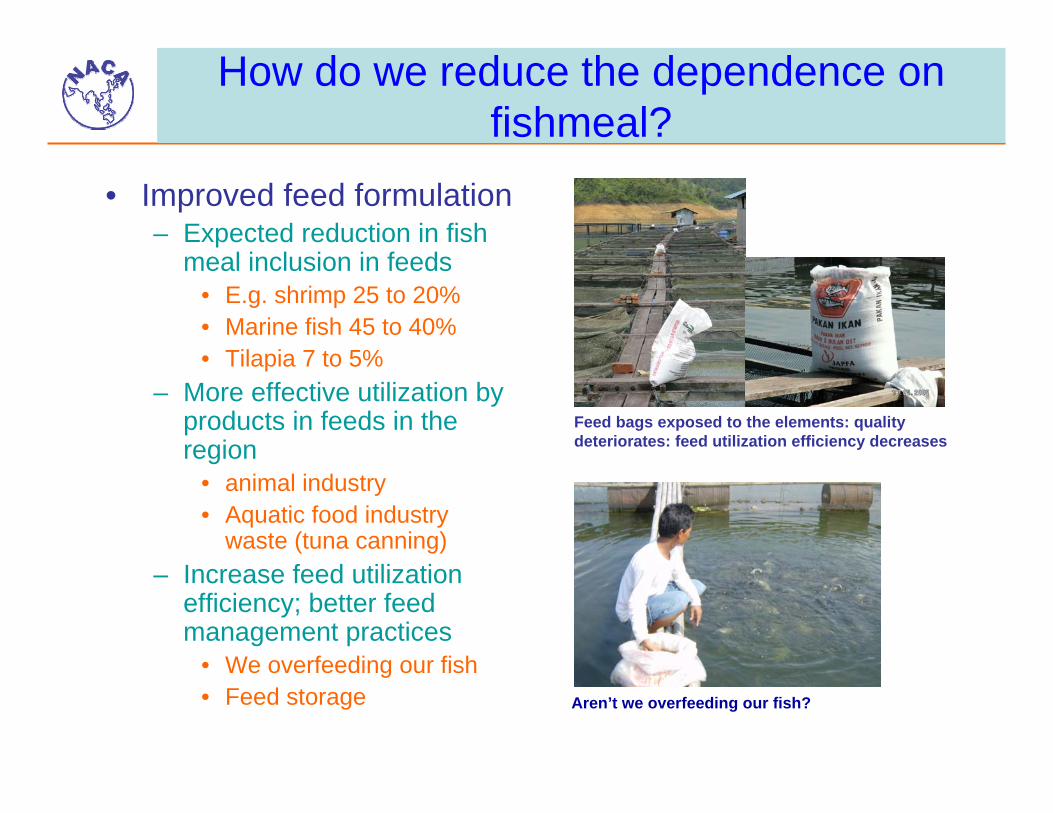
How do we reduce the dependence on fishmeal?
• Improved feed formulation– Expected reduction in fish
meal inclusion in feeds• E.g. shrimp 25 to 20%• Marine fish 45 to 40%• Tilapia 7 to 5%
– More effective utilization by products in feeds in the region
• animal industry• Aquatic food industry
waste (tuna canning)– Increase feed utilization
efficiency; better feed management practices
• We overfeeding our fish• Feed storage
Feed bags exposed to the elements: quality deteriorates: feed utilization efficiency decreases
Aren’t we overfeeding our fish?

Feed utilization
• The key nutrients utilized for growth is rather small
• Needs to increase the utilization of nitrogen, provided in the form of protein, in particular
• Also increase the utilization of phosphorous
• Increased utilization results in– Better growth and higher profits– Decrease discharge of these
elements– Reduces negative impacts on
water quality
We do not wish to see fish kills and / or red tides

Feeds – EnvironmentSource and fate of nutrients in aquaculture - feed utilization
Nutrients in feed
(N and P)
Body tissues
Gill excretion (N)
Assimilated
Faeces
Correct size
Fines/dust Uneaten food
Consumed
Dissolved Nutrients (N and P)Particulate matter (N and P)
The Environment

Feeds-Environment: Food utilization in cage culture
Particulate fraction (13%)
Food Production (25%)
Dissolved fraction (62%)
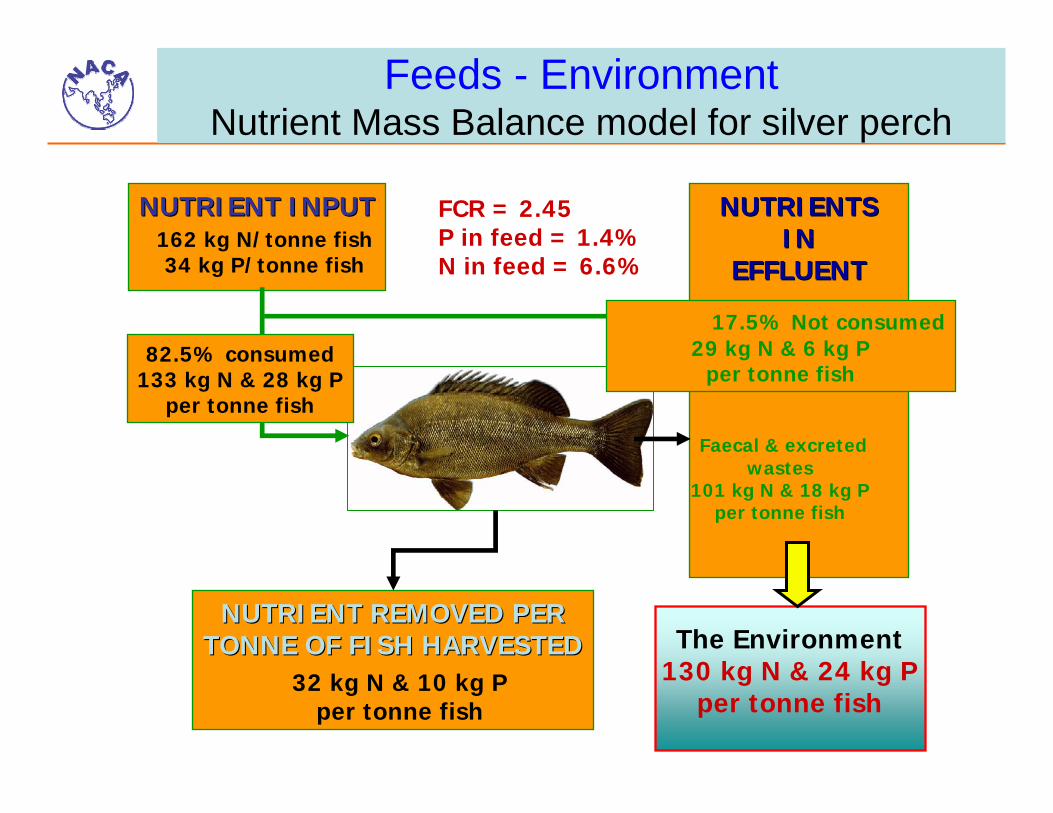
Feeds - EnvironmentNutrient Mass Balance model for silver perch
NUTRIENT INPUTNUTRIENT INPUT NUTRIENTS NUTRIENTS ININ
EFFLUENTEFFLUENT
NUTRIENT REMOVED PERNUTRIENT REMOVED PERTONNE OF FISH HARVESTEDTONNE OF FISH HARVESTED
FCR = 2.45P in feed = 1.4%N in feed = 6.6%
162 kg N/tonne fish34 kg P/tonne fish
17.5% Not consumed29 kg N & 6 kg P
per tonne fish82.5% consumed
133 kg N & 28 kg Pper tonne fish
Faecal & excretedwastes
101 kg N & 18 kg Pper tonne fish
32 kg N & 10 kg Pper tonne fish
The Environment130 kg N & 24 kg P
per tonne fish
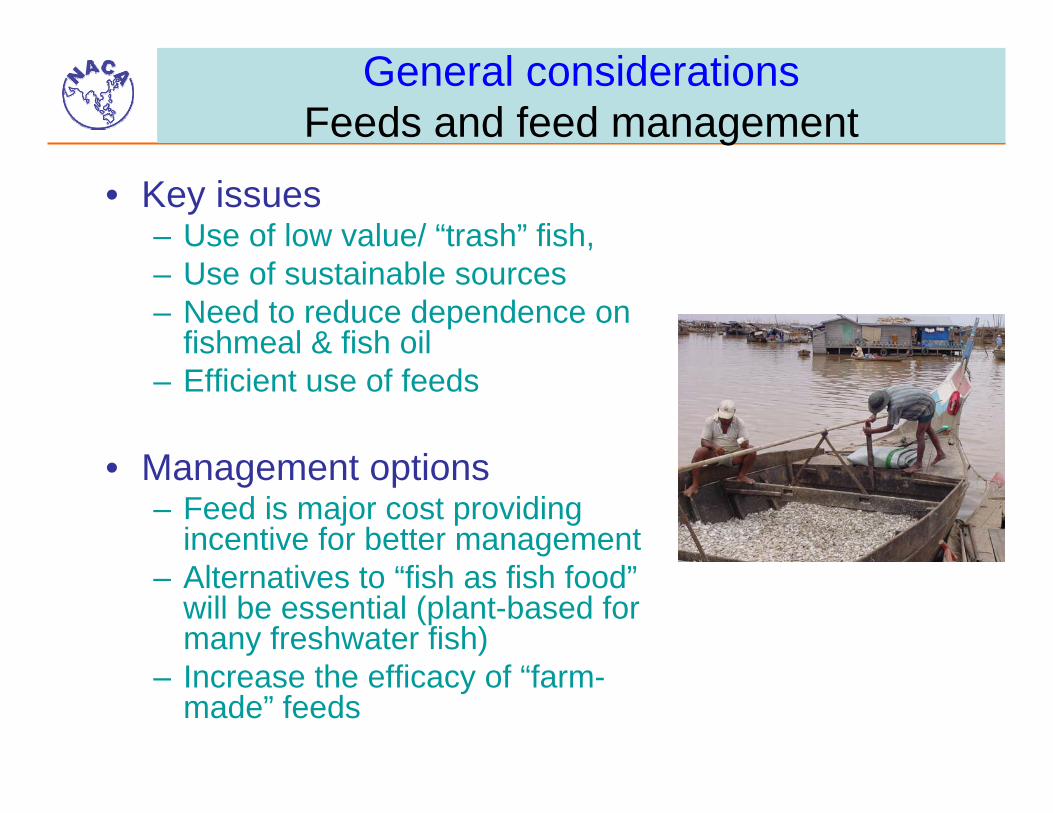
General considerationsFeeds and feed management
• Key issues – Use of low value/ “trash” fish, – Use of sustainable sources– Need to reduce dependence on
fishmeal & fish oil– Efficient use of feeds
• Management options – Feed is major cost providing
incentive for better management– Alternatives to “fish as fish food”
will be essential (plant-based for many freshwater fish)
– Increase the efficacy of “farm-made” feeds
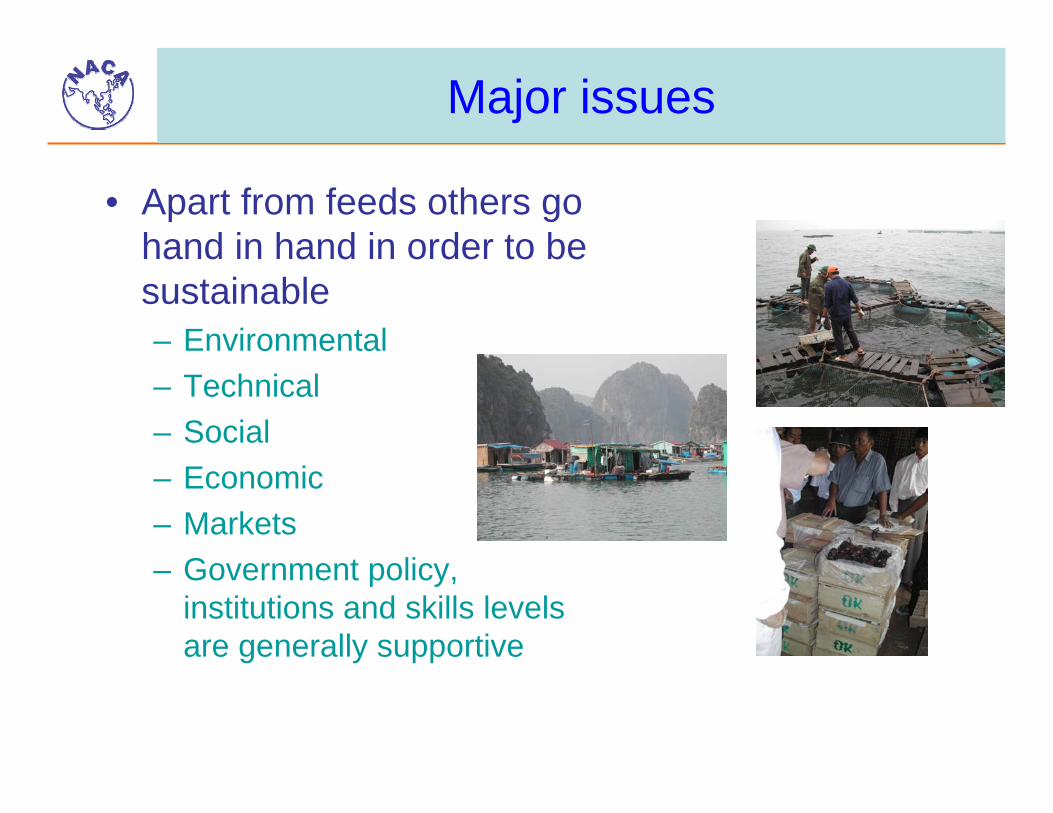
Major issues
• Apart from feeds others go hand in hand in order to be sustainable– Environmental– Technical– Social– Economic– Markets– Government policy,
institutions and skills levels are generally supportive

General considerations: Species selection, movements
• Key issues – species selection/suitability
to local environment,– exotics,– trans-boundary movements, – use of wild fry, – ecological impacts of
introductions/escapes• Management options
– Gov’t control on introductions/movements (partial success)
– Responsible and awareness of business sector

General considerationsHabitats, sitting, location
• Key issues – Impacts on habitats, other
aquaculture farms– Resource users– Suitable sites
• Management options– Site selection, licensing– Zoning of suitable areas– Common practice, sometimes
difficult (skills/management required)
– Many on-farm management options
– Vast potential for improvement

General considerationsMain Lessons
• Coastal aquaculture contributes to fish production and continues to grow– General reasons:
• Market demand (and driven)• Government policy support• Input resources (feed, seed, water
areas, finance available etc)• Economics and profit• Skills/Technical support
– Lessons:• Coastal aquaculture is
“vulnerable”• Successes and failures• Management actions by Govt and
private sector can reduce risk• “Balanced” approach essential
considering all fish production systems and users

When we have such good fish why go for alien species?

www.enaca.org